119–126
The Centre of M83
Abstract
Stellar kinematics show no evidence of hidden mass concentrations at the centre of M83. We show the clearest evidence yet of an age gradient along the starburst arc and interpret the arc to have formed from orbital motion away from a starforming region in the dust lane.
keywords:
galaxies: star clusters, galaxies: individual (M83), galaxies: spiral1 Introduction
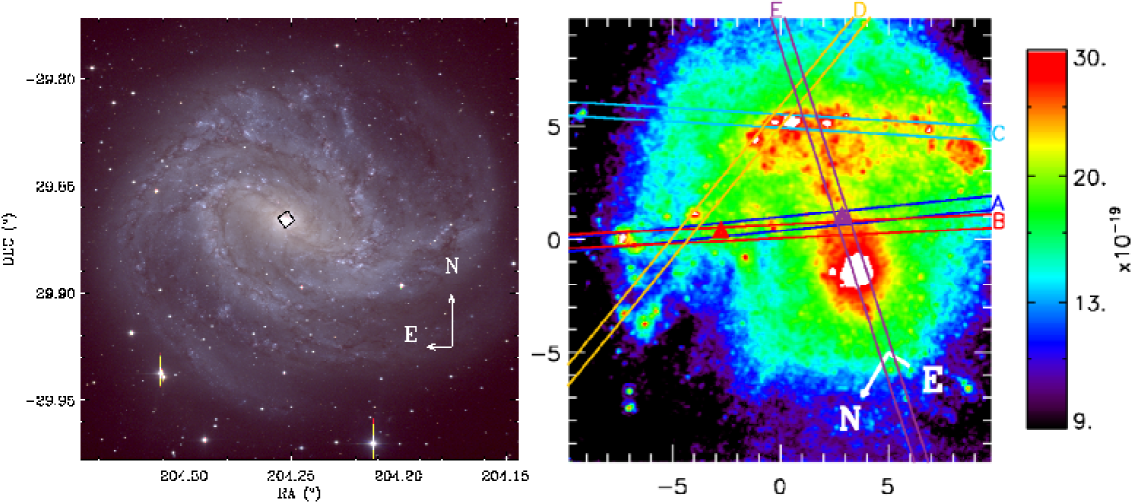
The nucleus of M83 is offset from the bulge centre and surrounded by a semicircular starburst arc (Fig. 1). Harris et al. (2001, hereafter H01) dated the star clusters in the arc with WFPC2 photometry and found evidence of an age gradients along it. However, the reddening vector parallelled the tracks in the two-colour diagram and clusters may be overlooked or poorly sampled in the visible because of extinction. Thatte et al. (2000, hereafter T00) proposed the existence of a second mass concentration after NIR long-slit kinematics revealed an additional peak in the velocity dispersion, 2.7′′ SW of the nucleus. Further studies with IFUs linked velocity gradients in gas kinematics to hidden mass concentrations at different locations: Mast et al. (2006) report a gradient in H at 3905 W of the nucleus while Diaz et al. (2006a; 2006b, hereafter D06a and D06b) report a gradient in Pa 7′′ WNW of the nucleus. However, gas kinematics are known to suffer non-gravitational effects (Kormendy & Richstone, 1995).
We have analysed new VLT ISAAC K band long-slit spectroscopy together with archival HST data (Pa from NICMOS and H from WFPC2). Fig. 1 illustrates slit positions on the HST data. The combined data gives equivalent width (EW) measurements of H, Pa and CO (2.3m), as well as stellar and gas kinematics.
2 Results
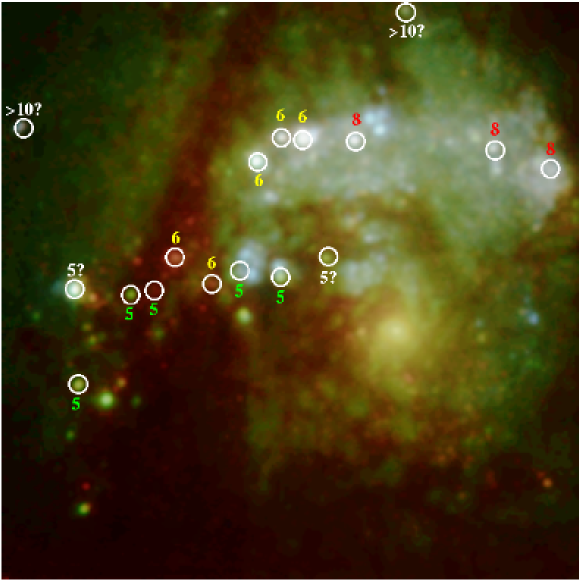
To date the star clusters, we use the EWs of the CO bandhead and the H and Pa emission. We applied Calzetti’s extinction law (Calzetti, 2001) to correct the H and Pa EWs. Instantaneous SSP models (Leitherer et al., 1999, hereafter SB99) for H, Pa and CO were incompatible with the data for individual clusters and we investigated the subsequent evolution of a finite episode of star formation by convolving SSP model fluxes with a top hat kernel; we found an episode of 6 Myrs fits the data and gives the clearest evidence yet of an age gradient along the arc (Fig. 2).
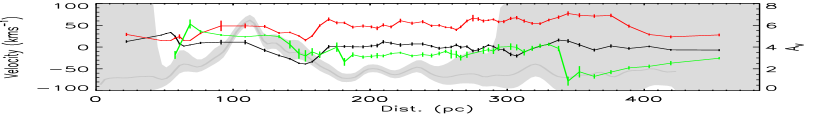
We see a gradient in the H2 (2-1 S(1)) gas velocity at the same vicinity as D06a report a gradient in Pa (Fig. 3). However, the stellar velocity dispersion shows no peak indicative of a mass concentration; we therefore attribute the gradients to a shock on the inner edge of dust lane, as predicted by Athanassoula (1992). At the position reported by T00, we also see no clear evidence of a dispersion peak along Slit A.
Athanassoula (1992) showed that dust-lanes in bars are a consequence of gas on x1 orbits shocking and falling onto x2 orbits. Star formation in the dust lane would usually be opposed due to the shear forces in action along the shocks but we observe the shock front (located by the velocity gradient in the gas) on the inner edge of the dust lane. On the outer edge, away from the shock front, where there is likely to be spurs and feathering (Bonnell et al., 2006), star formation may be less opposed. Star clusters formed here would fall onto x2 orbits to produce the ‘star forming arc’ and the age gradient.

References
- Athanassoula (1992) Athanassoula E., 1992, MNRAS, 259, 345
- Bonnell et al. (2006) Bonnell I. A., Dobbs C. L., Robitaille T. P., Pringle J. E., 2006, MNRAS, 365, 37
- Calzetti (2001) Calzetti D., 2001, PASP, 113, 1449
- Díaz et al. (2006b) Díaz R. J., Dottori H., Aguero M. P., Mediavilla E., Rodrigues I., Mast D., 2006b, ApJ, 652, 1122
- Diaz et al. (2006a) Diaz R. J., Dottori H., Mediavilla E., Aguero M., Mast D., 2006a, New Astronomy Review, 49, 547
- Harris et al. (2001) Harris J., Calzetti D., Gallagher III J. S., Conselice C. J., Smith D. A., 2001, AJ, 122, 3046
- Kormendy & Richstone (1995) Kormendy J., Richstone D., 1995, ARA&A, 33, 581
- Larsen & Richtler (1999) Larsen S. S., Richtler T., 1999, A&A, 345, 59
- Leitherer et al. (1999) Leitherer C., Schaerer D., Goldader J. D., Delgado R. M. G., Robert C., Kune D. F., de Mello D. F., Devost D., Heckman T. M., 1999, ApJS, 123, 3
- Mast et al. (2006) Mast D., Díaz R. J., Agüero M. P., 2006, AJ, 131, 1394
- Thatte et al. (2000) Thatte N., Tecza M., Genzel R., 2000, A&A, 364, L47