FUV Spectroscopy of the sdOB Primary of the Eclipsing Binary System AA Dor
Abstract
AA Dor is an eclipsing, close, post common-envelope binary (PCEB). We present a detailed spectral analysis of its sdOB primary star based on observations obtained with the Far Ultraviolet Spectroscopic Explorer (FUSE). Due to a strong contamination by interstellar absorption, we had to model both, the stellar spectrum as well as the interstellar line absorption in order to reproduce the FUV observation well and to determine the photospheric parameters precisely.
1Institute for Astronomy and Astrophysic,
Kepler Center for Astro and Particle Physics,
Eberhard Karls University, Tübingen, Germany
2Department of Physics and Astronomy, Johns Hopkins University, Baltimore, MD 21218, USA
1. Introduction
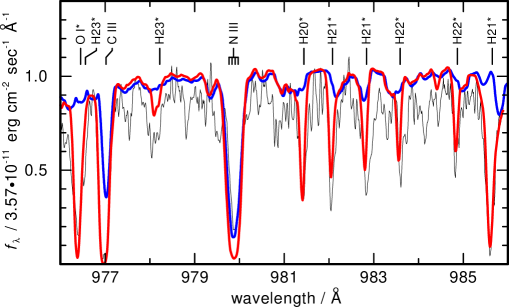
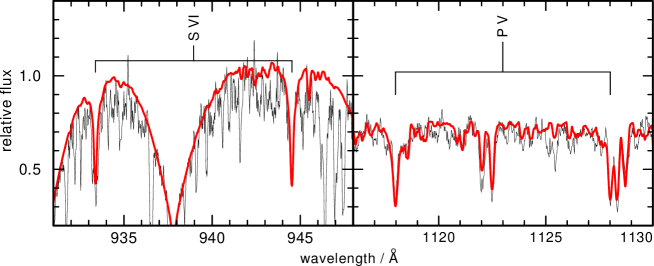
The eclipsing binary system AA Dor consists of a sdOB with and an unseen low-mass companion. Recent studies of its primary star have shown discrepancies in the determination of the surface gravity . Rauch (2000) obtained by a NLTE spectral analysis of optical and ultraviolet data. The results of radial-velocity and lightcurve analyses by Hilditch et al. (1996, 2003) indicate a higher value of . Twelve high S/N-ratio FUSE observations were performed in August 2003 and June 2004. With about 200 secs each, the exposure times were chosen short in order to reduce the smearing by orbital motion. The FUV range includes the hydrogen Lyman series which in general is sensitive to changes in . However, a precise determination of the surface gravity and further stellar parameters is hampered by strong interstellar absorption lines. We used our NLTE code TMAP (Tübingen Model Atmosphere Package, Werner et al. 2003) to calculate plane-parallel, line-blanketed model atmospheres in radiative, hydrostatic and statistical equilibrium. We included calcium and all elements of the iron group (Sc, Ti, V, Cr, Mn, Fe, Co, Ni) into our calculations. Due to the large amount of transitions, those elements were treated in a statistical approach (Rauch & Deetjen 2003). Atomic data were taken from NIST (National Institute of Standards and Technology, http://physics.nist.gov), the Opacity Project (Seaton et al. 1994), and the Iron Project (Hummer et al. 1993). In case of the iron-group elements, energy levels and oscillator strengths stem from Kurucz’s line lists (Kurucz 1991). Only weak lines of those elements are detected in the FUSE spectra, which form absorption troughs due to rotational broadening (Fig. 1).
2. Conclusions
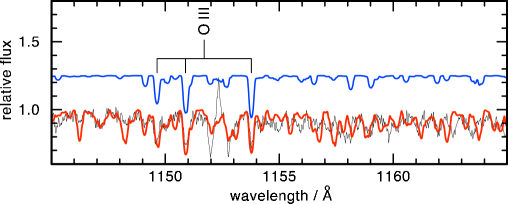
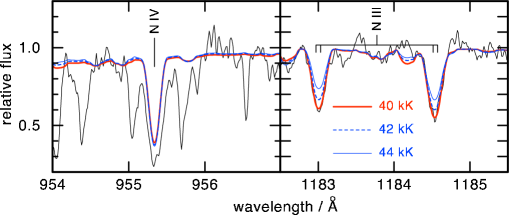
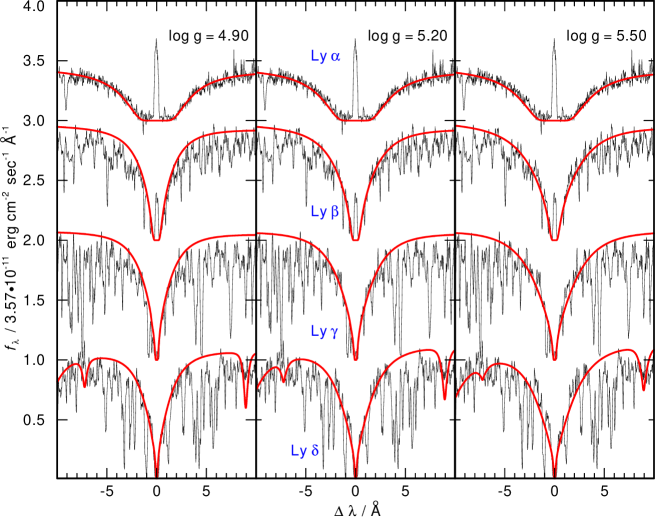
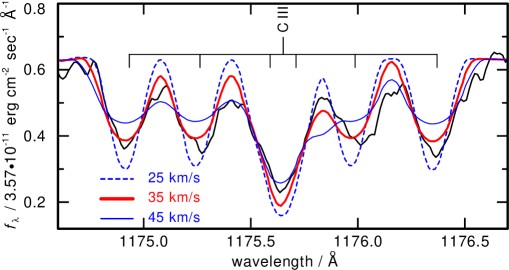
The effective temperature was derived using the ionization equilibrium of N III and N IV. The best fit is achieved for (Fig. 2). Due to the interstellar contamination of the spectra (Fig. 3), a precise determination of the surface gravity was not possible (Fig. 4). However, a hint towards a higher value of is given by the rotational velocity of the primary (Fig. 5). With , the primary rotates slower than bound (). Rauch (2000) assumed bound rotation for the calculation of the primary’s spectrum and thus, one can expect a slightly higher value of . Calculating the surface gravity directly via , , returns a surface gravity of 5.44, which is in agreement with the value found by Hilditch et al. (2003).
Acknowledgments.
T.R. is supported by the German Astrophysical Virtual Observatory project of the German Federal Ministry of Education and Research (BMBF) under grant 05 AC6VTB. This work has been done using the profile fitting procedure Owens developed by M. Lemoine and the FUSE French Team.
References
- Hilditch et al. (1996) Hilditch, R. W., Harries, T. J., & Hill, G. 1996, MNRAS, 279, 1380
- Hilditch et al. (2003) Hilditch, R. W., Kilkenny, D., Lynas-Gray, A. E., & Hill, G. 2003, MNRAS, 344, 644
- Hummer et al. (1993) Hummer, D. G., Berrington, K. A., Eissner, W., Pradhan, A. K., Saraph, H. E., & Tully, J. A. 1993, A&A, 279, 298
- Kurucz (1991) Kurucz, R. L. 1991, in: Stellar Atmospheres - Beyond Classical Models, NATO ASIC Proc. 341, 441
- Lemoine et al. (2002) Lemoine, M., et al. 2002, ApJS, 140, 67
- Rauch (2000) Rauch, T. 2000, A&A, 356, 665
- Rauch & Deetjen (2003) Rauch, T., & Deetjen, J. L., 2003, ASPC 288, 103
- Seaton et al. (1994) Seaton, M. J., Yan, Y., Mihalas, D., & Pradhan, A. K. 1994, MNRAS, 266, 805
- Werner et al. (2003) Werner, K., Deetjen, J. L., Dreizler, S., Nagel, T., Rauch, T., & Schuh, S. L. 2003, ASP Conf. Ser. 288: Stellar Atmosphere Modeling, 288, 31