Neutronization During Type Ia Supernova Simmering
Abstract
Prior to the incineration of a white dwarf (WD) that makes a Type Ia supernova (SN Ia), the star “simmers” for years in a convecting, carbon burning region. We have found that weak interactions during this time increase the neutron excess by an amount that depends on the total quantity of carbon burned prior to the explosion. This contribution is in addition to the metallicity () dependent neutronization through the 22Ne abundance (as studied by Timmes, Brown, & Truran). The main consequence is that we expect a “floor” to the level of neutronization that dominates over the metallicity contribution when , and it can be important for even larger metallicities if substantial energy is lost to neutrinos via the convective Urca process. This would mask any correlations between SN Ia properties and galactic environments at low metallicities. In addition, we show that recent observations of the dependences of SNe Ia on galactic environments make it clear that metallicity alone cannot provide for the full observed diversity of events.
Subject headings:
nuclear reactions, nucleosynthesis, abundances — supernovae: general — white dwarfs1. Introduction
The use of Type Ia supernovae (SNe Ia) as cosmological distance indicators has intensified the need to understand white dwarf (WD) explosions. Of particular importance is the origin of the Phillips relation (Phillips et al., 1999), an essential luminosity calibrator. Recent models demonstrate that it can be explained by large variations in the abundance of stable iron group elements (Woosley et al., 2007) with the dominant cause for diversity likely residing in the explosion mechanism (Mazzali et al., 2007).
One additional variable is the metallicity of the WD core, which yields excess neutrons relative to protons due to the isotope 22Ne. This is usually expressed as
| (1) |
where and are the nucleon number and charge of species with mass fraction . The neutronization is critical for setting the production of the neutron-rich isotopes (Thielemann et al., 1986). If no weak interactions occur during the explosion, the mass fraction of 56Ni produced is simply , assuming 56Ni and 58Ni are the only burning products (Timmes et al., 2003). The neutronization also affects the explosive burning, including the laminar flame speed (Chamulak et al., 2007a). However, the metallicity range of progenitors is not large enough to account for the full SNe Ia diversity (see §4), making it critical to explore all factors that determine .
A potential neutronization site is the convective carbon burning core that is active for prior to the explosion. The hydrostatic evolution associated with this simmering phase terminates when the core temperature is sufficiently high that burning is dynamical (Nomoto et al., 1984; Woosley & Weaver, 1986; Woosley et al., 2004; Wunsch & Woosley, 2004; Kuhlen et al., 2006), and a flame commences (Timmes & Woosley, 1992). We show here that protons from the 12C(12C,)23Na reaction during simmering capture on 12C, and that subsequent electron captures on 13N and 23Na decrease . This process continues until either the explosion occurs or sufficient heavy elements have been synthesized that they capture the protons instead.
In §2, we present simmering WD core models and summarize the reaction chains that alter . We find that one proton is converted to a neutron for each six 12C nuclei consumed for burning at . At densities above this, an additional conversion occurs from an electron capture on 23Na. Hence, the in the core depends on the amount of carbon burned during simmering and the density at which it occurs, which we quantify in §3. We find that neutronization during simmering dominates for metallicities . We conclude in §4 by discussing the observations and noting where future work is needed.
2. Neutron Production During Simmering
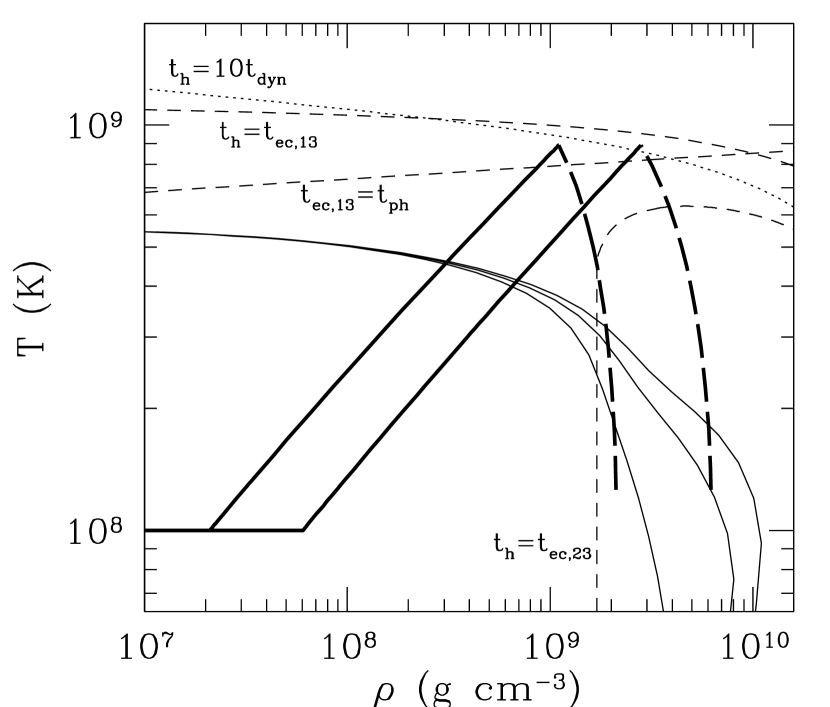
Thermally unstable burning begins when the energy generation rate from carbon fusion, , exceeds neutrino cooling (Nomoto et al., 1984). The thin solid lines in Figure 1 show the range of ignition curves for CO (Yakovlev et al., 2006) with the middle line the nominal current best. The carbon fuses via 12CCNa and 12CCNe with branching ratios of and , respectively. At “early” times the liberated protons capture onto 12C, while at “late” times enough heavy elements (23Na or 23Ne) have been produced that they capture the protons instead.
We treat the evolution during the simmering phase as a series of hydrostatic models consisting of an adiabatic convective core and an isothermal surface at . As long as the convection zone is well described as an adiabat this is sufficient for resolving the thermal structure without the need to explicitly solve the energy transfer equation. These assumptions become weaker once the central temperature is , so that burning occurs sufficiently quickly that there is considerable energy generation within a convective eddy overturn timescale (Garcia-Senz & Woosley, 1995). The energy generation does come into play because it sets the heating timescale, , where is the specific heat of the liquid ions (we use linear mixing and the Coulomb energy from Chabrier & Potekhin 1998), nearly given by the classical Dulong-Petit law , where is the ion mean molecular weight. Since we evaluate using the central conditions it is a lower limit since it should include the entire heat capacity of the convective region (Piro & Chang 2007; see related discussion for neutron stars in Weinberg et al. 2006). In this way, for a given thermal profile there is a well-defined heating timescale, which connects our stationary models to the true time evolution. The thick dashed lines in Figure 1 trace out the trajectory of the central temperature, , and density, , for and (left and right, respectively), both using compositions of C, O, and Ne. These indicate that decreases with increasing (Lesaffre et al., 2006; Piro, 2007). The thick solid lines show thermal profiles near the end of the simmering.
The simmering phase ends when sub-sonic convection can no longer transport the heat outwards because the timescale of heating is now less than the convective overturn timescale. Since the overturn timescale depends on the integrated energy generation rate near the WD center (while we desire a local measure of when convection should end for simplicity), we assume that this occurs when , the dynamical timescale. This gives reasonable agreement to other more careful calculations that find the simmering phase ends when (Woosley et al., 2004). We plot as a dotted line in Figure 1 to indicate where simmering ends, since the strong temperature sensitivity of 12C fusion makes this line rather insensitive to the choice of prefactor. If the simmering phase ends earlier, it can be considered in the context of our models by just truncating our results at a slightly lower .
2.1. Main Reaction Cycle at Early Times
At early times, only 12C, 16O, or 22Ne are potential proton capture nuclei. We compared these rates using Caughlan & Fowler (1988), including strong screening (Salpeter & van Horn, 1969). The 16OF reaction is negligible, whereas resonances in the 22NeNa reaction make its rate comparable to 12CN. However, the larger abundance of 12C means that it captures more protons by a factor of CNe. The fate of the synthesized 13N requires some discussion, as the branching amongst the three relevant reactions: 13NC, 13NC, 13NO, depends on , , and proton mass fraction, .
The production of protons is always the rate limiting step, so that each proton is almost immediately captured by 12C. This means that we can find by balancing the proton production rate from carbon fusion, (where is the branching ratio for the reaction 12CCNa and is the 12C number density) with the proton capture rate, , where is the proton number density,
| (2) |
This is plotted in the upper panel of Figure 2. The small value of confirms our equilibrium assumption for the proton abundance, and allows us to show that the 13NO reaction is negligible (bottom panel of Fig. 2) in comparison to electron captures. The bottom panel also shows the rates for the reactions 13NC and 13NC, making it clear that electron capture dominates for .

All of the 13N comes from the protons synthesized by carbon fusion, therefore the 13N production rate is equal to that of protons. Once again, this is the slowest step so that we can find the 13N abundance by balancing , where N is the 13N electron capture rate. Captures into excited states are unlikely to be dominant, allowing us to use the measured from the ground-state transitions. (Likewise, we use for 23Na electron captures in §2.2.) Combining with equation (2) gives
| (3) |
where is Avagodro’s number, which is shown in the top panel of Figure 2. The network is completed by 13CO and 12CC, leading to a composition of one each of 13C, 16O, 20Ne, 23Na.
There are two complications. The first is at high ’s where photodisintegration of 13N happens faster than the electron captures (above the dashed curve labeled by in Fig. 1). Chemical balance (CN) is achieved in this limit, fixing the proton to 13N ratio. The 13N is then slowly removed due to electron captures. The electron captures must always balance the proton production, so the 13N abundance remains identical to equation (3). Hence, photodisintegration adds steps to the reaction chain (and alters the proton density; top panel of Fig. 2) but does not modify the conclusion that all protons released in 12C burning lead to 13N electron capture.
The second complication is the reaction 23NaNe at high densities (). This occurs to the right of the dashed line labeled as in Figure 1, illustrating that these electron captures only take place at certain times during the simmering phase, which we account for in §3. Electron captures on 13N would not have time to occur above the dashed line labeled in Figure 1, but this is always after the explosion.
The main reaction cycle is summarized in Table 1. Six 12C are consumed, producing 13C, 16O, 20Ne, and depending on , either 23Ne or 23Na. Therefore, during each cycle either one or two protons have been converted to neutrons.
| Reaction | Thermal Energy Release (MeV) |
|---|---|
| 12CCNa | 2.239 |
| 12CCNe | 4.617 |
| 12CN | 1.944 |
| 13NC | 0 |
| 13CO | 2.214 |
| 12CC | 4.947 |
| 23NaNeaaThis reaction only occurs when (Fig. 1). | 0 |
2.2. Late Time Truncation of Neutron Production
The carbon burning ashes eventually become abundant enough to compete with 12C for proton captures. The relevant products are 20Ne, and either 23Na or 23Ne. The 20Ne reactions of 20NeNa and 20NeF are negligible, so we focus on 23Na and 23Ne.
We plot the proton destruction rate for the most relevant reactions in Figure 3 as a function of , the fraction of 12C that has burned. The number density of either 23Na or 23Ne is taken to be equal to the number density of 12C burned times . Circles denote where the rates cross each other, which is nearly independent of . For , must exceed before the 23NaNe reaction becomes important, and ends neutronization.
When , 23Ne forms, which has a higher proton capture cross section than 23Na. Burning only is enough that 23NeNa becomes the primary proton sink. Since this makes 23Na and liberates a neutron, the new 23Na may electron capture again to make 23Ne, and the reaction chain 23NeNaNe can repeatedly occur, making many free neutrons. Competing with this process are other reaction chains that burn these neutrons (for example, see Table 6 of Arnett & Thielemann, 1985). In this regime, it is difficult for us to estimate all the key nuclear reactions that will take place. Although further neutronization is possible, we cannot follow this without a full reaction network (Chamulak et al., 2007b). Such calculations must also be coupled to a realistic model for the core temperature evolution (such as what we present here).

3. Maximum Neutronization Estimates
We set as the number of protons that are converted to neutrons for every six 12C consumed, so that () for ( ), where we approximate . The case is an upper limit since in parts of the convection zone where the 23Na does not electron capture (and 23Ne that is mixed to lower densities by convection may decay). The total neutronization is measured via
| (4) |
which includes the initial 56Fe and 22Ne content. Neutronization halts either when the WD explodes or when freshly made heavy elements compete for protons (Fig. 3).
In the case of competition from fresh heavy elements, truncation at high densities occurs when with . The maximum change in is therefore
| (5) |
A similar limit pertains at lower densities. One way to exceed this limit in the high density case is if additional reaction chains occur (see §2.2). We show as a dot-dashed line in Figure 4, in comparison to the ’s that result from Ne and (dotted lines). By coincidence, the maximum effect of neutronization during simmering is comparable to that associated with a solar metallicity.
The other possible limiter of neutronization is the onset of the explosion. The reactions in Table 1 show that MeV is released as thermal energy when six carbon nuclei are burned.111Not all of this energy will always go into heating up the core. For example, if the convective Urca process is operating, then it will take more energy (and more carbon burning) to get to sufficient temperatures. If we let be the total thermal content that is within the convective core with respect to the initial isothermal WD, this implies a change in a convective core of mass ,
| (6) |
For this to compete with the 22Ne contribution, a total energy
| (7) |
or , must be released prior to the explosion.
Simmering ends when dynamical burning is triggered, requiring (Woosley et al., 2004). If the burning occurred within a single zone with the specific heat of §2, then reaching this would require , in excess of that implied by equation (7). Of course, in reality the convective zone extends outward, so that little mass is at . To accurately determine the resulting neutronization, we construct hydrostatic WD models consisting of fully convective cores as described at the beginning of §2. We consider isothermal temperatures of either or . At any given moment there is a well defined (Lesaffre et al., 2006; Piro, 2007), and we evaluate the current thermal content by integrating the specific heat relative to the initially isothermal WD,
| (8) |
where is the isothermal WD temperature. In this way we use our time independent models to find the fraction of carbon that must have burned, , and the associated as and increase with time. We assume no neutrino losses and thus all of thermal energy contributes to heating.
In Figure 4 we summarize the results of these calculations. In each case, the slope of shows a break at the transition from () to . This break occurs later for more massive WDs (Fig. 1), thus these have more neutronization during simmering. Increasing the isothermal temperature decreases , so that it takes less burning to reach a given . These fully integrated models make it clear that substantial neutronization occurs prior to the explosion. In comparison to the from 22Ne, simmering effects dominate if Ne or . This thwarts the occurrence of high SNe Ia in low metallicity progenitors.

4. Conclusion and Discussion
We have found that significant neutronization of the WD core occurs throughout the simmering stage of carbon burning until the onset of the explosion. If substantial energy is lost to the convective Urca process (Lesaffre et al., 2005, and references therein), then the neutronization is truncated by proton captures onto freshly synthesized heavy elements (resulting in eq. [5]). The main consequence is a uniform “floor” to the amount of neutronization that dominates over the metallicity dependent contribution for all progenitors with .
Given the likely significance this has for SNe Ia, more work needs to be done. In particular, at high ignition densities, heavy element electron captures and a full reaction network are needed to follow the resulting diverse collection of elements (see the discussion in §2.2). The convective Urca process is another complication we have not addressed. In principle, if more energy is lost to neutrinos then more burning (and thus more neutronization) is required to make the burning dynamical. Assessing this will necessitate coupling a full nuclear network (Chamulak et al., 2007b) to convective calculations. Such models would accurately determine rather than simply setting it to 1 or 2.
In closing, we highlight some important features exhibited by recent observations of SNe Ia. It is clear that the amount of 56Ni produced in SNe Ia has a dynamic range () larger than can be explained by metallicity or simmering neutronization. However, since an intriguing trend is the prevalence of 56Ni rich events in star-forming regions it is interesting to quantitatively explore how large the observed discrepancy is. Using the SNLS sample of Sullivan et al. (2006), Howell et al. (2007) found that the average stretch is in passive galaxies (e.g. E/S0’s) and in star-forming galaxies. Using Jha et al’s (2006) relation and Mazzali et al.’s (2007) relation between and 56Ni mass we get () and (). Hence, amongst the large diversity, there is a tendency for SNe in star-forming galaxies to produce more 56Ni than those in large ellipticals.
Since the SN Ia rate scales with mass in ellipticals and star formation rate in spirals (Mannucci et al. 2005; Scannapieco & Bildsten 2005; Sullivan et al. 2006), SNe from passive galaxies in the SNLS survey are from more massive galaxies than the SNe in star-forming galaxies (Sullivan et al. 2006). Using the mass-metallicity relation of Tremonti et al. (2004), our integration of the separate samples in Sullivan et al. (2006) yield average in active galaxies and in ellipticals (solar value is ). Due to the increase of at high metallicities (Liang et al. 2006), the SNe in ellipticals have twice as much 22Ne content as those in spirals. From the relation of Timmes et al. (2003), this implies less 56Ni, whereas the observed decrement is . Explaining the observed decrement would require a contrast of Ne, or nearly 3 times solar. Although we have found that simmering enhances neutronization, the effect is not great enough ( would give the same change in neutronization as doubling a solar metallicity), and a diverse set of core conditions would still be required. A large enhancement could be present in the core if substantial gravitational separation had occurred (Bildsten & Hall, 2001; Deloye & Bildsten, 2002), yet convective mixing during simmering will reduce it based on the fraction of the star that is convective. For a convection zone that extends out to , the resulting 22Ne enhancement would be at most .
References
- Arnett & Thielemann (1985) Arnett, W. D. & Thielemann, F.-K. 1985, ApJ, 295, 589
- Bildsten & Hall (2001) Bildsten, L. & Hall, D. M. 2001, ApJ, 549, L219
- Caughlan & Fowler (1988) Caughlan, G. R., & Fowler, W. A. 1988, At. Data Nucl. Data Tables, 40, 283
- Chabrier & Potekhin (1998) Chabrier, G. & Potekhin, A. Y. 1998, Phys. Rev., E58, 4941
- Chamulak et al. (2007a) Chamulak, D. A., Brown, E. F., & Timmes, F. X. 2007a, ApJ, 655, L93
- Chamulak et al. (2007b) Chamulak, D. A., Brown, E. F, Timmes, F. X., & Dupczak, K. 2007b, submitted to ApJ
- Deloye & Bildsten (2002) Deloye, C. J. & Bildsten, L. 2002, ApJ, 580, 1077
- Garcia-Senz & Woosley (1995) Garcia-Senz, D. & Woosley, S. E. 1995, ApJ, 454, 895
- Howell et al. (2007) Howell, D. A., Sullivan, M., Conley, A. & Carlberg, R. 2007, ApJ, 667, L37
- Jha et al. (2006) Jha, S., et al. 2006, AJ, 131, 527
- Kuhlen et al. (2006) Kuhlen, M., Woosley, S. E., & Glatzmaier, G. A. 2006, ApJ, 640, 407
- Lesaffre et al. (2005) Lesaffre, P., Podsiadlowski, Ph., & Tout, C. A. 2005, MNRAS, 356, 131
- Lesaffre et al. (2006) Lesaffre, P., Han, Z., Tout, C. A., Podsiadlowski, Ph., & Martin, R. G. 2006, MNRAS, 368, 187
- Liang et al. (2006) Liang, Y. C., et al. 2006, ApJ, 652, 257
- Mannucci et al. (2005) Mannucci, F., et al. 2005, A&A, 433, 807
- Mazzali et al. (2007) Mazzali, P. A., Roepke, F. K., Benetti, S. & Hillebrandt, W. 2007, Science, 315, 825
- Nomoto et al. (1984) Nomoto, K., Thielemann, F.-K., & Yokoi, K. 1984, ApJ, 286, 644
- Phillips et al. (1999) Phillips, M. M., Lira, P., Suntzeff, N. B., Schommer, R. A., Hamuy, M., & Maza, J. 1999, AJ, 118, 1766
- Piro (2007) Piro, A. L. 2007, submitted to ApJ
- Piro & Chang (2007) Piro, A. L. & Chang, P. 2007, submitted to ApJ
- Salpeter & van Horn (1969) Salpeter, E. E., & van Horn, H. M. 1969, ApJ, 155, 183
- Scannapieco & Bildsten (2005) Scannapieco, E. & Bildsten, L. 2005, ApJ, 629, L85
- Sullivan et al. (2006) Sullivan, M. et al. 2006, ApJ, 648, 868
- Thielemann et al. (1986) Thielemann, F.-K., Nomoto, K., & Yokoi, K. 1986, A&A, 158, 17
- Timmes et al. (2003) Timmes, F. X., Brown, E. F., & Truran, J. W. 2003, ApJ, 590, L83
- Timmes & Woosley (1992) Timmes, F. X., & Woosley, S. E. 1992, ApJ, 396, 649
- Tremonti et al. (2004) Tremonti, C. A. et al. 2004, ApJ, 613, 898
- Weinberg et al. (2006) Weinberg, N., Bildsten, L., & Schatz, H. 2006, ApJ, 639, 1018
- Woosley et al. (2007) Woosley, S. E., Kasen, D., Blinnikov, S., & Sorokina, E. 2007, ApJ, 662, 487
- Woosley & Weaver (1986) Woosley, S. E., & Weaver, T. A. 1986, ARA&A, 24, 205
- Woosley et al. (2004) Woosley, S. E., Wunsch, S., & Kuhlen, M. 2004, ApJ, 607, 921
- Wunsch & Woosley (2004) Wunsch, S. & Woosley, S. E. 2004, ApJ, 616, 1102
- Yakovlev et al. (2006) Yakovlev, D. G., Gasques, L. R., Afanasjev, A. V., Beard, M., & Wiescher, M. 2006, Phys. Rev. C, 74, 035803