VLT Spectroscopy of Globular Clusters in Low Surface Brightness Dwarf Galaxies\mbox{$\star$}\mbox{$\star$}affiliationmark:
Abstract
We present VLT/FORS2 spectroscopic observations of globular clusters (GCs) in five low surface brightness (LSB) dwarf galaxies: KK211 and KK221, which are both dwarf spheroidal satellites (dSph) of NGC 5128, dSph KK84 located close to the isolated S0 galaxy NGC 3115, and two isolated dwarf irregular (dIrr) galaxies UGC 3755 and ESO 490-17. Our sample is selected from the Sharina et al. (2005) database of Hubble Space Telescope WFPC2 photometry of GC candidates in dwarf galaxies. For objects with accurate radial velocity measurements we confirm 26 as genuine GCs out of the 27 selected candidates from our WFPC2 survey. One candidate appears to be a distant galaxy. Our measurements of the Lick absorption line indices in the spectra of confirmed GCs and the subsequent comparison with SSP model predictions show that all confirmed GCs in dSphs are old, except GC KK211-3-149 (2 Gyr), which we consider to be the nucleus of KK211. GCs in UGC 3755 and ESO 490-17 show a large spread in ages ranging from old objects ( Gyr) to clusters with ages around 1 Gyr. Most of our sample GCs have low metallicities . Two relatively metal-rich clusters with are likely to be associated with NGC 3115. Our sample GCs show in general a complex distribution of -element enhancement with a mean [/Fe] derived with the minimization technique and dex computed with the iterative approach. These values are slightly lower than the mean [/Fe] for typical Milky Way GCs. We compare other abundance ratios with those of Local Group GCs and find indications for systematic differences in N and Ca abundance. The specific frequencies, , of our sample galaxies are in line with the predictions of a simple mass-loss model for dwarf galaxies and compare well with values found for dwarf galaxies in nearby galaxy clusters.
Subject headings:
galaxies: dwarf - galaxies: star clusters - globular clusters1. Introduction
The hierarchical structure formation scenario predicts that dwarf galaxies are the first systems to form in the Universe (Peebles & Dicke, 1968), and that more massive galaxies form through dissipative processes from these smaller sub-units. The involved physical mechanisms of this sequence depend on the density and mass of the parent dark matter halo, in the sense that more massive halos initiate star formation at earlier epochs and form their stars at a faster rate (e.g. Peebles, 2002; Renzini, 2006; Ellis, 2007). Because of this environmental gradient, we expect that dwarf galaxies in the field formed the first stellar population relatively late and at a lower pace compared to their counterparts in dense galaxy clusters. In other words, the difference in age and chemical composition between the oldest stellar populations in cluster and field dwarf galaxies should reflect the delay in the onset of structure formation in these two environments.
The task of measuring the age and chemical composition of the oldest stellar populations in distant dwarf galaxies from their integrated light is very challenging. An alternative approach is to investigate the oldest globular clusters (GCs) that are found in dwarf galaxies. Several photometric surveys of extragalactic GCs in dwarf galaxies outside the Local Group have been performed in the past decade (see review by Miller, 2006). However, only a handful of those were followed up with 8–10m-class telescopes to derive spectroscopic ages and chemical composition. Observations of galaxies in groups and clusters provide more and more evidence that environment is a major factor influencing the process of GC formation (e.g. West, 1993; Tully et al., 2002; Grebel et al., 2003; Miller et al., 1998). Recent progress in modeling the assembly history of GC systems in massive elliptical galaxies suggests that a significant fraction of metal-poor GCs were accreted from dwarf satellites at later times compared to the number of GCs initially formed in the parent galaxy halo (Pipino et al., 2007). These results underline the ideas put forward in the work of Forte et al. (1982) and Muzzio (1987) as well as the models of Côté et al. (1998, 2002); Hilker et al. (1999), who suggested that the rich GC systems of massive galaxies may be the result of significant GC accretion through tidal stripping of less massive systems.
Spectroscopic studies of a few GCs in cluster and field dwarf galaxies showed that most of these systems host at least some old GCs with ages Gyr (Puzia et al., 2000; Sharina et al., 2003; Strader et al., 2003a, b; Beasley et al., 2006; Conselice, 2006). Although today’s accuracy of relative spectroscopic age determinations () is not sufficient to resolve the expected delay of Gyr in the onset of star-formation between cluster and field environment (depending on cosmology, ionizing source population, ionization feedback efficiency, etc., see Kauffmann, 1996; Treu et al., 2005; Thomas et al., 2005; De Lucia et al., 2006; Clemens et al., 2006), the old ages combined with information on abundance ratios can provide a powerful tool to decide whether stellar populations in field dwarf galaxies followed the same early enrichment history as their analogs in denser environments. Furthermore, any difference in GC chemical composition between dwarf and more massive galaxies opens an attractive way of chemically tagging accreted sub-populations in massive halos and, therefore, enables us to quantify the mass accretion history of galaxies, a task that for old galaxies is infeasible from studies of the diffuse galaxy light alone. Similar ideas have been formulated for stellar populations that make up the diffuse component of the most nearby galaxies, which are close enough for high-resolution spectroscopy of individual stars (Freeman & Bland-Hawthorn, 2002; Geisler et al., 2007). The obvious advantage of GC systems is that their spectra can be observed out to about 10 times greater distances.
In this work we analyze spectroscopic observations of GCs in dwarf irregular (dIrr) and dwarf spheroidal galaxies (dSph) in the field/group environment. Our sample consists of systems that are representatives of the lowest-mass bin of the Local Volume (LV) galaxy population, limited to distances Mpc. We refer to Karachentseva et al. (1985) and Grebel (1999) for a morphological type definition of our sample galaxies. The paper is organised as follows. In Section 2 we describe our observations and data reduction as well as the methods of measuring radial velocities. Section 3 summarizes the measurement of Lick line indices, their calibration, and the determination of spectroscopic ages, metallicities, and abundance ratios. Section 4 is devoted to the discussion of our results. Conclusions are presented in section 5.
| Galaxy | RA (J2000) | DEC (J2000) | ||||||||
|---|---|---|---|---|---|---|---|---|---|---|
| KK211, AM1339-445 | 13 42 06 | 45 13 18 | 27.77 | 0.25 | 0.477 | 16.30.2 | 1.80.2 | 12.58 | 2 | 18.6 |
| KK221 | 13 48 46 | 46 59 49 | 28.00 | 0.50 | 0.596 | 17.30.4 | 2.00.4 | 11.96 | 6 | 95.1 |
| KK084, UA200, KDG65 | 10 05 34 | 07 44 57 | 29.93 | 0.03 | 0.205 | 16.40.2 | 1.70.2 | 14.40 | 7 | 10.4 |
| UGC3755, PGC020445 | 07 13 52 | 10 31 19 | 29.35 | 0.384 | 14.10.2 | 1.10.2 | 16.12 | 32 | 11.4 | |
| E490-017, PGC019337 | 06 37 57 | 25 59 59 | 28.13 | 4.50 | 0.377 | 14.10.2 | 1.10.2 | 14.90 | 5 | 5.4 |
Note. — Columns contain the following data: (1) galaxy name, (2) equatorial coordinates, (3) and (4) are the distance modulus and distance from the nearest bright galaxy in Mpc from Karachentsev et al. (2004), and from Tully et al. (2005) for UGC3755, (5) reddening from Schlegel et al. (1998) in the B-band, (6) is the integrated magnitude, and (7) the integrated color, derived from surface photometry on the VLT-FORS2 images in this work (see Appendix A), (8) absolute magnitude from SPM05, (9) number of GCs according to SPM05 and this paper, (10) specific frequency, (Harris & van den Bergh, 1981).
2. Observations
2.1. Sample Selection
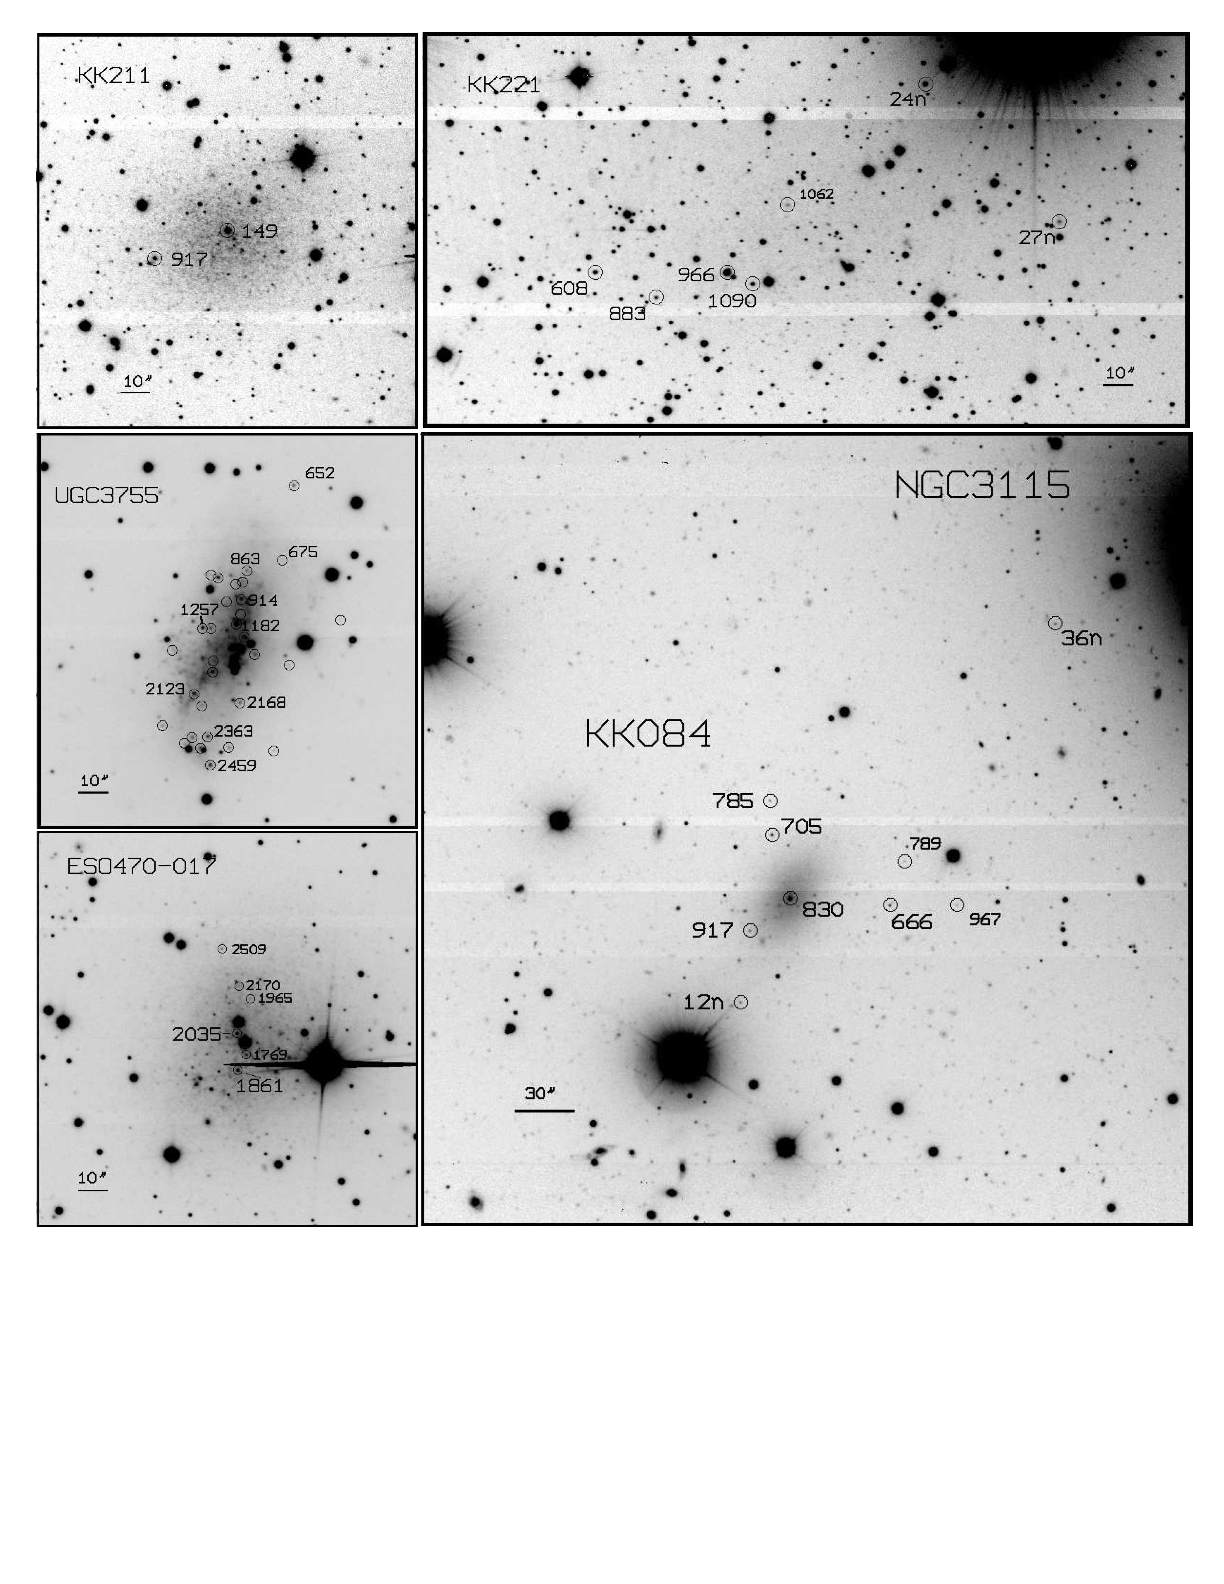
All target galaxies are part of the Sharina et al. (2005) (hereafter: SPM05) sample for which detailed information on luminosities, colors, and structural parameters of GC candidates is available from HST data. The targets were selected based on the number of GC candidates and the optimization of the observing strategy at the time of scheduled observations. The main characteristics of our sample galaxies are presented in Table 1. KK211 and KK221 are two of the faintest dSph galaxies in the Centaurus A group. The dSph galaxy KK84 is the nearest satellite of the giant field S0 galaxy NGC 3115. UGC 3755111Strictly speaking UGC 3755 is a borderline low surface brightness galaxy according to the definition outlined by Impey & Bothun (1997): mag/arcsec2., which hosts one of the richest GC system among isolated dwarf galaxies (see Table 1), and ESO490-17 are both highly isolated dIrrs. In general, the specific frequencies are high for all our sample galaxies. It will be shown in the last section, that these values correspond to the predictions of galaxy evolution models that include significant mass loss, which strongly affects the star formation processes in low-mass galaxies.
Detailed CMD studies of the Local Group dwarf galaxies show that each low-mass galaxy has its own complex star formation history (SFH) (e.g. Grebel et al., 2003). However, in contrast to dIrrs, dSphs are composed mainly of old and intermediate-age stars, and do not contain young stellar populations (e.g. Holtzman et al., 2006). We will test whether this difference is reflected in the GC populations of our sample field/group dwarfs and investigate the chemical compositions of their GC stellar populations.
2.2. Pre-imaging data
All pre-imaging data were obtained with the FORS2 instrument at UT1 (unit
telescope 1, ANTU) as par of the program 76.B-0137 (see also
Fig. 1). A journal of the pre-imaging observations is provided
in Table 2. All images were reduced using standard techniques
(bias subtraction and flat fielding). We used the FIMS (FORS Instrumental
masks simulator) task fsmosaic to merge two files of each image. To
register and combine the six sub-integrations obtained in each filter we
used the tasks ccmap and imcombine in IRAF222IRAF is
distributed by the National Optical Astronomy Observatories, which are
operated by the Association of Universities for Research in Astronomy,
Inc., under cooperative agreement with the National Science Foundation..
Aperture photometry of GC candidates (GCCs) was performed using the PHOT
task of DAOPHOT-II (Stetson, 1987) package implemented in MIDAS. The
detection threshold was set to 3- above the background. The
minimum full width at half maximum (FWHM) input parameter was
″, corresponding to a typical stellar FWHM. To convert
instrumental magnitudes into the Johnson-Cousins standard system we
applied the FORS2 photometric
zeropoints333http://www.eso.org/observing/dfo/quality/FORS2/qc/
zeropoints/zeropoints.html:
(for chip 1), (for chip
2), (for chip 1), (for chip
2), obtained from data taken during the same nights. Atmospheric extinction
coefficients444http://www.eso.org/observing/dfo/quality/FORS2/qc/
photcoeff/photcoeffs_fors2.html were taken for 2006-01-01, (for chip 1), (for chip 2), (for chip 1), (for chip 2). Finally, the
magnitudes of all GCCs were corrected for Galactic extinction using
reddening maps from Schlegel et al. (1998). The accuracy of our photometry
depends primarily on the accuracy of the background estimates. The
uncertainties grow in the central regions of galaxies where the background
is less homogeneous, and the images become increasingly affected by
stellar crowding. In general, the errors of and magnitudes are
less than mag for objects brighter than mag. The budget of
errors includes the errors of aperture photometry, and the uncertainties
of transformations into the standard and system. We consider the
internal reddening within our sample galaxies to be mag
(James et al., 2005), given the similarity of these systems to nearby low
surface brightness galaxies.
For our spectroscopic observations we selected GCCs with integrated colors , similar to the selection of Puzia et al. (2004, hereafter: P04). In total we found 96, 74, 14, 19, and 11, objects in and around KK084, UGC3755, ESO490-017, KK221, and KK211, respectively. The full list of GCCs detected on the VLT images with equatorial coordinates, and magnitudes, and spectroscopic classification of genuine GCs, foreground stars, and background galaxies is available upon request from the authors (see also Tabs. 4 and 5). We point out that all GCCs that are listed in SPM05 are also included in the final target list and were all selected purely based on their colours.
To obtain accurate estimates of specific frequencies, we also perform surface photometry of our sample galaxies using the SURPHOT routine implemented in MIDAS. All steps are identical to those described in Makarova (1999). Table 1 documents the results, which are illustrated in Figure 9 and discussed in detail in Appendix A.
| Object | Date | Filter | Seeing | Airmass | |
|---|---|---|---|---|---|
| KK211 | 25.08.2005 | B | 6x180 | 1.0″ | 1.740 |
| 25.08.2005 | I | 6x90 | 1.0″ | 1.834 | |
| KK221 | 25.08.2005 | B | 6x180 | 1.1″ | 1.914 |
| 25.08.2005 | I | 6x90 | 1.2″ | 1.997 | |
| UGC3755 | 01.11.2005 | B | 6x180 | 0.9″ | 1.258 |
| 01.11.2005 | I | 6x90 | 0.9″ | 1.242 | |
| E490-017 | 28.11.2005 | B | 6x180 | 0.7″ | 1.041 |
| 28.11.2005 | I | 6x90 | 0.7″ | 1.056 | |
| KK084 | 09.12.2005 | B | 6x215 | 1.2″ | 1.164 |
| 09.12.2005 | I | 6x120 | 1.2″ | 1.164 |
Note. — The exposure time is given in seconds.
2.3. Spectroscopic data
| Object | Date | Seeing | |
|---|---|---|---|
| E490-017 | 03.01.2006 | 4x1800 | 0.8″ |
| 04.01.2006 | 1800 | 1.6″ | |
| KK084 | 03.01.2006 | 5x1800 | 1.0″ |
| 04.01.2006 | 8x1800 | 1.5″ | |
| 05.01.2006 | 4x1800 | 0.7″ | |
| KK221 | 03.01.2006 | 5x1800 | 1.0″ |
| UGC3755 | 04.01.2006 | 6x1800 | 1.3″ |
| 05.01.2006 | 5x1800 | 0.8″ | |
| KK211 | 05.01.2006 | 5x1800 | 0.8″ |
| HD013043 | 03.01.2006 | 4, 1 | 1.8″ |
| HR0695 | 03.01.2006 | 2, 1 | 1.8″ |
| 04.01.2006 | 1, 1 | 1.8″ | |
| HR1506 | 03.01.2006 | 1, 8 | 1.8″ |
| 05.01.2006 | 1 | 0.8″ | |
| HD64606 | 04.01.2006 | 1, 3 | 1.8″ |
| HR3905 | 04.01.2006 | 1, 5 | 1.8″ |
| HR2233 | 05.01.2006 | 1, 1 | 1.3″ |
| HD36003 | 05.01.2006 | 1, 2 | 1.3″ |
| HR1015 | 05.01.2006 | 1, 3 | 1.3″ |
Note. — The exposure times for GCs (upper part) are given in multiples of seconds, while the exposure times for Lick standard stars are shown in seconds for each individual integration.
| Name | GCCs | Objsel. | #Slits | #SlitsSPM05 | GCs | Gal. | Stars | Faint | faint GCCs |
|---|---|---|---|---|---|---|---|---|---|
| KK211 | 2 | 11 | 26 | 2 | 2 | 5 | 12 | 7 | |
| KK221 | 5 | 19 | 36 | 5 | 6 | 6 | 5 | 19 | KK221-3-1062 |
| KK084 | 8 | 96 | 39 | 7 | 7 | 13 | 7 | 12 | KK84-2-789 |
| UGC3755 | 32 | 74 | 39 | 10 | 10 | 8 | 9 | 12 | U3755-3-1963 |
| E490-017 | 5 | 14 | 28 | 3 | 2 | 9 | 8 | 9 | E490-017-3-1861 |
Note. — Columns contain numbers of: (2) GCCs in each galaxy listed by SPM05, (3) total number of GCCs selected on the VLT images, (4) slits on GCCs in total, (5) number of slits on SPM05 targets, (6) spectroscopically confirmed GCs, (7) number of background galaxies in slits, (8) Galactic stars, (9) faint object in total, the nature of which is unclear. In the last column we list the names of GCs that are too faint to measure their radial velocities with reliable accuracy from our observations.
The spectroscopic data were obtained in the MXU mode with FORS2 using custom slit masks for KK084, UGC 3755, ESO 490-017, KK221, and KK211 that contain 39, 39, 28, 36, and 26 objects in total, respectively. A journal of spectroscopic observations is provided in Table 3. The masks included our primary target GCCs, as well as mask-filler objects that were mostly stars and background galaxies. In general, due to the concentrated location of GCCs in the central regions of dwarf galaxies we primarily targeted GCCs from SPM05 and set slits on: all two GCCs in KK211, all five GCCs in KK221, 3 of 5 GCCs in ESO490-017, 10 of 32 GCCs in UGC3755, and 7 of 8 GCCs in KK084 (KK084-2-974 was not observed, see also Tables 4 and 5 for details).
The reduction of the spectroscopic data and the subsequent analysis were performed with a combination of MIDAS and IRAF tasks. After cosmic-ray removal and bias subtraction all frames were divided by a normalized flat-field image. For each slit a 2-dimensional subsection of the CCD was extracted and then treated separately. To correct the effect of optical field distortions in the FORS field-of-view we applied the method described by P04, which is based on a two-dimensional wavelength solution assembled of 1-D solutions for each pixel row from arclamp spectra. For this task we used the LONG package in MIDAS. This procedure requires an accurate wavelength solution for each individual pixel row. To maximize the signal-to-noise ratio (S/N) of lines in the comparison arc spectrum we flat-fielded the arc spectrum to correct for small-scale fluctuations and applied a median filter to the frame using a rectangular filter window of one pixel in the dispersion direction and 3 pixels in the spatial direction. A typical accuracy of the 2-dimensional dispersion solution was Å. The extraction region was defined by tracing the GC spectrum along the wavelength dimension. The window width for the traced extraction was set so that the boundaries of spectra were at % of the peak flux in all cases, except for GCs 1182 and 2123 in UGC 3755 where the extraction window was set to a width of % of the peak flux, because of their location near regions of emission.
To ensure that the dispersion solution was determined correctly we extracted the 1-dimensional spectra using the method described above without subtracting the sky spectrum and determined the wavelengths of the telluric lines (Osterbrock et al., 1996, 2000). For few spectra we found systematic shifts of the order of Å equal for all lines. Such shifts were corrected by adding of the corresponding correction term to the dispersion solution. The GC spectra are then cross-correlated with spectra of radial-velocity standard stars observed in the same night using the xcorrelate/image procedure in MIDAS, which yields radial velocities according to the method of Tonry & Davis (1979). Table 5 summarizes the measured heliocentric radial velocities.
| GC | RA (J2000) DEC | |||||
|---|---|---|---|---|---|---|
| KK211-3-149 | 13 42 05.6 45 12 18 | 20.64 | 0.69 | 1.51 | 58023 | |
| KK211-3-917 | 13 42 08.0 45 12 28 | 21.84 | 0.93 | 1.64 | 62039 | |
| KK221-2-608 | 13 48 55.1 47 00 07 | 21.08 | 1.12 | 1.85 | 54132 | |
| KK221-2-883 | 13 48 53.0 47 00 16 | 22.07 | 1.14 | 1.89 | 54646 | |
| KK221-2-966 | 13 48 50.5 47 00 07 | 19.20 | 1.00 | 1.78 | 50925 | |
| KK221-2-1090 | 13 48 49.6 47 00 11 | 21.20 | 0.97 | 1.63 | 47829 | |
| KK221-24n | 13 48 43.6 46 58 59 | 20.70 | 1.63 | 51231 | ||
| KK221-27n | 13 48 39.0 46 59 49 | 22.26 | 1.74 | 46635 | ||
| KK084-2-785 | 10 05 35.8 07 44 06 | 23.31 | 0.68 | 1.68 | 85624 | |
| KK084-3-705 | 10 05 35.7 07 44 25 | 22.28 | 0.73 | 1.87 | 67031 | |
| KK084-3-830 | 10 05 35.0 07 44 59 | 20.82 | 0.57 | 1.74 | 59432 | |
| KK084-3-917 | 10 05 36.5 07 45 16 | 22.94 | 0.53 | 1.63 | 61928 | |
| KK084-4-666 | 10 05 31.5 07 45 03 | 22.47 | 0.91 | 2.10 | 67821 | |
| KK084-12n | 10 05 36.8 07 45 54 | 23.00 | 1.49 | 91140 | ||
| KK084-36n | 10 05 25.6 07 42 33 | 23.02 | 2.28 | 121027 | ||
| UGC3755-2-652 | 07 13 50.1 +10 32 15 | 21.48 | 1.11 | 1.82 | 32321 | |
| UGC3755-2-675 | 07 13 50.4 +10 31 49 | 23.65 | 0.81 | 1.53 | 36721 | |
| UGC3755-2-863 | 07 13 51.3 +10 31 45 | 22.79 | 1.13 | 1.89 | 29033 | |
| UGC3755-3-914 | 07 13 51.4 +10 31 35 | 21.74 | 0.75 | 1.31 | 28424 | |
| UGC3755-3-1182 | 07 13 51.5 +10 31 26 | 20.61 | 0.56 | 0.88 | 33532 | |
| UGC3755-3-1257 | 07 13 52.3 +10 31 24 | 20.98 | 1.10 | 1.76 | 32731 | |
| UGC3755-3-2123 | 07 13 52.5 +10 31 01 | 21.36 | 0.53 | 0.70 | 32922 | |
| UGC3755-3-2363 | 07 13 52.2 +10 30 45 | 21.60 | 0.76 | 1.00 | 31218 | |
| UGC3755-3-2168 | 07 13 51.4 +10 30 58 | 21.84 | 0.88 | 1.56 | 32428 | |
| UGC3755-3-2459 | 07 13 52.2 +10 30 35 | 20.93 | 0.32 | 0.81 | 33332 | |
| E490-017-3-2035 | 06 37 57.3 25 59 59 | 21.16 | 0.33 | 0.74 | 52934 | |
| E490-017-3-1861 | 06 37 57.3 26 00 13 | 21.45 | 0.50 | 1.57 | 5229 |
Note. — Columns contain the following data: (2), (3) equatorial coordinates, (4) integrated magnitude from our FORS2 photometry corrected for Galactic extinction (Schlegel et al., 1998), (5) absolute magnitude computed with the distances from Table 1, (6),(7) integrated and colours corrected for Galactic extinction (Schlegel et al., 1998), (8) heliocentric radial velocities measured in this study.
2.4. Detection Efficiencies
We present a resumé of GC detection efficiencies for our spectroscopic observations in Table 4. Numbers of detected GCCs within the FORS2 field-of-view with colors resembling those of GCCs, prepared masks for a part of them, confirmed genuine globular clusters, distant galaxies with radial velocities km s-1 , and Galactic stars with radial velocities km s-1 are given for each galaxy, correspondingly. All observed GCCs from SPM05 appear to be genuine globular clusters, except a distant galaxy KK084–4–967. Heliocentric radial velocities of spectroscopically confirmed GCs are similar to the system velocities of Cen A and NGC3115 in the cases of KK211, KK221, and KK84, and to the velocities of the host galaxies measured using indendent methods in the cases of UGC3755 and E490-017 (Table 5). The radial velocity dispersion of the UGC 3755 sample is small km s-1, and the mean is consistent with the systemic value km s-1 measured by Bicay & Giovanelli (1986). UGC 3755 is the only galaxy in our sample with a low-enough systemic radial velocity so that a test of contamination likelihood by Galactic foreground stars is indicated. An evaluation of this likelihood with the stellar population synthesis models of the Milky Way (Robin et al., 2003) shows that the expected radial velocities of the thick disk, spheroid, and bulge component in the direction of UGC 3755 are significantly below km/s. Combined with their diffuse (i.e. non-stellar) PSFs in the HST images and their color information all our GCCs in UGC 3755 with accurate radial velocity measurements (see Tab. 5) are highly unlikely to be foreground stars. We discovered three new GCs: KK84-36n and KK84-12n, and KK221-12n (see Fig.1). The equatorial coordinates, total magnitudes, absolute magnitudes, , colors and radial velocities for all GCs confirmed or detected in this work are given in Table 5. In summary, our GCC selection efficiency based on the HST imaging survey presented in SPM05 is higher than 96% for the observed sample.
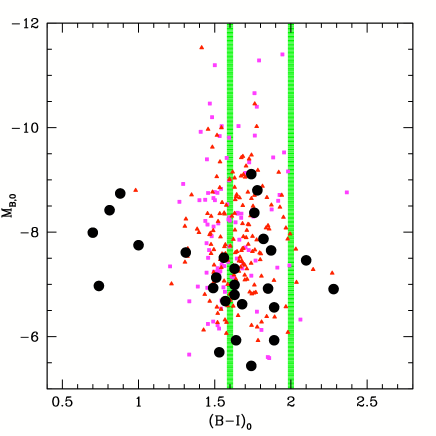
The distribution of confirmed GCs in the color-magnitude diagram is illustrated in Figure 3 where we compare our sample with the distribution of Milky Way and M31 GCs. The bulk of our sample has colors very similar to the Local Group GCs. A few GC have relatively blue colors which suggests younger ages. Our sample GCs probe the luminosity range around the turn-over magnitude of the GC luminosity function (GCLF: The turn-over for old GC populations is expected at , assuming from Di Criscienzo et al. [2006] for metal-poor Milky Way GCs and a typical for metal-poor stellar populations from Bruzual & Charlot [2003] SSP models) down to about a factor fainter clusters. We recall that SPM05 found indications for an excess cluster population in this magnitude range (see also van den Bergh, 2007; Jordán et al., 2007) and we point out that a significant number of GC candidates from the SPM05 sample are being confirmed as genuine GCs at these faint magnitudes. However, a larger sample is required to robustly quantify the excess of clusters with respect to GC systems of more massive galaxies, such as the two Local Group spirals.
3. Analysis
3.1. Lick Index Measurement and Calibration
| Index | c | rms error | Units |
|---|---|---|---|
| CN1 | 0.067 | 0.028 | mag |
| CN2 | 0.050 | 0.039 | mag |
| Ca4227 | 0.487 | 0.247 | Å |
| G4300 | 0.049 | 0.608 | Å |
| Fe4384 | 0.041 | 0.542 | Å |
| Ca4455 | 0.419 | 0.380 | Å |
| Fe4531 | 0.322 | 0.762 | Å |
| Fe4668 | 0.685 | 0.782 | Å |
| H | 0.183 | 0.277 | Å |
| Fe5015 | 0.460 | 0.640 | Å |
| Mg1 | 0.010 | 0.007 | mag |
| Mg2 | 0.027 | 0.010 | mag |
| Mgb | 0.351 | 0.134 | Å |
| Fe5270 | 0.345 | 0.203 | Å |
| Fe5335 | 0.156 | 0.230 | Å |
| Fe5406 | 0.208 | 0.124 | Å |
| HδA | 0.109 | 0.772 | Å |
| HγA | 0.000 | 0.129 | Å |
| HδF | 0.013 | 0.229 | Å |
| HγF | 0.491 | 0.148 | Å |
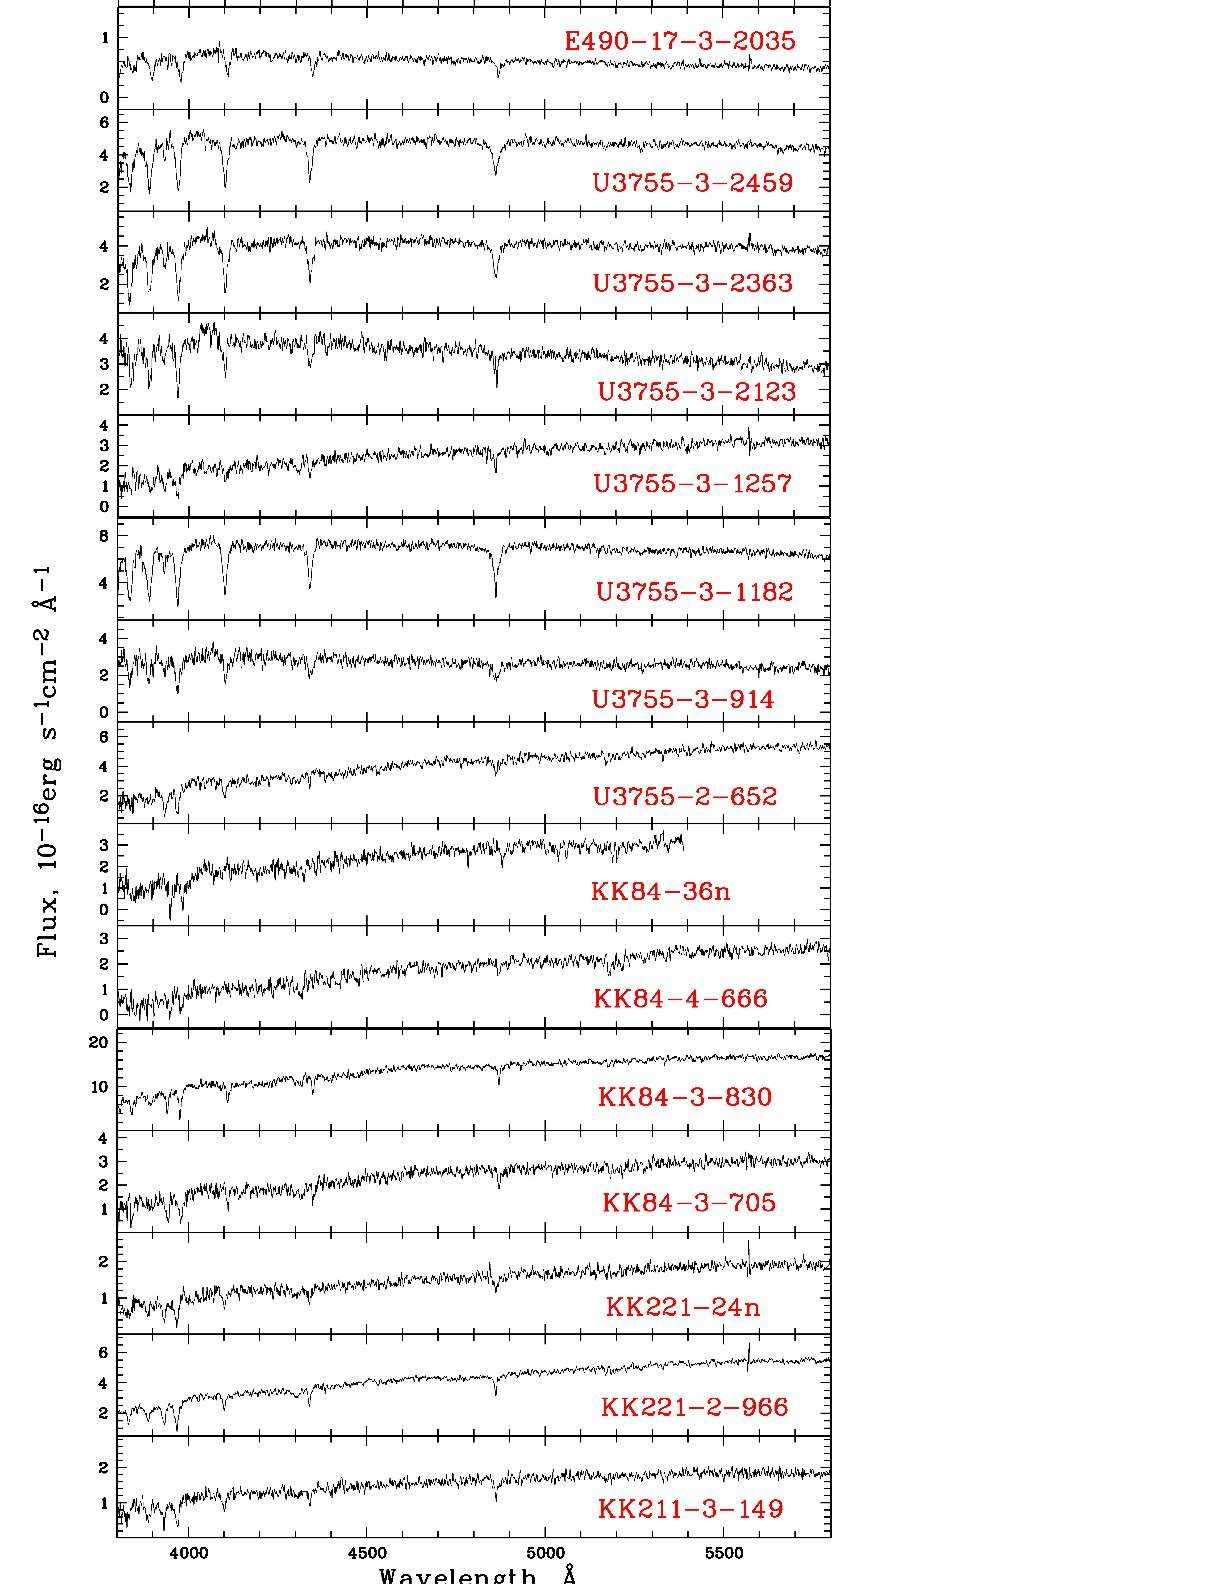
We measure Lick indices with the routine described in Puzia et al. (2002) and P04 for GCs with spectra with S/N per Å. In general, we select high-quality spectra for the subsequent analysis of evolutionary parameters, but include in some interesting cases a few lower-S/N spectra.
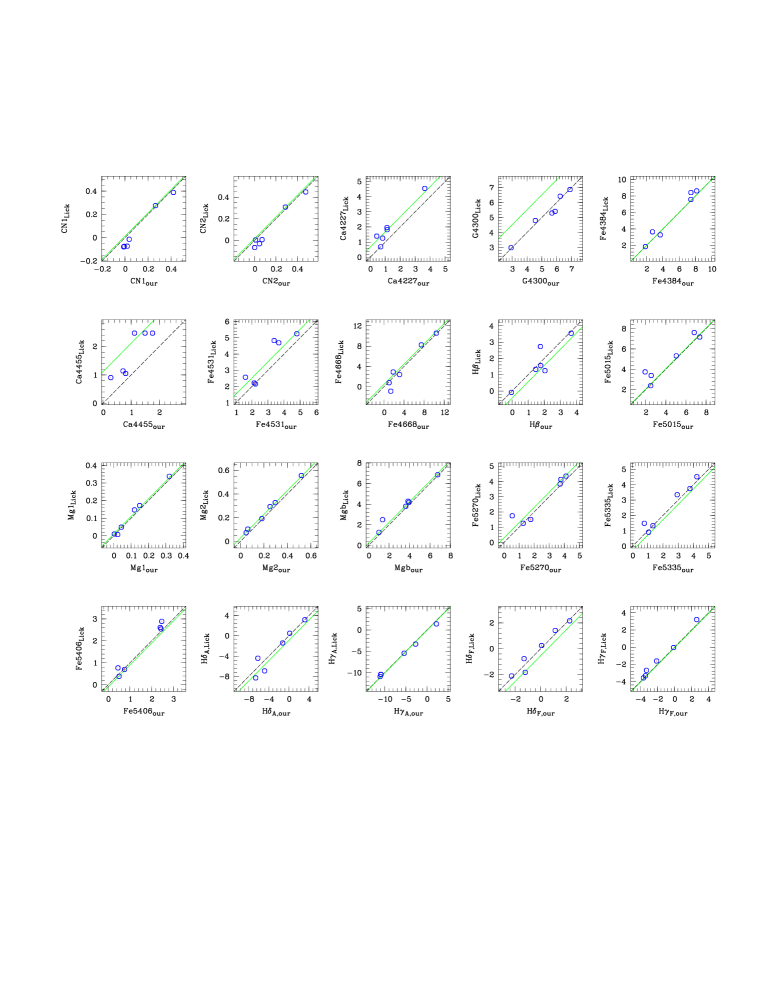
P04 calibrated the instrumental FORS/MXU system of Lick line indices into the standard one using a set of 31 Lick standard stars. The correction functions were calculated in the form
where and are the calibrated and the measured indices, respectively. To check the correspondence of our index measurements to the Lick standard system we performed the same analysis using 10 stars observed together with our target sample. It should be noted that all standard star spectra were observed with the same slit size (1″) and were extracted and smoothed in the same way as the GCs of our study and as it was done by P04. We show comparison of passband measurements of our spectra and original Lick data for our sample Lick standard stars in Figure 4. The dashed line shows the one-to-one relation. The dotted line shows the relation from P04. Table 6 summarises the coefficients of transformation into the Lick standard system and the rms of the calibration. Comparison of our calibration coefficients with the ones form P04 shows that in all cases but one the transformations agree well within the errors. A large difference exists for the index G4300. However, P04 noticed that this index is very noisy and its calibration uncertain. It is worth to note that the rms errors of transformations into the Lick system are large for some other indices (e.g. Ca4455, see Table 6 this paper and Table 8 in P04). However, the most important indices for our analysis, such as H, HγA, HδA, Mg1, Mg2, and Mg, Fe5270, and Fe5335 have all very robust Lick system calibrations which agree well with previous work. The calibrated Lick indices for all confirmed GCs in our sample are summarized in Table 10.
3.2. Ages and Metallicities
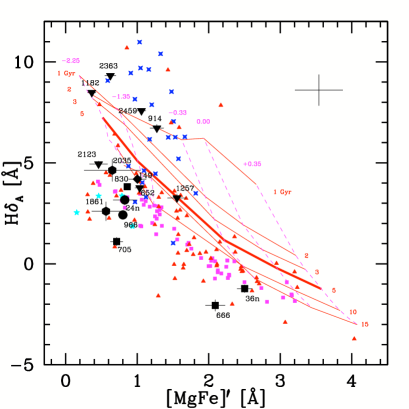
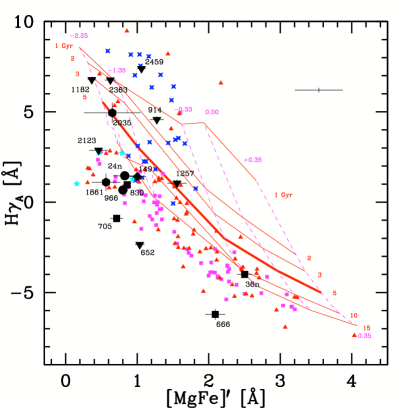
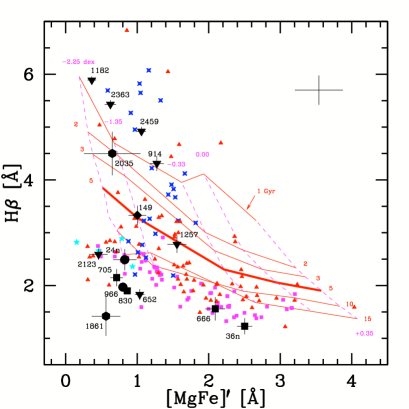
It was shown in series of papers (see e.g. P04, Puzia et al., 2005a, b) that age-metallicity diagnostic plots which make use of different Balmer indices and the composite metallicity index [MgFe]′555This composite Lick index is defined to be [/Fe]-insensitive, [MgFe]′, see Thomas et al. (2003) for details. represent a powerful tool to estimate ages and metallicities of globular clusters. For data with S/N per Å the Balmer index H is most sensitive to age and least sensitive to metallicity and [/Fe] variations, as well as the degeneracy between these parameters (Puzia et al., 2005b). The SSP model predictions of Thomas et al. (2003, 2004) for stellar populations with well-defined [/Fe] ratios provide us with the option to estimate [/Fe] ratio from Mg2 versus diagnostic plots.
In Figure 5 we show age-metallicity diagnostic plots for our sample globular clusters with the highest-S/N spectra. Almost all clusters have indices consistent with low metallicities, typically [Z/H] , and a wide range of ages and [/Fe] ratios. We compare the index measurements of our sample GCs with those of GCs in the Milky Way (Puzia et al., 2002; Schiavon et al., 2005), M31 (Puzia et al., 2005a), and the Large Magellanic Cloud (Beasley et al., 2002), and find that most objects in our sample have Balmer line indices, at a given [MgFe]′, that are comparable with metal-poor GCs in the Milky Way and M31 in all diagnostic plots of Figure 5. Several GCs in UGC 3755, which show stronger Balmer indices, resemble the sub-population of young star clusters in the LMC (e.g. Kerber et al., 2007).
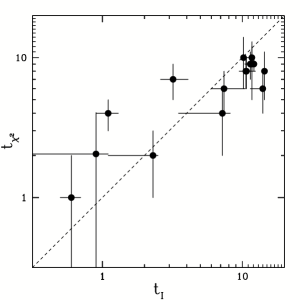
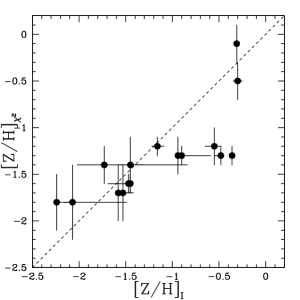
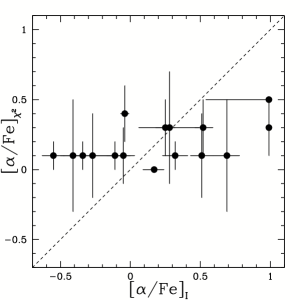
Iterating between the diagnostic plots in Figure 5 converges to give accurate metallicity and [/Fe] estimates, as well as robust relative ages that allow one to distinguish between old, intermediate-age, and young stellar populations. We refer to this approach as the iterative technique. Another way to obtain age, metallicity, and [/Fe] estimates is by means of linear interpolation within this three-dimensional space defined in the models and the subsequent minimization of the difference between observed and predicted indices (Sharina et al., 2006). This technique makes use of multiple Lick indices.
We apply both techniques to our dataset and summarize the results in Table 7. We show a comparison of the output results of the two techniques in Figure 6 and find good agreement for age and metallicity estimates with a scatter about the one-to-one relation that is consistent with the measurement uncertainties. The minimization technique appears to deliver a limited range of [/Fe] values compared to the iterative approach, which provides results more consistent with the general distribution of data in diagnostic plots of Figure 5. The technique works entirely within the parameter space defined by the model grids. The fact that it does not make use of extrapolations in the [/Fe] grid is likely the reason for the reduced [/Fe] dynamic range.
3.2.1 GCs in KK084
All observed globular clusters in this galaxy are old with ages Gyr. The central GC in KK84, KK084-3-830, has the lowest metallicity and the oldest age among all GCs in this galaxy. We find two metal-poor [Z/H] ) and two metal-rich clusters [Z/H] ). Both metal-rich clusters (KK84-36n and KK84-666) are located near NGC 3115 (see Figure 1) and have elevated radial velocities, which grants the possibility that they might be associated with the disk component of NGC 3115 rather than KK084. Our results for these two GCs are also in line with the VLT study of GCs in NGC 3115 by Kuntschner et al. (2002) and GMOS spectroscopy data for the diffuse light of NGC 3115 by Norris et al. (2006). Kuntschner et al. found two GC sub-populations with mean metallicities and dex. The absolute age was found Gyr for all observed GCs. The long-slit spectroscopy of the diffuse light in NGC 3115 by Norris et al. shows a luminosity-weighted age of 6 Gyr for the disk component and a luminosity-weighted age of 12 Gyr for the spheroid.
3.2.2 GCs in UGC 3755
GCs 1182, 2363, 2459, and 914 in the isolated dwarf irregular galaxy UGC 3755 appear to be the youngest objects in our sample with ages in the range Gyr. The other clusters in UGC 3755 are significantly older. One noteworthy case is U3755-3-1257, which shows an intermediate age and metallicity. The youngest GC in our sample has the smallest projected distance relative to the photometric center of the host galaxy.
3.2.3 GCs in ESO490-17
The two GCs in our sample that are associated with ESO490-17 are both metal-poor. Although our data for this galaxy has the lowest S/N, the age difference between the two GCs with high-quality spectra is seen clearly in the diagnostic plots of Figure 5. This difference is reflected in the integrated colors (see Table 5). In terms of projected distance, the young cluster GC 2035 is located closer to the galaxy center.
3.2.4 GCs in KK211
We find another intermediate-age GCs ( Gyr) in KK211, which appears to be the central star cluster of this dSph galaxy. The cluster age and metallicity estimates are consistent with the brightest intermediate-age AGB stars in this galaxy, 41 Gyr, , measured by Rejkuba et al. (2005).
3.2.5 GCs in KK221
The two brightest GCs in KK221 are old ( Gyr) and metal-poor [Z/H] ). It is difficult to assess whether these objects are associated with the center of K221 due to the very faint surface brightness profile of the host galaxy. However, both seem to be gravitationally bound judging from their radial velocities.
A mean radial velocity of all GCs in KK221 coincides well with the radial velocity of the brightest GC. We find a radial velocity anisotropy (rotation) among the GCs at the 95% confidence level, in the sense that the radial velocities of GCs 608, 883, and 966 located in the western edge of KK221 differ systematically from the radial velocities of GCs 1090, 24n, and 27n located in the eastern edge of the galaxy.
3.3. [/Fe] Ratios
Because of different progenitor lifetimes type-II and type-Ia supernovae enrich their ambient medium on different timescales. In consequence the chemical composition of stellar populations, together with their ages and metallicities, can be used to constrain their formation timescales. One good way to do so is to measure the [/Fe] ratios of stellar populations. Massive stars that live up to a few 100 Myr enrich the interstellar medium predominantly with -elements (Woosley et al., 2002), while type-Ia supernovae are delayed by Gyr and eject mainly iron-peak elements (Nomoto et al., 1997).
Besides ages and metallicities our fitting routines simultaneously determine [/Fe] ratios for all sample clusters. However, the resolution of the [/Fe] diagnostic grid decreases towards lower metallicities. Most of our sample GCs have relatively low [Z/H] values and the accuracy of [/Fe] values is reflected by the range of uncertainties, typically dex (see Figure 5 and Table 7). Our sample covers a wide range in [/Fe] much broader than what is expected from the average measurement uncertainty and, thus, implies significant chemical variance in the GC systems of dwarf galaxies. The mean [/Fe] for our sample is consistent with enhanced values with [/Fe] for the technique and for the iterative approach. This compares well with values of GCs in the Fornax dSph galaxy in the outskirts of the Milky Way (Strader et al., 2003a).
| Object | Age | [Z/H] | [/Fe] | AgeI | [Z/H]I | [/Fe]I |
| (Gyr) | (dex) | (dex) | (Gyr) | (dex) | (dex) | |
| KK211-3-149 | 62 | 0.3 | 0.10.3 | |||
| KK221-2-966 | 102 | 0.1 | 0.10.3 | |||
| KK221-24n | 92 | 0.3 | 0.30.4 | |||
| KK084-3-705 | 91 | 0.1 | 0.30.2 | |||
| KK084-3-830 | 104 | 0.1 | 0.30.2 | |||
| KK084-4-666 | 83 | 0.2 | 0.30.2 | |||
| KK084-36n | 82 | 0.2 | 0.10.2 | |||
| U3755-2-652 | 82 | 0.2 | 0.10.1 | |||
| U3755-3-914 | 41 | 0.1 | 0.0: | |||
| U3755-3-1182 | 21 | 0.4 | 0.10.4 | |||
| U3755-3-1257 | 72 | 0.2 | 0.10.1 | |||
| U3755-3-2123 | 62 | 0.3 | 0.10.4 | |||
| U3755-3-2363 | 22 | 0.2 | 0.10.1 | |||
| U3755-3-2459 | 11 | 0.1 | 0.40.2 | |||
| E490-17-2035 | 42 | 0.2 | 0.10.1 | |||
| E490-17-1861 | 94 | 0.3 | 0.5: | |||
| mean error | 6.40.7 | 0.11 | 0.190.04 | 8.1 | 0.180.12 | |
| std. deviation | 3.0 | 0.46 | 0.14 | 4.9 | 0.63 | 0.47 |
| median25%ile | 8.02.5 | 0.10.1 | 10.64.3 | 0.25 |
Interestingly, the mean [/Fe] of GCs in UGC 3755 is systematically lower than that of the rest of the sample. For the mean [/Fe] of UGC 3755 we find [/Fe] using the technique and with the iterative approach, while the rest of the sample has [/Fe] using the technique and using the iterative approach. In each case, this is a offset. In particular, the youngest GCs in UGC 3755 have the lowest [/Fe] ratios, but the small number statistics of this sub-sample makes the age-[/Fe] correlation marginally significant and we do not attempt to quantify this trend.
The two most metal-rich GCs, KK84-666 and KK84-36n, are an interesting pair in terms of their [/Fe] ratios. Although KK84-666 has roughly solar metallicity (see Table 7) its -element enhancement is relatively high, and comparable to those of Local Group GCs. KK84-36n, on the other hand, which has the second highest metallicity in our sample shows almost no -element enhancement, and clearly stands out compared with the rest of GCs in KK84. Together with its location, which puts it closer to NGC 3115 than KK84 (in terms of projected distance), its low [/Fe] ratio is yet another piece of evidence that this GCs is likely a member of the extended disk of NGC 3115 (see also Sect. 3.2.1).
We observe a relatively large fraction of low-[/Fe] GCs which are less frequent in the GC systems of Local Group spirals. In our sample of GCs have sub-solar [/Fe] ratios. In comparison, only % of GCs in the two Local Group spirals Milky Way and M31 which had their [/Fe] determined with the same technique have sub-solar [/Fe] values (Puzia et al., 2006). We point out that the sampled age, metallicity, and luminosity ranges for GCs in nearby LSB dwarf galaxies and Local Group spirals are not the same and that correlations between the [/Fe] and any of these parameters will likely alter the observed fraction of sub-solar [/Fe] clusters. If we restrict the Local Group spiral GC sample to intermediate and faint luminosity (), old ( Gyr), and metal-poor GCs ([Z/H] ) - the typical regime of our observed sample - the fraction of sub-solar [/Fe] clusters drops to , which is about 1.7 off compared to the fraction in our sample. The work of Pritzl et al. (2005) which derives mean [/Fe] ratios for Milky Way GCs from high-resolution spectroscopy of individual member stars shows an even lower fraction of %. Although this is the most representative comparison we can perform at the current state (given the limited sample statistics), we stress that GCs in dwarf and spiral galaxies are likely to have experienced different dynamical evolution histories. Star clusters of similar luminosity (mass) we observe today may have started off with very different initial masses. However, since only the most massive GCs are prone to self-enrichment (such as Cen, e.g. Recchi & Danziger, 2005; Villanova et al., 2007), the GCs in our sample should reflect the global chemical composition at the time of their formation, independent of their mass. Hence, we speculate that the somewhat lower fraction of Milky Way GCs with sub-solar [/Fe] may be an indication for significantly shorter star-formation and enrichment timescales compared to those in field dwarf galaxies.
3.4. Other Abundances
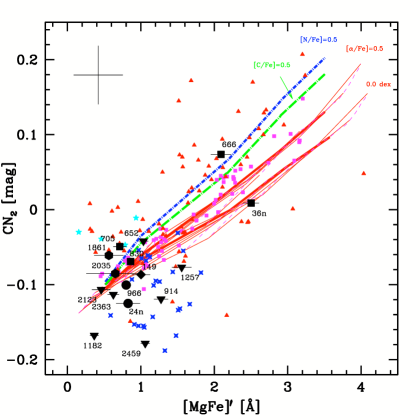
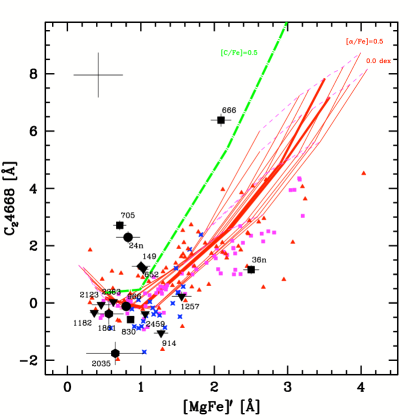
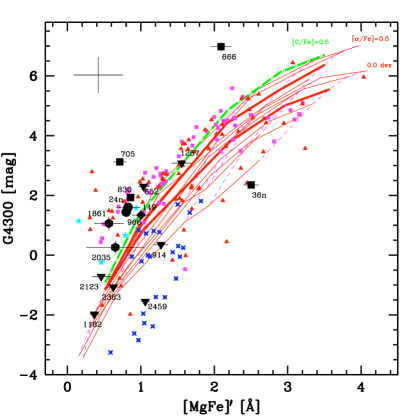
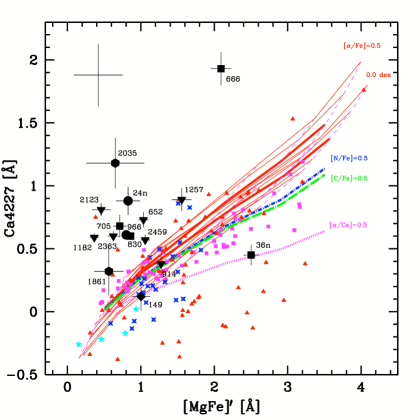
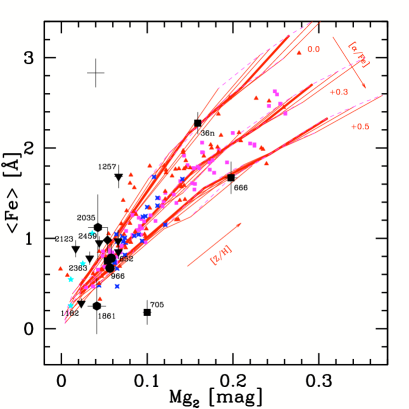
We conducted a detailed investigation of numerous other Lick index diagnostic diagrams. In Figure 7 we show diagnostic plots for indices that are sensitive to the abundance of carbon, nitrogen, and calcium (Tripicco & Bell, 1995). Because a strict quantitative analysis is not possible due to a lack of corresponding model predictions, we focus the following discussion on qualitative trends.
3.4.1 Carbon and Nitrogen
The CN2 versus [MgFe]′ diagram (upper left panel) shows significant scatter in CN index strength for our sample GCs, mostly ”below” the model grid towards lower CN2 index values. At metallicities typical for our sample GCs, this scatter cannot be accounted for by [/Fe] variations alone as it is demonstrated in the Figure by the two grid of population synthesis models for [/Fe] ratios of 0.0 and dex. It requires additional variance in, at least, one other element abundance to which the CN2 index is sensitive to match the observed distribution. To qualitatively test this hypothesis we explore the influence of carbon and nitrogen enhancement on the model grid using the predictions for C and N-enhanced models from Thomas et al. (2003). We overplot two isochrones for factor 3 enhanced C and N abundance at [/Fe] for a 5 Gyr old stellar population. We recall that the corresponding predictions for non-enhanced populations are plotted as thick lines in the two grids. The shape of the C/N-enhanced model grid is very similar to that of the non-enhanced predictions and for clarity reasons we avoid plotting the entire grid for the C/N-enhanced populations, and note that age and metallicity are highly degenerate in these grids and that both parameters have no impact on the following discussion.
The comparison of the enhanced models with our data in the CN2 vs. [MgFe]′ diagram shows that some GCs in dwarf galaxies appear to be highly under-abundant in C and/or N. This is particularly the case for GCs in UGC 3755, which exhibit on average significantly lower CN2 index values. However, from the variations in CN2 index strength alone we cannot decide whether chemical variance in carbon and/or nitrogen is responsible for the offsets.
A sanity check is provided by the C24668 and G4300 vs. [MgFe]′ diagrams which are both mildly sensitive to C abundance but not sensitive to N variations (Tripicco & Bell, 1995). Most GCs in the C24668 and G4300 vs. [MgFe]′ diagrams show relatively little deviations from the general trend of model predictions, and we infer that the abundance of carbon is less likely to change with respect to predictions of standard population synthesis models than the nitrogen abundance, which implies that the nitrogen abundance appears to vary significantly in GC systems of dwarf galaxies. We suggest that this pure qualitative result is being confirmed with higher resolution spectroscopic observations.
3.4.2 Calcium
In the Ca4227 vs. [MgFe]′ diagram we add a model which describes a stellar population with a factor 3 calcium under-abundance relative to the other -elements. In the Ca4227 vs. [MgFe]′ plot (lower right panel in Figure 7) many GCs in our sample show excess in Ca4227 index strength. The overplotted model for [/Ca] indicates that this offset may be due to a Ca enhancement in some GCs. As the absolute calibration of Ca abundance model predictions is still uncertain (see Cenarro et al., 2004; Prochaska et al., 2005), we merely point out this rather intriguing abundance pattern should be checked with higher resolution spectra.
4. Discussion
4.1. Chemical Tagging of GCs in LSB Dwarf Galaxies
The variance of GC chemical compositions in and outside the Local Group reveals complex enrichment histories. The old GCs in our sample with ages Gyr show marginally different [/Fe] ratios666[/Fe] using the technique and dex for the iterative approach. compared to the typical old GCs in the Local Group, which are -enhanced at dex (leaving out Pal12, Ter7, Rup106, and M68, see Pritzl et al., 2005, for details). The younger GCs in our sample with ages Gyr have significantly lower [/Fe] ratios777[/Fe] using the technique and dex for the iterative approach. and are comparable to Milky Way GCs associated with the Sagittarius remnant and other distinct GCs such as Ruprecht 106, Centauri, NCG 2419, which have [/Fe] (Pritzl et al., 2005).
Solar-type [/Fe] ratios are consistent with star formation timescales longer than Gyr, when ejecta of type-II and type-Ia supernovae are fully mixed in the interstellar medium (Greggio, 2005). [/Fe] ratios at dex indicate shorter and more intense cluster formation, on timescales of the order of a few hundred million years. This, in turn, suggest that some of the oldest GCs in our sample were formed relatively early, at similar epochs as the typical Milky Way GC. Less -enhanced GCs, on the other hand, likely formed Gyr after the Big Bang at or later, which would place their formation period at the end of reionization or thereafter (e.g. Kashikawa et al., 2006; Benson et al., 2006).
The characteristic chemical compositions limit the fraction of accreted GCs from satellite LSB-type galaxies during the assembly process of Local Group spirals galaxies. Given the difference in -enhanced to non--enhanced GCs between our sample and the Local Group spirals (see Sect. 3.3), our results imply that to qualify as potential building block for the two massive Local Group spirals in the hierarchical picture of galaxy formation, LSB dwarf galaxies would either have to i) cease forming star clusters long before the beginning of enrichment by type-Ia supernovae before being accreted much later by a more massive halo or ii) being accreted when the gas out of which star clusters were forming was still not polluted by type-Ia supernovae.
Other element abundance ratios provide us with the opportunity to chemically tag GCs that were formed in the field environment and later accreted by more massive galaxy halos, much like the chemical tagging of accreted stellar sub-populations that are part of the diffuse-light component in nearby galaxies (Freeman & Bland-Hawthorn, 2002; Geisler et al., 2007). For instance, at a given [MgFe]′ index (i.e. total metallicity) the carbon and nitrogen enhancement of our sample GCs is consistent with that of Galactic GCs, but fails to match the chemical composition of M31 GCs which have excess CN2 indices (see Fig. 7). It was shown in a series of studies that the higher CN2 index values for old M31 GCs are due to a nitrogen enhancement by at least a factor of three compared to the younger cluster population (Li & Burstein, 2003; Burstein et al., 2004; Beasley et al., 2005; Puzia et al., 2005a). We remind the reader that the comparison sample of M31 GCs is biased towards disk clusters and samples only poorly the halo GC population (see Fig. 1 in Puzia et al., 2005a), where accreted objects are more likely to reside. Interestingly, although the CN2 indices of the N-enriched M31 GCs do not match our sample GCs, similar N-enhancement can be suspected in GCs of the Fornax dSph galaxy (see Fig. 7). We conclude that it is relatively unlikely that M31 accreted a significant amount GCs from satellite dwarfs similar to those in our sample on orbits close to the plane of the M31 disk. On the other hand, judging from Figure 7 the average C/Fe and N/Fe chemistry of our sample GCs appears to be similar to the one of metal-poor Milky Way GCs. We currently lack the spectroscopic database of outer-halo GCs in the two Local Group spirals to further constrain the selective accretion history of these massive spiral galaxies.
4.2. Specific Frequencies of GCs in LSB Dwarf Galaxies
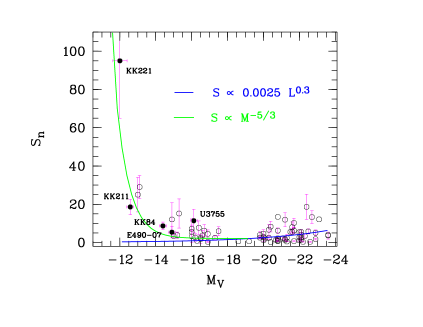
The specific frequency, , (Harris & van den Bergh 1981) is defined as the number of globular clusters per unit mag of host galaxy light: . It is tightly related to cluster formation efficiency, which is varying as a function of host galaxy’s morphological type, mass, and local environmental density (e.g. Harris, 1991; Richtler, 1995). Kumai et al. (1993) and West (1993) found a significant trend of increasing with increasing environmental density. Another observational fact is that values grow for nucleated dwarf galaxies with decreasing galactic mass (e.g. Miller et al., 1998).
Figure 8 illustrates the diagram, where the galaxy luminosity is plotted against the GC specific frequency. Our five sample LSB galaxies are shown as solid circles, while data for dwarf galaxies in the Virgo cluster (Durrell et al., 1996) and more massive early-type galaxies (Harris, 1991) are shown as open symbols. The solid line is a model for which (McLaughlin, 1999), where a constant number of GCs per unit mass is formed with an efficiency , and the mass of gas is much lower than the stellar mass. This thin line shows the mass-loss model , which follows from (Dekel & Woo, 2003) or (Dekel & Silk, 1986). The vertical normalization of this model is arbitrary and was chosen to fit the dwarf galaxy data.
We point out the similarity of values for field and cluster dwarf galaxies at a given galaxy luminosity, especially for faint galaxies. Provided not a size-of-sample effect, this result implies that environment is not the driving parameter for the correlation for dwarf galaxies. Less massive galaxies lose gas more efficiently because objects with shallower potential wells develop galactic winds more easily (e.g., Arimoto & Yoshii 1987; Matteucci 1994), and it seems plausible that internal factors, such as galactic winds, are shaping the relation of dwarf galaxies. These results require further testing with larger galaxy samples.
A particularly interesting fact is that dIrr and dSph galaxies seem to follow the same trend. At face value, this appears to be in contrast with chemical evolution models and observations of abundance ratios in low-mass galaxies. For instance, Lanfranchi & Matteucci (2003) concluded that one or two long starbursts with very efficient winds well describe the chemical evolution of dSphs. On the other hand, blue compact galaxies are characterized by a star formation history proceeding in several short bursts separated by long quiescent periods. Given varying star formation histories, similar relations for both dIrr and dSph galaxies require that the fading of the galaxy light and the dynamical evolution of the globular cluster system are tightly related.
Passive evolution of dIrr galaxies leads to a fading of up to mag of their integrated magnitudes if they were to abruptly stop forming stars (Hunter & Gallagher, 1985). Assuming a non-changing , this requires the disruption of of all formed star clusters, and is in line with observations of the so-called cluster “infant mortality” in nearby young star cluster systems (Chandar et al., 2006; Whitmore et al., 2007). This also suggests that the effects of tidal forces acting in group and cluster environments are linked in disrupting star clusters and their host dIrr LSB galaxies (Gnedin, 2003; Georgiev et al., 2006). We suggest a detailed study of globular cluster systems in low-mass galaxies sampling galaxy mass, morphology, and environmental density to test our findings.
4.3. Nuclei of Dwarf Galaxies
Our spectroscopic study shows that some of the lowest mass galaxies ( mag) can have nuclear star clusters, i.e. the brightest GC is located near the optical center of a galaxy. The two most prominent cases in our data set are KK211-149, and KK84-830. Both have low metallicities [Z/H] , see Tab. 7). KK211-149 is an intermediate-age GC, while KK84-830 is old. Both nuclear clusters are found in dwarf galaxies located in close vicinity to massive galaxies, NGC 5128 and NGC 3115, respectively.
McLaughlin et al. (2006) have shown that the limiting mass of a central massive object in dwarf galaxies is defined as follows:
| (1) |
where is the massive-star feedback equal to for a nuclear star cluster, , and the baryon fraction (Spergel et al., 2003). So, a limiting mass of a nucleus in dSph galaxies with is in the range , the mass range of Local Group globular clusters. We compute the total masses for both our nuclear clusters from the photometric information in Tables 5 and 7 using the population synthesis prediction of Bruzual & Charlot (2003) assuming a Salpeter IMF. We find for KK211-149 and for KK84-830. A more ”top-heavy” IMF compared to the Salpeter IMF would bring both mass estimates in better agreement. Indications for a ”top-heavy” IMF are found in the central stellar populations of the Milky Way (Nayakshin et al., 2006, 2007). Heated molecular clouds are suspected to produce ”top-heavy” IMFs due to a simultaneous increase in the thermal Jeans mass and the collisional destruction of low-mass stellar cores (Elmegreen & Shadmehri, 2003).
The two nuclear star clusters are massive and compact enough to survive a Hubble time in isolated galaxies in the absence of dynamical factors, such as tidal interactions, galaxy-galaxy encounters, interaction with ISM, etc. Using the structural parameters determined in Sharina et al. (2005) and the evolution models of Fall & Zhang (2001) we compute a mass-loss of 7% for KK211-149 and 3% for KK84-830 over the next 12 Gyr due to two-body relaxation. Including tidal interactions on orbits typical for Milky Way GCs, as adopted by Fall & Zhang, these fractions increase by a factor . So far we know of only one nucleated early-type dwarf galaxy (Sagittarius dSph) in the Milky Way subgroup, a few in the M31 subgroup, and none in the Canes Venatici Cloud, and among isolated nearby LV galaxies (e.g. Grebel, 2006, and references therein). The absolute number of nucleated early-type dwarf galaxies is higher in denser environments, such as the Fornax and Virgo galaxy clusters (e.g. Binggeli et al., 1985; Miller et al., 1998; Côté et al., 2006; Lisker et al., 2007). Although this suggests that the process of nucleation in cluster dwarf galaxies is likely driven by dynamical factors that depend on the local environmental density, the nucleation fraction among dwarf galaxies in different environments appears to be roughly constant. Compared to the few nucleated dwarfs in the Local Group with a total mass of (Karachentsev & Kashibadze, 2005; van den Bergh, 2006), the Virgo galaxy cluster holds nucleated dwarfs (Sandage et al., 1985) and has a total dynamical mass of (Fouqué et al., 2001). Hence, our back of the envelope calculation suggests similar nucleation fractions as a function of the total group/cluster mass. But, of course, these numbers are very rough, especially for the Virgo cluster, where the number of galaxies with nuclear star clusters grows with higher spatial resolution (Côté et al., 2006). Clearly, a larger sample is necessary to assess the frequency of nuclear clusters among field dwarf galaxies.
5. Conclusions
Numerous photometric and spectroscopic studies of globular clusters in Virgo and Fornax cluster dwarf galaxies have been undertaken in the last years, which targeted bright dwarf galaxies down to mag (see Miller, 2006). Due to observational selection effects dwarf galaxies fainter than this are missed at distances of Mpc. Faint LSB dwarf galaxies down to mag have long been thought to be free of globular clusters, because they have insufficient mass. Our HST/WFPC2 survey of low-mass dwarf galaxies (SPM05), situated at distances Mpc in the Local Volume, revealed a rich population of globular cluster candidates (GCCs). In this work, we observed five of these galaxies with the VLT/FORS2 spectrograph in MXU mode and found that all targeted GCCs except one are genuine globular clusters. We could also confirm five additional globular clusters in our sample galaxies. Two clusters appear to be the nuclei of KK84 and KK211. The confirmed globular clusters are in general old and metal-poor, and show a range of [/Fe] ratios. The mean [/Fe] that was determined with the minimization technique and dex which was computed using the iterative approach appears slightly lower than the mean [/Fe] for typical Milky Way clusters. Globular clusters in the two isolated, relatively bright dwarf galaxies UGC 3755 and ESO 490-17 show a wide range of ages from 1 to 9 Gyr, and imply extended star formation histories in these galaxies. This goes in hand with the measured low [/Fe] ratios for the younger clusters and is consistent with low intensity star bursts. The oldest clusters with the highest [/Fe] are found in KK84, a companion of NGC 3115. Other chemical abundances indicate potentially interesting differences between globular clusters in dwarf and more massive galaxies and, if confirmed, would facilitate the quantification of the accreted mass in rich GC systems of massive early-type galaxies.
Appendix A Surface Brightness Profiles
Fundamental structural parameters of galaxies determined from their surface brightness (SB) profiles provide valuable information about processes of galaxy formation (e.g Kormendy, 1985; Dekel & Silk, 1986). In Tables 1 and 9 we show fundamental photometric parameters obtained for our sample galaxies using our SB profiles. The and SB profiles and the corresponding distributions are presented in Figure 9. The errors of SB profile determination depend primarily on the accuracy of the background estimates and the position of the galactic center. The background estimates are relatively uncertain in cases where bright stars are projected on top of the SB profile. That is why our surface photometry results should be taken as rough estimates for this extremely low surface brightness dwarf galaxy KK221. The choice of a center is complicated for dwarf irregular galaxies with multiple, bright star-forming regions. Given all uncertainties we estimate typical error of the integrated visual magnitude of the order of mag. The errors of the SB profiles are oveplotted in the distributions of colors in Figure 9.
The solid lines overplotted on the SB profiles show the Sersic law approximation. The Sersic model (Sersic, 1968) describes SB profiles of the form:
where is the SB (in intensity) at radius , is the central surface brightness, is the effective half-intensity radius, , and is the dimensionless shape parameter that determines the curvature of the profile. For the profiles become flat in the central part, while for they are cuspy. The best-fitting parameters of the Sersic profile are presented in Table 9. It should be noted that central bright objects such as GCs or star forming regions were excluded from the fit.
Table 8 summarizes the literature data on the fundamental photometric parameters of our sample galaxies. One can see, that in general our photometric results agree fairly well with the literature data. However, the shape parameter determined by Jerjen et al. (2000) for KK211 implies a flatter profile than ours. The color profile is irregular for our sample dIrrs and for KK221, for which the sky subtraction is difficult.
The Sersic index appears to be similar for all our sample dwarf galaxies, except KK221, which may be tidally disrupted. The SB profile for KK221 is two times flatter than for the other sample galaxies. Similarity of fundamental parameters for rotating and non-rotating dwarf galaxies of different morphological type and situated in different environments may indicate that the internal structure of such faint galaxies is primarily defined by their mass.

Appendix B Mass estimate for KK221
To derive the mass of KK221 we use the mass estimator for tracer populations (Evans et al., 2003):
| (B1) |
where
| (B2) |
Here, is the system’s mean radial velocity and the anisotropy parameter which is unity for purely radial orbits and for a system with solely tangential orbits (Binney, 1981).
Using the power-law rule (Gebhardt et al., 1996) to derive the three-dimensional density profile of the GC population, we obtain from the Sersic index of KK221 SB distribution (see Table 1), and . We use here the anisotropy parameter for randomly oriented orbits, and radii of orbits of the nearest and most distant GC kpc and kpc (Sharina et al., 2005), correspondingly. The statistically unbiased estimate of the mass value is , where is the rms error of the radial velocity measurements, and is the rms velocity of GCs relative to the mean velocity of GC system, with a number of GCs equal k (Karachentsev et al., 1999). in our case. So, we obtain the statistically unbiased estimate of the mass for KK221 , and the corresponding mass-to-light ratio . Corrected for the effect of radial velocity anisotropy (Sec. 3.2), the mass-to-light ratio appears to be . The expected uncertainty of the total mass estimate is % taking into account the small number of GCs. In our case where the number of GCs is six, the error of the velocity dispersion measurement is % of the value of the velocity dispersion itself.
| Galaxy | B | h(″) | Reference | |||
|---|---|---|---|---|---|---|
| KK211 | 16.32 | 1.56 | 21.1 | 24.48 | Jerjen et al. (2000) | |
| KK84 | 16.16 | 1.38 | 17.99 | 23.19 | 10.59 | Parodi et al. (2002) |
| U3755 | 14.07 | 21.64 | 12.62 | Makarova (1999) | ||
| E490-017 | 13.67 | 0.83 | 22.83 | 21.30 | 13.28 | Parodi et al. (2002) |
| Galaxy | n | |||||
|---|---|---|---|---|---|---|
| KK221 | 26.000.20 | 24.200.20 | 32.30.5 | 0.400.20 | 7819 | 859 |
| KK211 | 24.510.12 | 22.600.15 | 24.10.1 | 0.850.15 | 241 | 891 |
| KK084 | 24.040.07 | 22.400.07 | 19.40.4 | 0.790.01 | 171 | 751 |
| U3755 | 22.010.05 | 20.980.10 | 22.60.1 | 0.850.05 | ||
| E490-17 | 22.450.20 | 21.290.05 | 26.41.2 | 0.760.04 |
Appendix C Lick Index Measurements
We provide the calibrated Lick index measurements of all confirmed GCs in Table 10.
| ID | H | H | H | H | CN1 | CN2 | Ca4227 | G4300 | Fe4383 | Ca4455 | Fe4531 | Fe4668 | H | Fe5015 | Mg1 | Mg2 | Mgb | Fe5270 | Fe5335 | Fe5406 |
|---|---|---|---|---|---|---|---|---|---|---|---|---|---|---|---|---|---|---|---|---|
| (S/N) | (Å) | (Å) | (Å) | (Å) | (mag) | (mag) | (Å) | (Å) | (Å) | (Å) | (Å) | (Å) | (Å) | (Å) | (mag) | (mag) | (Å) | (Å) | (Å) | (Å) |
| KK211 | ||||||||||||||||||||
| 149 | 4.19 | 1.41 | 2.98 | 2.69 | -0.1272 | -0.0867 | 0.12 | 1.34 | 1.93 | 0.07 | 1.19 | 1.28 | 3.33 | 2.56 | -0.0142 | 0.0538 | 1.05 | 0.93 | 1.03 | 0.21 |
| (40) | 0.22 | 0.23 | 0.23 | 0.23 | 0.0021 | 0.0031 | 0.11 | 0.12 | 0.14 | 0.14 | 0.15 | 0.18 | 0.18 | 0.19 | 0.0050 | 0.0050 | 0.20 | 0.20 | 0.20 | 0.21 |
| KK221 | ||||||||||||||||||||
| 966 | 2.42 | 0.67 | 2.21 | 2.25 | -0.1319 | -0.1006 | 0.61 | 1.44 | 1.05 | 0.39 | 1.79 | -0.12 | 1.97 | 1.93 | 0.0065 | 0.0566 | 0.85 | 0.86 | 0.48 | 0.14 |
| (85) | 0.09 | 0.09 | 0.09 | 0.10 | 0.0007 | 0.0011 | 0.04 | 0.04 | 0.05 | 0.05 | 0.06 | 0.07 | 0.07 | 0.08 | 0.0020 | 0.0020 | 0.08 | 0.08 | 0.08 | 0.09 |
| 24n | 3.16 | 1.46 | 3.30 | 2.43 | -0.0963 | -0.1251 | 0.88 | 1.60 | -0.73 | 0.27 | 1.20 | 2.29 | 2.49 | 1.74 | 0.0119 | 0.0581 | 0.66 | 1.36 | 0.20 | -0.18 |
| (35) | 0.24 | 0.24 | 0.25 | 0.25 | 0.0019 | 0.0029 | 0.11 | 0.12 | 0.15 | 0.15 | 0.17 | 0.20 | 0.20 | 0.21 | 0.0054 | 0.0055 | 0.22 | 0.22 | 0.22 | 0.22 |
| KK084 | ||||||||||||||||||||
| 705 | 1.10 | -0.90 | 2.00 | 1.97 | -0.1074 | -0.0493 | 0.68 | 3.12 | 0.57 | 0.83 | 1.42 | 2.71 | 2.15 | 1.35 | 0.0333 | 0.1000 | 1.36 | 0.62 | -0.26 | 1.02 |
| (31) | 0.21 | 0.21 | 0.22 | 0.22 | 0.0018 | 0.0027 | 0.09 | 0.10 | 0.13 | 0.13 | 0.14 | 0.16 | 0.16 | 0.18 | 0.0047 | 0.0047 | 0.18 | 0.19 | 0.19 | 0.19 |
| 830 | 3.82 | 0.96 | 2.81 | 2.06 | -0.1075 | -0.0693 | 0.60 | 1.93 | 1.38 | 0.80 | 0.01 | -0.58 | 1.90 | 1.83 | 0.0182 | 0.0536 | 0.80 | 1.15 | 0.35 | -0.21 |
| (47) | 0.07 | 0.07 | 0.07 | 0.07 | 0.0006 | 0.0009 | 0.03 | 0.03 | 0.04 | 0.04 | 0.05 | 0.06 | 0.06 | 0.06 | 0.0016 | 0.0016 | 0.06 | 0.06 | 0.07 | 0.07 |
| 666 | -2.06 | -6.21 | 0.07 | -1.40 | 0.0343 | 0.0736 | 1.93 | 6.98 | 4.65 | 2.25 | 3.02 | 6.38 | 1.56 | 2.95 | 0.0643 | 0.1977 | 2.58 | 1.73 | 1.61 | 1.28 |
| (24) | 0.28 | 0.29 | 0.30 | 0.30 | 0.0025 | 0.0041 | 0.13 | 0.15 | 0.18 | 0.18 | 0.19 | 0.22 | 0.22 | 0.24 | 0.0072 | 0.0073 | 0.24 | 0.25 | 0.25 | 0.25 |
| 36n | -1.23 | -4.00 | -0.45 | -0.23 | -0.0374 | 0.0087 | 0.45 | 2.35 | -0.08 | 0.62 | 2.22 | 1.16 | 1.23 | 5.91 | 0.0592 | 0.1589 | 2.60 | 2.58 | 1.97 | -0.21 |
| (23) | 0.19 | 0.19 | 0.20 | 0.20 | 0.0018 | 0.0026 | 0.08 | 0.09 | 0.12 | 0.12 | 0.13 | 0.15 | 0.15 | 0.16 | 0.0044 | 0.0044 | 0.17 | 0.17 | 0.17 | 0.00 |
| U3755 | ||||||||||||||||||||
| 652 | 3.76 | -2.35 | 3.15 | 0.83 | -0.0868 | -0.0420 | 0.73 | 2.30 | 3.12 | 0.85 | 1.85 | 1.17 | 1.83 | 1.94 | 0.0194 | 0.0665 | 1.16 | 1.02 | 0.68 | 0.24 |
| (42) | 0.12 | 0.12 | 0.12 | 0.12 | 0.0011 | 0.0017 | 0.06 | 0.06 | 0.08 | 0.08 | 0.08 | 0.09 | 0.10 | 0.10 | 0.0028 | 0.0029 | 0.11 | 0.11 | 0.11 | 0.11 |
| 914 | 6.72 | 4.57 | 4.47 | 4.03 | -0.1930 | -0.1193 | 0.38 | 0.35 | -1.28 | 0.83 | 0.26 | -1.05 | 4.31 | 0.08 | -0.0001 | 0.0661 | 1.47 | 1.28 | 0.66 | 0.36 |
| (23) | 0.18 | 0.18 | 0.18 | 0.18 | 0.0012 | 0.0017 | 0.06 | 0.07 | 0.09 | 0.09 | 0.10 | 0.13 | 0.14 | 0.15 | 0.0036 | 0.0037 | 0.16 | 0.17 | 0.17 | 0.17 |
| 1182 | 8.48 | 6.78 | 6.49 | 5.38 | -0.2120 | -0.1678 | 0.59 | -1.98 | -0.41 | -0.17 | 1.13 | -0.34 | 5.89 | 2.17 | -0.0153 | 0.0232 | 0.25 | 0.86 | -0.30 | -0.27 |
| (49) | 0.08 | 0.08 | 0.08 | 0.08 | 0.0006 | 0.0009 | 0.03 | 0.04 | 0.04 | 0.05 | 0.05 | 0.06 | 0.07 | 0.07 | 0.0017 | 0.0017 | 0.07 | 0.07 | 0.08 | 0.08 |
| 1257 | 3.26 | 1.05 | 2.84 | 2.30 | -0.0894 | -0.0769 | 0.89 | 3.08 | -0.10 | 0.51 | 0.73 | 0.23 | 2.78 | 3.00 | 0.0197 | 0.0667 | 1.25 | 2.26 | 1.11 | 1.02 |
| (25) | 0.20 | 0.20 | 0.20 | 0.21 | 0.0019 | 0.0026 | 0.09 | 0.10 | 0.12 | 0.12 | 0.13 | 0.16 | 0.16 | 0.17 | 0.0045 | 0.0046 | 0.18 | 0.18 | 0.18 | 0.18 |
| 2123 | 4.94 | 2.87 | 3.41 | 3.16 | -0.1327 | -0.1067 | 0.81 | -0.72 | 1.50 | 1.31 | 2.31 | -0.06 | 2.59 | 0.25 | -0.0020 | 0.0167 | 0.24 | 0.88 | 0.89 | 0.26 |
| (31) | 0.14 | 0.14 | 0.14 | 0.14 | 0.0010 | 0.0014 | 0.05 | 0.06 | 0.07 | 0.07 | 0.08 | 0.10 | 0.10 | 0.11 | 0.0028 | 0.0029 | 0.12 | 0.13 | 0.13 | 0.13 |
| 2363 | 9.32 | 6.76 | 6.03 | 6.02 | -0.1690 | -0.1133 | 0.60 | -1.07 | 0.93 | 0.31 | 1.66 | 0.04 | 5.43 | 1.20 | 0.0091 | 0.0330 | 0.47 | 0.90 | 0.66 | -0.52 |
| (38) | 0.10 | 0.12 | 0.11 | 0.11 | 0.0007 | 0.0012 | 0.04 | 0.05 | 0.06 | 0.06 | 0.07 | 0.08 | 0.08 | 0.09 | 0.0023 | 0.0023 | 0.10 | 0.10 | 0.10 | 0.10 |
| 2459 | 7.58 | 7.39 | 5.88 | 5.54 | -0.2170 | -0.1784 | 0.57 | -1.55 | -1.01 | 0.30 | 1.37 | -0.38 | 4.92 | 1.18 | 0.0048 | 0.0442 | 1.03 | 1.27 | 0.63 | -0.13 |
| (44) | 0.10 | 0.10 | 0.10 | 0.10 | 0.0007 | 0.0011 | 0.04 | 0.04 | 0.05 | 0.06 | 0.06 | 0.08 | 0.08 | 0.08 | 0.0022 | 0.0022 | 0.09 | 0.10 | 0.10 | 0.10 |
| E490-17 | ||||||||||||||||||||
| 2035 | 4.63 | 4.94 | 4.84 | 4.94 | -0.1082 | -0.0853 | 1.18 | 0.26 | 0.21 | 0.33 | 0.11 | -1.76 | 4.50 | 0.64 | 0.0084 | 0.0426 | 0.47 | 0.63 | 1.61 | 0.38 |
| (13) | 0.55 | 0.56 | 0.56 | 0.57 | 0.0035 | 0.0055 | 0.20 | 0.21 | 0.26 | 0.27 | 0.30 | 0.40 | 0.41 | 0.45 | 0.0111 | 0.0113 | 0.49 | 0.51 | 0.52 | 0.53 |
| 1861 | 2.60 | 1.10 | 2.93 | 1.90 | -0.0666 | -0.0611 | 0.32 | 1.06 | -0.40 | 1.25 | 0.07 | -0.38 | 1.42 | 1.17 | 0.0224 | 0.0413 | 1.10 | 0.34 | 0.16 | 0.36 |
| (17) | 0.47 | 0.48 | 0.49 | 0.49 | 0.0038 | 0.0055 | 0.19 | 0.22 | 0.27 | 0.27 | 0.31 | 0.37 | 0.37 | 0.40 | 0.0105 | 0.0106 | 0.42 | 0.43 | 0.44 | 0.44 |
References
- Barmby et al. (2000) Barmby, P., Huchra, J. P., Brodie, J. P., Forbes, D. A., Schroder, L. L., & Grillmair, C. J. 2000, AJ, 119, 727
- Beasley et al. (2002) Beasley, M. A., Hoyle, F., & Sharples, R. M. 2002, MNRAS, 336, 168
- Beasley et al. (2005) Beasley, M. A., Brodie, J. P., Strader, J., Forbes, D. A., Proctor, R. N., Barmby, P., & Huchra, J. P. 2005, AJ, 129, 1412
- Beasley et al. (2006) Beasley M.A., Strader J., Brodie J.P, Cenarro A.J., Geha M. 2006, AJ, 131, 814
- Benson et al. (2006) Benson, A. J., Sugiyama, N., Nusser, A., & Lacey, C. G. 2006, MNRAS, 369, 1055
- Bicay & Giovanelli (1986) Bicay M.D., Giovanelli R. 1986, AJ, 91, 732
- Binggeli et al. (1985) Binggeli, B.; Sandage, A.; Tammann, G. A. 1985, AJ, 90, 1681
- Binney (1981) Binney, J. 1981, Structure and Evolution of Normal Galaxies, eds. D. Lynden-Bell & S.M. Fall, Cambridge University Press, Cambridge
- Bruzual & Charlot (2003) Bruzual, G., & Charlot, S. 2003, MNRAS, 344, 1000
- Burstein et al. (2004) Burstein, D., et al. 2004, ApJ, 614, 158
- Cenarro et al. (2004) Cenarro, A. J., Sánchez-Blázquez, P., Cardiel, N., & Gorgas, J. 2004, ApJ, 614, L101
- Chandar et al. (2006) Chandar, R., Fall, S. M., & Whitmore, B. C. 2006, ApJ, 650, L111
- Clemens et al. (2006) Clemens, M. S., Bressan, A., Nikolic, B., Alexander, P., Annibali, F., & Rampazzo, R. 2006, MNRAS, 370, 702
- Conselice (2006) Conselice, C. J. 2006, ApJ, 639, 120
- Côté et al. (1998) Côté, P., Marzke, R. O., & West, M. J. 1998, ApJ, 501, 554
- Côté et al. (2002) Côté, P., West, M. J., & Marzke, R. O. 2002, ApJ, 567, 853
- Côté et al. (2006) Côté, P., et al. 2006, ApJS, 165, 57
- Dekel & Woo (2003) Dekel A. & Woo J. 2003, MNRAS, 344, 1131
- Dekel & Silk (1986) Dekel A., Silk J. 1986, ApJ, 303, 39
- De Lucia et al. (2006) De Lucia, G., Springel, V., White, S. D. M., Croton, D., & Kauffmann, G. 2006, MNRAS, 366, 499
- Di Criscienzo et al. (2006) Di Criscienzo, M., Caputo, F., Marconi, M., & Musella, I. 2006, MNRAS, 365, 1357
- Durrell et al. (1996) Durrel P., Harris W., Geisler D., Pudritz 1996, AJ, 112, 972
- Ellis (2007) Ellis, R. S 2007, in ‘First Light in Universe’, Saas-Fee Advanced Course 36, (arXiv:astro-ph/0701024)
- Elmegreen & Shadmehri (2003) Elmegreen, B. G., & Shadmehri, M. 2003, MNRAS, 338, 817
- Evans et al. (2003) Evans N.W., Wilkinson M.I., Perrett K.M., Bridges T.J. 2003, ApJ, 583, 752
- Fall & Zhang (2001) Fall, S. M., & Zhang, Q. 2001, ApJ, 561, 751
- Forte et al. (1982) Forte, J. C., Martinez, R. E., & Muzzio, J. C. 1982, AJ, 87, 1465
- Fouqué et al. (2001) Fouqué, P., Solanes, J. M., Sanchis, T., & Balkowski, C. 2001, A&A, 375, 770
- Freeman & Bland-Hawthorn (2002) Freeman, K., & Bland-Hawthorn, J. 2002, ARA&A, 40, 487
- Gebhardt et al. (1996) Gebhardt et al. 1996, AJ, 112, 105
- Geisler et al. (2007) Geisler, D., Wallerstein, G., Smith, V. V., & Casetti-Dinescu, D. I. 2007, ArXiv e-prints, 708, arXiv:0708.0570
- Georgiev et al. (2006) Georgiev, I. Y., Hilker, M., Puzia, T. H., Chanamé, J., Mieske, S., Goudfrooij, P., Reisenegger, A., & Infante, L. 2006, A&A, 452, 141
- Gnedin (2003) Gnedin O.Y. 2003, ApJ, 589, 752
- Grebel (1999) Grebel E.K. 1999 IAU Symp. 192, eds. P. Whitelock and R. Cannon ASP Conf. Ser., 17
- Grebel (2006) Grebel, E. K. 2006, ArXiv Astrophysics e-prints, arXiv:astro-ph/0605564
- Grebel et al. (2003) Grebel E.K., Gallagher III J.S., Harbeck D. 2003, AJ, 125, 1926
- Greggio (2005) Greggio, L. 2005, A&A, 441, 1055
- Harris & van den Bergh (1981) Harris, W. E., & van den Bergh, S. 1981, AJ, 86, 1627
- Harris (1991) Harris, W. E. 1991, ARA&A, 29, 543
- Hilker et al. (1999) Hilker, M., Infante, L., & Richtler, T. 1999, A&AS, 138, 55
- Holtzman et al. (2006) Holtzman J.A., Afonso C., Dolphin A. 2006, ApJ, 166, 534
- Hunter & Gallagher (1985) Hunter D. A., Gallagher J. S. 1985, ApJS, 58, 533
- Impey & Bothun (1997) Impey, C., & Bothun, G. 1997, ARA&A, 35, 267
- James et al. (2005) James, P. A., Shane,N. S., Knapen, J. H., Etherton, J., Percival, S. M. 2005, A&A, 429, 851
- Jerjen et al. (2000) Jerjen H., Binggeli B., Freeman K.C. 2000, AJ, 119, 593
- Jordán et al. (2007) Jordán, A., et al. 2007, ApJS, 171, 101
- Karachentseva et al. (1985) Karachentseva, V. E., Karachentsev, I. D., & Boerngen, F. 1985, A&AS, 60, 213
- Karachentsev et al. (1999) Karachentsev, I. D. 1999
- Karachentsev et al. (2004) Karachentsev, I. D., Karachentseva, V. E., Huchtmeier, W. K., Makarov, D. I. 2004, AJ, 127, 2031
- Karachentsev & Kashibadze (2005) Karachentsev, I. D., & Kashibadze, O. G. 2005, ArXiv Astrophysics e-prints, arXiv:astro-ph/0509207
- Kashikawa et al. (2006) Kashikawa, N., et al. 2006, ApJ, 648, 7
- Kauffmann (1996) Kauffmann, G. 1996, MNRAS, 281, 487
- Kerber et al. (2007) Kerber, L. O., Santiago, B. X., & Brocato, E. 2007, A&A, 462, 139
- Kormendy (1985) Kormendy J. 1985, ApJ, 218, 333
- Kumai et al. (1993) Kumai, Y., Hashi, Y., & Fujimoto, M. 1993, ApJ, 416, 576
- Kuntschner et al. (2002) Kuntschner H., Ziegler B.L., Sharples R.M., Worthey G., Fricke K.J. 2002, A&A, 395, 761
- Lanfranchi & Matteucci (2003) Lanfranchi, G. A., & Matteucci, F. 2003, MNRAS, 345, 71
- Li & Burstein (2003) Li, Y., & Burstein, D. 2003, ApJ, 598, L103
- Lisker et al. (2007) Lisker, T., Grebel, E. K., Binggeli, B., & Glatt, K. 2007, ApJ, 660, 1186
- Makarova (1999) Makarova L.N. 1999, A&A, 139, 491
- McLaughlin (1999) McLaughlin D.E. 1999, AJ, 117, 2398
- McLaughlin et al. (2006) McLaughlin, D. E., King, A. R., & Nayakshin, S. 2006, ApJ, 650, L37
- Miller et al. (1998) Miller B.W., Lotz J.M., Ferguson H.C., Stiavelli M., Whitmore B.C. 1998, ApJ, 508, L133
- Miller (2006) Miller, B. W. 2006, in ”Globular Clusters: Guides to Galaxies”, eds. T. Richtler & S. Larsen, see also astro-ph/0606062
- Muzzio (1987) Muzzio, J. C. 1987, PASP, 99, 245
- Nayakshin et al. (2006) Nayakshin, S., Dehnen, W., Cuadra, J., & Genzel, R. 2006, MNRAS, 366, 1410
- Nayakshin et al. (2007) Nayakshin, S., Cuadra, J., & Springel, V. 2007, MNRAS, 379, 21
- Nomoto et al. (1997) Nomoto, K., Iwamoto, K., Nakasato, N., Thielemann, F.-K., Brachwitz, F., Tsujimoto, T., Kubo, Y., & Kishimoto, N. 1997, Nuclear Physics A, 621, 467
- Norris et al. (2006) Norris, M. A., Sharples, R. M., & Kuntschner, H. 2006, MNRAS, 367, 815
- Osterbrock et al. (1996) Osterbrock D.E., Fulbright J.P., Martel A.R., Keane M.J., Trager S.C., Basri G. 1996, PASP, 108, 277
- Osterbrock et al. (2000) Osterbrock D.E., Waters R.T., Barlow T.A., Slanger T.G., Cosby P.C. 2000, PASP, 112, 733
- Parodi et al. (2002) Parodi B.R., Barazza F.D., B. Binggeli B. 2002, A&A, 388, 29
- Peebles (2002) Peebles, P. J. E. 2002, ASP Conf. Ser. 283: A New Era in Cosmology, 283, 351
- Peebles & Dicke (1968) Peebles P.J.E. & Dicke R.H. 1968, ApJ, 154, 891
- Pipino et al. (2007) Pipino, A., Puzia, T.H. & Matteucci, F. 2007, ApJ in press
- Pritzl et al. (2005) Pritzl, B. J., Venn, K. A., & Irwin, M. 2005, AJ, 130, 2140
- Prochaska et al. (2005) Prochaska, L. C., Rose, J. A., & Schiavon, R. P. 2005, AJ, 130, 2666
- Puzia et al. (2000) Puzia, T. H., Kissler-Patig, M., Brodie, J. P., & Schroder, L. L. 2000, AJ, 120, 777
- Puzia et al. (2002) Puzia, T.H., Saglia, R. P., Kissler-Patig, M., Maraston, C., Greggio, L., Renzini, A., & Ortolani, S. 2002, A&A, 395, 45
- Puzia et al. (2004) Puzia T.H., Kissler-Patig M., Thomas D., Maraston C., Saglia R.P., Bender R., Richtler T., Goudfrooij P., Hempel M. 2004, A&A, 415, 123 (P04)
- Puzia et al. (2005a) Puzia T.H., Perrett K.M., Bridges T.J. 2005a, A&A, 434, 909
- Puzia et al. (2005b) Puzia T.H., Kissler-Patig M., Thomas D., Maraston C., Saglia R.P., Bender R., Richtler T., Goudfrooij P., Hempel M. 2005b, A&A, 439, 997
- Puzia et al. (2006) Puzia, T. H., Kissler-Patig, M., & Goudfrooij, P. 2006, ApJ, 648, 383
- Recchi & Danziger (2005) Recchi, S., & Danziger, I. J. 2005, A&A, 436, 145
- Rejkuba et al. (2005) Rejkuba, M., Greggio, L., Harris, W. E., Harris, G. L. H., & Peng, E. W. 2005, ApJ, 631, 262
- Renzini (2006) Renzini, A. 2006, ARA&A, 44, 141
- Richtler (1995) Richtler T. 1995, RvMA, 8, 163
- Robin et al. (2003) Robin, A. C., Reylé, C., Derrière, S., & Picaud, S. 2003, A&A, 409, 523
- Sandage et al. (1985) Sandage, A., Binggeli, B., & Tammann, G. A. 1985, AJ, 90, 1759
- Schiavon et al. (2005) Schiavon, R. P., Rose, J. A., Courteau, S., & MacArthur, L. A. 2005, ApJS, 160, 163
- Schlegel et al. (1998) Schlegel D.J., Finkbeiner D.P., Davis M. 1998, ApJ, 500, 525
- Sersic (1968) Sersic L.-J., Atlas de Galaxias Australes, Observatorio Astronomico, Cordova, 1968
- Sharina et al. (2003) Sharina, M. E., Sil’chenko, O. K., & Burenkov, A. N. 2003, A&A, 397, 831
- Sharina et al. (2006) Sharina, M. E., Afanasiev, V. L., & Puzia, T. H. 2006, MNRAS, 372, 1259
- Sharina et al. (2005) Sharina M.E., Puzia T.H., Makarov D.I. 2005, A&A, 442, 85, (SPM05)
- Spergel et al. (2003) Spergel, D. N., et al. 2003, ApJS, 148, 175
- Stetson (1987) Stetson, P. B. 1987, PASP, 99, 191
- Strader et al. (2003a) Strader, J., Brodie, J. P., Forbes, D. A., Beasley, M. A., & Huchra, J. P. 2003a, AJ, 125, 1291
- Strader et al. (2003b) Strader, J., Brodie, J. P., & Huchra, J. P. 2003b, MNRAS, 339, 707
- Thomas et al. (2003) Thomas, D., Maraston, C., & Bender, R. 2003, MNRAS, 339, 897
- Thomas et al. (2004) Thomas, D., Maraston, C., & Korn, A. 2004, MNRAS, 351, L19
- Thomas et al. (2005) Thomas, D., Maraston, C., Bender, R., & Mendes de Oliveira, C. 2005, ApJ, 621, 673
- Tonry & Davis (1979) Tonry, J., & Davis, M. 1979, AJ, 84, 1511
- Treu et al. (2005) Treu, T., et al. 2005, ApJ, 633, 174
- Tripicco & Bell (1995) Tripicco, M. J., & Bell, R. A. 1995, AJ, 110, 3035
- Tully et al. (2005) Tully R.B., Rizzi L., Dolphin A.E. Karachentsev I.D., Karachentseva V.E., Makarov D.I., Makarova L.N., Sakai S., Shaya E.J. 2006, AJ, 132, 729
- Tully et al. (2002) Tully R.B., Somerville R.S., Trentham N., Verheijen M.A.W. 2002, ApJ, 569, 573
- van den Bergh (2006) van den Bergh, S. 2006, The Local Group as an Astrophysical Laboratory, 1
- van den Bergh (2007) van den Bergh, S. 2007, AJ, 134, 344
- Villanova et al. (2007) Villanova, S., et al. 2007, ApJ, 663, 296
- West (1993) West M.J. 1993, MNRAS, 265, 755
- Whitmore et al. (2007) Whitmore, B. C., Chandar, R., & Fall, S. M. 2007, AJ, 133, 1067
- Woosley et al. (2002) Woosley, S. E., Heger, A., & Weaver, T. A. 2002, Reviews of Modern Physics, 74, 1015
- Worthey (1994) Worthey, G. 1994, ApJS, 95, 107
- Worthey & Ottaviani (1997) Worthey, G., & Ottaviani, D. L. 1997, ApJS, 111, 377