A Detailed Study of 2S 0114+650 with the RXTE
Abstract
We present the results of a detailed study of the high mass X-ray binary 2S 0114+650 made with the pointed instruments onboard the Rossi X-ray Timing Explorer. The spectral and temporal behaviour of this source was examined over the pulse, orbital, and super-orbital timescales, covering 2 cycles of the 30.7 d super-orbital modulation. Marginal evidence for variability of the power law photon index over the pulse period was identified, similar to that observed from other X-ray pulsars. If this variability is real it can be attributed to a varying viewing geometry of the accretion region with the spin of the neutron star. Variability of the neutral hydrogen column density over the orbital period was observed, which we attribute to the line of sight motion of the neutron star through the dense circumstellar environment. A reduction in the power law photon index was observed during the orbital maximum, which we speculate is due to absorption effects as the neutron star passes behind a heavily absorbing region near the base of the supergiant companion’s wind. No significant variability of the column density was observed over the super-orbital period, indicating that variable obscuration by a precessing warp in an accretion disc is not the mechanism behind the super-orbital modulation. In contrast, a significant increase in the power law photon index was observed during the super-orbital minimum. We conclude that the observed super-orbital modulation is tied to variability in the mass accretion rate due to some as yet unidentified mechanism.
keywords:
accretion, accretion discs - stars: neutron - X-rays: binaries - pulsars: individual: 2S 0114+6501 Introduction
The high mass X-ray binary 2S 0114+650 has been shown to be a rather unusual system. It exhibits properties consistent with both Be and super-giant X-ray binaries (Crampton, Hutchings & Cowley, 1985), with significant broadband temporal and spectral variability over a wide range of timescales (e.g. Koenigsberger et al., 1983; Crampton et al., 1985). The derived low X-ray luminosity (Lx 1.1 1036 erg s-1 in the 3 – 20 keV band for a distance of 7.2 kpc; Hall et al., 2000) implies that spherical accretion takes place via the stellar wind of the donor star (Li & van den Huevel, 1999). However, the HeII 4686 Å line (a common signature of the presence of an accretion disc) has been observed weakly in emission on a few occasions (Aab, Bychkova & Kopylov 1983; Crampton et al. 1985; van Kerkwijk & Waters 1989), possibly linked to the presence of a small transient accretion disc.
Coherent X-ray (and possibly faint optical) pulsations at a period of 2.7 h have been shown to be a persistent feature of the system (Finley, Belloni & Cassinelli, 1992; Taylor et al., 1995) and have been variously attributed to Cephei-type pulsations/tidal oscillations of the donor star and the neutron star spin period. Sood et al. (2006) analysed the evolution of the pulse period in 9.5 yr of Rossi X-ray Timing Explorer (RXTE) All Sky Monitor (ASM) data, identifying two episodes of torque reversal. Their conclusions support the scenario that 2S 0114+650 contains a super-slow rotator – one of the slowest spinning X-ray pulsars yet discovered.
Variability at 11.6 d has been observed in both optical (Crampton et al., 1985) and X-ray wavelengths (Corbet, Finley & Peele, 1999), consistent with the orbital period of the system. Crampton et al. (1985) were the first to confirm the binary nature of 2S 0114+650 using radial velocity measurements (with a period of 11.588 0.003 d for an eccentricity of 0.16 0.07, and 11.591 0.003 d for an eccentricity of 0.0). Although they could not distinguish between a circular and an eccentric orbit, they concluded that the orbital motion was most likely eccentric as the system had presumably gone through a supernova stage which should lead to a perturbed orbit. Corbet et al. (1999) analysed 2.5 yr of RXTE ASM observations of 2S 0114+650 between 1996 – 1999, identifying X-ray modulations close to both the optically derived orbital period and the proposed pulse period. Fitting a sine wave to the ASM light curve yielded a period of 11.63 0.007 d. The inconsistency between the optical and X-ray orbital period values was explained as either due to variable contamination of absorption lines by low equivalent width emission lines (resulting from the X-ray irradiation of the donor star) or possibly variability in the X-ray orbital modulation.
The determination of the orbital period was revisited recently in both optical and X-ray wavelengths by Grundstrom et al. (2007) and Wen et al. (2006) respectively. Grundstrom et al. (2007) performed a long-term spectroscopic monitoring program of the H emission in 2S 0114+650 and presented revised orbital elements with a period of 11.5983 0.0006 d and a non-zero eccentricity of 0.18 0.05. Wen et al. (2006) re-analysed the ASM data and reported a new value for the orbital period of 11.599 0.005 d, consistent with the new optical period.
A super-orbital modulation at 30.7 0.1 d was reported by Farrell, Sood & O’Neill (2006) from the analysis of 8.5 yr of ASM data. Wen et al. (2006) subsequently reported a new improved value of 30.75 0.03 d from re-analysis of the same data. Sood et al. (2006) analysed the evolution of the super-orbital period, finding it to be stable and concluding that 2S 0114+650 is only the fourth reported system to show stable super-orbital variability.
The standard model invoked to explain super-orbital variability in X-ray binaries is periodic obscuration or reflection via the precession of a warped accretion disc (e.g. Ogilvie & Dubus, 2001). The apparent lack of a persistent disc in this system thus raises doubts about the validity of this model as an explanation for the observed 30.7 d modulation. Recently, Koenigsberger et al. (2006) presented a model by which both the pulse and super-orbital modulations in this system could be explained by tidally induced oscillations in the donor star. However, the precise mechanisms by which these oscillations may translate into a structured stellar wind are not clear. In addition, super-orbital variability is predicted for circular orbits while the eccentric orbit models predict strong variations on orbital timescales associated with periastron passage (Koenigsberger et al., 2006). These results are thus inconsistent with the non-zero eccentricity recently derived by Grundstrom et al. (2007).
In this paper we present the results of a series of X-ray observations of 2S 0114+650 performed with the Proportional Counter Array (PCA; see Jahoda et al., 1996) and High Energy X-ray Timing Experiment (HEXTE; see Gruber et al., 1996) instruments onboard the RXTE satellite. The preliminary results of these studies were published in Farrell et al. (2007). The temporal and spectral variability of this source was studied in detail over the pulse, orbital and super-orbital timescales. In 2 the data reduction steps that were taken are explained. A description of the analysis methods employed and the results obtained are provided in 3. A discussion of our results is provided in 4, and 5 presents the conclusions that we have drawn.
2 Data Reduction
Between 2005 May 15 – 2005 June 14 (MJD 53505 – 53535) and 2005 December 13 – 2006 January 12 (MJD 53717 – 53747) 2S 0114+650 was observed for 220 ks with the PCA and HEXTE instruments. Two separate runs of 11 observations were made, with each individual observation 3 hr in duration so as to cover one complete cycle of the pulse period per observation. Each run covered one super-orbital cycle. The two runs were spaced approximately six months apart, with observations scheduled every few days. Table 1 lists the 22 observations with the date and exposure for each observation.
The Standard2f mode PCA data (16 s integration time, 128 energy channels) were used for our timing and spectral analyses, as time-resolution less than 16 s was not required. The HEXTE Archive mode data (16 s integration time, 64 energy channels) were used for our spectral analyses to investigate the high energy end of the spectrum. The ftools v6.1 software package was used for the reduction and analysis steps outlined below.
Filtering criteria were employed to exclude times when the pointing direction was less than 10∘ from the Earth horizon, the offset from the target direction was greater than 0.02∘ or the electron contamination fraction exceeded 0.1. Data obtained within 30 min of the spacecraft passage through the South Atlantic Anomaly (SAA) were also excluded to remove the effect of residual high-background levels due to induced radioactivity.
Spectra were extracted from all anode layers for each Proportional
Counter Unit (PCU) in the PCA from all data sets, excluding PCU0
due to the increase in the background that occurred therein with
the loss of the propane
layer111http://universe.gsfc.nasa.gov/xrays/programs/rxte/pca/doc/
bkg/bkg-2002/.
Spectra were also extracted for both HEXTE clusters (cluster 0 and
1) from all data sets. Due to the intermittent failure of the
rocking mechanism in cluster 0 during our second set of
observations222http://heasarc.gsfc.nasa.gov/docs/xte/whatsnew/big.html,
background data for this cluster are not available for
observations 12 – 19. As a result, cluster 0 data from these
observations are not included in our spectral analyses.
| Obs. | Date | Exposure | Obs. | Date | Exposure |
|---|---|---|---|---|---|
| (MJD) | (s) | (MJD) | (s) | ||
| 1 | 53506 | 7,104 | 12 | 53717 | 7,216 |
| 2 | 53509 | 7,488 | 13 | 53721 | 10,176 |
| 3 | 53513 | 5,856 | 14 | 53723 | 8,608 |
| 4 | 53515 | 7,408 | 15 | 53726 | 8,064 |
| 5 | 53517 | 9,120 | 16 | 53729 | 8,336 |
| 6 | 53520 | 9,616 | 17 | 53732 | 1,632 |
| 7 | 53523 | 8,960 | 18 | 53735 | 7,888 |
| 8 | 53526 | 6,640 | 19 | 53738 | 7,616 |
| 9 | 53529 | 7,152 | 20 | 53741 | 7,664 |
| 10 | 53533 | 7,056 | 21 | 53745 | 6,752 |
| 11 | 53535 | 7,408 | 22 | 53747 | 8,592 |
Three light curves covering the 2 – 9 keV (A), 9 – 20 keV (B) and 20 – 40 keV (C) energy ranges were extracted from all layers of PCU1, PCU2, PCU3 and PCU4 separately. The energy boundaries were chosen in line with those of the standard product light curves provided with the data. As the average count rate before background subtraction was less than 40 counts s-1, the 2005 November 28 mission-long faint source model was used to generate PCA background spectra and light curves. HEXTE background spectra for each cluster were extracted from the “off-source” data, when the cluster was aimed in a direction offset from the pointing direction. PCA response matrices were generated for each individual source spectrum. The 2000 May 26 HEXTE response and ancillary response matrices were used, as the response of each cluster has not changed since that time. As the observed count rates were relatively low, a deadtime correction was not applied to either the spectra or light curves.
The individual PCU spectra were then combined (source and background, separately) to maximise the signal-to-noise ratio. The PCA response matrices were also combined, weighted by the exposure values for each PCU333http://heasarc.gsfc.nasa.gov/docs/xte/recipes/pcucombine.html. For the analysis of the complete spectrum covering all observations, a 1 systematic error444http://heasarc.gsfc.nasa.gov/docs/xte/ftools/xtefaqanswers.html was added to the resulting spectrum to account for uncertainties in the response matrix such as the feature present at 5 keV due to the xenon L-edges. For the phase resolved spectral analyses no systematic error was applied as our aim was to constrain the spectral parameters to the highest level possible, particularly in the low energy range of the spectrum. Instead, the features around 5 keV were modelled using a multiplicative absorption edge component during the spectral fitting.
At energies below 3 and above 30 keV there were poor counting statistics and so these data were excluded from the PCA spectrum. The observed scatter in the HEXTE spectra is of the level expected for systematic uncertainties in the background (Rothschild et al., 1998), and so a 1 systematic uncertainty was added to its PHA channel data. Energies less than the 17 keV low energy threshold were also excluded in the HEXTE spectra. The low flux of 2S 0114+650 at high energies resulted in poor statistics above 50 keV in the HEXTE spectra. As such, energies above this range were excluded for our analyses. The individual PCU light curves were averaged together to give source and background light curves with the best signal-to-noise ratio. Barycentric correction was applied and background subtraction performed.
3 Data Analysis
| Model | xspec Models | 2/DOF |
|---|---|---|
| Power law + HE cut-off | POW*HIGHE | 28.8/80 |
| Black body + bremsstrahlung | BBODY+BREMS | 29.6/80 |
| Cut-off power law | cut-off | 32.5/81 |
| Power law + bremsstrahlung | POW+BREMS | 33.2/80 |
| Comptonisation | COMPTT | 56.9/79 |
| Thermal bremsstrahlung | BREMS | 63.1/82 |
| Comptonisation | COMPST | 94.7/81 |
| Black body | BBODY | 3890/82 |
| Spectral Parameter | Value | Units |
|---|---|---|
| Column Density | (3.2 ) 1022 | atoms cm-2 |
| Photon Index | 1.1 0.1 | |
| Cut-off Energy | 6.0 0.7 | keV |
| Folding Energy | 15 | keV |
| Flux (3 – 50 keV) | 2.3 10-10 | ergs cm-2 s-1 |
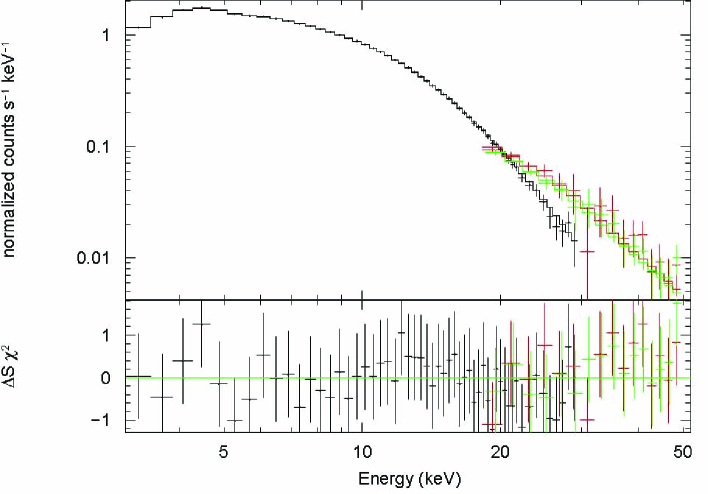
After the data reduction steps outlined above, spectral models were fitted to the combined PCA and HEXTE (cluster 0 and 1, separately) spectra in the 3 – 50 keV energy range using xspec v12.3. Eight models commonly applied to X-ray binaries were tested, with the resulting values and degrees of freedom presented in Table 2. The best fit model was found to be an absorbed power law with a high energy (HE) exponential cut-off, with parameter values consistent with the previously obtained values listed in the literature (Yamauchi et al., 1990; Apparao, Bisht & Singh, 1991; Finley, Taylor, & Belloni, 1994; Hall et al., 2000; Koenigsberger et al., 2003; Bonning & Falanga, 2005; Filippova et al., 2005; den Hartog et al., 2006; Masetti et al., 2006; Mukherjee & Paul, 2006).
The reduced values obtained by fitting 5 of the 7 remaining models were 1, also indicating acceptable fits. Many of the models (such as the CUTOFF, COMPTT and COMPST) have the same general shape as the empirical power law + HE cut-off model, but attempt to provide a better physical description of the underlying emission mechanisms. The other models (the black body and thermal bremsstrahlung) provided poor fits on their own, and required more complicated combinations in order to adequately model the overall spectrum. For these more complicated models we applied the F-test in xspec in order to justify the addition of the extra components. The addition of a soft black body component to the thermal bremsstrahlung model produced an F-statistic of 12.9 and a probability of 5 10-11, indicating a significant improvement in the fit. The addition of a power law component to the bremsstrahlung model (a combination suggested by den Hartog et al., 2006) yielded an F-statistic of 10.3 and a probability of 4 10-9, also indicating an improved fit.
While we cannot discriminate between 6 of the models from spectral fitting alone, we have adopted the absorbed power law with a HE cut-off model (WABS*POWER*HIGHE) as it is commonly used to empirically describe the shape of the spectra of accreting X-ray pulsars, and has been used in previous spectral analyses of 2S 0114+650 (e.g. Hall et al., 2000).
Inclusion of an Fe K Gaussian emission line at 6.4 keV did not improve the fit significantly in the overall spectrum. Similarly, no evidence was found of the 22 keV cyclotron resonance scattering feature (CRSF) tentatively identified in INTEGRAL data by Bonning & Falanga (2005). Our results thus support the findings of Masetti et al. (2006) and den Hartog et al. (2006), who failed to detect any evidence of cyclotron features in the spectrum of 2S 0114+650 using data from the BeppoSAX and INTEGRAL satellites respectively. Upper limits at the 95 confidence level for the equivalent width of the iron line and the depth of the 22 keV cyclotron feature of 55 eV and 0.3 respectively were obtained.
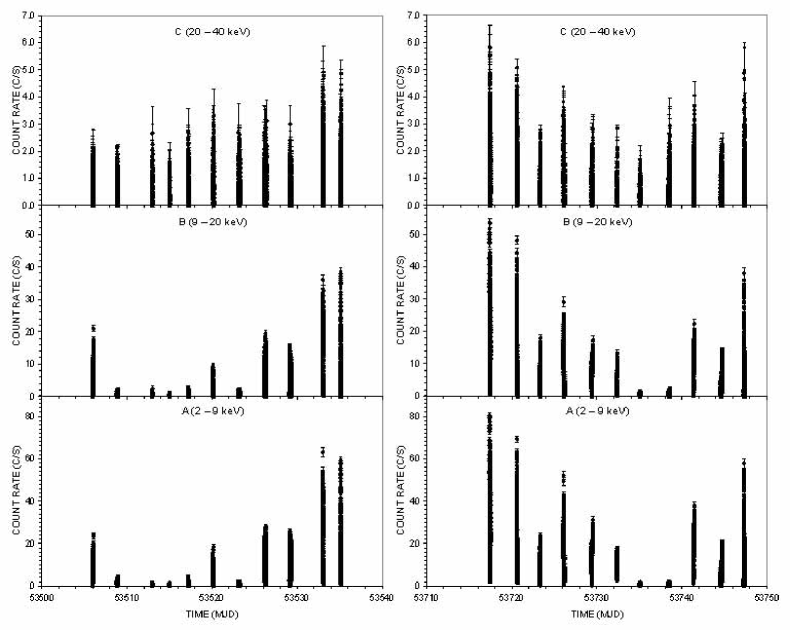
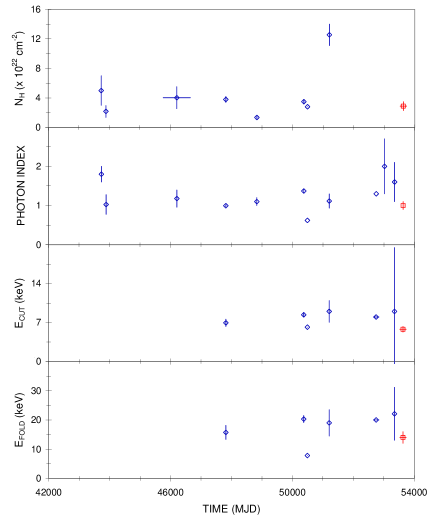
Figure 1 shows the combined PCA and HEXTE spectra from all observations fitted with the best fit model described above. Figure 2 shows the PCA A, B and C light curves from both observation runs covering MJD 53505 – 53535 and MJD 53717 – 53747. Figure 3 compares the best fit spectral parameters with values from previous observations listed in the literature. The PCA A band light curves for all 22 individual observations are included in Appendix A.
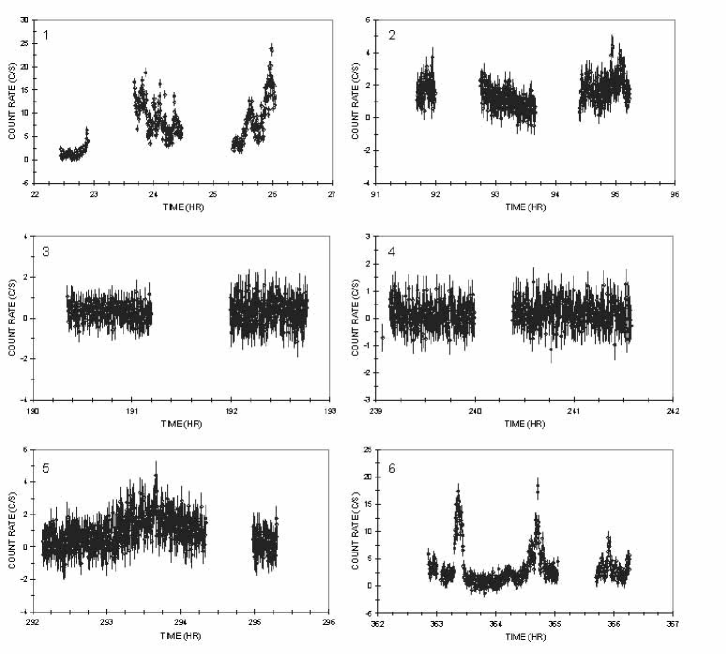
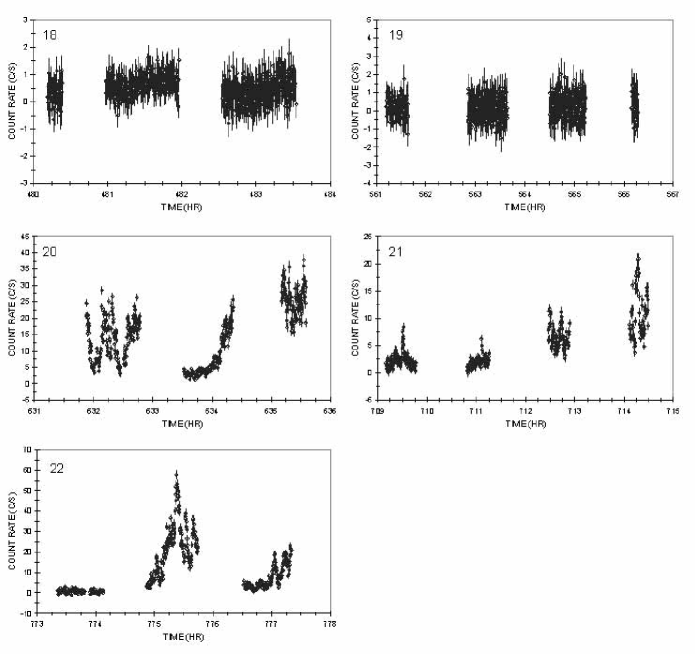
The 2.7 h pulse period can clearly be seen in most of the light curves, appearing as a smooth near-sinusoidal modulation (see Figures 20 – 23). Intermittent flaring episodes can be seen during many of the observations occurring in phase with the maximum of the pulse period (see e.g. the light curve from observation 13 in Figure 22 in the Appendix). These flaring episodes appear to be pseudo-periodic, possibly indicative of the 850 s, 894 s, or 2,000 s periods reported by Yamauchi et al. (1990), Koenigsberger et al. (1983) and Apparao, Bisht & Singh (1991) respectively. In addition to these reports of periodic modulation, Masetti et al. (2006) reported observing “X-ray flickering” on timescales of minutes to hours, which they speculated were a result of random inhomogeneities in the accretion flow onto the neutron star.
Two distinct flares were seen to occur during observation 6 (Figure 20) despite the otherwise low flux from the source at this time. These flares are predominantly present at low energies, indicating a source within the PCA field of view as the origin and ruling out gamma ray bursts as the cause. Masetti et al. (2006) suggested that similar flares observed in the BeppoSAX data were due to anisotropies in the density of the stellar wind (and thus the accreting material).
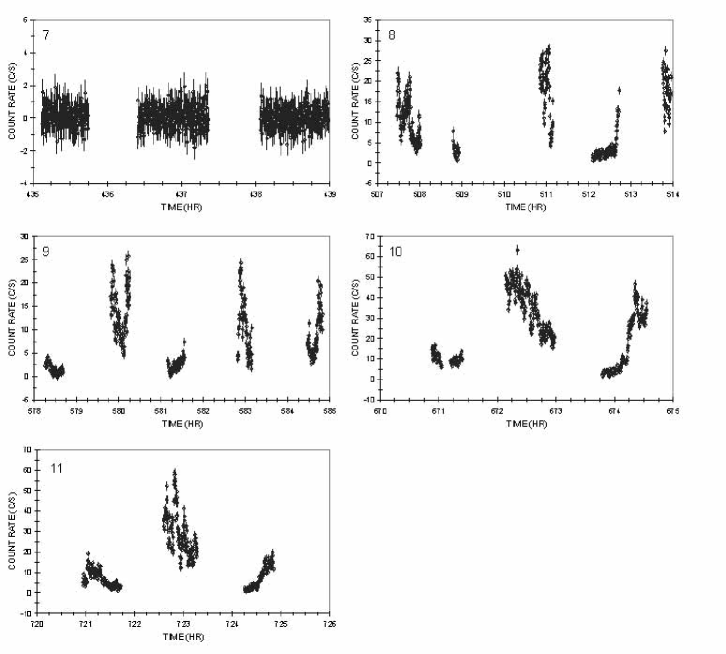
The light curve of observation 22 (Figure 23) exhibits an episode of very low flux during the first hour of the observation, after which the pulse period materialises with large amplitude. As mentioned earlier, all data where the pointing offset was greater than 0.02∘ from the target source were discarded. As such this low-flux episode is not due to the spacecraft slewing into position.
Spectral and timing analyses were performed over the pulse, orbital and super-orbital period timescales. Analyses of the flaring episodes observed at the peak of the pulse period were also performed. These analyses are described below.
3.1 Pulse Variability
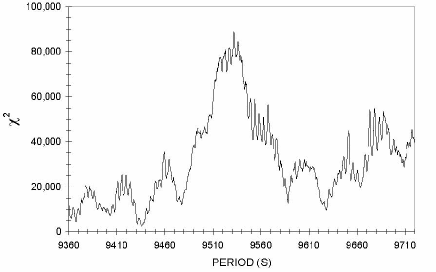
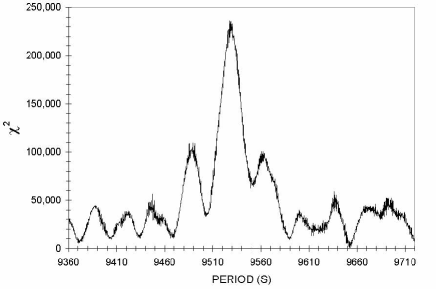
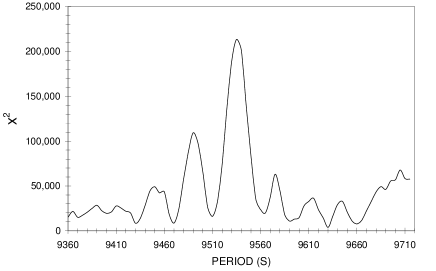
An epoch folding 2 search was performed on the PCA 2 – 9 keV light curve using the ftools task efsearch in the 9,360 – 9,720 s range with 0.36 s resolution. Light curves from the two observation runs (observations 1 – 11 and 12 – 22) were analysed separately to determine whether the pulse period varied significantly over the 6 month period separating the observation runs. The values for the pulse period were found to be 2.65 0.01 h and 2.644 0.003 h respectively, indicating the pulse period did not vary significantly over the 6 month period between the observation runs. The efsearch analysis of the light curve covering both runs of observations (with a reduced resolution so as to “smooth out” aliasing effects) yielded a best fit period of 2.650 0.003 h FWHM. Figures 4, 5 and 6 show the 2 vs period plots from the efsearch analysis.
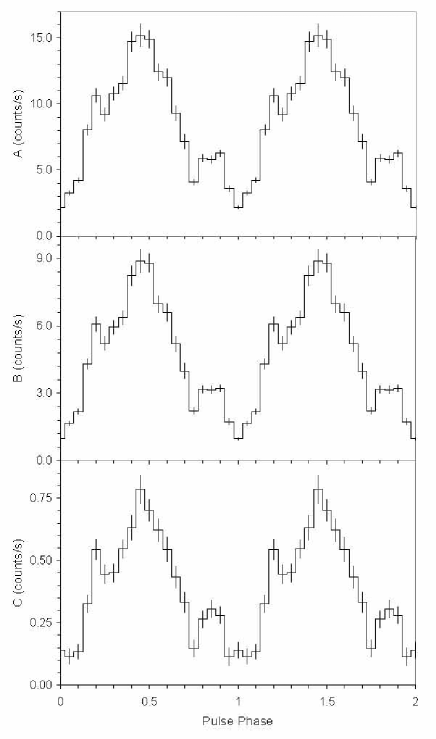
In order to investigate the profile of the pulse period the A, B and C (Figure 2) PCA light curves covering all observations were folded over the best fit 2.65 h period using the task efold, with phase 0 set at the flux minimum at MJD 53504.912 and with the errors being the standard error for each phase bin. The pulse profile was found to be approximately sinusoidal with a short “spike” around phase 0.2, a larger feature appearing around phase 0.85, and little variation between energy bands (Figure 7).
If 2S 0114+650 contains a super-slow X-ray pulsar with a 2.65 h spin period, the pulse period should exhibit Doppler shifting over the 11.6 d orbital period by 16 s. Likewise, if the 30.7 d super-orbital period is related to the orbital period of a second compact object in the system (as postulated by Farrell et al., 2006), the pulse period should exhibit Doppler shifting over this timescale by 12 s (the orbital angle of inclination permitting). As each of the 22 observations cover less than two pulse cycles, we were unable to measure the pulse arrival times in each data set to the required level of accuracy to constrain any variability over the orbital or super-orbital timescales. Additionally, it is unclear whether it is possible to measure the pulse period to the required level of accuracy (0.1 of the pulse period) with further observations.
To investigate the spectral variability over the pulse period, we extracted ten phase resolved spectra separated by 0.1 phase bins over the 2.65 h pulse period using the same method outlined earlier. For these analyses, only the PCA 3 – 30 keV data were utilised due to the poor statistics in the HEXTE data resulting from the relatively short exposures in each phase bin. As the objective of these analyses was to constrain the spectral parameters in each phase bin as tightly as possible, the 1 systematic error that was applied to the combined spectrum from all data was removed. The incorrect modelling of the xenon L-edge around 5 keV was instead accounted for by an additional absorption component for these analyses, as outlined in §2.
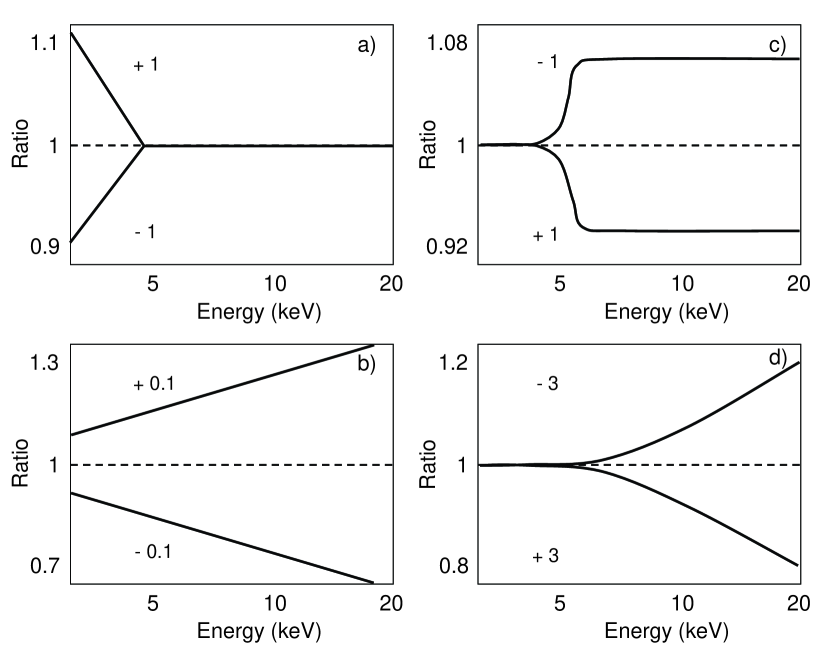
Comparing the individual phase resolved spectra with the best fit model obtained using the overall spectrum in Figure 1 allows for the identification of any energy specific spectral variability. In order to determine the source of any spectral variability, we first performed simulations using the overall spectrum. The spectral parameters of the best fit model were modified and the ratio between the modified model and the overall spectrum were calculated. As can be seen in Figure 8, varying each of the spectral parameters in turn resulted in quite specific patterns within the ratio plots. Varying the power law normalisation parameter (not shown in Figure 8) simply shifted the ratio values up or down, while keeping the slope of the ratios flat. Varying the column density modified the ratios only below 5 keV, while varying the parameters of the high energy cut-off (i.e. the cut-off energy and folding energy parameters) modified the ratios above 5 keV. Varying the photon index modified the slope of the ratio lines, while varying all parameters simultaneously produced a combination of all above mentioned effects.
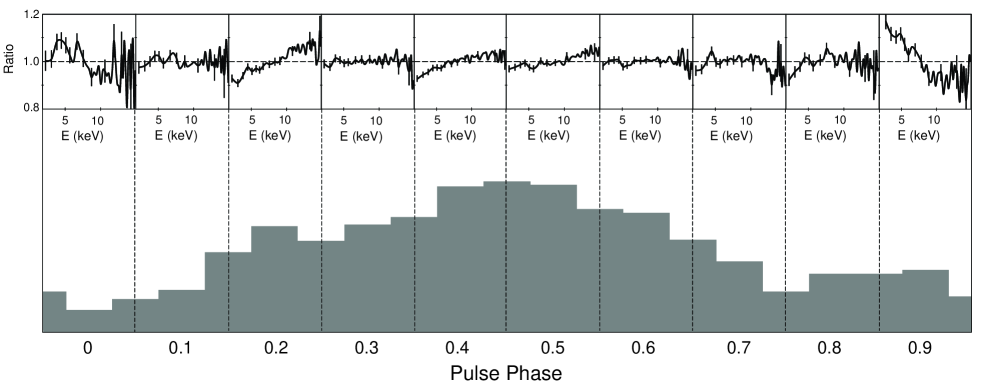
The ratios between each of the pulse phase resolved spectra and the best-fit model obtained from the overall spectrum were then plotted in order to identify any spectral variability over the pulse period, and to identify the energy ranges in which the spectra were variable. The results are plotted in Figure 9. For clarity the spectral model was normalised for each of the spectra through the addition of a constant parameter, removing the offset produced by the differing power law normalisation.
The ratio plots shown in Figure 9 indicate significant spectral variability over the pulse period. Comparison with the results of the simulations presented in Figure 8 indicates likely variability in the slope of the power law and in the column density parameters, with no evidence for variability in the high energy cut-off parameters. Additional features in the ratios around 6 keV indicate possible flux dependant variability in the Fe K emission.
Based on this comparison, we fit each of the pulse phase resolved spectra simultaneously with an absorbed power law model with a high energy cut-off, with the cut-off energy and folding energy parameters tied together, but with the column density and power law parameters free to vary independently. In this method the cut-off parameters are not fixed, but are linked so that while they were free to vary overall, the values were the same for each of the phase resolved spectra.
Significant features in the residuals were observed around 5 keV and 6 keV, which we attribute to the incomplete modelling of the xenon L-edges and to fluorescent Fe K emission. Additional model components comprising an absorption edge around 5 keV and a Gaussian emission line at 6.4 keV (with the energy frozen at 6.4 keV but the sigma and normalization parameters free to vary between the spectra) were thus included. While we cannot determine whether the Fe line is a result of fluorescent emission from 2S 0114+650 or from the diffuse galactic background, similar features have been seen in the spectrum before (e.g. Yamauchi et al., 1990; Apparao et al., 1991; Ebisawa, 1997; Hall et al., 2000; Masetti et al., 2006; Mukherjee & Paul, 2006) and so we assume that the observed line is related to the source. The reduced statistic obtained from this fitting process was 0.531 with 478 degrees of freedom, indicating a very good fit.
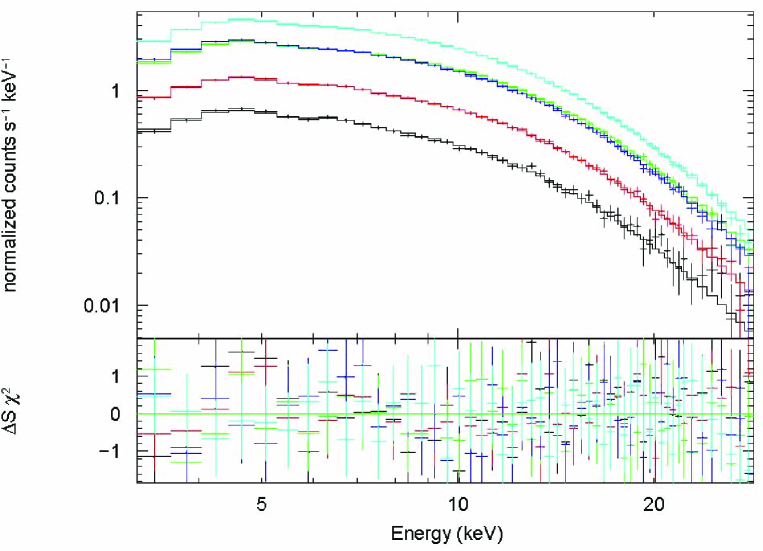
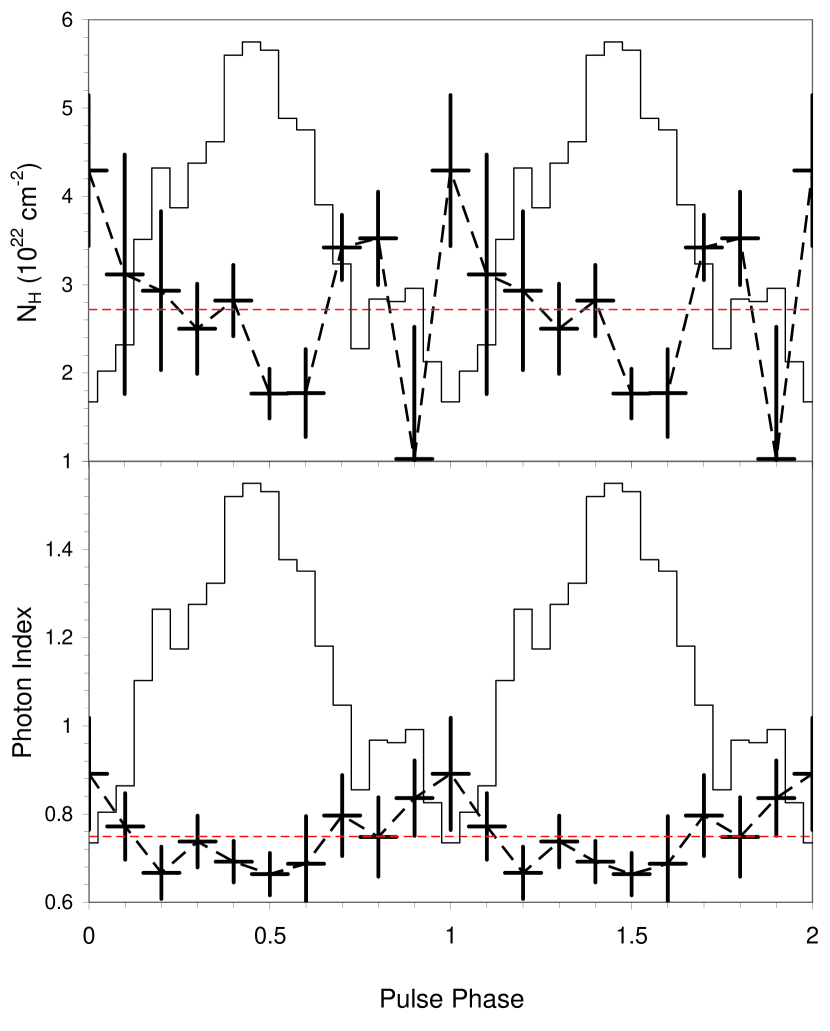
The column density and power law photon index parameters were then determined and plotted against pulse phase and compared with the PCA 2 – 9 keV light curve folded over the same period (Figure 10). The reduced value for the hypothesis of parameter constancy was then calculated, with values of 1.41 (null hypothesis probability of 18) and 1.23 (null hypothesis probability of 27) obtained for the column density and photon index respectively, providing marginal evidence of variability in both parameters over the pulse period. The linear correlation coefficient was also calculated for each parameter compared to the folded pulse profiles. The value obtained for the column density was -0.22, indicating a weak anti-correlation, while the value obtained for the photon index was -0.82, indicating a strong anti-correlation. While the addition of an Fe K emission line was required for the best fit, we were unable to constrain the equivalent width of the line sufficiently in order to determine whether it is variable over the pulse period. The pulse phase resolved spectra are shown in Figures 24 and 25 in the Appendix.
3.2 Orbital Variability
Approximately 6 orbital cycles were sampled during the course of our RXTE observations. Due to the limited number of cycles and relatively poor phase coverage, the value of the orbital period could not be accurately constrained. As such, the value of 11.599 d obtained by Wen et al. (2006) was used for our analyses. The A, B and C (Figure 11) PCA light curves covering all observations were folded over 11.599 d, with phase 0 set at the flux minimum at MJD 53503.7. The profile of the modulation does not appear to vary significantly with energy.

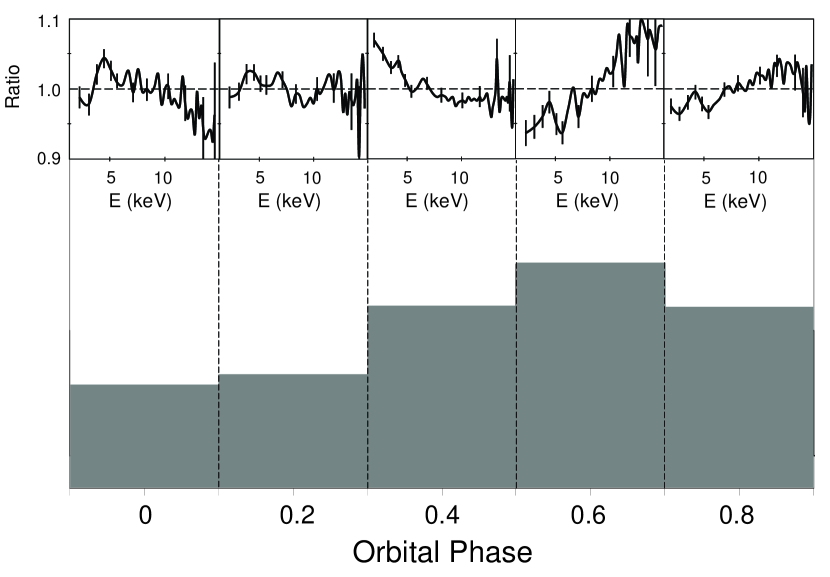
Using the same method outlined above for the pulse period, we extracted five phase resolved spectra separated by 0.2 phase bins from the PCA data over the 11.599 d orbital period. The ratios between each of the orbital phase resolved spectra and the best-fit model obtained from the overall spectrum were then plotted in order to identify any spectral variability. The results are plotted in Figure 12.
The ratio plots shown in Figure 12 indicate significant spectral variability over the orbital period similar to that seen over the pulse period. Comparison with the results of the simulations presented in Figure 8 indicates likely variability in the slope of the power law and in the column density parameters, with no evidence for variability in the high energy cut-off parameters. Features in the ratios around 6 keV are present similar to that seen in the pulse ratio plots, again indicating possible variability in the Fe K emission.
Based on this comparison, the same absorbed power law with high energy cut-off model was fitted to each of the orbital phase resolved spectra and the spectral parameters measured. As with the pulse phase resolved spectral analyses, the cut-off energy and folding energy parameters were tied together, but with the column density and power law parameters free to vary independently. Additionally, an absorption edge around 5 keV and a Gaussian emission line at 6.4 keV were included to account for residuals observed in the low energy range of the spectra. The reduced statistic obtained from this fitting process was 0.675 with 239 degrees of freedom.
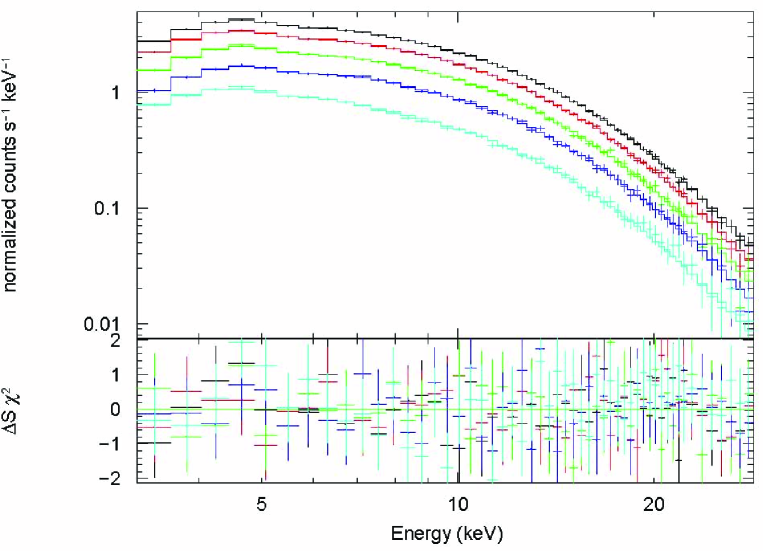
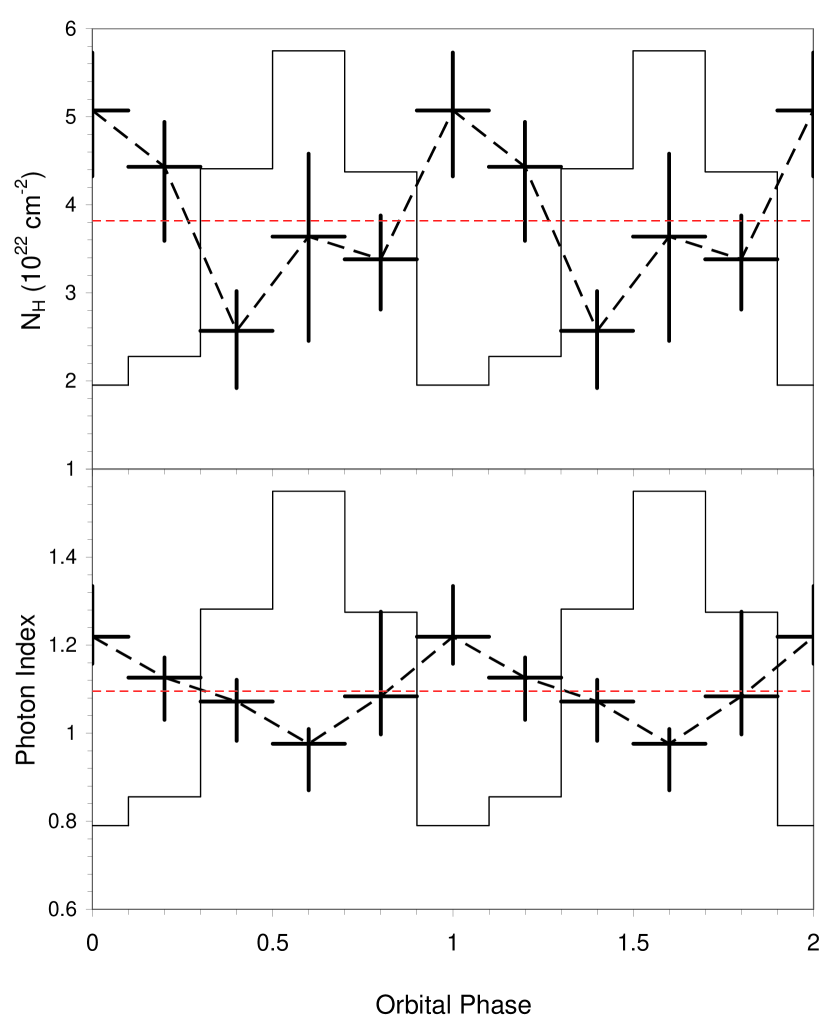
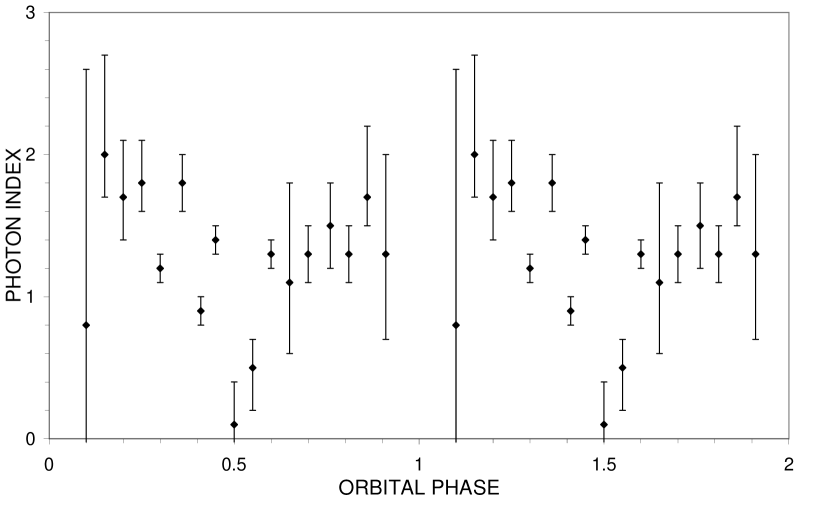
The neutral hydrogen column density and power law photon index parameters were each plotted against orbital phase, and compared with the PCA 2 – 9 keV light curve folded over the same period (Figure 13). The reduced values obtained were 2.47 (null hypothesis probability of 4) and 1.31 (null hypothesis probability of 26) for the column density and photon index respectively, indicating that both parameters are variable. The linear correlation coefficient values obtained for the column density and photon index compared to the folded orbital profiles were -0.78 and -0.84 respectively, indicating strong anti-correlations between both parameters and the orbital period folded flux. As with the pulse phase resolved spectral analyses, we were unable to constrain the equivalent width of the Fe K line sufficiently in order to determine whether it is variable over the orbital period. The orbital phase resolved spectra are shown in Figure 26 in the Appendix.
3.3 Super-orbital Variability
As only 2 super-orbital cycles were sampled during the course of our observations, the value of the super-orbital period could not be accurately constrained. As with the orbital period analyses, the value obtained by Wen et al. (2006) of 30.75 d was used for our analyses. The A, B and C (Figure 14) PCA light curves covering all observations were folded over 30.75 d, with phase 0 set at the flux minimum at MJD 53488. The super-orbital profile does not appear to vary with energy.

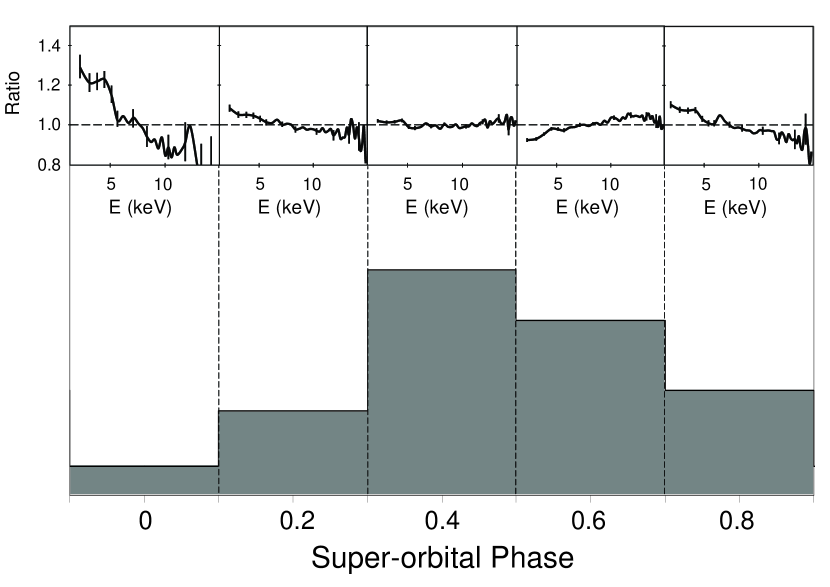
Using the methods outlined above for the pulse and orbital period analyses, we extracted five phase resolved spectra separated by 0.2 phase bins from the PCA data over the 30.75 d super-orbital period. The ratios between each of the super-orbital phase resolved spectra and the best-fit model obtained from the overall spectrum were then plotted. The results are plotted in Figure 15.
As with the pulse and orbital spectra, the ratio plots indicate significant spectral variability over the super-orbital period. Comparison with the results of the simulations presented in Figure 8 indicates likely variability in the slope of the power law and in the column density parameters, with no evidence for variability in the high energy cut-off parameters. The same features around 5 keV and 6 keV as observed in the pulse and orbital plots are present, which we again attribute to the xenon L-edge and fluorescent iron emission line.
Based on this comparison, the same absorbed power law with high energy cut-off model was fitted to each of the spectra and the spectral parameters measured. Exactly the same method was used as was with the pulse and orbital phase resolved analyses. The reduced statistic obtained from this fitting process was 0.615 with 238 degrees of freedom.
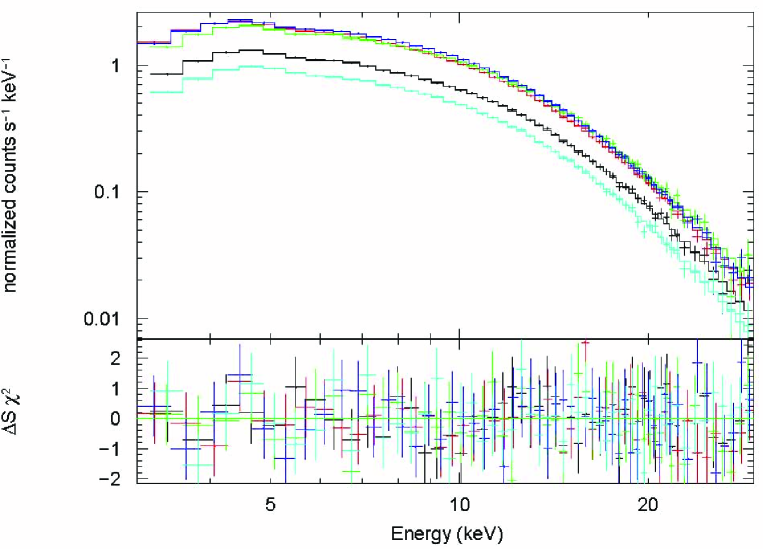
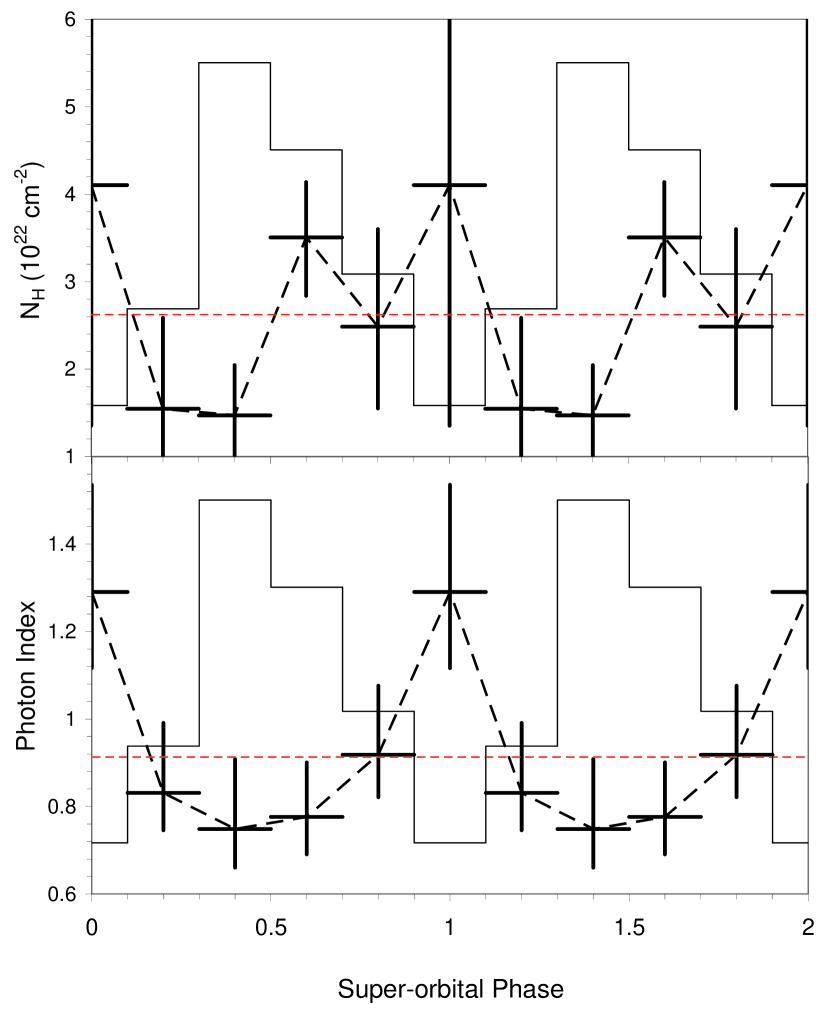
The neutral hydrogen column density and power law photon index parameters were then plotted against super-orbital phase, and compared with the PCA 2 – 9 keV light curve folded over the same period (Figure 16). The reduced values obtained were 1.88 (null hypothesis probability of 11) and 1.78 (null hypothesis probability of 13) for the column density and photon index respectively, indicating that both parameters are marginally variable. The linear correlation coefficient values obtained for the column density and photon index compared to the folded super-orbital profiles were -0.40 and -0.84 respectively, indicating a weak and strong anti-correlation respectively between both parameters and the super-orbital period folded flux. As with the pulse and orbital analyses, we were unable to constrain the equivalent width of the Fe K line sufficiently in order to determine whether it is variable over the super-orbital period. The super-orbital phase resolved spectra are shown in Figure 27 in the Appendix.
3.4 Other Variability
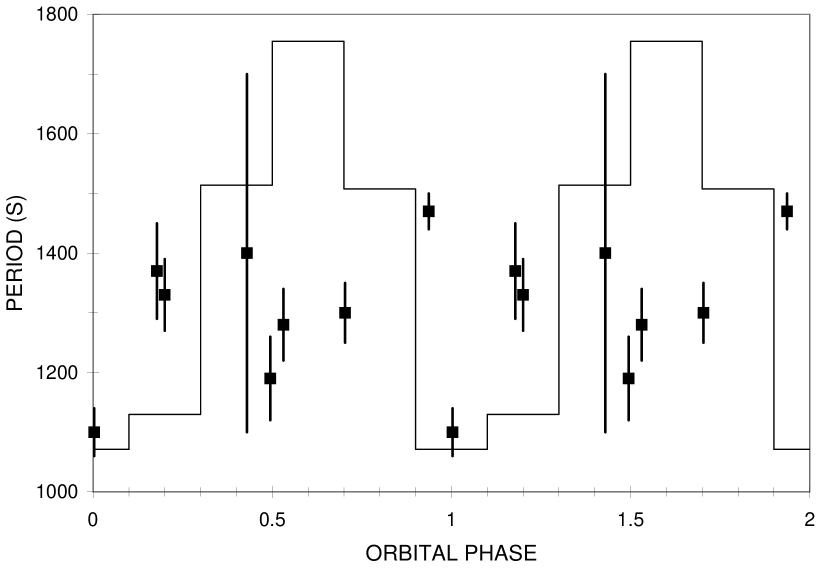
A search for periodic variability between 500 – 1,500 s was performed in order to determine whether the flaring episodes which were seen to occur during the pulse maximum were periodic, pseudo-periodic or stochastic in nature. The PCA 2 – 9 keV (A) light curves for observations 1, 10, 11, 12, 13, 14, 15, 20 and 22 were analysed, as each had good pulse phase coverage and the pulse modulation could be clearly seen. An efsearch analysis was performed on each of the light curves in the 500 – 1,500 s range with 1 s resolution. The strongest peaks in the vs period plots were found to lie between 1,100 and 1,470 s in all the data sets except for that pertaining to observation 11, which showed a significant peak at 710 s. Table 4 lists the flare recurrence timescales and FWHM uncertainties as measured from the vs period plots.
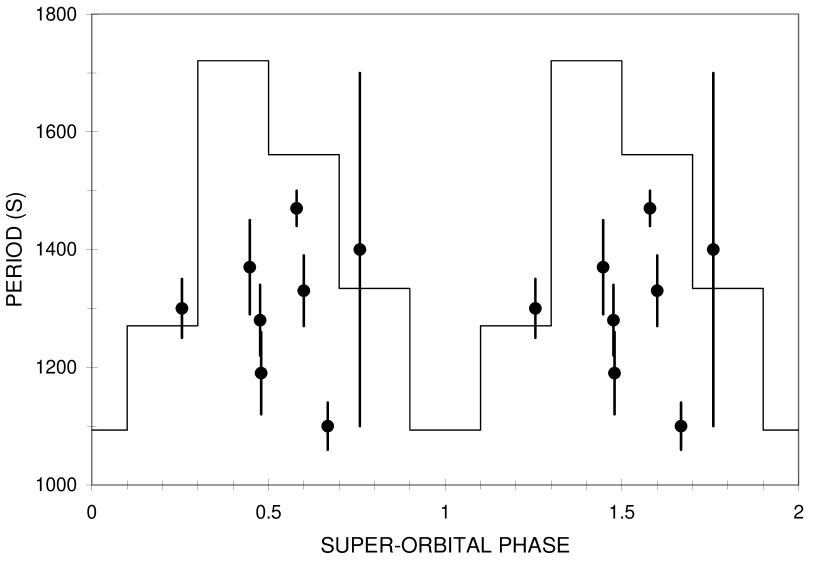
The location and width of the strongest peak in each data set varied considerably with time. In order to determine whether the flare recurrence times varied smoothly over the orbital or super-orbital periods, the values in Table 4 were plotted against orbital (Figure 17) and super-orbital (Figure 18) phase, with the 710 s value excluded as an outlier. No correlation between the flare recurrence times and the orbital or super-orbital period folded flux profiles was observed, indicating that the recurrence timescales of the observed flares do not vary periodically over either the orbital or super-orbital period.
It is interesting to note, however, that no flares were observed during the minimum flux of the super-orbital cycle. The flares were observed in conjunction with the maximum flux in the pulse cycle (phases 0.2 – 0.7), and were completely absent during the pulse minimum. During the minimum of the super-orbital cycle, the pulse modulation is absent, and as such no flares were observed. We interpret this relationship as indicating that the super-orbital modulation is a result of variable accretion through some as-yet-unknown mechanism, as the pulse modulation would not be expected to be observed during phases of low accretion.
| Obs. | Date | Period |
|---|---|---|
| (MJD) | (s) | |
| 1 | 53506 | 1,330 60 |
| 10 | 53533 | 1,300 50 |
| 11 | 53535 | 710 20 |
| 12 | 53717 | 1,400 300 |
| 13 | 53721 | 1,370 80 |
| 14 | 53723 | 1,190 70 |
| 15 | 53726 | 1,280 60 |
| 20 | 53741 | 1,470 30 |
| 22 | 53747 | 1,100 40 |
4 Discussion
A total of 22 individual pointed observations were performed with the RXTE, covering 22 pulse cycles, 6 orbital cycles and 2 super-orbital cycles. Significant temporal and spectral variability was observed from 2S 0114+650 over a range of timescales. The pulse, orbital and super-orbital modulations were all clearly present. An additional modulation over timescales of 1,300 s was also present, coincident with the maximum of the pulse period. The overall 3 – 50 keV spectrum was best fit with the same absorbed cut-off power law reported by other authors, albeit without the previously reported Fe K emission line at 6.4 keV or the CRSF at 22 keV. The following sub-sections present a discussion of the major results obtained.
4.1 Eclipses
As described in 3, the light curve of observation 22 (Figure 23) exhibits an episode of very low flux which could be indicative of an eclipse. Comparison with the ASM light curve folded over the 11.599 d orbital period shows that this episode of very low-flux does not occur at the expected orbital minimum but instead just after the maximum. In addition, while the pulse modulation is not present during observations 4 and 18, it can be seen clearly in observations 8 and 14, all of which took place during similar orbital phases as observation 22. Thus, the low-flux episode in observation 22 is most likely due to a temporary suspension of accretion, possibly due to density fluctuations in the stellar wind.
4.2 Fe K Emission
We did not find that the inclusion of an Fe K Gaussian emission feature improved the fit significantly in our analysis of the combined spectrum from all 22 observations. However, during our phase resolved spectral analyses over the pulse, orbital and super-orbital periods – where the 1 systematic error was removed and the residuals due to the xenon L-edges were modelled using an absorption edge, so as to more accurately constrain the column density (see §2) – significant residuals around 6.4 keV were observed in many of the spectra. Addition of an Fe K Gaussian emission line was thus required in order to obtain the best fit. The energy for this line was fixed at 6.4 keV for the phase resolved analyses, as the energy could not be well constrained. While the equivalent widths of these lines ranged between 60 – 800 eV, the estimated uncertainties were too large to determine whether the equivalent widths were correlated with any of the known periodicities.
Hall et al. (2000) note that in their observations the equivalent width of the iron line could only be constrained during the low-state of the spin period, as the emission feature was most strongly present during the episodes of low-flux. Masetti et al. (2006) observed the same phenomenon, concluding that the Fe emission was overwhelmed by the continuum emission in the high state and was thus only detectable during the minimum flux periods between pulses. In contrast, the relatively poor spectral resolution and sensitivity of the RXTE PCA meant that the parameters of the Fe line could not be adequately constrained in our data. Further observations with an instrument with greater spectral resolution and sensitivity than the RXTE PCA are required before a firm conclusion can be drawn as to the nature and variability of the fluorescent iron emission in this system. Understanding the origin of this emission could lead to a clearer picture of the geometry and dynamics of the system, potentially supplying further evidence for the presence of a super-slow pulsar and providing an answer to the question of the origin of the super-orbital modulation.
4.3 Cyclotron Resonance Scattering Features
The CRSF at 22 keV reported by Bonning & Falanga (2005) was not evident in any of our spectra, supporting the results of Masetti et al. (2006) and den Hartog et al. (2006) who also failed to detect this feature.
If the magnetic field of the neutron star in 2S 0114+650 is 1012 G as suggested by Li & van den Huevel (1999), we would expect a CRSF in the spectrum at 9 keV. Heindl et al. (2004) showed there to be a rough correlation between the energy of the cut-off and the cyclotron line energy in the spectra of accreting X-ray pulsars (see their Figure 4). Using a value of 6 keV for the cut-off energy as determined from our spectral fits, 2S 0114+650 should have a CRSF line energy of 6 keV and therefore a magnetic field strength of 1012 G.
The scattering cross section has a strong dependence on the angle to the magnetic field, so that CRSFs provide an excellent diagnostic of the emission geometry and the physical conditions of the radiating plasma (Harding & Lai, 2006). The angle between the photon direction and the magnetic field vector is thus a determining factor in the detection of cyclotron features in the spectrum (e.g. Schönherr et al., 2007). The shape and relative depths of the CRSF first and higher harmonics are thus highly dependent on the viewing geometry and the geometry of the scattering plasma (Harding & Lai, 2006). As a result, variations in the features are expected with the varying viewing geometry produced by the rotation of the neutron star. For the case where the photon direction and magnetic field vector are aligned, no cyclotron resonance scattering would be expected. In this scenario it may be possible to place some constraints on the accretion geometry (e.g. fan beam/cyclinder vs pencil beam/slab geometry), rotation patterns and accretion rate through the absence of observable CRSF lines (e.g. Schönherr et al., 2007).
Alternatively, the absence of any CRSF features in the X-ray spectrum could indicate that the magnetic field strength is outside the observable bandwidth, indicating a field strength of either 1012 G or 1012 G. In either of these scenarios the CRSF would occur at energies too low or too high for us to observe in our data.
4.4 The High-Energy Tail
The detection of a ‘high energy tail’ in the spectrum of 2S 0114+650 from analysis of INTEGRAL IBIS-ISGRI data was reported by den Hartog et al. (2006), which required a combination of thermal bremsstrahlung and power law models to describe the spectrum at high energies. Their findings are thus inconsistent with those of Hall et al. (2000), Masetti et al. (2006), Mukherjee & Paul (2006) and with our own results.
In order to test the validity of their model, we attempted to fit a thermal bremsstrahlung + power law model to our combined PCA + HEXTE spectra in the 3 – 50 keV range. While this model provided an acceptable fit, significant residuals were seen at 5 keV indicating that the model does not accurately describe the spectrum. Due to the poor statistics in the HEXTE data above 50 keV we could not confirm the existence of a tail in the spectrum 70 keV. However, the poor residuals at low energies obtained with the combined thermal bremsstrahlung/power law model raises questions about the presence of a high energy tail in the spectrum from this system. It should be noted that den Hartog et al. (2006) also found an acceptable fit to the spectrum using a single power law model without the inclusion of a high energy exponential cut-off.
Additionally, in other binary systems the appearance of a high energy tail has been linked to the onset of compact jets. Radio observations of 2S 0114+650 performed in the 240 – 1400 MHz range with the Giant Metrewave Radio Telescope found no evidence for any radio emission, thus arguing against the presence of jets in this system (Farrell et al., 2007).
4.5 The 2.7 hr Pulse Period
From our analysis of the PCA timing data, we have obtained a new value for the pulse period at 2.65 0.003 h. This value is inconsistent with the value reported by Bonning & Falanga (2005), indicating that the neutron star is continuing to spin-up over time (see Hall et al., 2000; Sood et al., 2006). Separate analysis of the two observation runs showed no significant difference between the values of the pulse period during the six months separating the runs, providing an upper limit for / during MJD 53505 – 53747 of 4.6 10-3 yr-1. Our results are thus consistent with the value of 2 10-3 yr-1 obtained by Hall et al. (2000).
Our results also indicate that the model proposed by Koenigsberger et al. (2006) – which ascribed the 2 h pulse period to tidally-induced pulsations of the B-supergiant companion – is inconsistent with the observed properties of this source. They showed that tidal oscillations of the companion star’s surface could occur at both the 2 h and 30 d timescales. However, their model predicts that the 2.7 h period should vary significantly on short times-scales between 1.6 – 3.4 h (depending on the system parameters). In addition, the link between tidal oscillations of the donor star and periodic mass ejection episodes is still unclear (Koenigsberger et al., 2006). Our observations thus indicate that this model does not adequately explain the mechanism behind the pulse period, as the stability of this period has been demonstrated over timescales of days to months.
The pulse profile shown in Figure 7 is approximately sinusoidal with features around phase 0.2 and 0.85, with the latter possibly arising from the edge of the emission region at the second pole (e.g. Wang & Welter, 1981). The profile of the modulation does not appear to vary significantly with energy, implying an absence of cyclotron scattering (as any cyclotron features in the spectrum would be expected to vary with the rotation of the magnetic field; e.g. Harding & Lai, 2006), supporting the results of our spectral fitting. In addition, while no clear-cut dependence of the pulse profile on the pulse period is apparent for X-ray pulsars, Wang & Welter (1981) noted that many slow pulsars (Pspin 100 s) show relatively smooth and sinusoidal profiles. Our results thus continue to support a pulsar nature for the compact object in 2S 0114+650.
The approximately sinusoidal profile and the lack of change with energy is consistent with the profiles of other X-ray pulsars with luminosities below 1036 erg s-1 (White, Swank, & Holt, 1983). Previous attempts to constrain the distance to 2S 0114+650 have yielded a range of values (1.8 0.2 kpc, 2.5 kpc, 3.8 kpc, 3 kpc; Aab et al., 1983; Crampton et al., 1985; Chevalier & Ilovaisky, 1998; Koenigsberger et al., 2003, respectively), with the most thorough attempt by Reig et al. (1996) providing a poorly constrained distance of 7.0 3.6 kpc. Taking 1036 erg s-1 as the luminosity upper-limit in the 0.5 – 60 keV band from White et al. (1983) we can provide further constraints on the distance. Assuming a lower limit of 3.4 kpc from Reig et al. (1996), we derive a new distance estimate of 4.5 1.5 kpc.
Our analysis of the phase resolved spectra showed marginal evidence for variability in the power law photon index over the pulse period, anti-correlated with the flux. A similar anti-correlation between the photon index and the pulse flux has been observed in Her X-1 (e.g. Soong et al., 1990). The observed similarities between the spectral variability of 2S 0114+650 and Her X-1 over the pulse periods could thus strengthen the case that the 2.7 h period is indicative of the neutron star spin period. However, the uncertainties for the photon index values are too large to draw a firm conclusion either way. No significant correlated variability of the neutral hydrogen column density over the pulse period could be determined.
Using the derived values of the wind velocity (1,200 km s-1; Corral & Koenigsberger, 1987), orbital tangential velocity (271 km s-1 assuming an almost-circular orbit), orbital angular velocity (6.3 10-6 rad s-1), and typical values for the other parameters (Ikhsanov, 2007), we calculated the in order to achieve the observed average spin-up rate. The results of these calculations yielded values of 9 10-9 M⊙ yr-1 for a neutron star and 2 10-3 M⊙ yr-1 for a white dwarf. The derived mass accretion rate for a neutron star is approximately two orders of magnitude less than the mass loss rate for B1 Ia supergiants derived by Barlow & Cohen (1977) from infrared observations and, more recently, by Crowther, Lennon & Walborn (2006) from optical observations.
The mass accretion rate would be expected to be much less than the mass loss rate of the donor star due to inefficient capture of material from the stellar wind. Our derived mass accretion rate is thus consistent with the expected mass loss rate of the supergiant. In contrast, the derived mass accretion rate for a white dwarf is three orders of magnitude greater than the expected supergiant mass loss rate, clearly excluding a white dwarf as the compact object in this system. In light of this, the evolution of the pulse period (Sood et al., 2006), and the spectral similarities shared with other binary X-ray pulsars, we conclude that the 2.7 h period must indeed be the spin-period of a neutron star.
The recent reports by Mattana et al. (2006) and De Luca et al. (2006) of two other candidate pulsars with hour-long spin-periods (5 h for 4U 1954+319 and 6.7 h for 1E 161348-5055.1 respectively) – if confirmed – would appear to indicate that super-slow rotating neutron stars are more prevalent than originally suspected. Ikhsanov (2007) has shown that the assumption of a super-critical initial magnetic field strength (i.e. G) is not necessary if the propeller phase consisted of both supersonic and subsonic propeller phases. Rapid spin-down would occur over very short timescales due to interactions between the accreting material and the neutron star magnetic field. In this setting, even spherical accretion from a stellar wind would result in significant angular momentum transfer due to the orbital motion of the neutron star (Ikhsanov, 2007), leading to spin-down timescales consistent with the projected lifetime of the donor star.
Ikhsanov (2007) showed that in the Davies-Fabian-Pringle (Davies, Fabian, & Pringle, 1979) scenario a mass accretion rate of 1014 g s-1 is required to spin 2S 0114+650 down to a period of 104 s. This derived accretion rate is a factor of 30 smaller than the current mass transfer rate inferred from the X-ray luminosity of the source. However, the evolutionary tracks of massive stars predict a main sequence O9.5 V progenitor star for a B1 Ia supergiant in a previous epoch (Meynet et al., 1994), with a mass outflow rate of 30 – 40 times smaller than the donor star in 2S 0114+650 inferred from optical observations. Hence, the mass accretion rate in a previous (spin-down) epoch would be 1014 g s-1, consistent with the value required by the Davies-Fabian-Pringle scenario.
The problem common to both the Li & van den Huevel (1999) and Ikhsanov (2007) scenarios is that the equilibrium period for 2S 0114+650 is predicted to be 26 min, which the spin-period will rapidly approach on timescales of 100 yr for disc accretion and 1,000 yr for stellar wind accretion (Ikhsanov, 2007). The probability of observing the pulsar in 2S 0114+650 during the long-period phase is thus almost negligible, indicating either 2S 0114+650 is a young accretor (and we have beaten all the odds to observe it in this stage) or our current understanding of pulsar evolution is deficient. If the pulse period continues to decrease at the current average rate of 2 10-3 yr-1 (Hall et al., 2000), the pulsar will reach its equilibrium period in 400 yr. This timescale is thus consistent with an infant X-ray pulsar spinning-up through stellar wind accretion.
4.6 The 11.6 d Orbital Period
The observed variability of the neutral hydrogen column density over the orbital period indicates that variable absorption by the dense stellar wind throughout the orbit is the mechanism behind the orbital modulation, as suggested by Hall et al. (2000) and Grundstrom et al. (2007). Similar variability in the column density has been observed in the HMXB pulsars Vela X-1 and EXO 1722-363 (Nagase, 1991; Thompson et al., 2007). The latter system in particular provides a good comparison, as both the column density and the power law photon index were observed to vary over the orbital period, anti-correlated with flux (see Figure 19 for a plot of the photon index over orbital phase from the data presented in Thompson et al., 2007). EXO 1722-363 is a highly obscured binary system that exhibits regular eclipses. The observed increase in the column density and photon index during eclipse are thus a result of absorption effects.
It is not possible to determine from our results whether accretion in an unperturbed stellar wind is sufficient to account for the observed changes in the column density. Thus, we cannot determine whether structures such as accretion wakes (similar to those detected in Vela X-1 and EXO 1722-363; Haberl & White, 1990; Thompson et al., 2007) are required to account for the observed absorption. However, the shape of the column density variations with orbital phase is consistent with an undisturbed wind, and not like the highly disturbed wind models obtained from simulations (see Figures 2 and 8 of Blondin, Stevens, & Kallman, 1991). Further observations and modelling are required before the geometry of the wind can be constrained.
While our results do not exclude periodic eclipses of the neutron star by the supergiant companion, we found no strong evidence for eclipses in the PCA light curves. We thus conclude that 2S 0114+650 does not exhibit the properties of an eclipsing binary system as suggested by Corbet et al. (1999). However, the similarities between the spectral variability in 2S 0114+650 and EXO 1722-363 hint at similarities in the orbital properties. We thus ascribe the observed spectral variability to 2S 0114+650 passing behind a heavily absorbing region close to the base of the wind of the donor star.
4.7 The 30.7 d Super-orbital Period
Her X-1 is the prototypical system in which the warped, precessing disc scenario has been shown to explain the observed super-orbital modulation very well. The column density in this system has been observed to vary out of phase with the super-orbital cycle, due to variable obscuration of the central source by the precessing disc warp (Naik & Paul, 2003). The lack of variability of the column density over the super-orbital period in 2S 0114+650 thus indicates that this modulation is not due to local changes in the column density, and therefore precludes variable absorption by a warped, precessing accretion disc as the cause of the super-orbital modulation.
The lack of significant Fe K emission precludes variable reflection by a precessing disc, as strong iron emission due to reprocessing of X-rays in a disc would be expected to be present and variable in this scenario (e.g. George & Fabian, 1991). In addition, the apparent increase in the power law photon index during the super-orbital minimum is in exact opposition to the behaviour of two of the other well studied super-orbital systems – LMC X-4 and Her X-1 (Naik & Paul, 2003) – both of which exhibit photon index variability modulated over the super-orbital period. In both of these systems the super-orbital modulation is attributed to the warped precessing disc model, once again showing that the 30.75 d period in 2S 0114+650 does not fit the standard model.
If the super-orbital modulation was tied to accretion onto another compact object (i.e. a triple system), we would expect to see variability of the column density and possibly the photon index in a similar fashion to the orbital mechanism discussed above. While modulation of the eccentricity of the 11.6 d orbit by a third massive body would not lead to variability in the column density, this model would yield a long-period of 30.75 d.
Similarly, if precession of the neutron star-spin axis were the cause of the super-orbital modulation, the precession period would be inversely proportional to the spin period (Wasserman, 2003). We would thus expect to see the super-orbital period vary, anti-correlated with the spin-up of the neutron star. The apparent long-term stability of this period as shown by Sood et al. (2006) indicates that this latter scenario is unlikely. In addition, the expected precession period for a neutron star spinning with a 2.7 hr period is 30.75 d.
The periodic episodes of enhanced mass accretion in the tidally-driven oscillation model proposed by Koenigsberger et al. (2006) would not be expected to cause column density variability. Hudec (1978) analysed 1,250 photographic plates taken of 2S 0114+650 between 1928 and 1977 at optical wavelengths and could not discern any significant variability in the optical magnitude greater than 0.3 mag over any timescale. Pulsations in the supergiant donor star should result in significant variable optical luminosity thus making this scenario unlikely. However, it should be noted that no long-term optical monitoring has been performed since 1999 when the super-orbital period was first detectable in the ASM data, preventing us from ruling out this model as an explanation for the super-orbital variability.
Another possibility is that the neutron star undergoes periods of enhanced accretion over the super-orbital timescale due to the presence of another donor star in an eccentric orbit of 30 d. As the second donor star approaches periastron passage, accretion onto the neutron star would commence through Roche lobe overflow. The increase in flux over the super-orbital period would thus be due to phase dependent episodes of Roche lobe overflow, which would be associated with the formation of a transient disc during very specific super-orbital phases. This would result in an increase in the accretion rate and therefore an increase in flux, but would not necessarily result in variability of the observed spectral parameters. Previous optical observations have identified only one candidate for the optical counterpart within the X-ray error circle. If the super-orbital modulation is due to the presence of a second donor star in a triple system, the third star would have to be low-mass with very low luminosity.
4.8 Other Variability
Pseudo-periodic flaring episodes were observed around 1,300
s at the maximum pulse phase, with the recurrence timescale of
these flares seen to vary significantly over time. No evidence for
a correlation between the flare recurrence timescales and either
the orbital or super-orbital period flux was found. When taken
into context with the 894, 850 and 2,000 s periods
previously reported by Koenigsberger et al. (1983), Yamauchi et al. (1990) and
Apparao et al. (1991) respectively and the X-ray flickering reported by
Masetti et al. (2006), we conclude that the observed 1,300 s flares
are most likely due to an aperiodic process with a stochastic
recurrence timescale. Possible explanations include “clumping”
of the material in the accretion stream due to turbulent
processes, or possibly feedback between the radiation pressure
from the emission region and the accreting material. Both
explanations imply a correlation between
the flare recurrence timescales and the mass accretion rate.
5 Conclusions
We have performed an extensive study of the X-ray variability of 2S 0114+650 with the RXTE satellite. The good spectral coverage provided by the PCA and HEXTE instruments have allowed us to undertake the first in-depth wide-band study of the super-orbital modulation. The overall X-ray spectrum in the 3 – 50 keV range was found to be well described by the standard absorbed power law model with a high energy exponential cut-off, with spectral parameters consistent with those reported by other authors from other instruments and epochs.
Marginal evidence for variability in the power law photon index over the pulse period was identified, which could be attributed to the varying viewing geometry of the accretion region with the spin of the neutron star. Similar variability has been observed from other X-ray pulsars such as Her X-1, supporting the conclusion that 2S 0114+650 contains a super-slow X-ray pulsar. The near-sinusoidal pulse profile and the lack of change with energy puts 2S 0114+650 in the class of low luminosity ( 1036 erg s-1) X-ray pulsars, allowing us to provide a new distance estimate of 4.5 1.5 kpc.
Variability of the neutral hydrogen column density over the orbital period was observed, indicating that the line-of-sight motion of the neutron star through the dense circumstellar environment is the mechanism behind the orbital modulation. Additional variability in the power law photon index anti-correlated with flux over the orbital period was identified, which we speculate is due to absorption effects as the neutron star passes behind a heavily absorbing region near the base of the supergiant companion’s wind.
In contrast, no significant variability of the column density was observed over the super-orbital period. While super-orbital periods are commonly attributed to variable obscuration by a precessing warp in an accretion disc, the absence of super-orbital column density variability indicates that this is not the mechanism behind the super-orbital modulation. Similarly, the absence of significant iron emission or reflection components in the spectrum argues against variable reflection by a precessing warped disc. While the slope of the spectrum was relatively stable throughout the super-orbital cycle, a significant increase in the photon index was observed during the minimum phase. We conclude that the super-orbital period is tied to variability in the mass accretion rate due to some as yet unidentified mechanism.
Acknowledgments
SAF acknowledges the financial support provided by the UNSW@ADFA UCPRS scholarship scheme. We thank the entire RXTE team for acquiring the X-ray data and advice on the data analysis. We thank Natalie Webb and Didier Barret for their many useful discussions and the anonymous referee for their excellent comments which significantly improved this paper.
References
- Aab et al. (1983) Aab O. E., Bychkova L. V., Kopylov I. M., 1983, SvAL, 9, 285
- Apparao et al. (1991) Apparao K. M. V., Bisht P., Singh K. P., 1991, ApJ, 371, 772
- Barlow & Cohen (1977) Barlow M. J., Cohen M., 1977, ApJ, 213, 737
- Blondin, Stevens, & Kallman (1991) Blondin J. M., Stevens I. R., Kallman T. R., 1991, ApJ, 371, 684
- Bonning & Falanga (2005) Bonning E. W., Falanga M., 2005, A&A, 436, L31
- Chevalier & Ilovaisky (1998) Chevalier C., Ilovaisky S. A., 1998, A&A, 330, 201
- Corbet et al. (1999) Corbet R. H. D., Finley J. P., Peele A. G., 1999, ApJ, 511, 876
- Corral & Koenigsberger (1987) Corral L., Koenigsberger G., 1987, RMxAA, 14, 330
- Crampton et al. (1985) Crampton D., Hutchings J. B., Cowley A. P., 1985, ApJ, 299, 839
- Crowther, Lennon & Walborn (2006) Crowther P. A., Lennon D. J., Walborn N. R., 2006, A&A, 446, 279
- Davies, Fabian, & Pringle (1979) Davies R. E., Fabian A. C., Pringle J. E., 1979, MNRAS, 186, 779
- De Luca et al. (2006) De Luca A., Caraveo P. A., Mereghetti S., Tiengo A., Bignami G. F., 2006, Sci, 313, 814
- den Hartog et al. (2006) den Hartog P. R., Hermsen W., Kuiper L., Vink J., in’t Zand J. J. M., Collmar W., 2006, A&A, 451, 587
- Ebisawa (1997) Ebisawa K., 1997, AAS, 29, 1388
- Farrell et al. (2006) Farrell S. A., Sood R. K., O’Neill P. M., 2006, MNRAS, 367, 1457
- Farrell et al. (2007) Farrell S. A., O’Neill P. M, Sood R. K., Dieters S., Manchanda R. K., 2007, in Antonelli L. A., Israel G. L., Piersanti L., Tornambe A., Burderi L., Di Salvo T., Fiore F., Matt G., Menna M. T., eds, AIP Conf. Proc. Vol. 924, The Multicoloured Landscape of Compact Objects and their Explosive Origins. AIP, Melville, p. 885
- Filippova et al. (2005) Filippova E. V., Tsygankov S. S., Lutovinov A. A., Sunyaev R. A., 2005, AstL, 31, 729
- Finley et. al (1992) Finley J. P., Belloni T., Cassinelli J. P., 1992, AA, 262, L25
- Finley et. al (1994) Finley J. P., Taylor M., Belloni T., 1994, ApJ, 429, 356
- George & Fabian (1991) George I. M., Fabian A. C., 1991, MNRAS, 249, 352
- Gruber et al. (1996) Gruber D. E., Blanco P. R., Heindl W. A., Pelling M. R., Rothschild R. E., Hink P. L., 1996, A&AS, 120, 641
- Grundstrom et al. (2007) Grundstrom E. D., Blair J. L., Gies D. R., Huang W., McSwain M. V., Raghavan D., Riddle R. L., Subasavage J. P., Wingert D. W., Levine A. M., Remillard R. A., 2007, ApJ, 656, 431
- Haberl & White (1990) Haberl F., White N. E., 1990, ApJ, 361, 225
- Hall et al. (2000) Hall T. A., Finley J. P., Corbet R. H. D., Thomas R. C., 2000, ApJ, 536, 450
- Harding & Lai (2006) Harding A. K., Lai D., 2006, Rep. Prog. Phys., 69, 263
- Heindl et al. (2004) Heindl W. A., Rothschild R. E., Coburn W., Staubert R., Wilms J., Kreykenbohm I., Kretschmar P., 2004, in Kaaret P., Lamb F. K., Swank J. H., eds, AIP Conf. Proc. Vol. 714, X-ray Timing 2003: Rossi and Beyond. AIP, Melville, p. 323
- Hudec (1978) Hudec R., 1978, Mitt. Veranderl. Sterne, 8, 64
- Ikhsanov (2007) Ikhsanov, N. R., 2007, MNRAS, 375, 698
- Jahoda et al. (1996) Jahoda K., Swank J. H., Giles A. B., Strohmayer T., Zhang W., Morgan E. H., 1996, in Siegmund O. H., Gummin M. A., eds, Proc. SPIE Vol. 2808, EUV, X-Ray, and Gamma-Ray Instrumentation for Astronomy VII. SPIE, Bellingham, p. 59
- Koenigsberger et al. (1983) Koenigsberger G., Swank J. H., Szymkowiak A. E., White N. E., 1983, ApJ, 268, 782
- Koenigsberger et al. (2003) Koenigsberger G., Canalizo G., Arrieta A., Richer M. G., Georgiev L., 2003, RMxAA, 39, 17
- Koenigsberger et al. (2006) Koenigsberger G., Georgiev L., Moreno E., Richer M. G., Toledano O., Canalizo G., Arrieta A., 2006, A&A, 458, 513
- Li & van den Huevel (1999) Li X. D., van den Heuvel E. P. J., 1999, ApJ, 513, L45
- Masetti et al. (2006) Masetti N., Orlandini M., Dal Fiume D., Del Sordo S., Amati L., Frontera F., Palazzi E., Santangelo A., 2006, A&A, 653
- Mattana et al. (2006) Mattana F., Götz D., Falanga M., Senziani F., De Luca A., Esposito P., Caraveo P. A., 2006, A&A, 460, L1
- Meynet et al. (1994) Meynet G., Maeder A., Schaller G., Schaerer D., Charbonnel C., 1994, A&AS, 103, 97
- Mukherjee & Paul (2006) Mukherjee U., Paul B., 2006, JApA, 27, 37
- Nagase (1991) Nagase F., 1991, in Treves A., Perola G. C., Stella L., eds, LNP Vol. 385: Iron Line Diagnostics in X-ray Sources. Springer-Verlag, Berlin, p. 111
- Naik & Paul (2003) Naik S., Paul B., 2003, A&A, 401, 265
- Ogilvie & Dubus (2001) Ogilvie G. I., Dubus G., 2001, MNRAS, 320, 485
- Reig et al. (1996) Reig P., Chakrabarty D., Coe M. J., Fabregat J., Negueruela I., Prince T. A., Roche P., Steele I. A., 1996, A&A, 311, 879
- Ross & Fabian (2005) Ross R. R., Fabian A. C., 2005, MNRAS, 358, 211
- Rothschild et al. (1998) Rothschild R. E., et al., 1998, AAS, 30, 861
- Schönherr et al. (2007) Schönherr G., Wilms J., Kretschmar P., Kreykenbohm I., Santangelo A., Rothschild R. E., Coburn W., Staubert R., 2007, A&A, 472, 353
- Sood et al. (2006) Sood R. K., Farrell S. A., O’Neill P. M., Manchanda R. K., Ashok N. M., 2006, ASR, 38, 2779
- Soong et al. (1990) Soong Y., Gruber D. E., Peterson L. E., Rothschild R. E., 1990, ApJ, 348, 641
- Taylor et al. (1995) Taylor M., Finley J. P., Kurt C., Koenigsberger G., 1995, AJ, 109, 396
- Thompson et al. (2007) Thompson T. W. J., Tomsick J. A., in ’t Zand J. J. M., Rothschild R. E., Walter R., 2007, ApJ, 661, 447
- van Kerkwijk & Waters (1989) van Kerkwijk M. H., Waters L. B. F. M., 1989, in Hunt J., Battrick B., eds, Proc. 23rd ESLAB Symp., ESA SP-296: Two Topics in X-Ray Astronomy, Vol. 1: X-Ray Binaries. ESA, Noordwijk, p. 473
- Wang & Welter (1981) Wang Y.-M., Welter G. L., 1981, A&A, 102, 97
- Wasserman (2003) Wasserman I., 2003, MNRAS, 341, 1020
- Wen et al. (2006) Wen L., Levine A. M., Corbet R. H. D., Bradt H. V., 2006, ApJS, 163, 372
- White et al. (1983) White N. E., Swank J. H., Holt S. S., 1983, ApJ, 270, 711
- Yamauchi et al. (1990) Yamauchi S., Asaoka I., Kawada M., Koyama K., Tawara, Y., 1990, PASJ, 42, L53
Appendix A Individual Light Curves
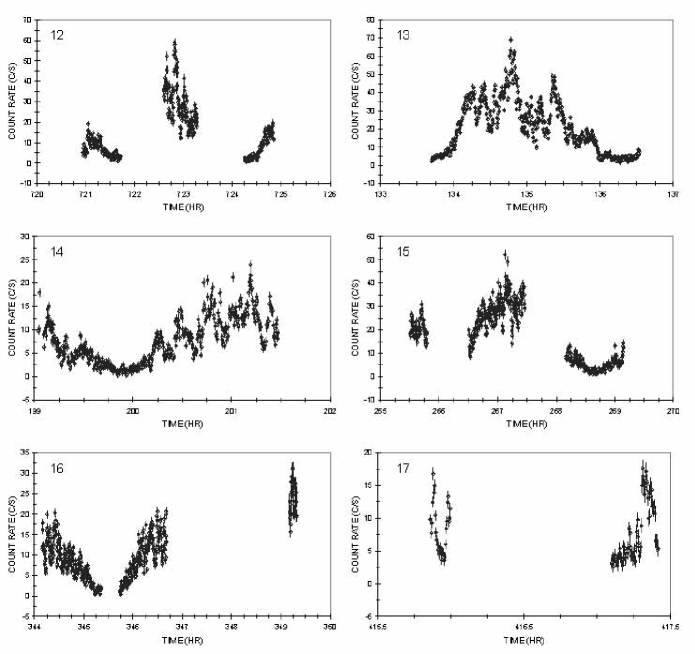
The individual light curves for the 2 – 9 keV (A) energy band from each of the 22 observations are included in this Appendix.
Appendix B Phase Resolved Spectra
The spectra from the pulse, orbital and super-orbital phase resolved analyses are included in this Appendix.