Photon pressure induced test mass deformation in gravitational-wave detectors
Abstract
A widely used assumption within the gravitational-wave community has so far been that a test mass acts like a rigid body for frequencies in the detection band, i.e. for frequencies far below the first internal resonance. In this article we demonstrate that localized forces, applied for example by a photon pressure actuator, can result in a non-negligible elastic deformation of the test masses. For a photon pressure actuator setup used in the gravitational wave detector GEO 600 we measured that this effect modifies the standard response function by 10 % at 1 kHz and about 100 % at 2.5 kHz.
pacs:
04.80.Nn, 95.75.Kk1 Introduction
The currently operating laser-interferometric gravitational-wave detectors GEO 600 [1], Virgo [2], LIGO [3] and TAMA300 [4] are using cylindrical test masses made of fused silica to probe changes in the metric originating from gravitational waves. Usually such test masses are considered to behave as rigid bodies for any applied force.
However, in this article we show that a non-uniformly distributed force acting on a test mass can cause a significant deformation. We evaluate this effect quantitatively, using the photon pressure actuator installed at the GEO 600 interferometer. Such a photon pressure actuator was first demonstrated by Clubley et al [5] to be employed as an easy and independent method for displacement calibration of a gravitational-wave detector.
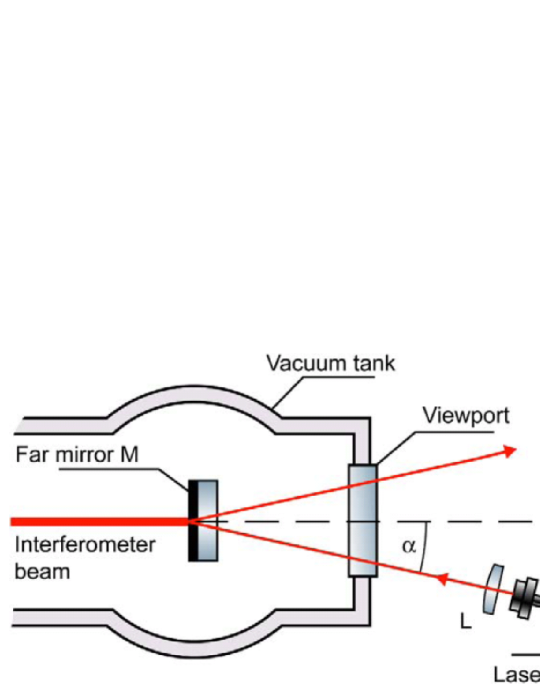
Figure 1 shows a diagram of the the experimental setup of the photon pressure actuator in the GEO 600 detector. The light of a laser diode is collimated by a lens, L, and enters the vacuum system via a viewport, before it is impinging on one of the main mirrors, M. More detailed descriptions of the setup can be found in [6] and [7].
In Section 2 we calculate the expected test mass deformation induced by the photon pressure using three different methods. A 2-Dimensional and a 3-Dimensional finite element analyses are performed as well as an analytical estimation. The corresponding displacement sensed by the gravitational wave detector is evaluated in Section 3 using a simple model. A prediction is made of how the response to the photon actuator changes when the test mass deformation effect is taken into account. The presence of the test mass deformation is experimentally confirmed by measurements presented in Section 4.
2 Models used to calculate the test mass deformation
In order to evaluate the effect from any test mass deformation introduced by photon pressure, we have to calculate the actual deformation caused by the setup of the GEO photon pressure actuator. Table 1 indicates the parameters used for the calculations.
| Test mass diameter | 180 mm |
|---|---|
| Test mass thickness | 100 mm |
| Test mass material | Fused silica (Suprasil) |
| Beam of photon pressure actuator | 5 mm diameter (Gaussian) |
| Interferometer beam | 50 mm diameter (Gaussian) |
Altogether we compared three different ways to calculate the mirror deformation: Two finite element analyses have been performed in addition to a (quasi-)analytical calculation. The following list gives a short description of each of the methods applied:
-
•
ANSYS: Ansys is a well known finite element software package [8]. The 3-Dimensional model consisted of about 42000 elements. A non homogenous mashing was chosen, employing a very dense meshing in the center of the test mass in order to resolve the maximum of the deformation.
-
•
Comsol: Comsol Multiphysics [9] is also a widely used finite element analysis software package. The deformation of the cross-section of the test mass was analyzed by performing a 2-Dimensional simulation.
- •
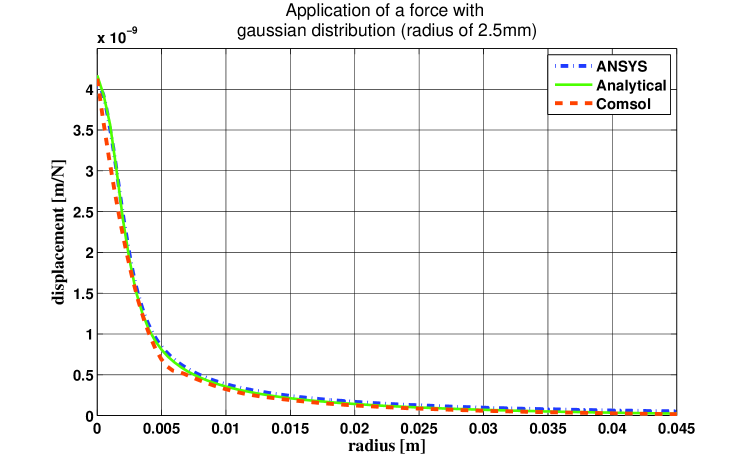
Figure 2 shows the radial profile of the calculated displacement of the test mass surface, . The three methods agree pretty well over the full radius of the test mass.
The effective displacement actually measured by the interferometer, , is determined by the overlap of the mirror deformation and the main interferometer beam, which can be described by a gaussian beam. The radial intensity of the interferometer beam, , is given by
| (1) |
where mm is the radius of the beam. Each point on the mirror surfaces contributes to the total effective displacement, , weighted by the product of the power of the main interferometer beam, , and the corresponding displacement 111The phase change of the interferometer light due to the mirror deformation is proportional to the light amplitude . At the sensing point of the interferometer (which is a photodiode) the signal is beaten with the local oscillator, which also has a spatial profile of . Taking both these effects into account we have to use for weighting the radial test mass deformation .. For a radially symmetric setup, as described above, the total effective displacement can be expressed by a single integral:
| (2) |
The factor is a normalization factor for in order to give
| (3) |
Using Equation 2 the total effective displacement for all three calculated test mass deformations can be derived. The corresponding results are displayed in the second column of table 2. For the three different calculations of the test mass deformation the effective displacement sensed by the main interferometer, , agrees within about 10 %.
| effective displacement [m/N] | resulting notch frequency [Hz] | |
|---|---|---|
| Ansys | 3598 | |
| Comsol | 3768 | |
| Analytical | 3741 |
3 Predicted effect of the photon pressure induced test mass deformation
The previous section showed that the test masses are not completely rigid and that the photon pressure actuator beam really causes a non-negligible deformation. Next we have to evaluate how strong the displacement originating from the non-rigidity of the test mass is, compared to the displacement of the center of mass (originating from the pendulum response). Since both responses are linear in the applied light power of the photon pressure actuator we can simply compare their responses.
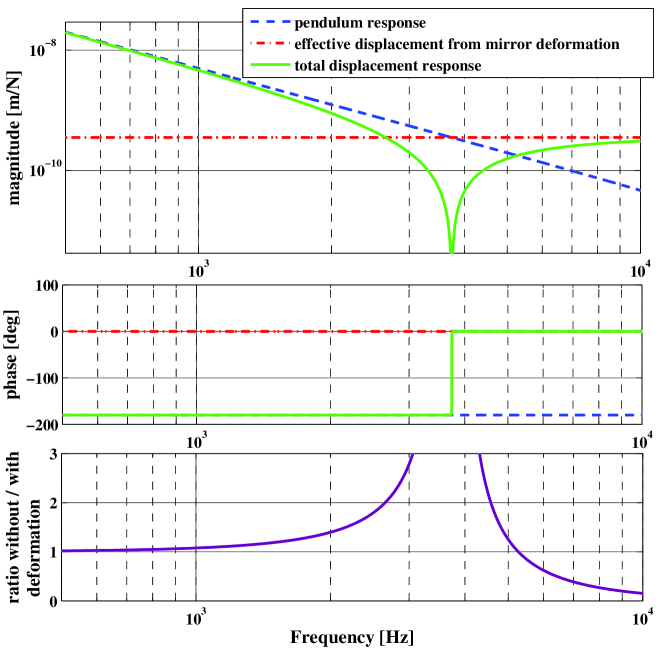
The pendulum response, , follows a -law, has a magnitude of m/N at 100 Hz and is 180 degrees out of phase with the light power modulation (see blue dashed trace Figure 3)222Due to the fact that we are only interested in frequencies far above the resonance of the pendulum which is around 1 Hz, excitation and pendulum motion have opposite phase.. The response of the mirror deformation, , is assumed to be flat in frequency and in phase with the modulated light power for frequencies below the first internal resonances of the test mass, which in the case of a GEO test mass, has a frequency of roughly 11 kHz [12]. In the previous Section effective displacements in the range to m/N were found. The magnitude and phase of from the analytical test mass deformation is shown by the red dashed-dotted trace in Figure 3. The total response, , plotted in green (solid) is the sum of the two individual responses:
| (4) |
The total response shows a steep notch at the frequency where the individual responses have the same magnitude and compensate each other completely due to having opposite phase. At the frequency of the notch the phase of jumps from -180 to 0 degrees. The modelled notch frequencies for the three different methods are displayed in the third column of Table 2. The resulting discrepancy between the photon pressure actuator response without and with test mass deformation, is shown in the lowest subplot of Figure 3. Already at 1 kHz the test mass deformation causes an effect of 10 %. At 2 kHz the error, when not taking the test mass deformation into account, amounts to 40 % and between 2.6 kHz and 4.6 kHz the discrepancy is larger than 100 %.
4 Measurement of the photon pressure induced test mass deformation
In order to varify this model we injected signals to the photon pressure actuator over a wide frequency range including frequencies as high as 6 kHz to be able to resolve any potential notch structure. The measurements presented here include long duration measurements to achieve reasonable snr at high frequencies. Individual measurement points are made of single discrete Fourier transforms (DFT) containing up to 10 hours of data. Such amounts of data are difficult to handle with standard computers. A heterodyne technique was employed to reduce the volume of data. The time series of the data containing the signal of interest, , is multiplied by a sine wave with a slightly lower frequency, :
| (5) |
The second term on the right hand side of Equation 5 still contains the signal, but shifted towards even higher frequencies. The signal component we are interested in is shifted to a very low frequency, , which for our investigations was chosen to be 9 Hz. After heterodyning, the data stream is strongly low pass filtered and down sampled to give a data stream that can be handled by desktop computers. Figure 4 shows the result of these measurements. The pink dashed line represents the photon pressure actuator response without taking test mass deformation into account, while the green solid line indicates the photon pressure actuator response taking the test mass deformation into account. The actual measurement of the response is displayed by the blue circles.
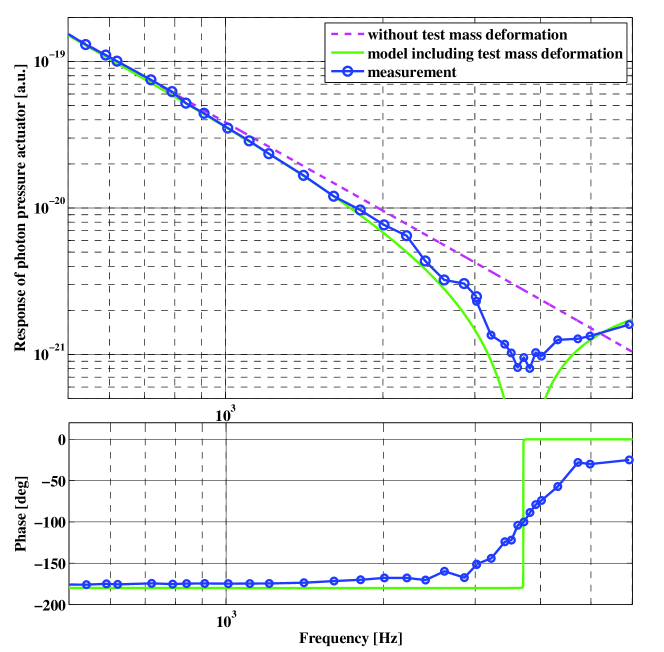
The presence of the expected notch structure and by this the non rigidity of the test masses in the detection band of the gravitational wave is clearly confirmed by the measurement. The magnitude of the response is about a factor of 3 below the pendulum response for frequencies between 3 to 4 kHz. At 5 kHz the measurement matches the pendulum response and finally at 6 kHz the measured response clearly exceeds the behavior of the pendulum response. Around the notch frequency, the phase of the photon pressure actuator response also changes significantly from about -165 degrees at 2.8 kHz to about -30 degrees at 4.8 kHz. A phase of nearly 0 degree at high frequencies clearly indicates that the total response of the system is no longer dominated by the pendulum response.
It can be seen that the notch is smeared out in the experimental data. This originates from beam jitter of the main interferometer beam resulting in a varying overlap of the main interferometer beam and deformed test mass. Different overlaps correspond to different effective displacements
| (6) |
which finally correspond to slightly shifted notch frequencies. Within the long measurement intervals of up to 10 hours the measurement averages over a variety of notch frequencies resulting in a smeared out notch. A detailed description of this effect, including a quantitative analysis can be found in [7].
5 Summary and Conclusions
We evaluated the deformation of a GEO 600 test mass caused by a narrow localized force, applied by a photon pressure actuator using finite element models as well as a analytical calculation. Based on these results we developed a simple model showing that for frequencies above 1 kHz the test mass deformation has a non negligible effect on the response of the photon pressure actuator. Actual measurements confirmed the predictions of our model, in particular around 3.8 kHz the presence of a notch structure in the photon pressure actuator response is clearly observed in the measurements.
Test masses of the currently operating laser-interferometric gravitational wave detectors cannot be considered to be rigid bodies for frequencies within the detection band. The effect of a test mass deformation needs to be taken into account when using photon pressure actuation for high precision calibration of any gravitational wave detector. Furthermore it should be mentioned that the actuation with widely used coil-magnet actuators can potentionally lead to test mass deformation effects as well.
References
References
- [1] Hild S et al 2006 The Status of GEO 600 Class. Quantum Grav. 23 S643–S651.
- [2] Acemese F et al 2004 Status of VIRGO Class. Quantum Grav. 21 S385–94.
- [3] Sigg D et al 2004 Commissioning of LIGO detectors Class. Quantum Grav. 21 S409–15.
- [4] Takahashi R (the TAMA Collaboration) 2004 Status of TAMA300 Class. Quantum Grav. 21 S403–8.
- [5] Clubley DA et al 2001 Calibration of the Glasgow 10m prototype laser interferometric gravitational wave detector using photon pressure Phys. Lett. A 283 85.
- [6] Mossavi K et al 2006 A photon pressure calibrator for the GEO600 gravitational wave detector Phys. Lett. A 353 1–3.
- [7] Hild S, Beyond the first generation: Extending the science range of the gravitational wave detector GEO 600, PhD-thesis, University of Hannover, 02/2007.
- [8] www.ansys.com
- [9] www.comsol.com
- [10] Bondu F et al 1998 Thermal noise in mirrors of interferometric gravitational wave antennas Phys. Lett. A 246 227–236.
- [11] Liu YT and Thorne KS 2000 Thermoelastic noise and homogeneous thermal noise in finite sized gravitational-wave test masses Phys. Rev. D 62 122002.
- [12] Smith R et al 2004 Mechanical quality factor measurements of monolithically suspended fused silica test masses of the GEO600 gravitational-wave detector Class. Quantum Grav. 21 1091- 1098.