Clouds, Gravity and Metallicity in Blue L dwarfs: The Case of 2MASS J11263991500355088affiliation: This paper includes data gathered with the 6.5 meter Magellan Telescopes located at Las Campanas Observatory, Chile.
Abstract
Optical and near-infrared spectroscopy of the newly discovered peculiar L dwarf 2MASS J112639915003550 are presented. Folkes et al. identified this source as a high proper motion L91 dwarf based on its strong H2O absorption at 1.4 . We find that the optical spectrum of 2MASS J11265003 is in fact consistent with that of a normal L4.5 dwarf with notably enhanced FeH absorption at 9896 Å. However, its near-infrared spectrum is unusually blue, with strong H2O and weak CO bands similar in character to several recently identified “blue L dwarfs”. Using 2MASS J11265003 as a case study, and guided by trends in the condensate cloud models of Burrows et al. and Marley et al., we find that the observed spectral peculiarities of these sources can be adequately explained by the presence of thin and/or large-grained condensate clouds as compared to normal field L dwarfs. Atypical surface gravities or metallicities alone cannot reproduce the observed peculiarities, although they may be partly responsible for the unusual condensate properties. We also rule out unresolved multiplicity as a cause for the spectral peculiarities of 2MASS J11265003. Our analysis is supported by examination of Spitzer mid-infrared spectral data from Cushing et al. which show that bluer L dwarfs tend to have weaker 10 absorption, a feature tentatively associated with silicate oxide grains. With their unique spectral properties, blue L dwarfs like 2MASS J11265003 should prove useful in studying the formation and properties of condensates and condensate clouds in low temperature atmospheres.
Subject headings:
stars: atmospheres — stars: fundamental parameters — stars: individual (2MASS J112639915003550) — stars: low mass, brown dwarfs1. Introduction
L dwarfs comprise one of the two latest-type spectral classes of very low mass stars and brown dwarfs, spanning masses at and below the hydrogen burning minimum mass (see Kirkpatrick 2005 and references therein). They are inexorably linked to the presence and properties of liquid and solid condensates which form in their cool photospheres (e.g., Tsuji, Ohnaka, & Aoki 1996; Burrows & Sharp 1999; Ackerman & Marley 2001; Allard et al. 2001; Cooper et al. 2003; Tsuji 2005). These condensates significantly influence the spectral energy distributions and photospheric gas abundances of L dwarfs, by removing gaseous TiO and VO from the photosphere and enabling the retention of atomic alkali species (e.g., Fegley & Lodders 1996; Burrows & Sharp 1999; Lodders 2002). Weakened H2O absorption through backwarming effects (e.g., Jones & Tsuji 1997; Allard et al. 2001) and red near-infrared colors ( 1.5–2.5; Kirkpatrick et al. 2000) also result from condensate opacity. In addition, periodic and aperiodic photometric variability observed in several L dwarfs has been associated with surface patchiness in photospheric condensate clouds (e.g., Bailer-Jones & Mundt 1999, 2001; Gelino et al. 2002; Mohanty et al. 2002). Condensate abundances at the photosphere appear to reach their zenith amongst the mid- and late-type L dwarfs (Kirkpatrick et al., 1999; Chabrier et al., 2000; Ackerman & Marley, 2001) before disappearing from the photospheres of cooler T dwarfs (Marley et al., 1996; Tsuji et al., 1996; Allard et al., 2001; Cushing et al., 2006). The abundances of photospheric condensates, their grain size distribution, and the radial and surface structure of condensate clouds may vary considerably from source to source, as well as temporally for any one source, and the dependencies of these variations on various physical parameters are only beginning to be explored (Helling et al., 2001; Woitke & Helling, 2003; Knapp et al., 2004).
With hundreds of L dwarfs now known,111A current list is maintained at http://dwarfarchives.org. groupings of peculiar L dwarfs – sources whose spectral properties diverge consistently from the majority of field objects – are becoming distinguishable. Examples include young, low surface gravity brown dwarfs (McGovern et al., 2004; Kirkpatrick et al., 2006; Allers et al., 2007; Cruz et al., 2007) and metal-poor L subdwarfs (Burgasser et al., 2003a; Lépine, Rich, & Shara, 2003; Gizis & Harvin, 2006; Burgasser, Cruz & Kirkpatrick, 2007). There also exists a class of peculiar “blue” L dwarfs (Cruz et al., 2003, 2007; Knapp et al., 2004), roughly a dozen sources exhibiting normal optical spectra but unusually blue near-infrared colors and strong near-infrared H2O, FeH and K I features. Various studies have attributed these peculiarities to subsolar metallicity, high surface gravity, unresolved multiplicity and peculiar cloud properties (Gizis et al., 2000; Cruz et al., 2003, 2007; McLean et al., 2003; Burgasser et al., 2004; Knapp et al., 2004; Chiu et al., 2006; Folkes et al., 2007). Any one of these characteristics may impact the presence and character of condensates and condensate clouds in low temperature atmospheres.
In an effort to identify new nearby and peculiar L dwarfs, we have been searching for late-type dwarfs using near-infrared imaging data from the Deep Near Infrared Survey of the Southern Sky (DENIS; Epchtein et al. 1997). One of the objects identified in this program is DENIS J112639.9500355, a bright source which was concurrently discovered by Folkes et al. (2007) in the SuperCOSMOS Sky Survey (Hambly et al., 2001a, b, c, hereafter SSS) and the Two Micron All Sky Survey (hereafter 2MASS; Skrutskie et al. 2006). It is designated 2MASS J112639915003550 in that study, and we refer to the source hereafter as 2MASS J11265003. Based on its blue near-infrared colors and deep H2O absorption bands, Folkes et al. (2007) concluded that 2MASS J11265003 is a very late-type L dwarf (L91) which may have unusually patchy or thin condensate clouds. In this article, we critically examine the observational properties of 2MASS J11265003 to unravel the origins of its spectral peculiarities, and examine it as a representative of the blue L dwarf subgroup.
Our identification of 2MASS J11265003 and a slightly revised determination of its proper motion using astrometry from the SSS, DENIS and 2MASS catalogs are described in 2. Optical and near-infrared spectroscopic observations and their results are described in 3, along with determination of the optical and near-infrared classifications of 2MASS J11265003 and estimates of its distance and space kinematics. In 4 we analyze the properties of 2MASS J11265003 and blue L dwarfs in general, considering metallicity, surface gravity, condensate cloud and unresolved multiplicity effects. We also introduce a new near-infrared H2O index that eliminates discrepancies between optical and near-infrared types for these sources. Results are discussed and summarized in 5.
2. Identification of 2MASS J11265003
We initially identified 2MASS J11265003 in the DENIS Data Release 3 point source catalog as part of a sample constrained to have 9 15.5, (corresponding to spectral types M8 and later), (to exclude background giants), galactic latitudes 8 (excluding the Galactic plane) and declinations . Further details on this search sample and resulting discoveries will be made in a future publication (D. Looper et al., in preparation). The combined DENIS and 2MASS colors of 2MASS J11265003 are = 3.800.15 and = 1.170.04, consistent with a late type star or brown dwarf (e.g., Delfosse et al. 1997; Kirkpatrick et al. 2000).
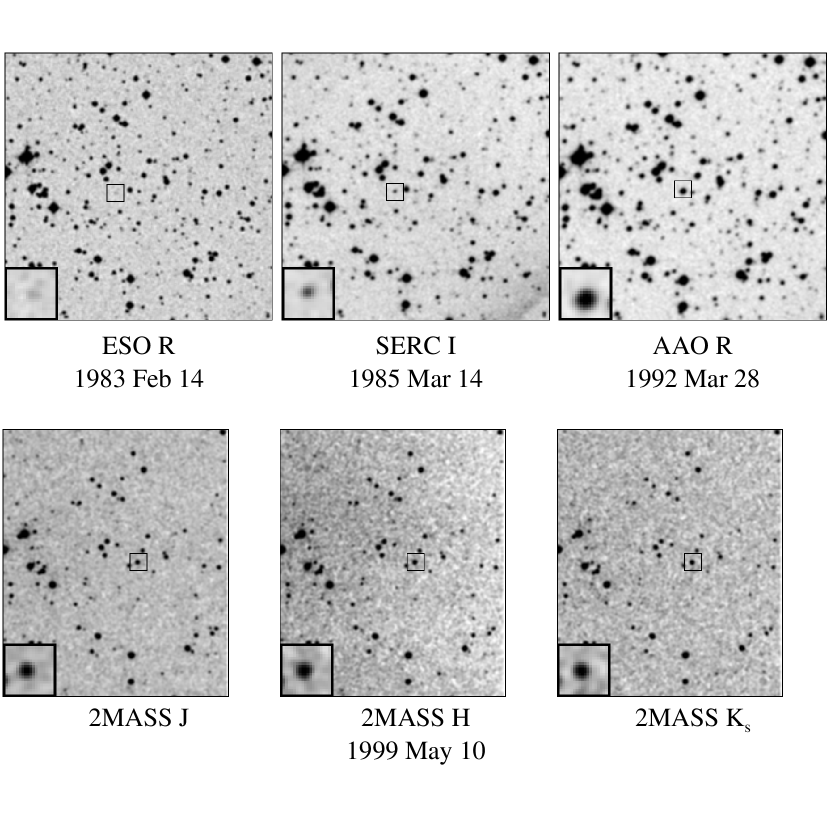
Figure 1 displays optical field images centered on the 2MASS/DENIS coordinates of 2MASS J11265003 as observed by the ESO (epoch 1983 February 14 UT), SERC (epoch 1985 March 14 UT) and AAO (epoch 1992 March 28 UT) photographic plate surveys (e.g., Hartley & Dawe 1981; Cannon 1984). There are no optical counterparts to 2MASS J11265003 in these images at the exact 2MASS/DENIS position, but faint, offset counterparts can be discerned. Based on SSS and 2MASS astrometry spanning 14.2 yr, Folkes et al. (2007) determined a substantial proper motion for 2MASS J11265003, yr-1. We confirm that the faint -band (20.4 mag) and -band (17.6 mag222Optical photometry as given in the SSS.) counterparts in the 1983 and 1985 photographic plate images are at the expected position of 2MASS J11265003 based on this motion, neither of which have coincident near-infrared counterparts.333A brighter optical star is coincident with the motion-corrected position of 2MASS J11265003 in the 1992 AAO image and obscures the proper motion source. The associated optical/near-infrared colors ( = 6.4; = 3.6) are again indicative of a late-type dwarf. A linear fit to the SSS, DENIS and 2MASS astrometry over 16.3 yr (Table 1) yields a value of yr-1 at position angle , where uncertainties include an estimated 03 astrometric uncertainty in both Right Ascension and declination for all three catalogs. Not surprisingly, this value is consistent with the measurement of Folkes et al. (2007). Note that neither proper motion measurement takes into account parallactic reflex motion, which is presumably much smaller than the aggregate linear motion of 2MASS J11265003 since 1983 (nearly 30).
3. Spectroscopic Observations
3.1. Optical Data
Optical spectroscopy of 2MASS J11265003 was obtained on 2006 May 8 (UT) using the Low Dispersion Survey Spectrograph (LDSS-3) mounted on the Magellan 6.5m Clay Telescope. LDSS-3 is an imaging spectrograph, upgraded from the original LDSS-2 (Allington-Smith et al., 1994) for improved red sensitivity. Conditions during the observations were clear with moderate seeing (07 at -band). We employed the VPH-red grism (660 lines/mm) with a 075 (4 pixels) wide longslit mask, aligned to the parallactic angle, to acquire 6050–10500 Å spectra across the entire chip with an average resolution of 1800. Dispersion along the chip was 1.2 Å/pixel. The OG590 longpass filter was used to eliminate second order light shortward of 6000 Å. A single slow-read exposure of 750 s was obtained at an airmass of 1.08. We also observed the G2 V star HD 97625 immediately after the 2MASS J11265003 observation and at a similar airmass for telluric absorption correction. The flux standard LTT 7987 (a.k.a. GJ 2147; Hamuy et al. 1994) was observed during the same run on 2006 May 7 (UT) using an identical slit and grism combination. All spectral observations were accompanied by HeNeAr arc lamp and flat-field quartz lamp exposures for dispersion and pixel response calibration.
LDSS-3 data were reduced in the IRAF444IRAF is distributed by the National Optical Astronomy Observatories, which are operated by the Association of Universities for Research in Astronomy, Inc., under cooperative agreement with the National Science Foundation. environment. Raw science images (separated into short and long wavelength halves) were first trimmed and subtracted by a median combined set of slow-read bias frames taken during the afternoon. The resulting images were then divided by the corresponding normalized, median-combined and bias-subtracted set of flat field frames. The G star spectra were first extracted using the APALL task, utilizing background subtraction and optimal extraction options. The spectrum of 2MASS J11265003 was extracted using the G star dispersion trace as a template. Dispersion solutions were determined from the arc lamp spectra extracted using the same dispersion trace; solutions were accurate to 0.1 pixels, or 0.12 Å. Flux calibration was determined using the tasks STANDARD and SENSFUNC with observations of LTT 7987, adequate over the spectral range 6000–10000 Å. Corrections to telluric O2 (6860–6960 Å B-band, 7580–7700 Å A-band) and H2O (7150–7300 Å) absorption bands were determined by linearly interpolating over these features in the G dwarf spectrum, dividing by the uncorrected spectrum, and multiplying the result with the spectrum of 2MASS J11265003. Note that we did not correct for 9270–9675 Å telluric H2O absorption due to the reduced signal at these wavelengths in the target and G dwarf spectra. Short and long wavelength data were then stitched together with no additional flux scaling.
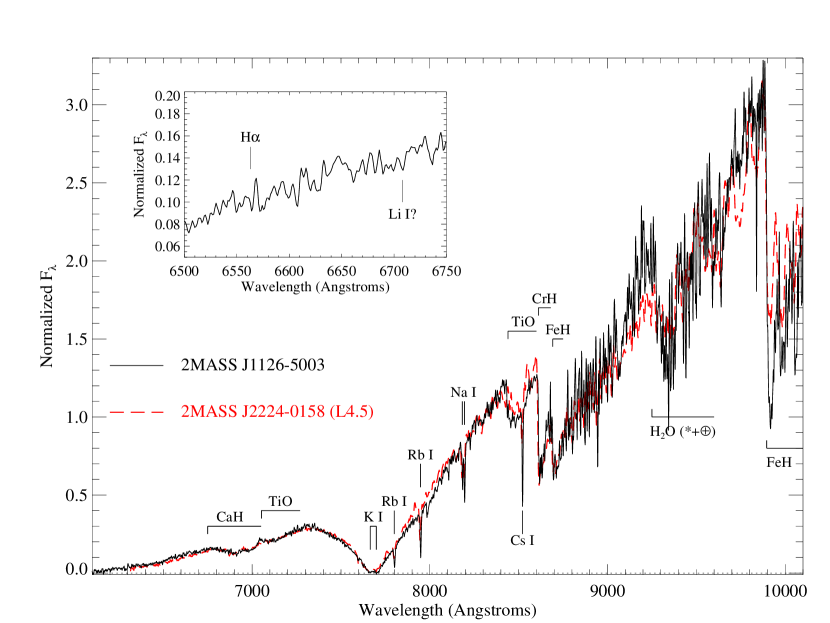
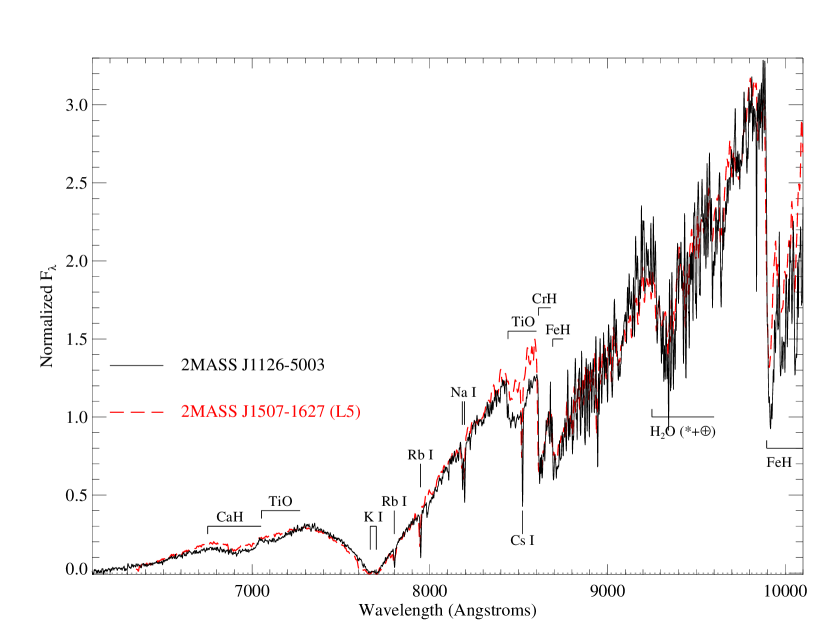
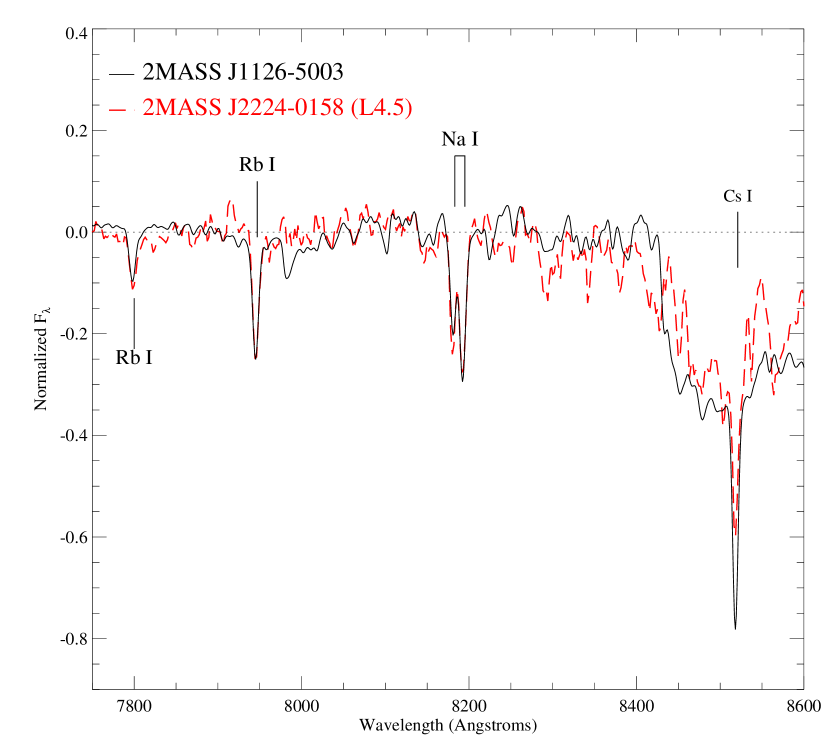
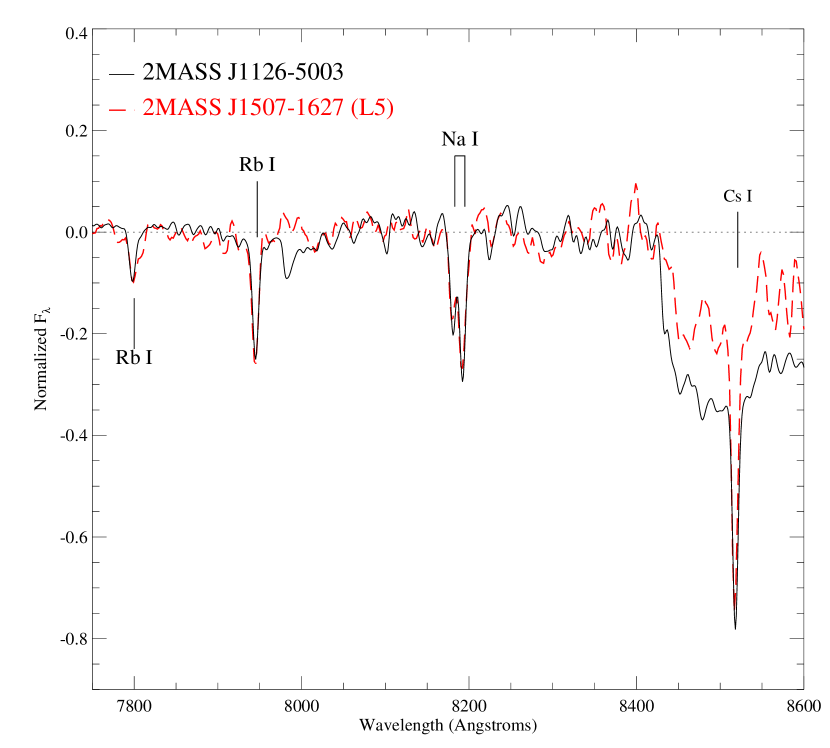
The reduced red optical spectrum of 2MASS J11265003 is shown in Figure 2, compared to the L4.5 2MASS J22244381-0158521 (Kirkpatrick et al., 2000, hereafter 2MASS J2224-0158) and the L5 2MASS J1507476-162738 (Reid et al., 2000, hereafter 2MASS J1507-1627)555The optical spectra of 2MASS J2224-0158 and 2MASS J1507-1627 were obtained using the Low Resolution Imaging Spectrograph (LRIS, Oke et al. 1995) mounted on the Keck 10m Telescope, and reduced by J. D. Kirkpatrick using identical IRAF routines. Comparisons of late-type spectra observed with both instruments show consistency to within 10% over the 6100–9000 Å range (Burgasser, Cruz & Kirkpatrick, 2007).. The overall optical spectral morphology of 2MASS J11265003 is well-matched to both L dwarf comparison sources, agreeing best with the L4.5 shortward of the pressure-broadened 7665/7699 Å K I doublet (Burrows, Marley, & Sharp, 2000; Allard et al., 2003; Burrows & Volobuyev, 2003) and the L5 longward of this feature. 2MASS J11265003 exhibits the same peak-up in flux between the blue wing of K I and the red wing of the pressure-broadened 5890/5896 Å Na I D lines present in the L dwarf comparison spectra, as well as line absorption from Rb I (7800 and 7948 Å), Na I (8183/8195 Å doublet) and Cs I (8521 Å). These lines are shown in detail in Figure 3, and their equivalent widths (EW) are listed in Table 2. Line strengths are similar to those of other midtype field L dwarfs (Kirkpatrick et al., 1999). The optical spectrum of 2MASS J11265003 also exhibits strong metal hydride bands at 6950 Å (CaH), 8600 Å (CrH and FeH) and 9896 Å (FeH); and weak TiO absorption at 7100 and 8400 Å. The 9896 Å Wing-Ford band of FeH is clearly stronger in the spectrum of 2MASS J11265003 as compared to either of the L dwarf comparison sources, while the 8400 Å TiO is also slightly deeper, particularly in contrast to 2MASS J1507-1627. These features suggest that 2MASS J11265003 could be slightly metal-poor, exhibiting the same peculiarities as L subdwarfs (Burgasser et al., 2003a; Burgasser, Cruz & Kirkpatrick, 2007), a point that is discussed further in 4.2.2.
A close examination at the 6500–6750 Å region (inset in Figure 2) reveals no significant emission from the 6563 Å H line, an indicator of magnetic activity. The absence of H is consistent with the general decline in optical magnetic emission between late-type M to midtype L dwarfs (Gizis et al., 2000; Mohanty & Basri, 2003; West et al., 2004). There is a weak feature at the location of the 6708 Å Li I line, an indicator of substellar mass (Rebolo, Martín, & Magazzu, 1992), but is of the same strength as noise features in this spectral region. The upper limit EW of the Li I line ( 0.4 Å) is considerably less than the minumum measured EWs of detected lines in other L-type brown dwarfs (3 Å; Kirkpatrick et al. 2000). We therefore conclude that Li I absorption is not present in the spectrum of 2MASS J11265003, although higher resolution, higher signal-to-noise observations are necessary to confirm this result.
3.2. Near-Infrared Data
Low resolution near-infrared spectral data for 2MASS J11265003 were obtained in clear conditions on 2006 December 20 (UT) using the SpeX spectrograph (Rayner et al., 2003) mounted on the 3m NASA Infrared Telescope Facility (IRTF). The 05 slit was employed, providing 0.75–2.5 spectroscopy with resolution and dispersion across the chip of 20–30 Å pixel-1. To mitigate the effects of differential refraction, the slit was aligned to the parallactic angle. Due to the southern declination of this source, observations were made close to transit but at fairly high airmass (3.0). 12 exposures of 60 s each were obtained in an ABBA dither pattern along the slit. The A0 V star HD 101802 was observed immediately afterward at a similar airmass (3.1) for flux calibration. Internal flat field and Ar arc lamps were also observed for pixel response and wavelength calibration.
Data were reduced using the SpeXtool package, version 3.3 (Cushing, Vacca, & Rayner, 2004), using standard settings. Raw science images were first corrected for linearity, pair-wise subtracted, and divided by the corresponding median-combined flat field image. Spectra were optimally extracted using the default settings for aperture and background source regions, and wavelength calibration was determined from arc lamp and sky emission lines. The multiple spectral observations were then median-combined after scaling individual spectra to match the highest signal-to-noise observation. Telluric and instrumental response corrections for the science data were determined using the method outlined in Vacca et al. (2003), with line shape kernels derived from the arc lines. Adjustments were made to the telluric spectra to compensate for differing H I line strengths in the observed A0 V spectrum and pseudo-velocity shifts. Final calibration was made by multiplying the spectrum of 2MASS J11265003 by the telluric correction spectrum, which includes instrumental response correction through the ratio of the observed A0 V spectrum to a scaled, shifted and deconvolved Kurucz666See http://kurucz.harvard.edu/stars.html. model spectrum of Vega.
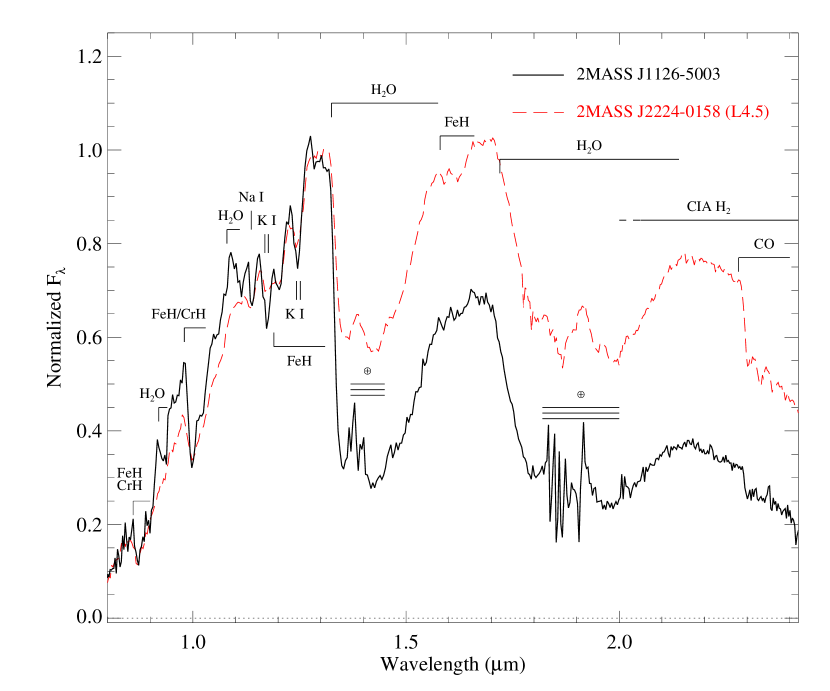
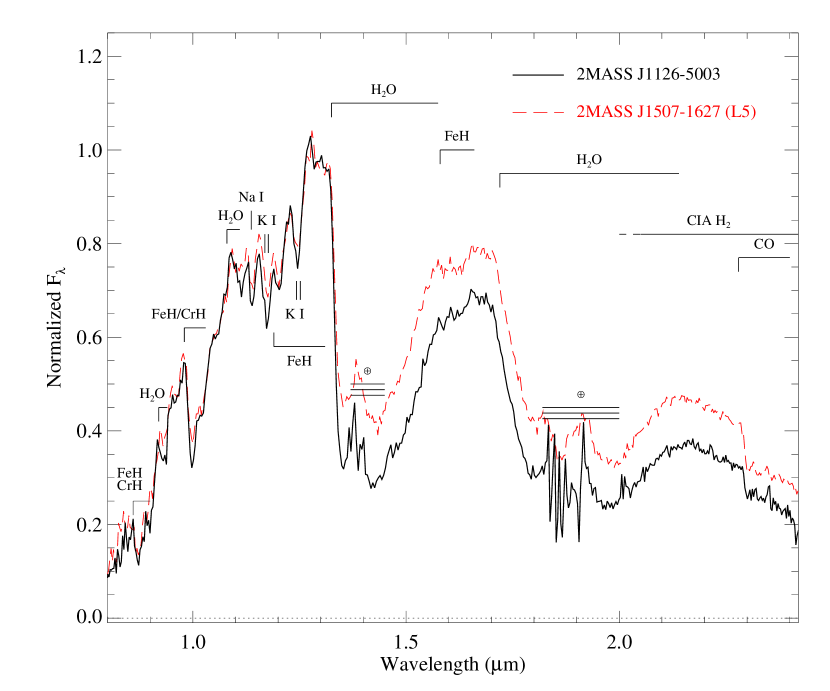
The reduced spectrum of 2MASS J11265003 is shown in Figure 4 and compared to equivalent SpeX prism data for 2MASS J2224-0158 (K. Cruz et al., in preparation) and 2MASS J1507-1627 (Burgasser, 2007b). While all three spectra exhibit features in common, including strong H2O (1.4 and 1.9 ), CO (2.3 ) and FeH bands (0.99, 1.2 and 1.6 ), and line absorption from K I and Na I in the 1.1–1.25 region, overall spectral morphologies differ markedly. The near-infrared spectrum of 2MASS J11265003 is a better match to that of 2MASS J1507-1627, but is clearly bluer than both L dwarf comparison sources. This is consistent with its bluer near-infrared colors, = 1.170.04 versus 2.050.04 and 1.520.04 for 2MASS J2224-0158 and 2MASS J1507-1627, respectively.777We confirmed that the flux calibration of the spectral data for both sources was accurate by computing synthetic colors using 2MASS and relative spectral response curves from Cohen, Wheaton & Megeath (2003). The synthetic colors agreed with photometric measurements to within their uncertainties. 2MASS J11265003 also exhibits stronger H2O absorption and weaker FeH and CO absorption longward of 1.4 , although the strong 0.99 FeH band is again evident. The deep H2O band at 1.4 was explicitly noted by Folkes et al. (2007) and cited as evidence that this source is a very late-type L dwarf. Indeed, we confirm that only L9 to T1 dwarfs have comparably strong H2O absorption (see Figure 2 in Folkes et al. 2007), although the absence of 1.6 and 2.2 CH4 absorption bands implies that 2MASS J11265003 is not a T dwarf (Burgasser et al., 2002; Geballe et al., 2002). Folkes et al. (2007) also note relatively strong alkali line absorption in the 1.1–1.3 spectrum of 2MASS J11265003, unresolved in our SpeX prism data.
Differences in the near-infrared spectral morphologies of L dwarfs with similar optical classifications but different colors has been previously noted and discussed in the literature (e.g., Fig. 24 in McLean et al. 2003 and Fig. 8 in Burgasser et al. 2007). The spectral comparisons in Figures 2 and 4 serve to emphasize that these differences are largely restricted to near-infrared wavelengths, involving not just shifts in spectral color but in specific features as well. The underlying physical causes for these differences, particularly for blue L dwarfs, are discussed further in 4.2.
3.3. Spectral Classification
Comparison of the optical spectrum of 2MASS J11265003 to those of 2MASS J2224-0158 and 2MASS J1507-1627 in Figures 2 indicate a midtype L dwarf optical classification. A more quantitative determination can be made by measuring the spectral ratios defined by Kirkpatrick et al. (1999). These values are listed in Table Clouds, Gravity and Metallicity in Blue L dwarfs: The Case of 2MASS J11263991500355088affiliation: This paper includes data gathered with the 6.5 meter Magellan Telescopes located at Las Campanas Observatory, Chile.,888Note that spectral ratio measurements were made after shifting the spectrum to its frame of rest; see 3.4. and yield an average subtype of L4.50.5. Spectral ratios from Martín et al. (1999) and Hawley et al. (2002) were also examined and yield consistent classifications of L4–L5 on the Kirkpatrick et al. (1999) scheme. The consistency of these various indices, and the overall agreement between the spectra of 2MASS J11265003 and 2MASS J2224-0158 as shown in Figure 2, indicate a robust optical type of L4.5 for this source.
This classification disagrees significantly with the near-infrared type determined by Folkes et al. (2007), L91, which is based largely on the strength of the deep 1.4 H2O band. This study also noted a “duality” in the near-infrared characteristics of 2MASS J11265003, with FeH features at 0.99 and 1.2 consistent with an early- to midtype L dwarf (based on indices defined by McLean et al. 2003). As the Folkes et al. (2007) spectrum spanned only the 1.0–1.6 region, we re-examined the near-infrared type for this source using our broadband 1.0–2.5 SpeX data.
There is as yet no formal spectral classification scheme for L dwarfs in the near-infrared; however, several studies have developed spectral index relations linked to optical classifications. We examined spectral ratios for low-resolution near-infrared data defined by Tokunaga & Kobayashi (1999); Reid et al. (2001); Geballe et al. (2002); Burgasser et al. (2006a); and Allers et al. (2007), which sample the prominent H2O bands and details within the spectral flux peaks. Values and associated spectral types (based on polynomial relations determined in the studies listed above) are listed in Table Clouds, Gravity and Metallicity in Blue L dwarfs: The Case of 2MASS J11263991500355088affiliation: This paper includes data gathered with the 6.5 meter Magellan Telescopes located at Las Campanas Observatory, Chile.. We derive an overall near-infrared spectral type of L6.52 based on the spectral type/index relations of Reid et al. (2001), with the uncertainty indicating the scatter in the index subtypes. This classification, while formally consistent with that of Folkes et al. (2007), is clearly poorly constrained. If only the indices sampling the 1.4 H2O band are considered, an average type of L81 is derived, in closer agreement with the result of Folkes et al. (2007). However, indices sampling features at wavelengths longward of 1.6 (i.e., K1, CH4 2.2 and CH4-K) yield a mean type of L50.5, consistent with the optical classification and in sharp disagreement with the H2O indices. The large discrepancy amongst the index subtypes simply reflects the fact that none of the L dwarf spectral standards provide a good match to the near-infrared spectral energy distribution of 2MASS J11265003. In other words, its near-infrared spectrum is truly peculiar.
3.4. Estimated Distance and Kinematics
Given its apparently robust optical spectral type, we chose to estimate the properties of 2MASS J11265003 by comparing it to other optically-classified midtype L dwarfs. A spectrophotometric distance estimate was determined by comparing this source’s 2MASS photometry to seven absolute magnitude/spectral type relations from Dahn et al. (2002); Cruz et al. (2003); Tinney, Burgasser, & Kirkpatrick (2003); and Vrba et al. (2004). The average distance derived was 152 pc, which includes a 0.5 subclass uncertainty in the optical classification. Distance estimates from -band photometry (14 pc) were slightly less than those from -band photometry (17 pc), consistent with the blue near-infrared colors of this source relative to other L4–L5 dwarfs. Our estimated distance for 2MASS J11265003 is nearly twice that of Folkes et al. (2007) based on their L9 near-infrared type. Given the better agreement in optical spectral morphology between 2MASS J11265003 and other L4–L5 dwarfs, we contend that our larger distance estimate is likely to be more accurate, assuming that 2MASS J11265003 is single (see 4.2.1).
The estimated distance and measured proper motion for 2MASS J11265003 implies a substantial tangential velocity, = 11715 km s-1. This is one of the highest s estimated or measured for any field L dwarf,999The L subdwarfs 2MASS J05325346+8246465 and 2MASS J16262034+3925190 have considerably larger s consistent with their halo kinematics (Burgasser et al., 2003a; Burgasser, 2004). surpassed only by the blue L3 dwarf 2MASSI J1721039+334415 (Cruz et al., 2003, hereafter 2MASS J1721+3344) with = 13915 km s-1 (Schmidt et al., 2007). Indeed, only five out of 150 field L dwarfs with determinations have values greater than 100 km s-1, including 2MASS J11265003 (Schmidt et al., 2007, and references therein).
The radial velocity () of 2MASS J11265003 was measured using the Na I, Rb I and Cs I lines present in the 7800–8600 Å region (Figure 3). Line centers were determined from Gaussian fits to the line cores and compared to vacuum wavelengths listed in the Kurucz Atomic Line Database101010Obtained through the online database search form created by C. Heise and maintained by P. Smith; see http://cfa-www.harvard.edu/amdata/ampdata/kurucz23/sekur.html. (Kurucz & Bell, 1995). The mean and standard deviation of velocity shifts for these five lines gives = 469 km s-1, which includes a 5 km s-1 uncertainty in the dispersion solution of the optical data. The corresponding [] space velocities of 2MASS J11265003 in the Local Standard of Rest (LSR), assuming an LSR solar motion of [] = [10,5,7] km s-1 (Dehnen & Binney, 1998), is estimated as [] km s-1. These values are just within the 3 velocity dispersion sphere of local disk M dwarfs ([,,] [40,28,19] km s-1 centered at [-13,-23,-7] km s-1; Hawley, Gizis, & Reid 1996), indicating that 2MASS J11265003 is likely to be an old disk or thick disk star. 2MASS J11265003 would appear to be considerably older than the average field L dwarf. This is consistent with the absence of Li I absorption in its optical spectrum, implying an age 2 Gyr for a mass 0.065 M☉, assuming a best guess Teff 1700 K (typical for L4–L5 dwarfs; Golimowski et al. 2004; Vrba et al. 2004) and solar metallicity evolutionary models (Burrows et al., 1997). Table Clouds, Gravity and Metallicity in Blue L dwarfs: The Case of 2MASS J11263991500355088affiliation: This paper includes data gathered with the 6.5 meter Magellan Telescopes located at Las Campanas Observatory, Chile. summarizes the estimated physical properties of 2MASS J11265003.
4. Analysis
4.1. 2MASS J11265003 in Context: The Blue L Dwarfs
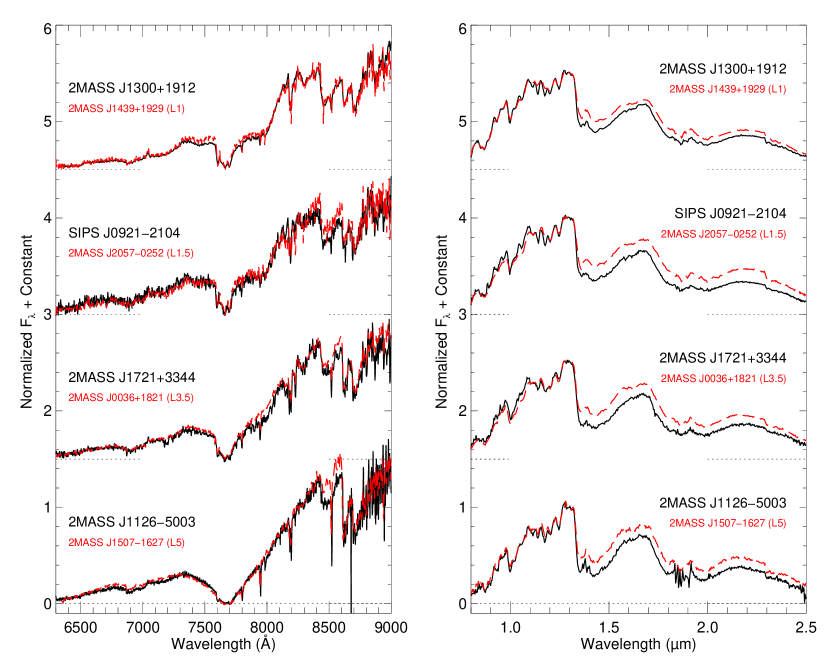
The discrepancies between the optical and near-infrared spectral classifications of 2MASS J11265003, and the near-infrared spectral peculiarities noted in 3.2, are consistent with the characteristics of blue L dwarfs reported in the literature. This is illustrated in Figure 5, which compares the optical and near-infrared spectra of 2MASS J11265003 and three early-type blue L dwarfs — the L1 2MASS J13004255+1912354 (hereafter 2MASS J1300+1912; Gizis et al. 2000) the L2 SIPS J0921-2104 (Deacon, Hambly & Cooke, 2005), and the L3 2MASS 1721+3344 — to “normal” L dwarfs with equivalent optical classifications.111111Additional optical spectral data shown here are from Kirkpatrick et al. (2000); Cruz et al. (2003, 2007) and K. Cruz et al. (in preparation). Additional SpeX prism spectral data shown are from Burgasser et al. (2007); Burgasser (2007b) and K. Cruz et al. (in preparation). All four sources are 0.3–0.5 mag bluer than the average for their optical spectral type (e.g., Kirkpatrick et al. 2000), and all show enhanced 1.4 H2O absorption, weak CO absorption and unusually blue spectral energy distributions as compared to their normal L dwarf counterparts.
In addition, there is consistent disagreement between optical and near-infrared classifications amongst these sources. Using the spectral index relations of Reid et al. (2001), we find that near-infrared types are 2 subtypes later than optical types, larger than the uncertainties in these relations; and the near-infrared indices themselves exhibit significant scatter. The similarities between these L dwarfs suggests that their spectral peculiarities have a common origin.
4.2. Why are Blue L Dwarfs Peculiar?
What drives these spectral peculiarities? As noted in 1, various studies have evoked unresolved multiplicity, subsolar metallicities, high surface gravities and thin condensate clouds as possible causes. We examine each of these possibilities below, focusing primarily on the properties of 2MASS J11265003.
4.2.1 Unresolved Multiplicity?
Peculiar spectra commonly arise from the combined light of two blended sources with differing spectral types. Examples include M dwarf plus white dwarf binaries (e.g., Wachter et al. 2003) and L dwarf plus T dwarf binaries (e.g., Cruz et al. 2004; Looper, Kirkpatrick & Burgasser 2007). Folkes et al. (2007) explicitly considered this possibility for 2MASS J11265003 in their analysis. Indeed, a case for unresolved multiplicity can be made based on the apparent similarities of this source to the blue L dwarf SDSS J080531.84+481233.0 (hereafter SDSS J0805+4812; Hawley et al. 2002), which itself appears to be a binary (Burgasser, 2007b). While Folkes et al. (2007) reject unresolved multiplicity as an explanation for the peculiarity of 2MASS J11265003, we examine this possibility again using our more comprehensive spectral coverage.
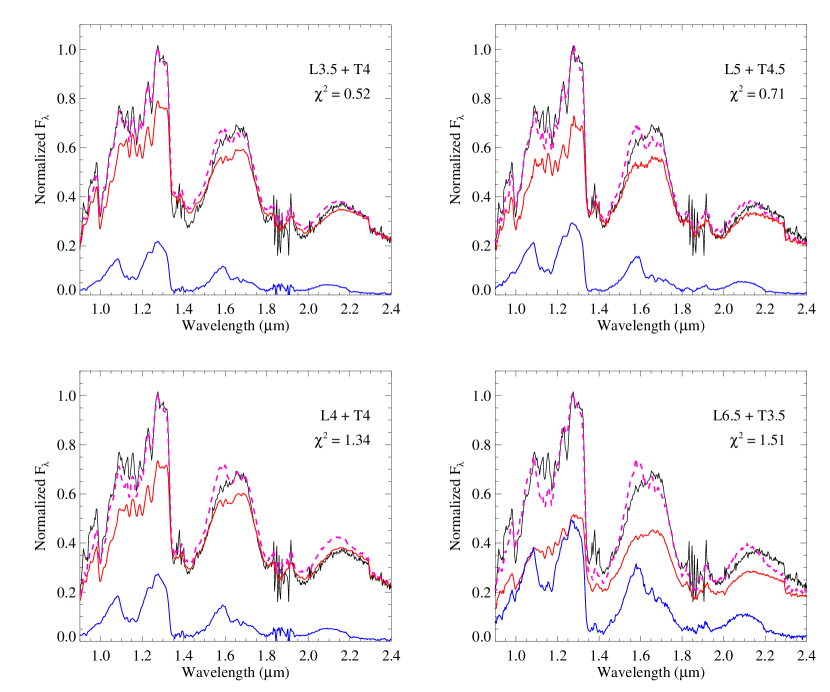
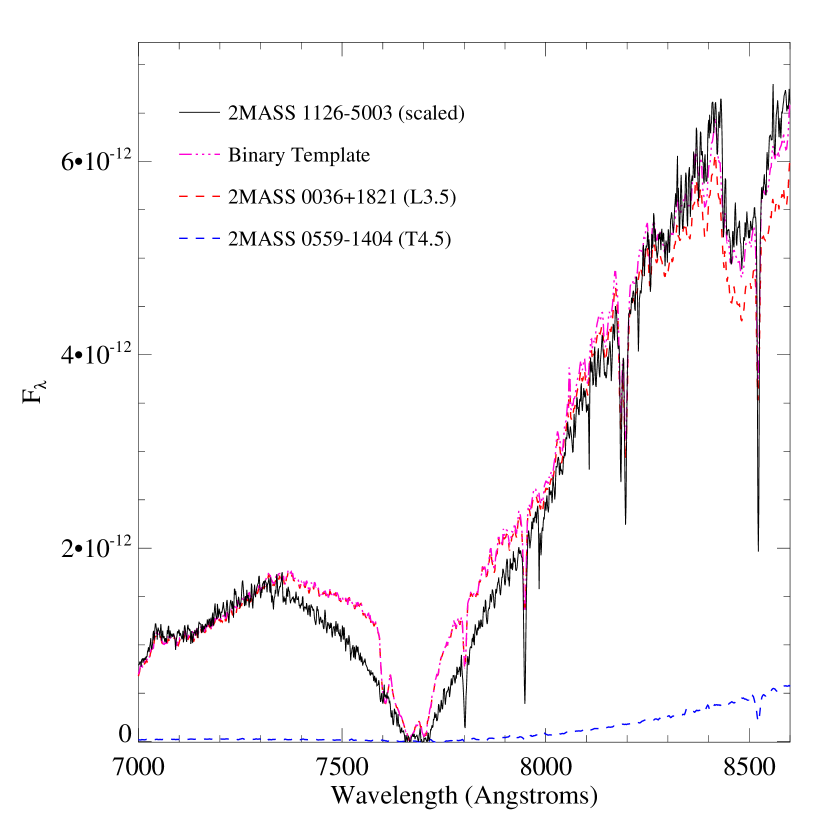
We compared the near-infrared spectrum of 2MASS J11265003 to synthesized binary spectra constructed from SpeX prism data for a large sample of unresolved (i.e., apparently single) L and T dwarfs. Our analysis was identical to that described in Burgasser (2007b), with binary spectra constructed by scaling the spectral templates according to the /spectral type relation of Burgasser (2007a). Figure 6 displays the four best binary fits based on the minimum deviation between the normalized spectra.121212Here, , where is the spectrum of 2MASS J11265003 and the spectrum of the synthesized binary over the set of wavelengths = 1.0–1.35, 1.45–1.8 and 2.0–2.35 . See Burgasser (2007b). The best fitting pair, composed of the L3.5 2MASSW J0036159+182110 (Reid et al., 2000, hereafter 2MASS J0036+1821) and the T4 2MASS J21513839-4853542 (Ellis et al., 2005), is a fairly good match in the near-infrared, particularly for the deep H2O bands and blue spectral energy distibution of 2MASS J11265003. However, the weak 1.6 CH4 feature present in the synthesized binary spectrum (also seen in the spectrum of SDSS J0805+4812) is not present in the spectrum of 2MASS J11265003. Furthermore, this combination does not reproduce the optical spectrum of 2MASS J11265003, as illustrated in Figure 7.131313In this Figure, the spectrum of 2MASS J11265003 is compared to a binary template constructed from data for 2MASS J0036+1821 Reid et al. (2000) and the T4.5 2MASS J05591914-1404488 (Burgasser et al., 2000, 2003a), as no optical T4 spectrum was available. The component spectra were scaled to the measured magnitudes of these sources (16.410.02 and 19.110.07, respectively; Dahn et al. 2002). In this case, the T dwarf secondary contributes negligibly to the optical flux of the binary, and as a result the hybrid spectrum is nearly identical to that of 2MASS J0036+1821 (with the notable exception of weaker TiO absorption at 8400 Å) and inconsistent with that of 2MASS J11265003. Binaries with later-type primaries provide a better match at optical wavelengths, but result in stronger CH4 absorption at 1.6 and 2.2 (Figure 6). Similar results were found for alternate L and T dwarf absolute magnitude/spectral type relations (Liu et al., 2006; Burgasser, 2007a).
We therefore find no reasonable combination of normal L and T dwarf spectra that can simultaneously reproduce the optical and near-infrared spectrum of 2MASS J11265003, confirming the conclusion of Folkes et al. (2007) that this source is likely to be single. It is of course possible that 2MASS J11265003 is a binary with peculiar components. However, this scenario is less compelling than that in which 2MASS J11265003 is a solitary peculiar L dwarf.
4.2.2 Subsolar Metallicity?
A common explanation for the spectral peculiarities of blue L dwarfs is that their atmospheres are metal-depleted, causing a relative enhancement in collision-induced H2 absorption that preferentially suppresses flux at -band (Linsky, 1969; Saumon et al., 1994; Borysow, Jørgensen, & Zheng, 1997). This, along with a general reduction in metal opacity at shorter wavelengths, results in bluer colors. Indeed, blue near-infrared colors are common for metal-poor M- and L-type subdwarfs (Bessell, 1982; Leggett et al., 2000; Burgasser et al., 2003a). Low temperature metal-poor dwarfs also tend to exhibit stronger metal hydride bands and single metal lines due to the greater relative reduction in metal oxide absorption (e.g., Mould & Hyland 1976). This trend is also consistent with enhanced FeH and -band alkali line absorption observed in the near-infrared spectra of 2MASS J11265003 (Folkes et al., 2007) and other blue L dwarfs. In addition, L subdwarfs exhibit surprisingly enhanced TiO absorption, unexpected for a metal-depeleted atmosphere but consistent with reduced condensate formation (Burgasser et al., 2003a; Gizis & Harvin, 2006; Reiners & Basri, 2006; Burgasser, Cruz & Kirkpatrick, 2007). 2MASS J11265003 appears to exhibit this trait as well (Figure 2).
However, it is clear that the sources shown in Figure 5 are not as metal-poor as currently known L subdwarfs, given that the latter have far bluer near-infrared colors () and more peculiar optical and near-infrared spectral morphologies (Gizis & Harvin, 2006; Burgasser, Cruz & Kirkpatrick, 2007). Furthermore, the Na I, Rb I and Cs I lines in the 7800–8600 Å spectral band are similar in strength to those of both 2MASS J2224-0158 and 2MASS J1507-1627 (Figure 3), making it unlikely that 2MASS J11265003 is significantly metal-poor relative to these sources.
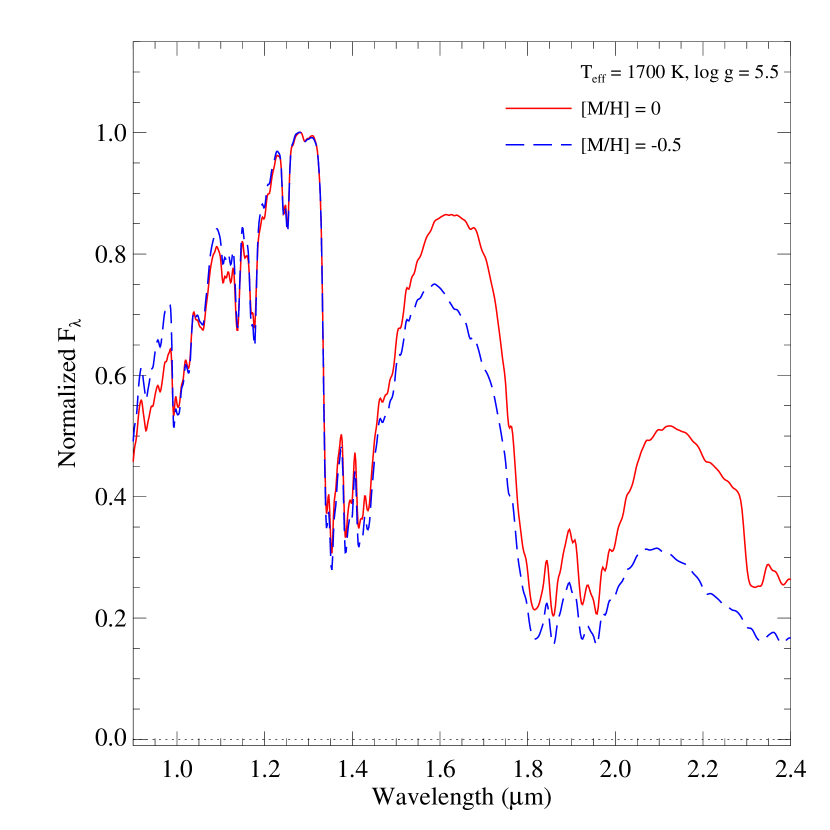
Can the spectral peculiarities seen in blue L dwarf spectra nevertheless be the result of modest subsolar metallicities; e.g., [M/H] -0.5? To address this question, we examined trends in the most recent theoretical spectral models from Burrows, Sudarsky & Hubeny (2006). While these models do not as yet reproduce the near-infrared spectra of L dwarfs in detail (cf., Burrows, Sudarsky & Hubeny 2006; Cushing et al. 2007), trends as a function of metallicity can be examined and compared to the deviations observed between normal and blue L dwarfs. Figure 8 illustrates this, comparing two normalized and smoothed condensate cloud models, both assuming Teff = 1700 K, = 5.5 (cgs) and a modal grain size = 100 , but differing in metallicity: [M/H] = 0 and -0.5. Consistent with the arguments above, the lower metallicity model exhibits both a bluer spectral energy distribution and enhanced 0.99 FeH absorption, as observed in the blue L dwarfs. However, no enhancement in the 1.4 H2O band is seen, as its opacity is uniformly reduced across most of the near-infrared spectral region. This inconsistency suggests that subsolar metallicity alone cannot explain the spectral peculiarities of blue L dwarfs, even if this is a characteristic trait of such sources.
4.2.3 High Surface Gravity?
Surface gravity influences the emergent spectral energy distribution of a late-type dwarf by modulating the photospheric gas pressure, affecting both pressure-sensitive features and gas/condensate chemistry. Spectral signatures of low surface gravity, including weakened alkali lines, enhanced metal oxide absorption and reduced H2 absorption (resulting in redder near-infrared colors), have all been used to identify and characterize young brown dwarfs (e.g., Luhman & Rieke 1999; McGovern et al. 2004; Kirkpatrick et al. 2006; Allers et al. 2007). As blue L dwarfs tend to have opposing spectral peculiarities, it is reasonable to consider that these sources may have high surface gravities, a result of being both older and more massive than their equivalently classified counterparts.
As discussed in 3.4, there is kinematic evidence to support this idea. 2MASS J11265003, 2MASS J1300+1921 and 2MASS J1721+3344 all have estimated 100 km s-1 (Gizis et al., 2000; Cruz et al., 2007), at the 3 tail of the L dwarf distribution of Schmidt et al. (2007). Knapp et al. (2004) and Cruz et al. (2007) have argued that the large space velocities of blue L dwarfs indicate that they may be members of the old disk or thick disk populations and, as such, are older and more massive than the average field L dwarf. The 2 Gyr lower age limit of 2MASS J11265003 based on the absence of Li I absorption in its optical spectrum is further evidence that this source is relatively old and has a high surface gravity.
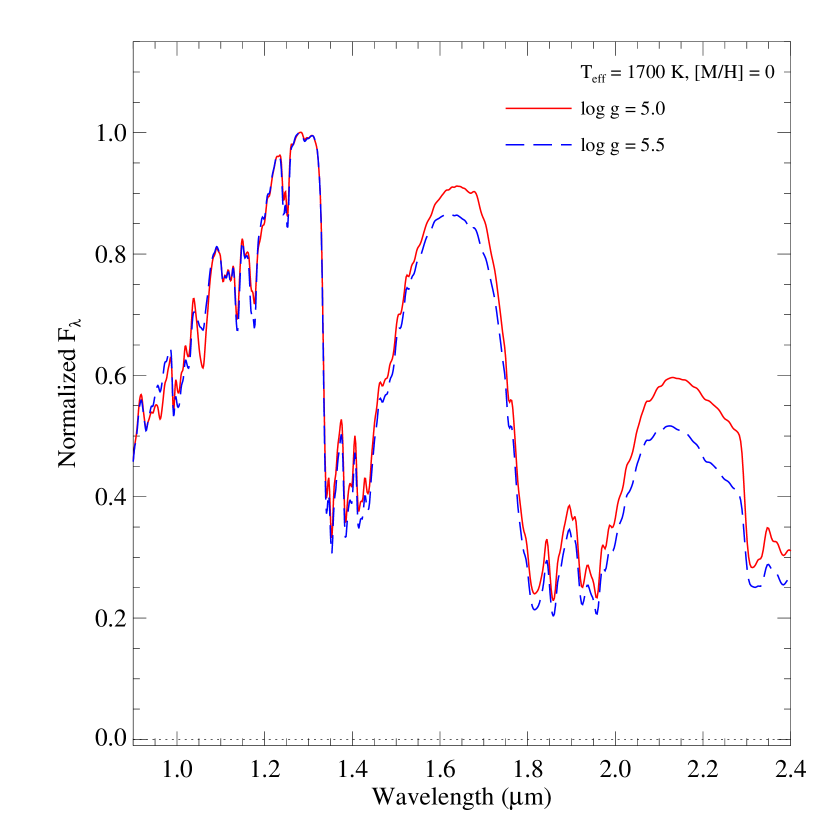
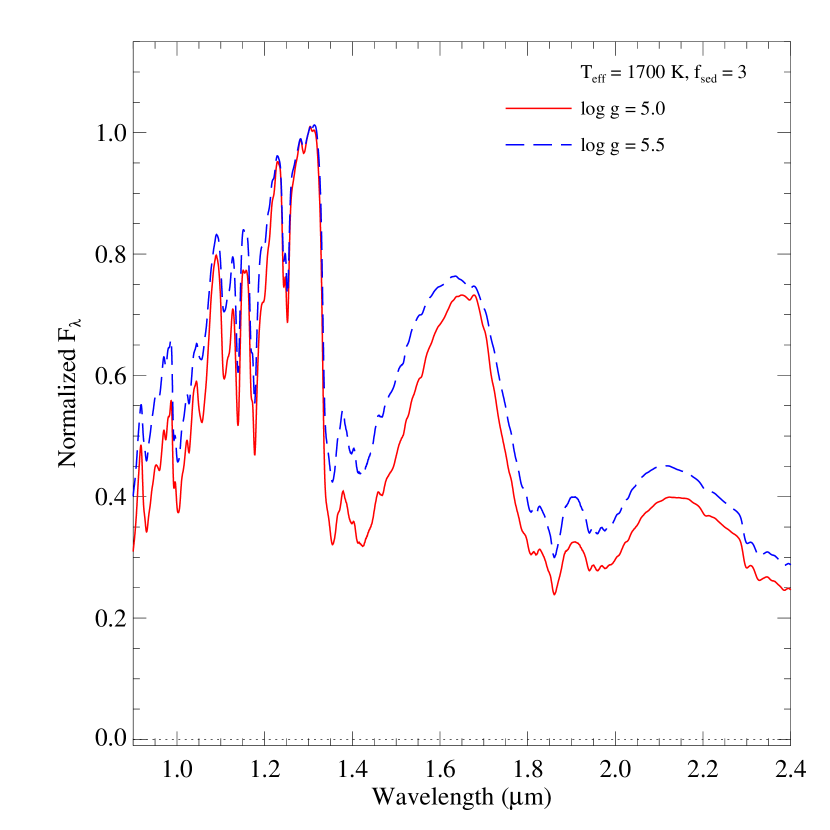
However, surface gravity effects alone also fail to explain the spectral peculiarities of 2MASS J11265003 and other blue L dwarfs. Figure 9 illustrates trends in surface gravity between = 5.0 and 5.5 for the condensate cloud models of Burrows, Sudarsky & Hubeny (2006) and M. Marley et al. (in preparation), assuming Teff = 1700 K, solar metallicity, and baseline cloud parameters ( = 100 and = 3; see Cushing et al. 2007). An increase in surface gravity in the Burrows et al. models results in similar qualitative trends as decreased metallicity, namely bluer near-infrared colors and somewhat stronger FeH and alkali line absorption. However, increasing the surface gravity from = 5.0 to 5.5 does not appear to change the depth of the 1.4 H2O band in any way. The Marley et al. models do show a change in H2O band strength with higher surface gravity, but in the opposite sense as observed in the blue L dwarfs; the absorption becomes weaker. The reduction in the H2O band contrast appears to be due to increased condensate opacity in the higher surface gravity models, affecting the flux peaks but not the deep molecular bands (Ackerman & Marley, 2001; Marley et al., 2002). Stronger condensate absorption at -band counteracts the increased H2 absorption at -band, such that colors are only modestly affected by changes in surface gravity in these models (see Figure 8 in Knapp et al. 2004). Hence, while blue L dwarfs like 2MASS J11265003 may have higher surface gravities than normal field dwarfs, this trait alone does not explain the spectral peculiarities observed.
4.2.4 Thin Condensate Clouds?
A fourth possibility is that the condensate clouds of blue L dwarfs are somehow thinner or less opaque than those of normal field L dwarfs (Knapp et al., 2004; Chiu et al., 2006; Cruz et al., 2007; Leggett et al., 2007). Reduced condensate opacity in the 1 spectral region allows other features such as FeH and alkali line absorption to appear stronger at these wavelengths, much as reduced metal oxide absorption allows metal hydride bands and alkali lines to emerge in the red optical spectra of L dwarfs (Kirkpatrick et al., 2000) and late-type M subdwarfs (Burgasser, Cruz & Kirkpatrick, 2007). Reduced condensate opacity also increases the contrast between the -band peak and the base of the 1.4 H2O band, producing a deeper feature; and between the and -band peaks (the latter dominated by H2 opacity), resulting in bluer near-infrared colors. Many of the spectral peculiarities observed in blue L dwarfs can be qualitatively explained by a reduction in condensate opacity.
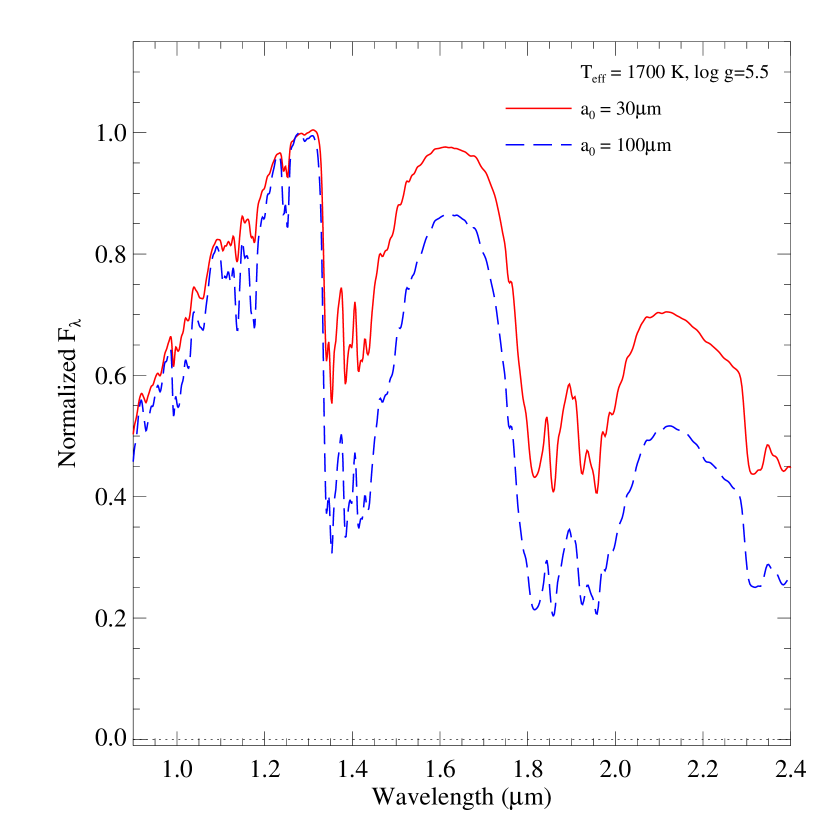
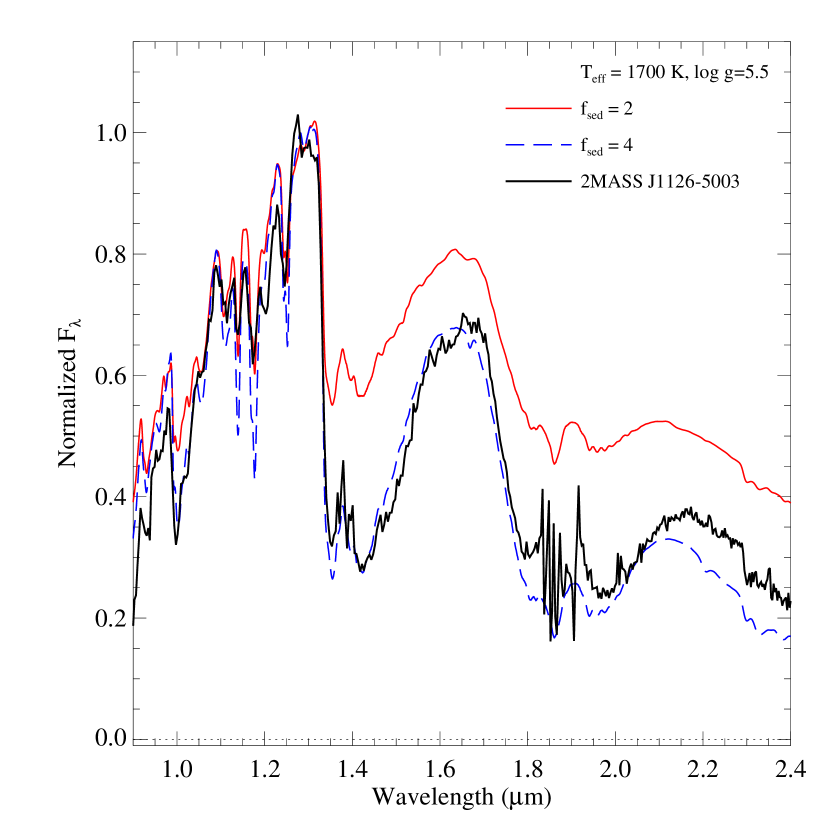
Theoretical spectral models quantitatively confirm these trends as well. Figure 10 compares models from Burrows, Sudarsky & Hubeny (2006) and M. Marley et al. (in preparation) for Teff = 1700 K, = 5.5 and solar metallicity, but with different treatments for the properties of the condensate cloud layers. For the Burrows et al. models, we compare different values for the condensate modal grain size, = 30 versus 100 . Larger grain sizes for a given total condensate mass corresponds to fewer grains and smaller total opacity (see Figure 6 in Burrows, Sudarsky & Hubeny 2006), resulting in a bluer near-infrared spectral energy distribution and stronger absorption features at the -band flux peak. In particular, the 1.4 H2O band is clearly enhanced in the larger-grain model. For the Marley et al. models, we compared different values for the parameter, which describes the efficiency of condensate sedimentation. Larger values of correspond to both thinner clouds and larger mean particle sizes (Ackerman & Marley, 2001). The trends are qualitatively similar to the Burrows et al. models: stronger atomic and molecular gas features and a bluer near-infrared spectral energy distribution as seen in the blue L dwarfs.
Knapp et al. (2004) have previously demonstrated that the colors of blue L dwarfs can be reproduced with models with thinner clouds (higher values of ). Figure 10 demonstrates that the spectra of these sources can be reproduced with thin cloud models as well. The = 4, Teff = 1700 K and = 5.5 model of Marley et al. provides an excellent match to the overall spectral energy distribution of 2MASS J11265003, including its blue color and deep FeH and H2O absorption bands. In contrast, most midtype L dwarf spectra are adequately reproduced assuming = 2–3 (Knapp et al., 2004; Cushing et al., 2007, M. Marley et al. in preparation). Cushing et al. (2007) have also found that models with progressively thinner clouds fit progressively bluer objects across the L dwarf/T dwarf transition.
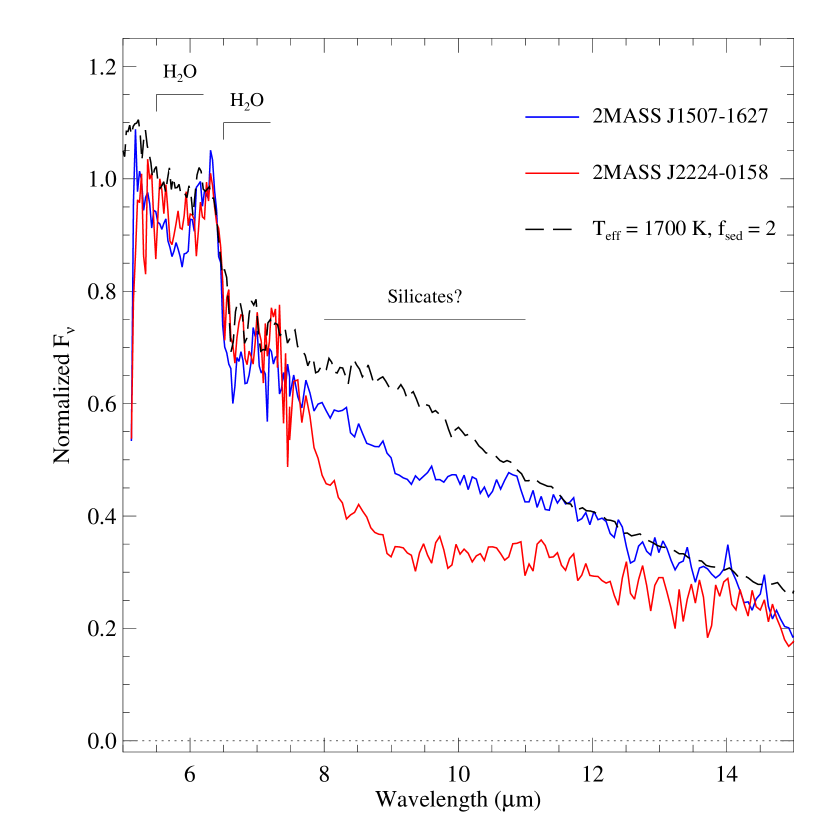
Further evidence that cloud properties play a significant role in the colors of L dwarfs can also be deduced from mid-infrared spectroscopy. Cushing et al. (2006) have recently reported a tentative identification of the Si-O stretching mode in the mid-infrared spectra of three midtype L dwarfs. This feature arises from small silicate grains in the photospheres of cloudy L dwarfs. If differences in the colors of L dwarfs are caused by condensate cloud effects, they should be correlated with the strength of the Si-O feature. This appears to be the case. Figure 12 compares the mid-infrared spectra of two sources from the Cushing et al. (2006) study, the L4.5 2MASS J2224-0158 and the L5 2MASS J1507-1627, whose optical and near-infrared spectra are also shown in Figures 2 and 4. These sources have colors that differ by over 0.5 mag, and are 0.2–0.3 mag redder and bluer than the average midtype L dwarf, respectively (Kirkpatrick et al., 2000). The 10 feature noted by Cushing et al. (2006) is clearly weaker in the bluer L dwarf, consistent with the interpretation of thinner and/or larger grained clouds. By analogy, we expect this feature in blue L dwarfs such as 2MASS J11265003 to be weaker still. This prediction can be tested with future observations.
The presence of thin (or large-grained) uniform condensate clouds therefore provides an adequate explanation for the spectral peculiarities of 2MASS J11265003 and other blue L dwarfs. Folkes et al. (2007) have also proposed a somewhat different interpretation of cloud properties in 2MASS J11265003: that the apparently reduced condensate opacity arises from holes in an otherwise thick cloud layer. This draws from an idea set forth by Ackerman & Marley (2001) and Burgasser et al. (2002) to explain the rapid disappearance of cloud opacity across the L dwarf/T dwarf transition. Indeed, Folkes et al. (2007) suggest that 2MASS J11265003 is itself an L/T transition object (consistent with its late near-infrared spectral type) that may be “crossing over” at an early stage, perhaps due to reduced metallicity (see also Burrows, Sudarsky & Hubeny 2006). The midtype L dwarf optical spectral morphology of this source, much earlier than the optical spectra of any T dwarf observed to date (Burgasser et al., 2003a, J. D. Kirkpatrick et al., in preparation), and the absence of CH4 absorption at 2.2 , a common feature of L9 dwarfs (Geballe et al., 2002), argues against this hypothesis. On the other hand, the blue L dwarf 2MASS J1300+1912 exhibits strong photometric variability (Gelino et al., 2002; Maiti et al., 2005) likely due to cloud structure, including perhaps cloud holes. Monitoring of 2MASS J11265003 may provide insight into the “cloud hole” interpretation of this source and blue L dwarfs in general. In any case, the basic premise of Folkes et al. (2007), that 2MASS J11265003 has reduced condensate opacity, is in agreement with our analysis.
4.3. Improved Near-Infrared Classification of Blue L Dwarfs
We now readdress the issue of the discrepancies between optical and near-infrared classifications of blue L dwarfs like 2MASS J11265003. These arise largely from the enhanced 1.4 H2O band, which as illustrated in Figure 10 is highly sensitive to condensate cloud properties (see also Stephens 2003). Since clouds also influence the near-infrared colors of L dwarfs, one possible way of reconciling these optical and near-infrared types is to use a color-corrected H2O index, analogous to the color-independent indices used to classify young reddened M and L dwarfs (e.g., Wilking, Greene & Meyer 1999; Allers et al. 2007). We constructed a “hybrid” index:
| (1) | |||||
| (2) |
where H2O is defined in Reid et al. (2001) and is defined in Burgasser et al. (2002). Figure 11 compares this ratio with another ratio sampling the 1.4 band (H2O from Burgasser et al. 2006a) as a function of optical spectral type (SpT) for a sample of SpeX prism data of unresolved and non-peculiar late-type M and L dwarfs (data from Burgasser 2007a and K. Cruz et al. in preparation) and the five blue L dwarfs shown in Figure 5. Linear fits to the normal M and L dwarfs yield the relations
| (3) |
| (4) |
with a scatter of 0.9 subtypes for both. The blue L dwarfs clearly stand apart in the spectral type/H2O comparison, and application of Equation 3 yields near-infrared spectral types that are 3.5-4 subtypes later than their optical types (Table 5). However, the subtypes inferred using Equation 4 for the four blue L dwarfs shown in Figure 5 are consistent with their optical types to within one subytpe. Note that SDSS J0805+4812 still stands apart from the locus of spectral type versus H2O(c), probably because its peculiarities arise from unresolved multiplicity as opposed to cloud effects. We advocate use of the H2O(c) ratio, along with ratios sampling the longer wavelength features (e.g., K1 or CH4-2.2 ), as cloud-independent estimators for the optical spectral types of single L dwarfs.
As pointed out in 3.3, there is as yet no formal near-infrared classification scheme for L dwarfs. Existing practice — tying near-infrared indices to optical spectral types — ignores the fact that secondary physical parameters such as the character of condensates and condensate clouds can modify the optical and near-infrared spectra of L dwarfs in different ways. Indeed, blue L dwarfs stand out as peculiar largely because their near-infrared spectra do not conform to the morphologies expected for their optical types. Future efforts at extending the existing L dwarf optical classification scheme to encompass near-infrared spectral morphologies will likely require consideration of additional classification parameters that take into account secondary effects, much as luminosity classes delineate surface gravity effects in stars. (for further discussion of these issues, see Kirkpatrick 2005). The definition of a multi-dimensional near-infrared classification scheme for L dwarfs is clearly beyond the scope of this study. We simply point out that blue L dwarfs such as 2MASS J11265003 are likely to serve as useful standards for delineating future “cloud classes” amongst L dwarfs.
5. Discussion
Our analysis in 4.2 leads us to conclude that the spectral peculiarities of 2MASS J11265003 and other blue L dwarfs have their immediate cause in condensate cloud effects, specifically the presence of thin, patchy or large-grained condensate clouds at the photosphere. Subsolar metallicities and high surface gravities in of themselves cannot reproduce the observed spectral peculiarities of these sources. However, it is clear that these latter physical properties must play a role in determining the cloud characteristics of blue L dwarfs. Lower metallicities reduce the metal species available to form condensates, resulting in less condensate material overall. Higher surface gravities may increase the sedimentation rate of condensate grains, potentially resulting in thinner clouds. The large tangential velocities and absence of Li I absorption in the three blue L dwarfs 2MASS J11265003, 2MASS J1300+1921 and 2MASS J1721+3344 support the idea that these sources may be relatively old and possibly slightly metal-poor. However, the influence of other physical parameters on condensate cloud properties must also be considered, including rotation rates, vertical upwelling rates (e.g., Saumon et al. 2006) and possibly magnetic field strengths.
An assessment of how these fundamental physical parameters influence the properties of condensate clouds in low-temperature atmospheres is the subject of ongoing theoretical investigations (e.g., Helling et al. 2001; Woitke & Helling 2003; M. Marley, in preparation). Empirical studies are also necessary, particularly those focused on well-characterized samples of blue (and red) L dwarfs. To this end, Table Clouds, Gravity and Metallicity in Blue L dwarfs: The Case of 2MASS J11263991500355088affiliation: This paper includes data gathered with the 6.5 meter Magellan Telescopes located at Las Campanas Observatory, Chile. lists all blue L dwarfs currently reported in the literature. We anticipate that this list will grow as near-infrared spectroscopic follow-up of L dwarfs continues.
References
- Ackerman & Marley (2001) Ackerman, A. S., & Marley, M. S. 2001, ApJ, 556, 872
- Allard et al. (2001) Allard, F., Hauschildt, P. H., Alexander, D. R., Tamanai, A., & Schweitzer, A. 2001, ApJ, 556, 357
- Allard et al. (2003) Allard, N. F., Allard, F., Hauschildt, P. H., Kielkopf, J. F., & Machin, L. 2003, A&A, 411, L473
- Allers et al. (2007) Allers, K. N., et al. 2007, ApJ, 657, 511
- Allington-Smith et al. (1994) Allington-Smith, J., et al. 1994, PASP, 106, 983
- Bailer-Jones & Mundt (1999) Bailer-Jones, C. A. L., & Mundt, R. 1999, A&A, 348, 800
- Bailer-Jones & Mundt (2001) —. 2001, A&A, 367, 218
- Bessell (1982) Bessell, M. S. 1982, PASA, 4, 417
- Borysow, Jørgensen, & Zheng (1997) Borysow, A., Jørgensen, U. G., & Zheng, C. 1997, A&A, 324, 185
- Burgasser (2004) Burgasser, A. J. 2004, ApJ, 614, L73
- Burgasser (2007a) Burgasser, A. J. 2007a, ApJ, 659, 655
- Burgasser (2007b) Burgasser, A. J. 2007b, AJ, in press
- Burgasser, Cruz & Kirkpatrick (2007) Burgasser, A. J., Cruz, K. L., & Kirkpatrick, J. D. 2007, ApJ, 657, 494
- Burgasser et al. (2006a) Burgasser, A. J., Geballe, T. R., Leggett, S. K., Kirkpatrick, J. D., & Golimowski, D. A. 2006a, ApJ, 637, 1067
- Burgasser et al. (2003a) Burgasser, A. J., Kirkpatrick, J. D., Burrows, A., Liebert, J., Reid, I. N., Gizis, J. E., McGovern, M. R., Prato, L., & McLean, I. S. 2003a, ApJ, 592, 1186
- Burgasser et al. (2003a) Burgasser, A. J., Kirkpatrick, J. D., Liebert, J., & Burrows, A. 2003a, ApJ, 594, 510
- Burgasser et al. (2007) Burgasser, A. J., Looper, D. L., Kirkpatrick, J. D., & Liu, M. C. 2007, ApJ, 658, 557
- Burgasser et al. (2002) Burgasser, A. J., Marley, M. S., Ackerman, A. S., Saumon, D., Lodders, K., Dahn, C. C., Harris, H. C., & Kirkpatrick, J. D. 2002a, ApJ, 571, L151
- Burgasser et al. (2004) Burgasser, A. J., McElwain, M. W., Kirkpatrick, J. D., Cruz, K. L., Tinney, C. G., & Reid, I. N. 2004, AJ, 127, 2856
- Burgasser et al. (2000) Burgasser, A. J., et al. 2000c, AJ, 120, 1100
- Burgasser et al. (2002) Burgasser, A. J., et al. 2002, ApJ, 564, 421
- Burrows, Marley, & Sharp (2000) Burrows, A., Marley, M. S., & Sharp, C. M. 2000, ApJ, 531, 438
- Burrows & Sharp (1999) Burrows, A., & Sharp, C. M. 1999, ApJ, 512, 843
- Burrows, Sudarsky & Hubeny (2006) Burrows, A., Sudarsky, D., & Hubeny, I. 2006, ApJ, 640, 1063
- Burrows & Volobuyev (2003) Burrows, A., & Volobuyev, M. 2003, ApJ, 583, 985
- Burrows et al. (1997) Burrows, A., et al. 1997, ApJ, 491, 856
- Cannon (1984) Cannon, R. D. 1984, in Astronomy with with Schmidt-Type Telescopes, Proc. IAU Coll. 78, ed. M. Cappaccioli (Dordrecht: Reidel), p. 25
- Chabrier et al. (2000) Chabrier, G., Baraffe, I., Allard, F., & Hauschildt, P. 2000, ApJ, 542, 464
- Chiu et al. (2006) Chiu, K., Fan, X., Leggett, S. K., Golimowski, D. A., Zheng, W., Geballe, T. R., Schneider, D. P., & Brinkmann, J. 2006, ApJ, in press
- Cohen, Wheaton & Megeath (2003) Cohen, M. Wheaton, W. A., & Megeath, S. T. 2003, AJ, 126, 1090
- Cooper et al. (2003) Cooper, C. S., Sudarsky, D., Milson, J. A., Lunine, J. I., & Burrows, A. 2003, ApJ, 586, 1320
- Cruz et al. (2004) Cruz, K. L., Burgasser, A. J., Reid, I. N., & Liebert, J. ApJ, 2004, 604, L61
- Cruz et al. (2003) Cruz, K. L., Reid, I. N., Liebert, J., Kirkpatrick, J. D., & Lowrance, P. J. 2003, AJ, 126, 2421
- Cruz et al. (2007) Cruz, K. L., et al. 2007, AJ, 133, 439
- Cushing, Vacca, & Rayner (2004) Cushing, M. C., Vacca, W. D., & Rayner, J. T. 2004, PASP, 116, 362
- Cushing et al. (2006) Cushing, M. C., et al. 2006, ApJ, in press
- Cushing et al. (2007) Cushing, M. C., et al. 2007, ApJ, submitted
- Dahn et al. (2002) Dahn, C. C., et al. 2002, AJ, 124, 1170
- Deacon, Hambly & Cooke (2005) Deacon, N. R., Hambly, N. C., & Cooke, J. A. 2005, A&A, 435, 363
- Dehnen & Binney (1998) Dehnen, W., & Binney, J. J. 1998, MNRAS, 298, 387
- Delfosse et al. (1997) Delfosse, X., et al. 1997, A&A, 327, L25
- Ellis et al. (2005) Ellis, S. C., Tinney, C. G., Burgasser, A. J., Kirkpatrick, J. D., & McElwain, M. W. 2005, AJ, 130, 2347
- Epchtein et al. (1997) Epchtein, N., et al. 1997, The Messenger, 87, 27
- Fegley & Lodders (1996) Fegley, B., & Lodders, K. 1996, ApJ, 472, L37
- Folkes et al. (2007) Folkes, S. L., Pinfield, D. J., Kendall, T. R., & Jones, H. R. A. 2007, MNRAS, 378, 901
- Geballe et al. (2002) Geballe, T. R., et al. 2002, ApJ, 564, 466
- Gelino et al. (2002) Gelino, C. R., Marley, M. S., Holtzman, J. A., Ackerman, A. S., & Lodders, K. 2002, ApJ, 577, 433
- Gizis & Harvin (2006) Gizis, J. E., & Harvin, J. 2006, AJ, 132, 2372
- Gizis et al. (2000) Gizis, J. E., Monet, D. G., Reid, I. N., Kirkpatrick, J. D., Liebert, J., & Williams, R. 2000, AJ, 120, 1085
- Golimowski et al. (2004) Golimowski, D. A., et al. 2004, AJ, 127, 3516
- Hambly et al. (2001a) Hambly, N. C., Davenhall, A. C., Irwin, M. J., & MacGillivray, H. T. 2001a, MNRAS 326, 1315
- Hambly et al. (2001b) Hambly, N. C., Irwin, M. J., & MacGillivray, H. T. 2001b, MNRAS 326, 1295
- Hambly et al. (2001c) Hambly, N. C., MacGillivray, H. T., Read, M. A., et al. 2001c, MNRAS 326, 1279
- Hamuy et al. (1994) Hamuy, M., Suntzeff, N. B., Heathcote, S. R., Walker, A. R., Gigoux, P., & Phillips, M. M. 1994, PASP, 106, 566
- Hartley & Dawe (1981) Hartley, M., & Dawe, J. A. 1981, PASA, 4, 251
- Hawley, Gizis, & Reid (1996) Hawley, S. L., Gizis, J. E., & Reid, I. N. 1996, AJ, 112, 2799
- Hawley et al. (2002) Hawley, S. L. et al. 2002, AJ, 123, 3409
- Helling et al. (2001) Helling, C., Oevermann, M., Lüttke, M. J. H., Klein, R., & Sedlmayr, E. 2001, A&A, 376, 194
- Houck et al. (2004) Houck, J. R., et al. 2004, ApJS, 154, 18
- Jones & Tsuji (1997) Jones, H. R. A., & Tsuji, T. 1997, ApJ, 480, L39
- Kirkpatrick (2005) Kirkpatrick, J. D. 2005, ARA&A, 43, 195
- Kirkpatrick et al. (2006) Kirkpatrick, J. D., Barman, T. S., Burgasser, A. J., McGovern, M. R., McLean, I. S., Tinney, C. G., & Lowrance, P. J. 2006, ApJ, 639, 1120
- Kirkpatrick et al. (2000) Kirkpatrick, J. D., Reid, I. N., Liebert, J., Gizis, J. E., Burgasser, A. J., Monet, D. G., Dahn, C. C., Nelson, B., & Williams, R. J. 2000, AJ, 120, 447
- Kirkpatrick et al. (1999) Kirkpatrick, J. D., et al. 1999, ApJ, 519, 802
- Knapp et al. (2004) Knapp, G., et al. 2004, ApJ, 127, 3553
- Kurucz & Bell (1995) Kurucz, R. L., & Bell, B. 1995, Atomic Line Data, Kurucz CD-ROM No. 23. (Cambridge: Smithsonian Astrophysical Observatory)
- Leggett et al. (2000) Leggett, S. K., Allard, F., Dahn, C., Hauschildt, P. H., Kerr, T. H., & Rayner, J. 2000, ApJ, 535, 965
- Leggett et al. (2007) Leggett, S. K., Saumon, D., Marley, M. S., Geballe, T. R., Golimowski, D. A., Stephens, D., & Fan, X. ApJ, 655, 1079
- Lépine, Rich, & Shara (2003) Lépine, S., Rich, R. M., & Shara, M. M. 2003, ApJ, 591, L49
- Linsky (1969) Linsky, J. L. 1969, ApJ, 156, 989
- Liu et al. (2006) Liu, M. C., Leggett, S. K., Golimowski, D. A., Chiu, K., Fan, X., Geballe, T. R., Schneider, D. P., & Brinkmann, J. 2006, ApJ, 647, 1393
- Lodders (2002) Lodders, K. 2002, ApJ, 577, 974
- Looper, Kirkpatrick & Burgasser (2007) Looper, D. L., Kirkpatrick, J. D., & Burgasser, A. J., AJ, 134, 1162
- Luhman & Rieke (1999) Luhman, K. L., & Rieke, G. H. 1999, ApJ, 525, 440
- Maiti et al. (2005) Maiti, M., Sengupta, S., Parihar, P. S., & Anupama, G. C. 2005, ApJ, 619, L183
- Marley et al. (1996) Marley, M. S., Saumon, D., Guillot, T., Freedman, R. S., Hubbard, W. B., Burrows, A., & Lunine, J. I. 1996, Science, 272, 1919
- Marley et al. (2002) Marley, M. S., Seager, S., Saumon, D., Lodders, K., Ackerman, A. S., Freedman, R., & Fan, X. 2002, ApJ, 568, 335
- Martín et al. (1999) Martín, E. L., Delfosse, X., Basri, G., Goldman, B., Forveille, T., & Zapatero Osorio, M. R. 1999, AJ, 118, 2466
- McElwain & Burgasser (2006) McElwain, M. W., & Burgasser, A. J. 2006, AJ, in press
- McGovern et al. (2004) McGovern, M. R., Kirkpatrick, J. D., McLean, I. S., Burgasser, A. J., Prato, L., & Lowrance, P. J. 2004, ApJ600, 1020
- McLean et al. (2003) McLean, I. S., McGovern, M. R., Burgasser, A. J., Kirkpatrick, J. D., Prato, L., & Kim, S. 2003, ApJ, 596, 561
- Mohanty & Basri (2003) Mohanty, S., & Basri, G. 2003, ApJ, 583, 451
- Mohanty et al. (2002) Mohanty, S., Basri, G., Shu, F., Allard, F., & Chabrier, G. 2002, ApJ, 572, 469
- Mould & Hyland (1976) Mould, J. R., & Hyland, A. R. 1976, ApJ, 208, 399
- Oke et al. (1995) Oke, J. B., et al. 1995, PASP, 107, 375
- Rayner et al. (2003) Rayner, J. T., Toomey, D. W., Onaka, P. M., Denault, A. J., Stahlberger, W. E., Vacca, W. D., Cushing, M. C., & Wang, S. 2003, PASP, 155, 362
- Rebolo, Martín, & Magazzu (1992) Rebolo, R., Martín, E. L., & Magazzu, A. 1992, ApJ, 389, L83
- Reid et al. (2001) Reid, I. N., Burgasser, A. J., Cruz, K., Kirkpatrick, J. D., & Gizis, J. E. 2001, AJ, 121, 1710
- Reid et al. (2000) Reid, I. N., Kirkpatrick, J. D., Gizis, J. E., Dahn, C. C., Monet, D. G., Williams, R. J., Liebert, J., & Burgasser, A. J. 2000, AJ, 119, 369
- Reiners & Basri (2006) Reiners, A., & Basri, G. 2006, AJ, 131, 1806
- Saumon et al. (1994) Saumon, D., Bergeron, P., Lunine, J. I., Hubbard, W. B., & Burrows, A. 1994, ApJ, 424, 333
- Saumon et al. (2006) Saumon, D., et al. 2006, ApJ, 656, 1136
- Schmidt et al. (2007) Schmidt, S. J., Cruz, K. L., Bongiorno, B. J., Liebert, J., & Reid, I. N. 2007, AJ, in press
- Skrutskie et al. (2006) Skrutskie, M. F., et al. 2006, AJ, 131, 1163
- Stephens (2003) Stephens, D. C. 2003, in IAU Symposium 211, Brown Dwarfs, ed. E. Martín (San Francisco: ASP), p. 355
- Tinney, Burgasser, & Kirkpatrick (2003) Tinney, C. G., Burgasser, A. J., & Kirkpatrick, J. D. 2003, AJ, 126, 975
- Tokunaga & Kobayashi (1999) Tokunaga, A. T., & Kobayashi, N. 1999, AJ, 117, 1010
- Tsuji (2005) Tsuji, T. 2005, ApJ, 621, 1033
- Tsuji, Ohnaka, & Aoki (1996) Tsuji, T., Ohnaka, K., & Aoki, W. 1996, A&A, 305, L1
- Tsuji et al. (1996) Tsuji, T., Ohnaka, K., Aoki, W., & Nakajima, T. 1996, A&A, 308, L29
- Vacca et al. (2003) Vacca, W. D., Cushing, M. C., & Rayner, J. T. 2003, PASP, 155, 389
- Vrba et al. (2004) Vrba, F. J., et al. 2004, AJ, 127, 2948
- Wachter et al. (2003) Wachter, S., Hoard, D. W., Hansen, K. H., Wilcox, R. E., Taylor, H. M., & Finkelstein, S. L. 2003, ApJ, 586, 1356
- West et al. (2004) West, A. A., et al. 2004, AJ, 128, 426
- Wilking, Greene & Meyer (1999) Wilking, B. A., Greene, T. P., & Meyer, M. R. 1999, AJ, 117, 469
- Woitke & Helling (2003) Woitke & Helling, C. 2003, A&A, 399, 297
| aaEquinox J2000 coordinates. | aaEquinox J2000 coordinates. | Epoch | Catalog |
|---|---|---|---|
| 11h26m4265 | -5004024 | 13 Jan 1983 | ESO; SSS |
| 11h26m4224 | -5004014 | 13 Mar 1985 | UKST; SSS |
| 11h26m3993 | -5003553 | 06 Apr 1999 | DENIS |
| 11h26m3991 | -5003550 | 10 May 1999 | 2MASS |
| 11h26m3989 | -5003553 | 30 May 1999 | DENIS |
| Line | EW (Å) |
|---|---|
| H (6563 Å) | 0.5aa1 upper/lower limits. |
| Li I (6708 Å) | 0.4aa1 upper/lower limits. |
| Rb I (7800 Å) | 5.60.3 |
| Rb I (7948 Å) | 5.60.3 |
| Na I (8183/8195 Å) | 5.60.2 |
| Cs I (8521 Å) | 3.50.2 |
| Optical | Near-infrared | ||||||
|---|---|---|---|---|---|---|---|
| Index | Value | SubtypeaaSubtypes in brackets were not used to compute the final average type. | Ref | Index | Value | SubtypeaaSubtypes in brackets were not used to compute the final average type. | Ref |
| CrH-a | 1.79 | L3.5 | 1 | H2O-A | 0.46 | L8.5 | 4 |
| Rb-b/TiO-b | 1.59 | L4.5 | 1 | H2O-B | 0.57 | L6.5 | 4 |
| Cs-a/VO-b | 1.33 | L4.5 | 1 | K1 | 0.34 | L4.5 | 4,5 |
| Color-d | 11.87 | L5 | 1 | H2O 1.5 | 1.74 | [L8] | 6 |
| K I fit | L5 | 1 | CH4 2.2 | 1.02 | [L5.5] | 6 | |
| PC3 | 6.58 | [L5]bbConsistent with measurements for DENIS J1228-1547 (Delfosse et al., 1997; Martín et al., 1999), classified L5 on the Kirkpatrick et al. (1999) scheme. | 2 | H2O-J | 0.74 | [L6] | 7,8 |
| VO7434 | 1.62 | [L6] | 3 | H2O-H | 0.65 | [L8] | 7,8 |
| Na8190 | 1.05 | [L3] | 3 | CH4-K | 0.98 | [L5] | 7,8 |
| TiO8440 | 0.82 | [L3] | 3 | H2O | 1.47 | [L7.5] | 9 |
| H2O(c) | 0.72 | [L5.5] | 10 | ||||
| Optical Type | L4.50.5 | NIR Type | L6.52 (pec) | ||||
| Parameter | Value | Reference |
|---|---|---|
| aaEquinox J2000 coordinates at epoch 10 May 1999 from 2MASS. | 11h26m3991 | 1 |
| aaEquinox J2000 coordinates at epoch 10 May 1999 from 2MASS. | 5003550 | 1 |
| 166003 yr-1 | 1,2,3 | |
| 285316 | 1,2,3 | |
| Optical SpT | L4.5 | 3 |
| NIR SpT | L6.52 (pec) | 3 |
| Distanceb,cb,cfootnotemark: | 152 pc | 3 |
| bbEstimated; see 3.4. | 11715 km s-1 | 3 |
| km s-1 | 3 | |
| ()bbEstimated; see 3.4. | () km s-1 | 3 |
| TeffbbEstimated; see 3.4. | 1700 K | 4,5 |
| Massb,db,dfootnotemark: | 0.065 M☉ | 3 |
| Ageb,db,dfootnotemark: | 2 Gyr | 3,6 |
| 20.36 mag | 2 | |
| 17.60 mag | 2 | |
| 17.800.15 mag | 7 | |
| 14.000.03 mag | 1 | |
| 13.280.04 mag | 1 | |
| 12.830.03 mag | 1 | |
| 3.800.15 mag | 1,7 | |
| 0.720.05 mag | 1 | |
| 0.450.05 mag | 1 | |
| 1.170.04 mag | 1 |
| Optical | NIR | ||||||
|---|---|---|---|---|---|---|---|
| Source | SpT | H2O-AaaIndices and index/spectral type relations from Reid et al. (2001). | H2O-BaaIndices and index/spectral type relations from Reid et al. (2001). | K1aaIndices and index/spectral type relations from Reid et al. (2001). | H2O-HbbIndices and index/spectral type relations from Burgasser et al. (2002) and this paper (Eqn. 3 and 4). | H2O(c)b,cb,cfootnotemark: | SpTddBased on the absence of Li I absorption at 6708 Å; see 3.1. |
| 2MASSW J1300425+191235 | L1 | 0.62 (L3.5) | 0.69 (L3.5) | 0.24 (L2.5) | 0.76 (L4.5) | 1.04 (L0.5) | L30.5 |
| SIPS J0921-2104 | L2 | 0.56 (L5.5) | 0.67 (L4) | 0.25 (L2.5) | 0.74 (L5.5) | 0.95 (L2) | L41.5 |
| 2MASSI J1721039+334415 | L3 | 0.54 (L6) | 0.62 (L5.5) | 0.30 (L4) | 0.71 (L7) | 0.90 (L3) | L51 |
| 2MASS J112639915003550 | L4.5 | 0.46 (L8.5) | 0.57 (L6.5) | 0.34 (L4.5) | 0.65 (L9) | 0.72 (L5.5) | L6.52 |
| Source | Spectral Type | aaDifference in color from the average of L dwarfs with similar optical spectral type (Kirkpatrick et al., 2000). | Ref. | |||
|---|---|---|---|---|---|---|
| Optical/NIR | (km s-1) | (mag) | (mag) | (mag) | ||
| SDSS J080531.84+481233.0bbThis source appears to be an unresolved binary system (Burgasser, 2007b). | L4/L9.5: | 14.730.04 | 1.290.05 | 1,2,3,4,5 | ||
| SIPS J0921-2104 | L2/L4:ccAssuming this source is single; see 4.2.1.Color-corrected H2O index. | 58 | 12.780.02 | 1.090.03 | 6,7,8,9 | |
| SDSS J093109.56+032732.5 | –/L7.5: | 16.620.14 | 0.88 | 2 | ||
| SDSS J103321.92+400549.5 | –/L6 | 16.640.16 | 1.24 | 3 | ||
| SDSS J112118.57+433246.5 | –/L7.5 | 17.010.20 | 1.490.29 | 3 | ||
| 2MASS J112639915003550 | L4.5/L6.5:ccSee Table 5. | 117 | 14.000.03 | 1.170.04 | 8,10 | |
| SDSS J142227.25+221557.1 | –/L6.5: | 17.060.18 | 1.420.25 | 3 | ||
| 2MASSW J1300425+191235 | L1/L3.5ccSee Table 5. | 98 | 12.720.02 | 1.090.03 | 9,11,12,13 | |
| SDSS J133148.92-011651.4 | L6/L8: | 15.460.04 | 1.390.08 | 1,2 | ||
| 2MASSI J1721039+334415 | L3/L5:ccSee Table 5. | 139 | 13.630.02 | 1.140.03 | 9,12,13 |
References. — (1) Hawley et al. (2002); (2) Knapp et al. (2004); (3) Chiu et al. (2006); (4) Burgasser (2007b); (5) J. D. Kirkpatrick et al. (in preparation); (6) Deacon, Hambly & Cooke (2005); (7) I. N. Reid et al. (in preparation); (8) This paper; (9) Schmidt et al. (2007); (10) Folkes et al. (2007); (11) Gizis et al. (2000); (12) Cruz et al. (2003); (13) Cruz et al. (2007)