Radiative Penguin Decays
Abstract
Selected recent results from experimental studies of radiative penguin decays of mesons by the Belle and BABAR collaborations are discussed: preliminary findings from a first inclusive measurement of using a hadronic tag by BABAR, first presented at this conference, updated preliminary results Belle on , first shown at the Moriond QCD workshop earlier this year, and a recently published BABAR study of and decays.
I Introduction
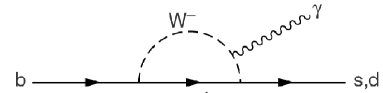
Within the standard model of particle physics (SM), the rare, flavor-changing-neutral-current decays and are forbidden at tree level. The leading-order processes are one-loop electroweak penguin diagrams as shown in Figure 1, where the top quark is the dominant virtual quark contribution. In the context of theories beyond the SM, new virtual particles may appear in the loop, which could lead to measurable effects on experimental observables such as branching fractions and asymmetries bsm .
The shape of the photon energy spectrum is insensitive to non-SM physics Kagan:1998ym but can be used to determine the Heavy Quark Expansion (HQE) parameters and , which are related to the mass and momentum of the quark within the meson. Improved measurements of these parameters are relevant to, e.g., reduce the error in the CKM matrix elements and determined from semi-leptonic -meson decays Buchmuller:2005zv .
In the following, three recent experimental studies of radiative penguin decays are discussed
II Measuring with a hadronic tag
Previous inclusive measurements of transitions, by the CLEO Chen:2001fj , Belle Koppenburg:2004fz and BABAR BABARSEMI ; BABARINCL collaborations, used either fully inclusive event samples, requiring only a high-energy lepton in the event or no tag at all, or a combination of several exclusive decay modes. A new (preliminary) analysis, based on BABAR data corresponding to an integrated luminosity of , uses for the first time a recoil method to select candidate decays, where events are tagged by a fully reconstructed hadronic decay of one the mesons, in the following referred to as the tag , and radiatively decaying signal mesons are reconstructed from the remaining particles in the event. While the hadron tag efficiency is low (about ), this method allows for the inclusive study of decays in a relatively clean environment and a determination of the momentum, charge, and flavor of the mesons. Thus, it is possible to measure the photon spectrum in the rest frame of the signal , to separate charged and neutral mesons and to determine the CP-asymmetry .
In order to reconstruct a large sample of tag mesons, hadronic decays to and final states are selected, where denotes relevant combinations of mesons – , , , and – with a total charge of Aubert:2003zw . Those particles in the event that are not reconstructed as part of the tag are required to include an isolated, well-reconstructed photon candidate with an energy in the signal meson rest frame. Photon candidates that are found to be consistent with stemming from or decays are rejected. Continuum backgrounds (, with ) are suppressed using a Fisher discriminant combining twelve quantities that are sensitive to event shape differences between decays and continuum processes.
| () | () | () | ||||||||||
|---|---|---|---|---|---|---|---|---|---|---|---|---|
| 1.9 | 366 | 85 | 59 | 2.289 | 0.058 | 0.026 | 0.0334 | 0.0124 | 0.0263 | |||
| 2.0 | 339 | 64 | 47 | 2.315 | 0.036 | 0.020 | 0.0265 | 0.0057 | 0.0203 | |||
| 2.1 | 278 | 48 | 34 | 2.371 | 0.025 | 0.011 | 0.0142 | 0.0037 | 0.0111 | |||
| 2.2 | 248 | 38 | 26 | 2.398 | 0.016 | 0.006 | 0.0092 | 0.0015 | 0.0061 | |||
| 2.3 | 207 | 30 | 19 | 2.427 | 0.010 | 0.007 | 0.0059 | 0.0007 | 0.0073 | |||
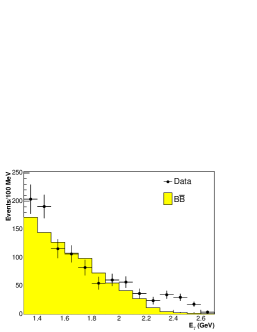
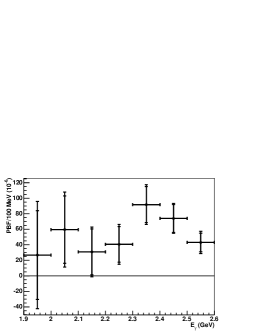
The numbers of remaining and non- events are determined by means of fits to the beam-energy-substituted mass .111Here, is the total energy in the center of mass (CM) frame, and denotes the candidate CM momentum. The left hand side of Figure 2 shows the preliminary results as a function of the photon energy. The points are from the data; the solid histogram was obtained from a Monte Carlo sample (excluding the signal decay ) and then scaled according to the results of a fit to the data in the region . For signal events are observed over a background of events.
The differential decay rate is measured in bins of the signal rest frame photon energy in the range GeV. For a given bin this is determined according to
| (1) |
where is the number of events in the bin, is the number of mesons from decays other than , and is the total number of mesons in the sample. The efficiency corrects for both acceptance and bin-to-bin resolution effects, and the correction factor accounts for any dependence of the hadronic tag probability on the the presence of a final state.
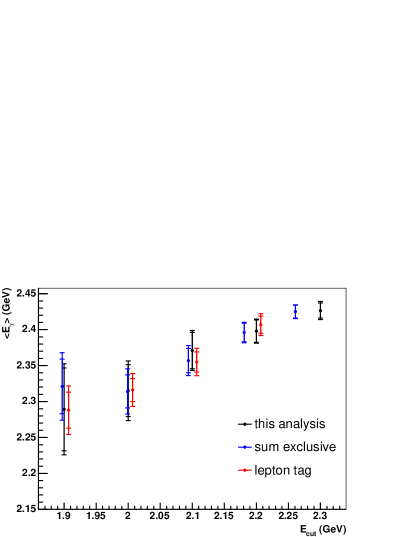
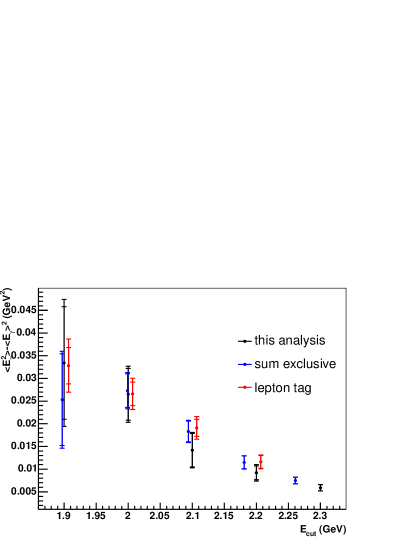
In the right part of Figure 2 the partial branching fraction is shown after all corrections. The systematic uncertainties – mainly arising from the modelling of the background, the fit parametrization, the description of the detector response, and the dependence on the signal model – are included here. The results for the integrated branching fraction and moments of the photon energy spectrum above different minimum photon energies are summarized in Table 1. Figure 3 shows the first and second moments of the photon energy spectrum as a function of ; good agreement with previous measurements is found.
Using Buchmuller:2005zv to extrapolate the measured branching fraction down to a minimum photon energy of yields
| (2) |
This is in good agreement with the current experimental world average hfag2006 of as well as recent NNLO QCD calculations Misiak:2006zs ; Becher:2006qw ; Andersen:2006hr .
All these preliminary results are currently limited by statistics; adding more data in future measurements is expected to significantly reduce also the systematic uncertainties. It should also be noted that the recoil method is complementary to those of other measurements of transitions; the largely independent systematic uncertainties will facilitate a combination of the results.
III Study of decays
The decay was first observed by Belle in 2005 based on a data sample corresponding to an integrated luminosity of oldlambda . These results have now been updated with a preliminary measurement222 Since this conference, this analysis has been finalized and published newlambda . using of Belle data. This is a rare process; the SM branching fraction is predicted to be . The final state baryons restrict the phase space, thus giving access to low photon momenta. The experimental study of this decay provides information on the baryon production mechanism. For example, the spin of the quark can be probed through a helicity analysis; large wrong-helicity contributions would indicate physics beyond the SM.
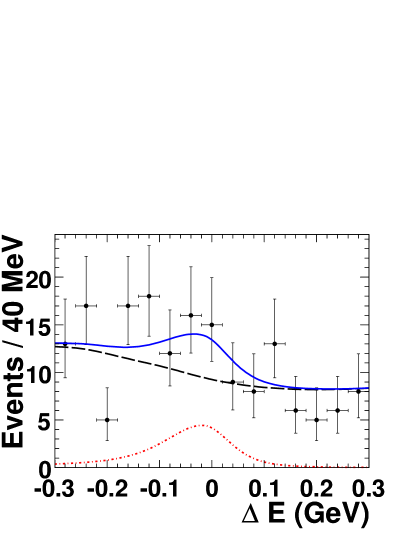
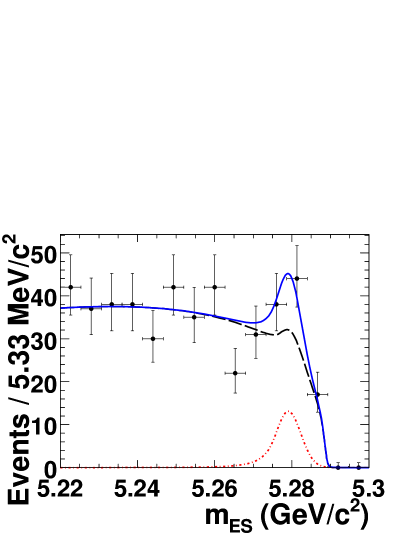
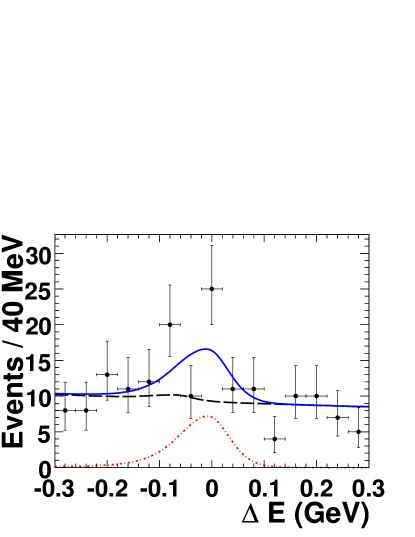
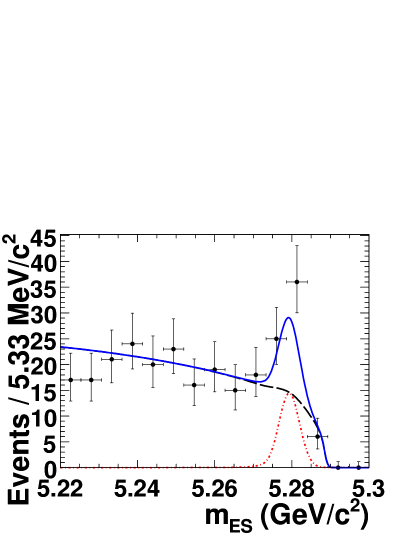
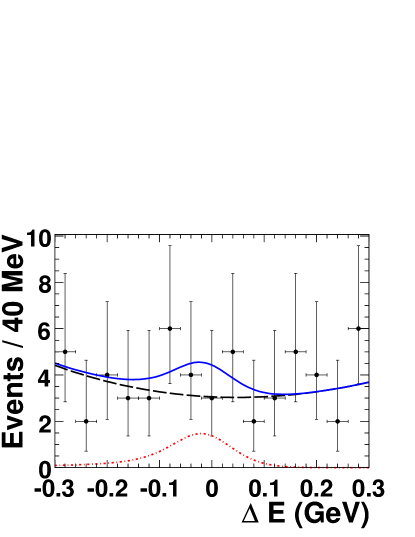
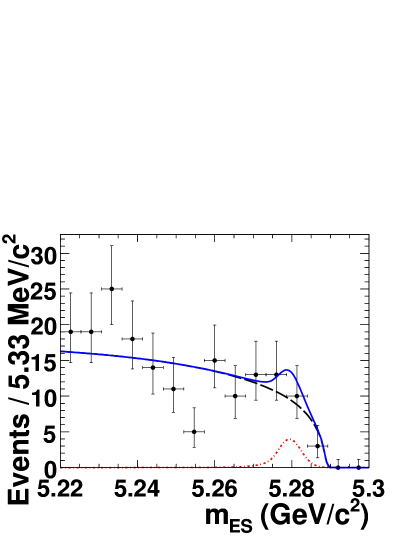
Figure 4 shows the projections of a two-dimensional fit to the distributions of the energy difference , where is the CM energy of the meson candidate and is the CM beam energy, and for selected events with an invariant di-baryon mass .
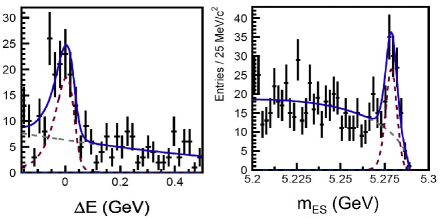
About 100 signal events are found, corresponding to a statistical significance of . Turning this into a branching fration and extrapolating to the full di-baryon mass range yields
| (3) |
A near-threshold enhancement is found in the di-baryon mass distribution, see the left part of Figure 5.
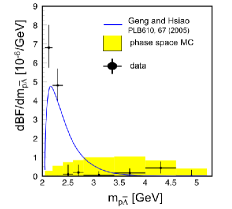
This was previously observed for other baryonic decays and has since then been the focus of considerable theoretical interest.
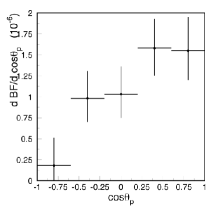
The right hand side of Figure 5 shows the measured distribution of , where the helicity angle is the angle between proton and photon direction in the di-baryon rest frame. It is consistent with a short-distance description of this decay. The asymmetry with respect to is determined to be . The CP asymmetry, , is found to be consistent with zero.
Table 2 summarizes these results and includes, for comparison, corresponding measurements for the decays , which is observed for the first time, and .
| Mode | |||
|---|---|---|---|
IV branching fractions
With respect to , the corresponding branching fractions are suppressed by a factor ; the SM branching fractions for the decays of mesons to and are (). While the calculations of the exclusive decay rates have large uncertainties due to non-perturbative long-distance QCD effects, some of this uncertainty cancels in the ratio of to branching fractions. Since the dominant diagram involves a virtual top quark, this ratio is related to the ratio of Cabibbo-Kobayashi-Maskawa (CKM) matrix elements alivtdvtstheory ; ali2004 ; Bosch:2004nd via333 The coefficient is the ratio of the form factors for the decays and and accounts for different dynamics in the decay.
| (4) |
Physics beyond the Standard Model could affect these decays, creating inconsistencies between this measurement of and that obtained from the ratio of and mixing frequencies bsmixing .
After previous searches by BABAR oldbabar and CLEO cleo , which found no evidence for the decays and , an observation of the decay was reported by the Belle collaboration newbelle . A recently published BABAR study newbabar of the decays , , and is summarized in the following.
From a data sample containing 347 million pairs, which corresponds to an integrated luminosity of 316 fb-1, the decays and are reconstructed by combining a high-energy photon with a vector meson reconstructed in the decay modes , , and . The dominant source of background is continuum events (, with ) that contain a high-energy photon from or decays. Other backgrounds include photons from initial-state radiation processes, decays of (), decays of or and combinatorial background from higher-multiplicity decays.
High-energy photons for which the combination with another photon is found – based on a likelihood ratio constructed from and – to be consistent with a or decay are rejected. A neural network, exploiting differences between background and decays in, e.g., lepton and kaon production (through flavor-tagging variables described in babartag ) and event shape, is used to suppress continuum background events.
| BABAR | Belle | ||||||
|---|---|---|---|---|---|---|---|
| Mode | |||||||
| 8.5 | |||||||
| 20.7 | |||||||
| 5.7 | |||||||
| 36.9 | |||||||
The signal content of the data is determined by a multidimensional unbinned maximum likelihood fit, which is constructed individually for each of the three signal decay modes. All fits use , , ,444 The helicity angle is defined as the angle between the momentum vector and the track calculated in the rest frame in the case of a meson, or the angle between the momentum vector and the normal to the decay plane for an meson. and the neural network output . For decays (), the cosine of the angle between the and momenta in the rest frame (Dalitz angle) is added as a fifth observable. In the fit, signal, continuum background, decays, and other backgrounds are considered as hypotheses for the origin of the events.
Figure 6 shows the data points and the projections of the fit results for and separately for each decay mode. The signal yields and corresponding branching fractions are listed in Table 3.
The isospin symmetry is tested by measuring the quantity , which – within the large uncertainties – agrees with the theoretical expectation ali2004 . The measured branching fractions are consistent with the isospin relation among the widths of the individual decays. Imposing this relation as a constraint, the isospin-averaged branching fraction is determined from a simultaneous fit to the three decay modes to be
| (5) |
the significance of the signal is 6.4, including systematic uncertainties. Excluding the mode from the simultaneous fit yields .
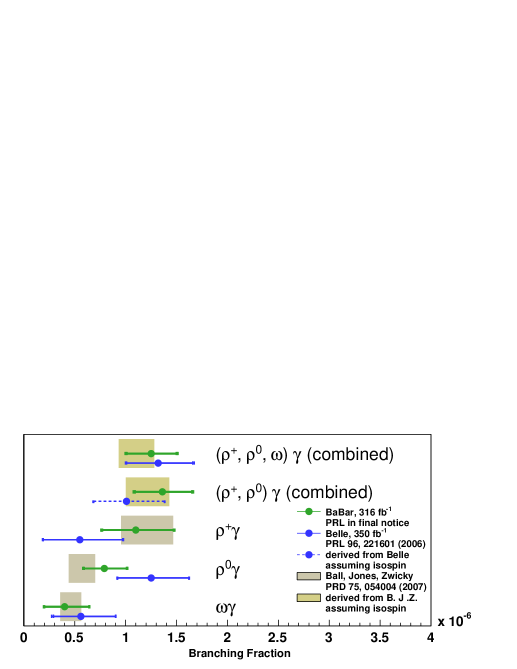
As shown in Table 3 and Figure 7, all these results agree well with corresponding measurements by the Belle collaboration, published in newbelle .555 It should be noted that since this conference Belle has reported updated results based on a significantly larger dataset (). Good agreement with the previous measurements is found; still no significant signal is seen for the decay . Details can be found in lp07belle .
Using the world average value of , Equation (4), and theory input from Ball:2006nr , this translates into
| (6) |
where the first error is experimental and the second is theoretical. This result is in very good agreement with the measurement of this ratio from the study of and mixing bsmixing .
Acknowledgements.
Thanks to the FPCP2007 organizers for making this productive and enjoyable conference possible.References
- (1) See, for example, S. Bertolini, F. Borzumati, and A. Masiero, Nucl. Phys. B 294, 321 (1987); H. Baer and M. Brhlik, Phys. Rev. D 55, 3201 (1997); J. Hewett and J. Wells, Phys. Rev. D 55, 5549 (1997); M. Carena et al., Phys. Lett. B 499, 141 (2001).
- (2) A. L. Kagan and M. Neubert, Eur. Phys. Jour. C 7, 5 (1999).
- (3) O. Buchmüller and H. Flächer, Phys. Rev. D 73, 073008 (2006).
- (4) S. Chen et al. [CLEO Collaboration], Phys. Rev. Lett. 87, 251807 (2001).
- (5) P. Koppenburg et al. [Belle Collaboration], Phys. Rev. Lett. 93, 061803 (2004).
- (6) B. Aubert et al. [BABAR Collaboration], Phys. Rev. D 72, 052004 (2005).
- (7) B. Aubert et al. [BABAR Collaboration], Phys. Rev. Lett. 97, 171803 (2006).
- (8) B. Aubert et al. [BABAR Collaboration], Phys. Rev. Lett. 92, 071802 (2004).
- (9) M. Misiak et al., Phys. Rev. Lett. 98, 022002 (2007).
- (10) T. Becher and M. Neubert, Phys. Lett. B 637, 251 (2006).
- (11) J. Andersen and E. Gardi, JHEP 01, 029 (2007).
- (12) Heavy Flavor Averaging Group, hep-ex/0603003.
- (13) Y. J. Lee et al. [Belle Collaboration], Phys. Rev. Lett. 95, 061802 (2005).
- (14) H. Y. Cheng and K. C. Yang, Phys. Lett. B 533, 271 (2002).
- (15) C. Q. Geng and Y. K. Hsiao, Phys. Lett. B 610, 67 (2005).
- (16) M. Z. Wang et al. [Belle Collaboration], Phys. Rev. D 76, 052004 (2007).
- (17) A. Ali, E. Lunghi, and A. Y. Parkhomenko, Phys. Lett. B 595, 323 (2004).
- (18) S. W. Bosch and G. Buchalla, Nucl. Phys. B 621, 459 (2002).
- (19) A. Ali and A. Y. Parkhomenko, Eur. Phys. Jour. C 23, 89 (2002).
- (20) A. Abulencia et al., Phys. Rev. Lett. 97, 242003 (2006).
- (21) B. Aubert et al. [BABAR Collaboration], Phys. Rev. Lett. 94, 011801 (2005).
- (22) T. E. Coan et al. [CLEO Collaboration], Phys. Rev. Lett. 84, 5283 (2000).
- (23) D. Mohapatra et al., [Belle Collaboration], Phys. Rev. Lett. 96, 221601 (2006).
- (24) B. Aubert et al. [BABAR Collaboration], Phys. Rev. Lett. 98, 151802 (2007).
- (25) B. Aubert et al., Phys. Rev. Lett. 89, 201802 (2002).
- (26) B. Nakao, Probing New Physics with rare B decays, presentation at Lepton-Photon 2007, http://chep.knu.ac.kr/lp07/htm/S7/S07_21.pdf.
- (27) P. Ball and R. Zwicky, JHEP 0604, 046 (2006); P. Ball, G. Jones, R. Zwicky, Phys. Rev. D 75, 054004 (2007).
- (28) S. W. Bosch and G. Buchalla, JHEP 0501, 035 (2005).