The supernova rate in local galaxy clusters
Abstract
We report a measurement of the supernova (SN) rates (Ia and core-collapse) in galaxy clusters based on the 136 SNe of the sample described in Cappellaro et al. (1999) and Mannucci et al. (2005).
Early-type cluster galaxies show a type Ia SN rate (0.066 SNuM) similar to that obtained by Sharon et al. (2007) and more than 3 times larger than that in field early-type galaxies (0.019 SNuM). This difference has a 98% statistical confidence level. We examine many possible observational biases which could affect the rate determination, and conclude that none of them is likely to significantly alter the results. We investigate how the rate is related to several properties of the parent galaxies, and find that cluster membership, morphology and radio power all affect the SN rate, while galaxy mass has no measurable effect. The increased rate may be due to galaxy interactions in clusters, inducing either the formation of young stars or a different evolution of the progenitor binary systems.
We present the first measurement of the core-collapse SN rate in cluster late-type galaxies, which turns out to be comparable to the rate in field galaxies. This suggests that no large systematic difference in the initial mass function exists between the two environments.
keywords:
supernovae:general —1 Introduction
Type Ia Supernovae (SNe Ia) are believed to be the result of the thermonuclear explosion of a C/O white dwarf (WD) in a binary system due to mass exchange with the secondary star. This conclusion follows from a few fundamental arguments: the explosion requires a degenerate system, such as a white dwarf; the presence of SNe Ia in old stellar systems implies that at least some of their progenitors must come from old, low-mass stars; the lack of hydrogen in the SN spectra requires that the progenitor has lost its outer envelope; and, the released energy per unit mass is of the order of the energy output of the thermonuclear conversion of carbon or oxygen into iron. Considerable uncertainties about the explosion model remain within this broad framework, such as the structure and the composition of the exploding WD (He, C/O, or O/Ne), the mass at explosion (at, below, or above the Chandrasekhar mass) and the flame propagation (detonation, deflagration, or a combination of the two). The key observations constraining the explosion models are the light curve and the evolution of the spectra.
Large uncertainties also remain regarding the nature of the progenitor binary system, its evolution through one or more common envelope phases, and its configuration (single or double-degenerate) at the moment of the explosion (see Yungelson 2005, for a review). Solving the problem of the progenitor system is of great importance for modern cosmology as SNe dominate metal production, (e.g., Matteucci & Greggio 1986), are expected to be important producer of high-redshift dust (Maiolino et al., 2001, 2004a, 2004b; Bianchi & Schneider, 2007), and are essential to understand the feedback process during galaxy formation (e.g., Scannapieco et al. 2006). The nature of the progenitor systems can be probed by studying the SN rate in different stellar populations, and constraining the delay time distribution (DTD) between star formation and SN explosion.
In 1983, Greggio & Renzini computed the expected DTD for a single-degenerate system. The computation was later refined by many authors and extended to double-degenerate systems (Tornambè & Matteucci, 1986; Tornambè, 1989; Tutukov & Yungelson, 1994; Yungelson & Livio, 2000; Matteucci & Recchi, 2001; Belczynski et al., 2005; Greggio, 2005). The DTD can be convolved with the star formation history (SFH) of each galaxy to obtain its SN rate. The observation of the SN rates per unit mass in galaxies of different types (Mannucci et al., 2005; Sullivan et al., 2006) and in radio-loud early-type galaxies (Della Valle et al., 2005) has proved to be an effective way to constrain the DTD. The SN rates per unit mass show that SNe Ia must come from both young and old progenitors (Mannucci et al., 2005; Sullivan et al., 2006). The dependence of the SN rate on the radio power of the parent galaxy is well reproduced by a “two channel” model (Mannucci et al., 2006), in which about half of the SNe Ia, the so-called “prompt” population, explode soon after the formation of the progenitors, on time scales shorter than yr, while the other half (the “tardy” population) explode on a much longer time scale, of the order of yr. Several attempts to compare the evolution of SN rate with redshift with that of the SFR have also been presented (see, among many others, Gal-Yam & Maoz 2004; Dahlen et al. 2004; Cappellaro et al. 2005; Neill et al. 2006; Barris & Tonry 2006; Botticella et al. 2007 and Poznanski et al. 2007), but the large uncertainties on both quantities prevent strong conclusions (see, for example, Förster et al. 2006).
In principle, an accurate measurement of the DTD could identify the progenitor binary system. In practice, both the large number of free parameters involved in the theoretical computations of the DTD, and the complex SFHs of most of the galaxies make this identification much more uncertain. To solve the problem of the complexity of the SFH, it is interesting to measure the SN Ia rate in galaxy clusters. Most of the stellar mass of these systems is contained in elliptical galaxies, whose stellar populations are dominated by old stars. Despite the problem that even a small amount of new stars could give a significant contribution to the SN rate (see the discussion in sect. 6), the reduction in the uncertainty in the SFH is of great help to derive the DTD.
The cluster SN rate is also of great importance to study the metallicity evolution of the universe. The gravitational potential well of galaxy clusters is deep enough to retain in the intracluster medium (ICM) all the metals which are produced in galactic or intergalactic SNe. As a result, the metallicity of the ICM is a good measure of the integrated past history of cluster star formation and metal production. As discussed by Renzini et al. (1993), the measured amount of iron is an order of magnitude too high to be produced by SNe Ia exploding at the current rate. Explanations of this effect include the presence of higher SN rates in the past (Matteucci et al., 2006), the importance of the intracluster stellar population (Zaritsky et al., 2004), or evolving properties of star formation processes (Maoz & Gal-Yam, 2004; Loewenstein, 2006). The observed abundance ratios in the ICM can be used to constrain the ratio between the total numbers of Ia and CC SNe, as recently done by de Plaa et al. (2007). Constraints on the SN Ia models can also be derived from the radial distribution of metallicity (Dupke & White, 2002). Calura et al. (2007) used the observed cosmic evolution of iron abundances in Balestra et al. (2007) to constrain the history of SN explosion, iron formation and gas stripping in galaxy clusters. They found good agreement with the observations, especially when the “two channel” model of SNe Ia by Mannucci et al. (2006) is used.
There are strong motivations for measuring also the cluster rates of the other physical class of SNe, the core-collapse (CC) group. Type II and type Ib/c SNe are attributed to this group because there is a general consensus that these explosions are due to the collapse of the core of a massive (about 8–40 M⊙) star. Thus, CC SNe are expected to be good tracers of star formation in moderately dusty environments (see Mannucci et al. 2007). Their rate per unit mass is also very sensitive to the initial mass function (IMF), because SN explosions are due to massive stars while most of the mass is locked in low-mass stars. As a consequence, studying the CC SN rate as a function of environment is a sensitive test for any systematic difference in IMF.
| Reference | ( range) | NSN | Rate |
|---|---|---|---|
| (SNuB) | |||
| This work | 0.02 (0.005–0.04) | 20 | |
| Crane et al. (1977) | 0.023 (0.020–0.026) | 8 | 0.10 |
| Barbon (1978) | 0.023 (0.020–0.026) | 5 | 0.16 |
| Germany et al. (2004) | 0.05 (0.02–0.08) | 23 | unpubl. |
| Sharon et al. (2007) | 0.15 (0.06–0.19) | 6 | 0.27 |
| Gal-Yam et al. (2002) | 0.25 (0.18–0.37) | 1 | 0.39 |
| Gal-Yam et al. (2002) | 0.90 (0.83–1.27) | 1 | 0.80 |
1.1 The observed cluster supernova rate
Prompted by all these motivations, several groups have measured the SN Ia rate in galaxy clusters, but the results are still quite sparse. The first published values are due to Crane et al. (1977) and Barbon (1978) (see Table 1 for a summary, including the results of our work, discussed below), before a clear distinction between type Ia and Ib/c had been introduced. They used a sample of 5–8 SNe in the Coma Cluster and constrained the SN rate to be of the order of 0.15 SNuB (SN per century per L⊙ in the B band). The SN rate as a function of galaxy environment was also addressed by Caldwell & Oemler (1981) to derive information on SN progenitors.
Modern searches for cluster SNe begin with Norgaard-Nielsen et al. (1989) who discovered a SN Ia in a cluster at . Starting from the late ’90s, the Mount Stromlo 1.3 m telescope was used to monitor a few tens of Abell Clusters (Reiss et al., 1998). Three years of monitoring resulted in the detection of 23 candidate SNe Ia in cluster galaxies (Germany et al., 2004), but a rate based on this sample was never published.
The first rates for cluster galaxies based on modern searches were published by Gal-Yam et al. (2002). These authors used archive images from the Hubble Space Telescope (HST) of 9 galaxy clusters, and discovered 6 SNe, 2 of which are associated with the clusters, at and . The derived rates were affected by large statistical uncertainties due to the small number of detected SNe, but were consistent with a moderate increase of the rate with redshift compared to the rate in local elliptical galaxies. A sample of 140 low-redshift Abell clusters were monitored by the Wise Observatory Optical Transient Search (WOOTS, Gal-Yam et al. 2007) using the Wise 1m telescope. The seven detected cluster SNe were used to constrain the fraction of intergalactic stars and SNe (Gal-Yam et al., 2003) and to measure the cluster SN rate (Sharon et al., 2007). This latter work obtains a value of the SN rate per unit mass of SNuM (SN per century per M⊙ of stellar mass), which is larger than, but still consistent with, the value of SNuM, derived by Mannucci et al. (2005) for local ellipticals. Finally, a SN search in clusters is ongoing at the Bok Telescope on Kitt Peak (Sand et al., 2007).
All of the previous published SN Ia rates are based on a small number of SNe and, as a consequence, have large statistical errors. Also, a cluster rate for CC SNe has never been published because many of the cited samples only contain Ia SNe. In this work, we use the SNe in the Cappellaro et al. (1999) sample to study the SN rate as a function of galaxy environment.
Throughout this paper we use the “737” values of the cosmological parameters: .

2 Measuring the rates in clusters and in the field
The SN sample described by Cappellaro et al. (1999) consists of 136 local SNe (with redshifts ), obtained by monitoring 8349 galaxies for many years. It is based on 5 visual and photographic searches and, to date, it comprises the largest published sample of SNe suitable for rate measurements.
The monitored galaxy sample is very heterogeneous and for most of the galaxies a clear membership in a cluster is not known. To test for cluster membership of each galaxy we used the list of known galaxy clusters in the NASA/IPAC Extragalactic Database (NED). We considered a galaxy to be part of a cluster if its radial velocity is within 1000 km s-1 of that of the known cluster, and if its projected distance is below a certain distance (Dressler et al., 1997; Hansen et al., 2005). Figure 1 shows how such a threshold distance was chosen. The upper panel shows the surface density of galaxies as a function of the projected distance from the closest cluster. At Mpc the density of galaxies shows an increase over the large distance value ( Mpc), and a steepening of the increase for Mpc. In the lower panel of Fig. 1, the fraction of early-type galaxies is shown as a function of . As expected from the density-morphology relation (e.g., Dressler et al. 1997; Goto et al. 2004; Park et al. 2007), a sharp increase of this fraction is seen at small distances. At large distances , about 19% of the galaxies in our sample are early-type (defined to have a morphological index T-1.5 in the HyperLeda catalog, Paturel et al. 2003) , while this fraction rises to an average of 43% at Mpc and 53% at Mpc. Based on these considerations, we see that the population within 0.5 Mpc of a cluster are dominated by cluster members, galaxies more distant then 1.5 Mpc are mostly field galaxies, and a mixture of the two populations are probably present between these two distances. We therefore consider as cluster members the galaxies having Mpc, but throughout the paper we will also discuss the effect of including all the galaxies with Mpc. Galaxies with Mpc will be considered as belonging to the field population.
The above classification has a number of weaknesses. First, we assume that all clusters have the same radial extent, even if this is known not to be true. Second, clusters show a galaxy density that smoothly decreases with radius rather than a sharp cutoff. Third, the NED cluster catalog is not complete and it is possible that some clusters are missing. All of these effects are likely to produce some degree of misclassification in both directions. However, Fig. 1 shows that these effects, if present, are not strong enough to completely spoil the classification. Also, any missclassification can dilute or hide an existing difference in rates, but it is unlikely to produce an artificial difference in rates or enlarge a small difference.
Of the 8349 galaxies in the full sample, 810 (about 10%) belong to clusters with Mpc (1666 for Mpc), and 6683 galaxies belong to the field. The expected strong morphological segregation is well recovered: (1) more early-type galaxies are present in clusters, as noted above; and (2) late spirals and irregulars (T3.5) constitute 15% of the cluster galaxies and 45% of the field galaxies. It is not straightforward to compare these fractions to those generally observed in complete galaxy samples, because the relative fractions depend strongly on cluster radial distance, galaxy overdensity and morphological classification. Furthermore, the original galaxy sample was not selected in order to reproduce the cosmic average but rather to have a significant number of SN detections. Several authors (Dressler et al., 1997; Smith et al., 2005; Sorrentino et al., 2006; Park et al., 2007) report the morphological mix of galaxies in clusters and in the field, obtaining that within 1 Mpc, clusters have 50-70% early-type galaxies (E+S0) and 30-50% spirals, with opposite fractions in the field. Our galaxy sample thus seems to be roughly consistent with the cosmic average.
Cluster galaxies host 20 of the SNe of our sample (14% of the total), and field galaxies host the remaining 92 SNe. Galaxies with Mpc host 44 SNe. As explained in Cappellaro et al. (1999), 10 out of 136 SNe have incomplete classification and have been redistributed among the three basic type of SNe (Ia, II and Ib/c) according to the observed relative fractions. As a consequence, some bins in the distributions discussed below contain a fractional number of SNe.
Rates are computed as a function of of the B-band luminosity, as in Cappellaro et al. (1999), and as a function of galaxy stellar mass, as described in Mannucci et al. (2005), with mass computed from the K-band luminosity and the (B–K) color. For each galaxy, the control time (CT, i.e., the time during which a SN could be detected by the survey) for each SN type was computed. The “sensitivity” to each SN type is proportional to the product of the CT times either the mass or the B luminosity for the rates per unit mass and per unit luminosity, respectively.
Table 2 and Fig. 2 show the SN rate per unit mass in clusters (both for Mpc and for Mpc) and in the field as a function of the morphology of the parent galaxy, with 1 statistical errors. Table 3 and Fig. 3 show the corresponding rates per unit B luminosity. Tables 2 and 3 also list the total rate without binning by morphology. For CC SNe, the two classes Ib/c and II are given, together with their sum (labeled CC).
In the next two sections, we discuss these results, first for the CC SNe (Sect. 3), and then for SNe Ia (Sect. 4).
| Type | Ngal | Ia | Ib/c | II | CC | ||||
|---|---|---|---|---|---|---|---|---|---|
| N | Rate | N | Rate | N | Rate | N | Rate | ||
| Cluster Mpc | |||||||||
| E/S0 | 430 | 11.0 | 0.0 | 0.0 | 0.0 | ||||
| S0a/b | 251 | 1.5 | 2.5 | 1.0 | 3.5 | ||||
| Sbc/d | 100 | 0.0 | 0.0 | 3.0 | 3.0 | ||||
| Irr | 29 | 0.0 | 0.0 | 1.0 | 1.0 | ||||
| TOT | 810 | 12.5 | 2.5 | 5.0 | 7.5 | ||||
| Cluster Mpc | |||||||||
| E/S0 | 723 | 15.0 | 0.0 | 0.0 | 0.0 | ||||
| S0a/b | 519 | 4.8 | 2.7 | 2.5 | 5.2 | ||||
| Sbc/d | 321 | 4.8 | 0.6 | 8.5 | 9.1 | ||||
| Irr | 94 | 3.0 | 1.0 | 1.0 | 2.0 | ||||
| TOT | 1666 | 27.7 | 4.3 | 12.0 | 16.3 | ||||
| Field | |||||||||
| E/S0 | 1326 | 5.0 | 0.0 | 0.0 | 0.0 | ||||
| S0a/b | 2393 | 15.7 | 3.3 | 12.0 | 15.3 | ||||
| Sbc/d | 2362 | 15.8 | 5.8 | 23.5 | 29.2 | ||||
| Irr | 551 | 3.3 | 1.1 | 4.5 | 5.7 | ||||
| TOT | 6683 | 39.8 | 10.2 | 40.0 | 50.2 | ||||

3 Core-collapse supernovae
About 37% of the cluster ( Mpc) SNe (16 out of 44) are CC, and this allows a first measurement of the CC rate in galaxy clusters. As shown in panels b of Figs. 2 and 3, the cluster CC SNe are hosted by the cluster spirals and irregular galaxies. We do not detect any variation of the CC rate related to the environment, indicating a similar IMF in cluster and field galaxies.
It should be noted that two effects are present that could hide any intrinsic differences: 1) our determination of galaxy membership is not perfect, as discussed in Sect. 2, and 2) in clusters, the number of CC SNe per galaxy type is small, and only large differences, of the order of 50% or more, could be significantly detected.
4 Type Ia supernovae
Type Ia SNe are present in all types of galaxies. As shown by Mannucci et al. (2005), their rate per unit mass sharply rises from ellipticals to irregulars by a factor of 20, and from red galaxies to blue galaxies by a factor of 30. This is a strong indication that a significant fraction of these explosions are due to young systems, tracing the SFR. Figure 2 shows that this trend is present in both environments, with cluster and field galaxies showing similar behaviours.
Early-type (E/S0) clusters galaxies ( Mpc), comprising 3 times fewer early-type galaxies than the field, and 1.6 times less “sensitivity” (i.e., the product of stellar mass times control time), contain 2.2 times more SN Ia events (11 vs. 5). As a consequence, clusters early-types have a higher rate ( SNuM) than field early-type galaxies ( SNuM). The difference is present both in the rates per unit mass (Fig. 2) and per unit B luminosity (Fig. 3).
The statistical significance of the rate difference can be estimated in several ways. One way is to apply the test by considering that the numbers of detected SNe are affected by Poisson errors. Excluding the galaxies at intermediate distances ( Mpc), the null hypothesis, i.e., the hypothesis of no rate difference between cluster and field, would predict 39% of the 16 SNe (i.e., 6.2 SNe instead of 11) in clusters and 61% (9.8 instead of 5) in the field. For one degree of freedom, we obtain that the statistical significance of the difference is 97.7%.
A second way to compute the statistical significance of the difference in rates is to consider the binomial distribution of the probability of a SN to explode in an early-type galaxy either in the cluster or in the field. The probability of detecting 11 SNe or more in clusters out of 16 events in total, when the null-hypothesis of expectation is 0.39, is 1.3%. In other words, we can exclude the null hypothesis that there is no difference in rates between the two populations with a confidence level higher than 98.7%, in good agreement with the previous method.
A similar result is obtained when splitting the galaxy sample according to the galaxy (B–K) color, as in Mannucci et al. (2005), rather than by morphological type. Red galaxies with (B–K), corresponding to ellipticals and red early-type spirals, have larger rates in clusters ( SNuM) than in the field ( SNuM). This difference has a lower statistical significance (), the reasons for which are explained in Sect. 6.
The presence of a higher rate in cluster early-type galaxies is not strongly dependent on the value of the cluster membership threshold distance . Figs 2 and 3 show that the rate excesses corresponding to =0.5 Mpc and 1.5 Mpc are very similar. The statistical significance also remain very similar. For Mpc, cluster galaxies contain 15 out of 20 SNe and 49% of the sensitivity, resulting in a binomial significance of 98%. Even for very small values of the effect remain present: using Mpc, the cluster rate (based on only 5 SNe) is 0.048 SNuM, to be compared with the field rate of 0.019 SNuM.
In conclusion, the difference is statistically significant but not at a level above any doubt. Also, because of the possible presence of low-level systematics, a larger number of SNe in a more homogeneous sample of galaxies is needed to confirm this effect.
We note that our cluster SN rate does not take into account the possible contribution from intergalactic cluster SNe (Gal-Yam et al., 2003; Maoz et al., 2005), which would be missed by the searches in the Cappellaro et al. (1999) sample as they were targeted at single galaxies rather than large fields. Gal-Yam et al. (2003) quantified this possible contribution at 20% of the total cluster rate (see also Sand et al. 2007). This extra rate should be added to the cluster rate but not to the field one, and would increase the measured difference and its statistical significance.
5 Dependence of the rates on mass, morphology and radio power
Before discussing the origin of the type Ia rate difference between clusters and field, we explore the possibility that the rates depend on some other galaxy parameter, and that the dependence with environment is only an indirect effect. We consider three possible parameters that are known to be important for the evolution of galaxies: (i) stellar mass; (ii) morphology ; (iii) colors; and (iv) radio power of the parent galaxies.
-
1.
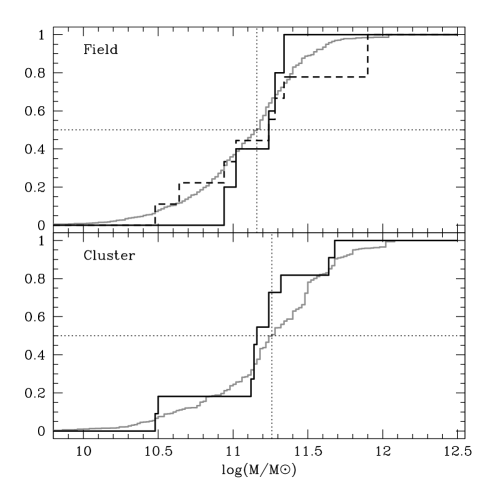
Mass. Following early findings by Gavazzi (1993) and Cowie et al. (1996), “downsizing” has recently become the standard paradigm to describe galaxy formation (see Renzini 2006 for a review). According to this scheme, supported by numerous observations, galaxies with different masses follow different evolutionary paths. Therefore, it is interesting to study how the possible rate difference described in the previous section depends on galaxy mass. This test is also very useful to detect any bias related to the mass, i.e., to the fact that it is more difficult to detect SNe in more massive galaxies, with the higher stellar backgrounds that they pose for SN surveys. In our case, mass does not appear to be at the origin of the difference. As shown in Fig. 4, plotting the the cumulative distributions of sensitivity and SNe as a function of host galaxy mass, cluster and field galaxies have similar mass distributions, with differences limited to below 10%. Furthermore, the distribution of the number of detected SNe with galaxy mass follows that of the “sensitivity”, i.e., galaxies of different mass have the same SN rate per unit mass. Applying the KS test of these two distributions, the resulting normalized “D” values are 1.18 and 1.14 for clusters and field, respectively, i.e., in both cases the distributions are fully consistent with being extracted from the same sample.
-
2.
Morphology. S0 galaxies are known to have younger stellar populations than ellipticals (see, for example, Mannucci et al. 2001). As a consequence, different mixes of morphological types in clusters and in the field could be at the origin of the different rates. The top panel of figure 5 shows that this is not the case. Both S0 and elliptical galaxies, independently, show similar higher rates in clusters, with most of the observed difference due to ellipticals. Also, our sample has similar fractions of both types of galaxies in clusters and in the field: ellipticals are 63% of the cluster early-type galaxies and 56% of the field early-type galaxies.
-
3.
Color. The (B–K) color of early-type galaxies is very sensitive to metallicity, which could have an important effect on SN rate. Also, the presence of traces of star formation could produce bluer colors. Adding a burst producing 0.1% of new stars in yr can change the (B–K) color by up to 0.2 mag. The presence of dust, of multiple subsequent bursts, and differences between the timescales of starburst evolution and SN explosion, can reduce the color difference between galaxies with and without SNe to a much lower level but, possibly, not completely remove it. It is therefore interesting to study if the enhancement of the SN rate is related to the (B–K) color of the parent galaxies. In our sample, the B band photometry is from the RC3 catalog (de Vaucouleurs et al., 1991) and near-IR K band photometry from 2MASS (Jarrett et al., 2003).
The central panel of figure 5 suggests that most of the difference in SN rate is due to blue galaxies, i. e., those having (B–K)3.9. These galaxies contain 7 SNe in clusters and none in the field, even though in our sample we have similar sensitivities in the two environments. This would be consistent with the interpretation of the SN excess as due to a higher level of recent star formation in cluster early-type galaxies. However, such a result is not confirmed by Sloan Digital Sky Survey (SDSS) photometry in the band (centered at 4686Å, similar to the center of the Johnson B band at 4400Å) and in the band (centered at 3551Å), available for about 1/4 of the total sample. No difference is seen in the distributions of (–K) and (–K) colors between cluster and field galaxies. Also, a systematic change in the (B–) color is measured as a function of the apparent B magnitude, with variations of the order of 0.1 mag. This trend depends on both environment and luminosity, with larger differences found in cluster galaxies and in faint objects. The reason for this is not clear, but is probably due to contamination of the RC3 magnitudes by the light of nearby galaxies. Unfortunately, many galaxies hosting SNe are partly saturated in the SDSS images, and their colors cannot be accurately measured.
As a consequence, the dependence of the SN rate on galaxy colors in Fig. 5 should be taken with caution, because our photometry is not precise enough to unambiguously detect variations at the 0.1 mag level.
-
4.
Radio properties. Della Valle et al. (2005) demonstrated that radio-loud early-type galaxies have higher rates of SNe Ia than radio-quiet galaxies of the same type. The overproduction of SNe is explained as the result of a residual activity of star formation, produced by recent episodes of merging or gas accretion (see also Della Valle & Panagia 2003). The alternative mechanism proposed by Livio et al. (2002) to explain the overproduction of novae in M87, i.e., Bondi accretion of the material of the radio jet, cannot be invoked here because SNe require mass accretions larger by 4 order of magnitudes (Della Valle et al., 2005). In principle, the higher rates in clusters could be due to a higher fraction of radio-loud galaxies in clusters than in the field. To check this possibility we have studied the rates in the two environments after splitting the sample into radio-loud and radio-quiet galaxies. The bottom panel of Fig. 5 shows that the rate difference cannot be related to the radio power because both radio-loud and radio-quiet galaxies have higher SN rates in clusters than in the field. Also, the fraction of radio-loud galaxies in both samples is similar, being 16% in clusters and 12% in the field. It appears that both properties (radio-power and environment) are, separately, affecting the rates. This is even more evident when comparing radio-quiet field galaxies with radio-loud cluster galaxies, the latter having rates 20 times larger than the former.
In conclusion, the dependence of the SN Ia rate on the environment is not due to the other parameters considered here, and seems an independent effect.


Also, we analyze several possible selection effects or observational biases that could be at the origin of the difference:
-
1.
The host galaxies are the same in the two samples, i.e., they were selected on the basis of only the morphological index T. As a consequence, no strong differential detection efficiencies are expected to be present in cluster and field samples
-
2.
Dust is not expected to be a major problem in these early-type galaxies and, in particular, it is not supposed to give an important differential effect. Maiolino et al. (2002), Mannucci et al. (2003, 2007) and Cresci et al. (2007) have shown that dust corrections to the rates can be important but only for the very dusty starburst galaxies dominating the star formation density at high redshifts.
-
3.
some remaining observational biases could be related to the fact that the the Cappellaro et al. (1999) sample makes use of 5 visual and photographic searches (see Cappellaro et al. 1997 for details). A spurious effect could be produced if different searches target significantly different fractions of field and cluster galaxies, and if inhomogeneous estimates of the sensitivities are present. Even though we cannot check for the presence of these two problems, we do not think they produce a dominant effect, mainly because the fraction of cluster and field galaxies is expected to be similar in all the surveys.
In conclusion, we do not identify any selection effect that can be responsible for the observed difference. If the difference is not a pure statistical fluctuation, it must related to environmental differences.
6 Discussion and conclusions
The interpretation of the possible difference in SN Ia rate between cluster and field early-type galaxies is not straightforward. As the observed rate is the convolution of the SFH with the DTD, the differences could be due to either of these functions.
-
1.
The first possibility is that the rate difference is due to differences in the stellar populations. Mannucci et al. (2005), Sullivan et al. (2006), and Aubourg et al. (2007) have shown that the type Ia SN rate has a strong dependence on the parent stellar population, with younger stars producing more SNe. The difference in SN rate could be related to this effect, i.e., to a higher level of recent star formation in cluster ellipticals. Only a very small amount of younger stars is needed, because the amplitude of the DTD at short times can be hundreds of times larger than at long times. As an example, the Greggio & Renzini (1983) single-degenerate model has 300 times more amplitude at yr than at yr, and this means that a recently formed stellar population contributing 0.3% of the mass can provide as many SNe as the remaining 99.7% of old stars. For the “two channel” model by Mannucci et al. (2006), the amount of young stars needed can be even lower, at the 0.1% level, as this DTD amplitude ratio between and years is as large as 1000.
The presence of traces of star formation in early-type galaxies is not inconsistent with other observations. Many ellipticals show signs of recent interactions or star formation activity: faint emission lines (Sarzi et al., 2006), tidal tails (van Dokkum, 2005), dust lanes (van Dokkum & Franx, 1995; Colbert et al., 2001), HI gas (Morganti et al., 2006), molecular gas (Welch & Sage, 2003), and very blue UV colors (Kaviraj et al., 2006; Schawinski et al., 2007; Haines et al., 2007; Kaviraj et al., 2007). Even if the interpretation of most of these effects is matter of debate (for example, di Serego Alighieri et al. 2007 have found only small amounts of HI gas in cluster ellipticals), the observations suggest a widespread, low-level presence of star formation.
The dependence of this presence with environment is not settled yet. Ferreras et al. (2006) have found evidence for recent star formation, at the percent level, in ellipticals in compact groups, but not in field ellipticals. In contrast, Verdugo et al. (2007) and Haines et al. (2007) have found higher levels of present star formation in field rather then cluster early-type galaxies.
Some studies (see, for example, Sánchez-Blázquez et al. 2006, Bernardi et al. 2006 and Collobert et al. 2006), have found younger ages in field early-type galaxies with respect to cluster galaxies (but di Serego Alighieri et al. 2006 have found no difference). Taken at face value, this would seem to contradict the star formation interpretation of the SN rate, but this is not necessary the case. Field ellipticals could be younger that cluster ellipticals, but nevertheless they could show a lower level of present star formation. The difference in the age of the dominant stellar population of early-type galaxies, of the order of 1 Gyr for ages of about 12 Gyr, might not be directly related to the amount of star formation in the last few years. Such a contribution cannot be detected in the integrated colors of the galaxies. The expected differences are at the 0.05 mag level for the (B–K) color, assuming the younger stars are not associated with dust, and even smaller (0.02 mag for =1), allowing for dust extinction.
It is usually assumed that early-type galaxies can form new stars only after merging with a small, gas rich galaxy, because usually they do not host much interstellar gas. The average amount of stars formed is proportional to the merger (or encounter) rate, to the typical amount of gas in the accreted galaxy, and to the efficiency of star formation in the accreted gas. It is possible that one or more of these quantities are larger for cluster galaxies than for field galaxies because of the different galaxy volume density and galaxy-galaxy encounter velocity.
If this is the correct interpretation, the “prompt” population of SNe Ia would be associated with the explosion of CC SNe from the same young stellar populations. If a SN Ia is to explode within yr of the formation of its progenitor, the primary star of the progenitor binary system must have a mass above 5.5 M⊙ to allow for the formation of a white dwarf in such a short time. Mannucci et al. (2006) have shown that reproducing the observed SN rates by using the “bimodal” DTD in that paper implies that about 7% of all stars between 5.5 and 8 M⊙ explode as “prompt” SNe Ia, while the “tardy” population corresponds to a lower explosion efficiency, about 2%, and on a much longer timescale (see also Maoz 2007 for various estimates of these efficiencies). For a Salpeter IMF and assuming that 100% of the stars between 8 and 40 M⊙ end up at CC SNe, we expect 1.3 CC SNe for each “prompt” type Ia. Assuming that the difference between cluster and field early-type galaxies is due to the “prompt” SNe Ia, the rate of this population is of the order of 0.066-0.019=0.047 SNuM (see Table 2). Converting this rate to an observed number, about 2 CC SNe are expected in the cluster early-type galaxies of our sample, consistent with our null detection at about 1.3 level. We conclude that the non detection of CC in the early-type galaxies belonging to our sample and the corresponding upper limits to the CC rate are consistent with the hypothesis of a “prompt” Ia component. We also note that some CC SNe have been discovered in the recent past in prototypical early-type galaxies. (Pastorello et al., 2007).
-
2.
A second possible interpretation is that the higher rate in cluster early-type galaxies is related to differences in the DTD. If the stars in ellipticals are 9-12 Gyrs old (see, for example, Mannucci et al. 2001), the SN rate is dominated by the tail of the DTD at long times. Differences in the environments could produce small differences in the shape of this function, for example because of the higher numbers of encounters.
A interesting possibility is also that the changes in the DTD are related to differences in metallicity between cluster and field early-type galaxies, as discussed by Sánchez-Blázquez et al. (2006); Bernardi et al. (2006); Collobert et al. (2006) and Prieto et al. (2007). The differences between cluster and field galaxy metallicity presented by these papers are neither large nor always in the same direction. Nevertheless systematic, although not large, differences in metallicity could be present and produce significant changes in the DTD, for example, by affecting the efficiency of mass loss during the complex life of a binary system.
Table 1 lists the different measurements of the SN rate in early-type cluster galaxies. The evolution of this rate can be compared with the history of star formation of the parent galaxies to derive the DTD. Currently published cluster SN rates at z0.2 are too uncertain to permit any strong conclusions. However, current and future searches for SNe are expected to change this situation and allow for the derivation of meaningful constraints (see, for example, Sharon et al. 2006).
To summarise, we have used a sample of 136 SNe in the local universe to measure the SN rate as a function of environment. For the first time, we measure the CC SN rate in clusters. We find it is very similar to the CC SN rate in field galaxies, suggesting that the IMF is not a strong function of the environment. For Ia SNe, the rates in clusters and in the field are similar for all galaxy types except for the early-type systems, where we detect a significant excess in clusters. This excess is not related to other properties of those galaxies, such as mass, morphology, or radio loudness. Environments itself appears to be important. We interpret this effect as possibly due to galaxy-galaxy interaction in clusters, either producing a small amount of young stars (of the order of the percent in mass over one Hubble time), or affecting the evolution of the properties of the binary systems.
Acknowledgments
We thank Sperello di Serego and the MEGA group (Arcetri Extragalactic Meeting) for useful discussions about the properties of elliptical galaxies. This research has made use of the NASA/IPAC Extragalactic Database (NED) which is operated by the Jet Propulsion Laboratory, California Institute of Technology, under contract with the National Aeronautics and Space Administration. DM, MD, and AG thank the Kavli Institute for Theoretical Physics for its hospitality. This research was supported in part by the National Science Foundation under Grant No. PHY05-51164.
References
- Aubourg et al. (2007) Aubourg, E., Tojeiro, R., Jimenez, R., Heavens, A., Strauss, M. A., & Spergel, D. N., 2007, ApJ, in press (arXiv:0707.1328)
- Balestra et al. (2007) Balestra, I., Tozzi, P., Ettori, S., Rosati, P., Borgani, S., Mainieri, V., Norman, C., & Viola, M. 2007, A&A, 462, 429
- Barris & Tonry (2006) Barris, B. J., & Tonry, J. L. 2006, ApJ, 637, 427
- Bernardi et al. (2006) Bernardi, M., Nichol, R. C., Sheth, R. K., Miller, C. J., & Brinkmann, J. 2006, AJ, 131, 1288
- Bianchi & Schneider (2007) Bianchi, S., & Schneider, R., 2007, MNRAS, in press (arXiv:0704.0586)
- Barbon (1978) Barbon, R. 1978, AJ, 83, 13
- Belczynski et al. (2005) Belczynski, K., Bulik, T., & Ruiter, A., 2005 ApJ, 629, 915
- Botticella et al. (2007) Botticella, M. T., et al., 2007, submitted.
- Caldwell & Oemler (1981) Caldwell, C. N., & Oemler, A. 1981, AJ, 86, 1424
- Calura et al. (2007) Calura, F., Matteucci, F., & Tozzi, P. 2007, MNRAS, in press.
- Cappellaro et al. (1997) Cappellaro, E., et al. 1997
- Cappellaro et al. (1999) Cappellaro, E., Evans, R., & Turatto, M., 1999, A&A, 351, 459
- Cappellaro et al. (2005) Cappellaro, E., et al., 2005, A&A, 430, 83
- Colbert et al. (2001) Colbert, J. W., et al., 2001, AJ, 121, 808
- Crane et al. (1977) Crane, P., Tammann, G. A., & Woltjer, L. 1977, Nature, 265, 124
- Collobert et al. (2006) Collobert, M., Sarzi, M., Davies, R. L., Kuntschner, H., & Colless, M. 2006, MNRAS, 370, 1213
- Cowie et al. (1996) Cowie, L. L., Songaila, A., Hu, E. M., & Cohen, J. G. 1996, AJ, 112, 839
- Cresci et al. (2007) Cresci, G., Mannucci, F., Della Valle, M., & Maiolino, R. 2007, A&A, in press (astro-ph/0610783)
- Dahlen et al. (2004) Dahlen, T., et al. 2004, ApJ, 613, 189
- de Plaa et al. (2007) de Plaa, J., Werner, N., Bleeker, J. A. M., Vink, J., Kaastra, J. S., & Méndez, M. 2007, ApJ, 465, 345
- Della Valle & Panagia (2003) Della Valle, M., & Panagia, N. 2003, ApJl, 587, L71
- Della Valle et al. (2005) Della Valle, M., Panagia, N., Padovani, P., Cappellaro, E., Mannucci, F., Turatto, M., 2005, ApJ, 629, 750
- Dressler et al. (1997) Dressler, A., et al. 1997, ApJ, 490, 577
- Dupke & White (2002) Dupke, R. A., & White, R. E. III, 2002, ApJ, 528, 139
- Ferreras et al. (2006) Ferreras, I., Pasquali, A., de Carvalho, R. R., de la Rosa, I. G., & Lahav, O. 2006, MNRAS, 370, 828
- Förster et al. (2006) Förster, F., Wolf, C., Podsiadlowski, Ph, & Han, Z., 2006, MNRAS, 368, 1893
- Gal-Yam et al. (2002) Gal-Yam, A., Maoz, D., & Sharon, K. 2002, MNRAS, 332, 37
- Gal-Yam et al. (2003) Gal-Yam, A., Maoz, D., Guhathakurta, P., & Filippenko, A. V. 2003, AJ, 125, 1087
- Gal-Yam & Maoz (2004) Gal-Yam, A., & Maoz, D. 2004, MNRAS, 347, 942
- Gal-Yam et al. (2007) Gal-Yam, A., et al., 2007, in preparation.
- Gavazzi (1993) Gavazzi, G. 1993, ApJ, 419, 469
- Germany et al. (2004) Germany, L. M., Reiss, D. J., Schmidt, B. P., Stubbs, C. W., & Suntzeff, N. B. 2004, A&A, 415, 863
- Goto et al. (2004) Goto, T., Yagi, M., Tanaka, M., & Okamura, S. 2004, MNRAS, 348, 515
- Greggio & Renzini (1983) Greggio, L., & Renzini, A., 1983, A&A, 118, 217
- Greggio (2005) Greggio, L., 2005, A&A, 441, 1055
- Haines et al. (2007) Haines, C. P., Gargiulo,A., & Merluzzi, P., 2007, MNRAS, in press (arXiv:0707.2361)
- Hansen et al. (2005) Hansen S. M., McKay T. A., Wechsler R. H., Annis J., Sheldon E. S., & Kimball A., 2005, ApJ, 633, 122
- Jarrett et al. (2003) Jarrett, T. H., Chester, T., Cutri R., Schneider, S., & Huchra, J., 2003, AJ, 125, 525.
- Kaviraj et al. (2006) Kaviraj, S., et al. 2006, AJ, in press (astro-ph/0610029)
- Kaviraj et al. (2007) Kaviraj, S., et al. 2007, submitted (arXiv:0709.0806)
- Livio et al. (2002) Livio, M., Riess, A., & Sparks, W. 2002, ApJL, 571, L99
- Loewenstein (2006) Loewenstein, M. 2006, ApJ, 648, 230
- Maiolino et al. (2001) Maiolino, R., Mannucci, F., Baffa, C., Gennari, S., & Oliva, E. 2001, ApJ, 372, L5
- Maiolino et al. (2002) Maiolino, R., Vanzi, L., Mannucci, F., Cresci, G., Ghinassi, F., Della Valle, M. 2002, A&A, 389, 84
- Maiolino et al. (2004a) Maiolino, R., Schneider, R., Oliva, E., Bianchi, S., Ferrara, A., Mannucci, F., Pedani, M., & Roca Sogorb, M. 2004a, Nature, 431, 533
- Maiolino et al. (2004b) Maiolino, R., Oliva, E., Ghinassi, F., Pedani, M., Mannucci, F., Mujica, R., & Juarez, Y. 2004b, A&A 420, 889
- Mannucci et al. (2001) Mannucci, F., Basile, F., Poggianti, B. M., Cimatti, A., Daddi, E., Pozzetti, L., & Vanzi, L. 2001, MNRAS, 326, 745
- Mannucci et al. (2003) Mannucci, F., Maiolino, R., Cresci, G, et al., 2003, A&A, 401, 519
- Mannucci et al. (2005) Mannucci, F., Della Valle, M., Panagia, N., et al., 2005, A&A, 433, 807
- Mannucci et al. (2006) Mannucci, F., Della Valle, M., & Panagia, N., 2006, MNRAS, 370, 773
- Mannucci et al. (2007) Mannucci, F., Della Valle, M., & Panagia, N. 2007, MNRAS, 377, 1229
- Maoz & Gal-Yam (2004) Maoz, D., & Gal-Yam, A. 2004, MNRAS, 347, 951
- Maoz et al. (2005) Maoz, D., Waxman, E., & Loeb, A. 2005, ApJ, 632, 847
- Maoz (2007) Maoz, D. 2007, submitted (arXiv:0707.4598) i
- Matteucci & Recchi (2001) Matteucci, F., & Recchi, S. 2001, ApJ, 558, 351
- Matteucci & Greggio (1986) Matteucci, F., & Greggio, L., 1986, A&A, 154, 279
- Matteucci et al. (2006) Matteucci, F., Panagia, N., Pipino, A., Mannucci, F., Recchi, S., & Della Valle, M. 2006, MNRAS, 372, 265
- Morganti et al. (2006) Morganti, R., et al., 2006, MNRAS, 371, 157
- Neill et al. (2006) Neill, J. D., et al. 2006, AJ, 132, 1126
- Norgaard-Nielsen et al. (1989) Norgaard-Nielsen, H. U., Hansen, L., Jorgensen, H. E., Aragon Salamanca, A., & Ellis, R. S. 1989, Nature, 339, 523
- Paturel et al. (2003) Paturel, G., et al., 2003, A&A, 412, 45
- Park et al. (2007) Park, C., Choi, Y.-Y., Vogeley, M. S., Gott, J. R. I., & Blanton, M. R. 2007, ApJ, 658, 898
- Pastorello et al. (2007) Pastorello, A., et al., 2007, Nature, accepted.
- Poznanski et al. (2007) Poznanski, D., et al., 2007, MNRAS, in press (arXiv:0707.0393)
- Prieto et al. (2007) Prieto, J. L., Stanek, K. Z., & Beacom, J. F. 2007, ApJ, in press (arXiv:0707.0690)
- Renzini (2006) Renzini, A, 2006, in “At the Edge of the Universe”, J. Afonso ed., ASP Conf. Ser., in press
- Renzini et al. (1993) Renzini, A., Ciotti, L., D’Ercole, A., & Pellegrini, S. 1993, ApJ, 419, 52
- Reiss et al. (1998) Reiss, D. J., Germany, L. M., Schmidt, B. P., & Stubbs, C. W. 1998, AJ, 115, 26
- Sánchez-Blázquez et al. (2006) Sánchez-Blázquez, P., Gorgas, J., Cardiel, N., & González, J. J. 2006, A&A, 457, 809
- Sand et al. (2007) Sand, D. J., Zaritsky, D., Herbert-Fort, S., Sivanandam, S., & Clowe, D. 2007, in press (arXiv:0709.2519)
- Sarzi et al. (2006) Sarzi, M., et al., 2006, MNRAS, 366, 1151
- di Serego Alighieri et al. (2006) di Serego Alighieri, S., Lanzoni, B., & Jørgensen, I. 2006, ApJL, 652, L145
- di Serego Alighieri et al. (2007) di Serego Alighieri, S., et al. 2007, A&A, in press (arXiv:0709.2096)
- Sharon et al. (2007) Sharon, K., Gal-Yam, A., Maoz, D., Filippenko, A. V., & Guhathakurta, P. 2007, ApJ, 660, 1165
- Smith et al. (2005) Smith G. P., Treu T., Ellis R. S., Moran S. M., Dressler A., 2005, ApJ, 620, 78
- Sorrentino et al. (2006) Sorrentino, G., Antonuccio-Delogu, V., & Rifatto, A. 2006, A&A, 460, 673
- Sullivan et al. (2006) Sullivan, M., et al., 2006, ApJ, 648, 868
- Scannapieco & Bildsten (2005) Scannapieco, E., & Bildsten, L. 2005, ApJL, 629, L85
- Scannapieco et al. (2006) Scannapieco, C., Tissera, P. B., White, S. D. M., & Springel, V. 2006, MNRAS, 371, 1125
- Schawinski et al. (2007) Schawinski, K. et al., 2007, ApJ, in press (astro-ph/0601036)
- Sharon et al. (2006) Sharon, K., et al. 2006, in ”The Multicoloured Landscape of Compact Objects and their Explosive Origins”, Cefalu, Italy, June 2006, to be published by AIP, Eds. L. Burderi et al. (astro-ph/0611920)
- Sharon et al. (2007) Sharon, K., Gal-Yam, A., Maoz, D., Filippenko, A. V., & Guhathakurta, P. 2007, ApJ, 660, 1165
- Sullivan et al. (2006) Sullivan, 2006
- Tornambè & Matteucci (1986) Tornambè, A., & Matteucci, F. 1986, MNRAS, 223, 69
- Tornambè (1989) Tornambè, A. 1989, MNRAS, 239, 771
- Tutukov & Yungelson (1994) Tutukov, A. V., & Yungelson, L. R. 1994, MNRAS, 268, 871
- de Vaucouleurs et al. (1991) de Vaucouleurs, G., de Vaucouleurs, A., Corwin, H. G., Jr., Buta, R. J., Paturel, G., & Fouque, P. 1991, Volume 1-3, XII, Springer-Verlag Berlin Heidelberg New York,
- van Dokkum & Franx (1995) van Dokkum, P. G., & Franx, M. 1995, AJ, 110, 2027
- van Dokkum (2005) van Dokkum, P. G., 2005, AJ, 130, 264
- Verdugo et al. (2007) Verdugo, M., Ziegler, B. L., & Gerken, B., 2007, A&A, in press (arXiv:0709.4508)
- Yungelson & Livio (2000) Yungelson, L. R., & Livio, M., 2000, ApJ, 528, 108 (YL00)
- Yungelson (2005) Yungelson, L. R. 2005, Astrophysics and Space Science Library, 332, 163
- Welch & Sage (2003) Welch, G. A., & Sage, L. J., 2003, ApJ, 584, 260
- Zaritsky et al. (2004) Zaritsky, D., Gonzalez, A. H., & Zabludoff, A. I. 2004, ApJL, 613, L93