Spectroscopic Determination of the Luminosity Function in The Galaxy Clusters A2199 and Virgo
Abstract
We report a new determination of the faint end of the galaxy luminosity function in the nearby clusters Virgo and Abell 2199 using data from SDSS and the Hectospec multifiber spectrograph on the MMT. The luminosity function of A2199 is consistent with a single Schechter function to + 5 log with a faint-end slope of (statistical). The LF in Virgo extends to and has a slope of (statistical). The red sequence of cluster members is prominent in both clusters, and almost no cluster galaxies are redder than this sequence. A large fraction of photometric red-sequence galaxies lie behind the cluster. We compare our results to previous estimates and find poor agreement with estimates based on statistical background subtraction but good agreement with estimates based on photometric membership classifications (e.g., colors, morphology, surface brightness). We conclude that spectroscopic data are critical for estimating the faint end of the luminosity function in clusters. The faint-end slope we find is consistent with values found for field galaxies, weakening any argument for environmental evolution in the relative abundance of dwarf galaxies. However, dwarf galaxies in clusters are significantly redder than field galaxies of similar luminosity or mass, indicating that star formation processes in dwarfs do depend on environment.
Subject headings:
galaxies: clusters — galaxies: elliptical and lenticular, cD — galaxies: kinematics and dynamics — cosmology: observations1. Introduction
The luminosity function of galaxies is fundamental to understanding galaxy formation and evolution. The luminosity function differs dramatically from the expected mass function of dark matter halos, indicating that baryonic physics is very important for understanding galaxies. In particular, a well-determined luminosity function enables accurate modeling linking the masses of dark matter haloes to galaxy luminosities (e.g., Vale & Ostriker, 2006; Yang et al., 2007, and references therein). These empirical models provide a powerful test of any model of galaxy formation and evolution.
Early studies of the luminosity function used the large galaxy density in clusters as a tool for measuring the shape of the luminosity function (e.g., Sandage et al., 1985). The obvious drawback of this method is that the luminosity function in dense environments may differ from that in more typical galaxy environments (Binggeli et al., 1988; Driver et al., 1994; de Propris et al., 1995). Environmental trends in the luminosity function may reflect differences in galaxy formation in different environments (Tully et al., 2002; Benson et al., 2003). For instance, tidal stripping or “threshing” of larger galaxies may produce dwarf galaxies (Bekki et al., 2001), or dwarf galaxies may be formed in tidal tails of intractions among giant galaxies (Barnes & Hernquist, 1992). Alternatively, the denser environments of protoclusters may have shielded low-mass galaxies from the ultraviolet radiation responsible for reionization (Tully et al., 2002; Benson et al., 2003).
Many studies suggest an environmental influence on the LF; others provide no such evidence. The main difficulty in resolving this important issue is the challenge of determining cluter membership for faint galaxies where background galaxy counts are large.
Because few deep spectroscopic surveys of clusters extend into the dwarf galaxy regime (-18; for exceptions, see Mobasher et al., 2003; Christlein & Zabludoff, 2003; Mahdavi et al., 2005, and references therein), cluster membership is usually determined via statistical subtraction of background galaxies (e.g., Popesso et al., 2006; Jenkins et al., 2007; Milne et al., 2007; Adami et al., 2007; Yamanoi et al., 2007; Barkhouse et al., 2007, and references therein). Because galaxy number counts increase much more steeply than cluster member counts (even for very steep faint-end slopes), small systematic uncertainties in background subtraction can produce large uncertainties in the abundance of faint cluster galaxies.
Here, we use MMT/Hectospec spectroscopy and data from the Sloan Digital Sky Survey (SDSS, Stoughton et al., 2002) to estimate the luminosity function (LF) in the clusters Abell 2199 and Virgo. These data enable very deep sampling of the luminosity function. In particular, we report an estimate of the faint-end slope of the luminosity function with much smaller systematic uncertainties than most previous investigations. We demonstrate that photometric properties of galaxies such as color and surface brightness correlate well with cluster membership (in agreement with many previous studies). Very few galaxies redder than the red sequence are cluster members.
We discuss the photometric and spectroscopic data in . We present the luminosity functions in . We compare our results to previous studies and discuss possible systematic effects and uncertainties in . We conclude in . An Appendix details the construction of our catalog of confirmed and probable Virgo cluster members.
We assume cosmological parameters of =0.3, =0.7, =70 . The spatial scale at the distance of A2199 is 1′′=0.61 and 1′′=0.080 at the distance of Virgo.
2. Observations
2.1. Abell 2199
The nearby X-ray cluster Abell 2199 (e.g., Rines et al., 2002, and references therein) offers an excellent opportunity for probing the LF in a rich, nearby cluster. A2199 is significantly more massive than Virgo (Rines & Diaferio, 2006) and X-ray data suggest that it is a relaxed cluster (Markevitch et al., 1999). The center of A2199 is dominated by NGC 6166, a massive cD galaxy (Kelson et al., 2002).
2.1.1 Optical Imaging
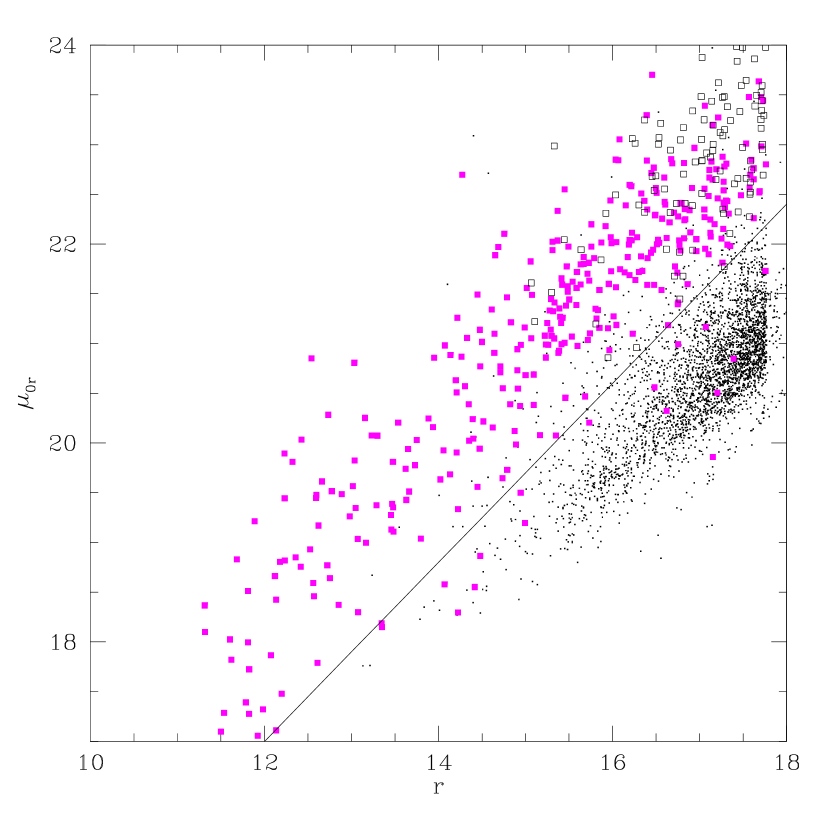
Cluster galaxies display a well-defined red sequence in color-magnitude diagrams (Visvanathan & Sandage, 1977). Cluster mmebers are unlikely to have colors redder than the red sequence unless they are very dusty or have very unusual stellar populations.
Using photometric data from SDSS, the red sequence of cluster galaxies is readily apparent in A2199 (Figure 1). The red sequence can be characterized as (solid line in Figure 1). Among bright galaxies (16) with measured redshifts (SDSS, Rines et al., 2002), most photometric red-sequence galaxies are cluster members. As recommended in the SDSS web pages, we use composite model magnitudes as the best estimates of the galaxy magnitudes. Composite model magnitudes are a linear combination of the best-fit deVaucouleurs and exponential profiles. We correct all magnitudes for Galactic extinction.

2.1.2 Optical Spectroscopy
For MMT spectroscopy, we use SDSS photometry to identify candidate cluster members in the magnitude range =17-20, or at the distance of A2199. This range samples dwarf galaxies in A2199 and therefore offers an excellent test of the abundance of dwarf galaxies in dense environments.
We obtained optical spectroscopy of A2199 with MMT/Hectospec in 2007 July under marginal observing conditions. Hectospec is a 300-fiber multiobject spectrograph with a circular field of view of 1∘ diameter (Fabricant et al., 2005). We used the 270-line grating, yielding 6.2Å FWHM resolution.
We observed A2199 with two configurations and obtained 479 secure redshifts (out of 482 galaxies targeted). We obtained 3 exposures of 600s for each configuration to facilitate cosmic ray removal. Targets in the first configuration included all galaxies in the magnitude range 1719. Targets in the second configuration included galaxies in the range 1720, with rankings assigned to four groups: 1) 1719 galaxies on the photometric red sequence or blueward [], 2) 1719 galaxies redward of the red sequence, 3) 1920 galaxies on or blueward of the red sequence, and 4) 1920 galaxies redward of the red sequence. We consider galaxies to lie on the red sequence or blueward if their colors are no more than 0.1 mag redder than the red sequence (Figure 1). We remove all galaxies with fiber magnitudes 21 because they are unlikely to yield reliable redshifts in short exposures with Hectospec. We discuss the impact of this selection in . Note that one galaxy with a Hectospec redshift in A2199 (RA: 16h29m00.39s, DEC: +39:36:48.8 J2000) is blended with a star in SDSS so that we do not have reliable photometry for it. As a rough estimate for the magnitude of the galaxy, we subtract the flux for the star (determined from psfMag) from the merged object to find .
The Hectospec field of view covers projected radii , equivalent to for the parameters given in Rines et al. (2003), or for the parameters given in Rines & Diaferio (2006). There are 32 galaxies in the Hectospec sample that have SDSS spectroscopy. The mean velocity difference is , and the scatter in the velocity differences is , slightly smaller than the mean uncertainty of calculated from the formal uncertainties. Table 1 lists the coordinates and redshifts for the Hectospec data. Columns 1 and 2 list the coordinates (J2000), Columns 3 and 4 list the heliocentric velocity and the corresponding uncertainty , and Column 5 lists the cross-correlation score R (Kurtz & Mink, 1998).
| RA | DEC | R | |||
|---|---|---|---|---|---|
| (J2000) | (J2000) | () | () | ||
| 16:28:50.87 | 39:41:03.8 | 9074 | 37 | 08.05 | |
| 16:28:46.96 | 39:44:59.8 | 10783 | 17 | 16.70 | |
| 16:27:35.79 | 39:56:53.1 | 72585 | 35 | 12.91 | |
| 16:28:50.56 | 40:00:46.0 | 83201 | 23 | 07.22 | |
| 16:27:59.92 | 39:49:48.6 | 9331 | 56 | 04.72 |
To measure the luminosity function of the brighter galaxies in A2199, we use redshifts for 207 galaxies measured either in SDSS or the literature sources compiled in the NASA/IPAC Extragalactic Database (NED)111http://nedwww.ipac.caltech.edu/. Many of these redshifts are from the Cluster And Infall Region Nearby Survey (CAIRNS), which is complete to -22.55 + 5 log (Rines et al., 2002, 2004), corresponding to 16. SDSS is nominally complete to =17.77 (Strauss et al., 2002), although fiber collisions are more problematic for completeness in dense regions such as nearby clusters. There are 12 galaxies in the range 1617 that do not have redshifts in either SDSS or NED. Artificially including all these galaxies as members does not change the LF significantly.
2.2. Virgo
We use recently released SDSS spectroscopy from Data Release 6 (DR6; Adelman-McCarthy et al., 2007) to determine the luminosity function in the Virgo cluster, the closest large galaxy cluster. Virgo’s proximity ( Mpc, Tonry et al., 2001; Mei et al., 2007) allows the deepest possible probes of the luminosity function. However, Virgo is clearly unrelaxed dynamically, as shown in the lumpiness of the galaxy distribution (Binggeli et al., 1985) and of the X-ray gas (Bohringer et al., 1994).
The SDSS DR6 data cover virtually the entire sky within a projected radius of 1 Mpc from the central galaxy M87. We focus our efforts on this region, although data are available in a strip extending to much larger radius. Galaxies within 1 Mpc of M87 are almost all contained within the main “A” cluster (Binggeli et al., 1985). The radial range covered is similar to that covered in A2199 both in physical units and in overdensity: 1 Mpc in Virgo is (McLaughlin, 1999).
Many previous studies have estimated the luminosity function in Virgo (e.g., Binggeli et al., 1985; Impey et al., 1988; Phillipps et al., 1998; Trentham & Hodgkin, 2002; Sabatini et al., 2003), but none have complete spectroscopy to the depth of SDSS. Without complete spectroscopy, previous investigations have relied on either statistical methods of background subtraction or on alternative membership indicators including morphology or surface brightness.
The proximity of the Virgo cluster presents challenges for constructing a robust photometric catalog containing galaxies of varying size, morphology, and surface brightness. We detail the construction of our new Virgo cluster catalog in the Appendix.
Figure 2 shows the color-magnitude diagram of galaxies in the Virgo cluster and in the background. Colors are from the fiber magnitudes (Adelman-McCarthy et al., 2007). Only four spectroscopically confirmed members in the magnitude range =13-16 redder than the red sequence are Virgo members; all four lie on the red sequence or blueward if the color is measured from the model magnitudes. Nearly all Virgo members with and redder than the red sequence are low surface brightness galaxies and may have unreliable colors.

Because surface brightness correlates with absolute magnitude, the faintest Virgo galaxies in SDSS may be close to the surface brightness limit of the survey. Blanton et al. (2005) studied the completeness of the SDSS pipeline using simulated images of galaxies with a wide range of apparent magnitudes and surface brightnesses. Figure 3 shows central surface brightness versus apparent magnitude for galaxies within of M87. We define the central surface brightness as to convert the fiber magnitudes into mag arcsec-2 (this definition assumes constant surface brightness within the fiber). Galaxies in the background of Virgo tend to have higher surface brightness at a fixed apparent magnitude (Tolman, 1930; Kurtz et al., 2007), but the loci of Virgo galaxies and background galaxies overlap. Galaxies from DR6 with but outside of Virgo show a similar distribution, indicating that this difference is not due to photometric issues specific to the Virgo cluster.
The dramatically different distributions of magnitude versus surface brightness for Virgo members and background galaxies strongly support the use of surface brightness as a membership classification (e.g., Binggeli et al., 1985; Conselice et al., 2002; Hilker et al., 2003; Mahdavi et al., 2005; Mieske et al., 2007). The SDSS spectra show the power of this classification. Adopting to separate the two populations (and excluding 34 very bright galaxies with that lie outside Figure 3), 65.2% of galaxies with lower surface brightness are spectroscopically confirmed Virgo members. Virgo members comprise only 0.67% of galaxies with higher surface brightnesses. This simple photometric cut removes 95.2% of the spectroscopically confirmed background galaxies.
The power of this technique shows that there is a tight correlation between absolute magnitude and surface brightness for both cluster galaxies (e.g., Andreon & Cuillandre, 2002) and field galaxies (e.g., Blanton et al., 2005). This classification may be unusually clean for the Virgo cluster due to the large deficit of galaxies in the immediate background of Virgo (Ftaclas et al., 1984).
Figure 4 shows average surface brightness within the Petrosian half-light radius versus apparent magnitude. This is the definition of surface brightness used to construct the SDSS spectroscopic target catalogs. Figure 4 shows the results of a completeness study of LSB galaxies performed by Blanton et al. (2005). There are significant numbers of Virgo members in the region where the SDSS spectroscopic target catalog begins to become incomplete. This incompleteness is mitigated by the inclusion of large galaxies inserted by hand after the main target selection (Blanton et al., 2005) and by the procedures we follow here to identify additional Virgo members below the spectroscopic target limits (see Appendix).
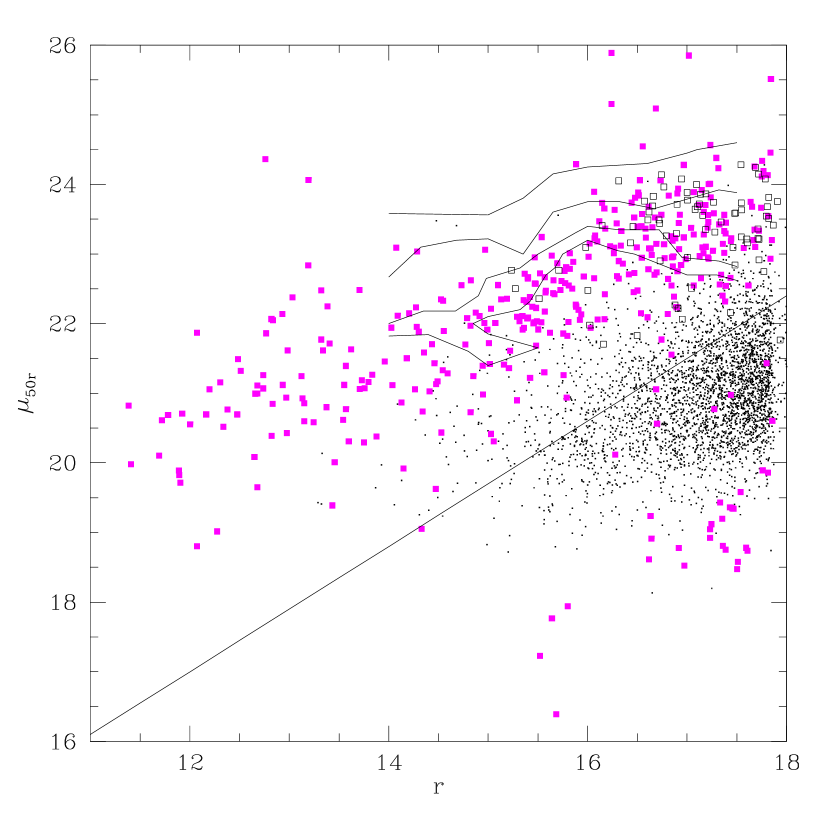
Figure 3 provides a useful constraint on the abundance of high surface brightness galaxies in clusters. In particular, a new class of high surface brightness galaxies was discovered in the Fornax cluster (Drinkwater et al., 1999; Hilker et al., 1999). These galaxies, termed ultracompact dwarf galaxies (UCDs), usually are unresolved in ground-based imaging. The typical luminosities of UCDs place them between globular clusters and compact elliptical galaxies like M32. Two groups have found UCDs in the Virgo cluster (Haşegan et al., 2005; Jones et al., 2006), but they appear to be a relatively rare type of galaxy. While many UCDs would be unresolved in ground-based SDSS imaging, the SDSS data successfully recovers the compact Virgo members VCC 1313 and VCC 1627 (Trentham & Hodgkin, 2002) as well as a previously undiscovered UCD (classified as a galaxy by the SDSS photometric pipeline and described by Chilingarian & Mamon, 2007).
The SDSS spectroscopy demonstrates conclusively that the Virgo cluster contains very few high surface brightness galaxies that are resolved in ground-based imaging. Estimating the total number of stellar-like UCDs in Virgo is observationally expensive, requiring spectroscopy of all stellar-like objects (Jones et al., 2006) or HST imaging (Haşegan et al., 2005). Existing studies indicate that UCDs are not sufficiently common to significantly affect the luminosity function of Virgo cluster galaxies.
3. Results
We use the 479 Hectospec redshifts for A2199 along with 207 redshifts from SDSS and the literature to determine the luminosity function. Of these 686 galaxies, 351 are members of A2199. In Virgo, we find 484 definite or probable members (including 5 with 17.77) out of a total of 3971 galaxies within 1 Mpc of M87 and 17.77. The luminosity functions for both clusters suggest relatively shallow faint-end slopes, for A2199 and for Virgo.
3.1. A2199
3.1.1 Membership Fractions and Composition of Cluster Members
Figure 1 shows that very few galaxies redward of the red sequence are members of A2199. Seven of the nine galaxies above our nominal cutoff for red-sequence galaxies are 0.05 mag redder than the cutoff (five are 0.02 mag redder), suggesting that our cutoff might be too restrictive. Inspection of the two remaining galaxies reveals that their colors are likely overestimated due to deblending problems in SDSS: the colors based on the SDSS fiber magnitudes place both objects onto the red sequence. Figure 2 shows a similar trend for the Virgo cluster; nearly all galaxies redder than the red sequence are background galaxies. The exceptions are either deblending problems or low surface brightness galaxies for which accurate colors are difficult to obtain (). This result suggests that the red sequence is a remarkably well defined limit for the intrinsic colors of cluster galaxies. There are no large populations of edge-on spiral galaxies or dusty starbursts that have unusually red colors.
One striking aspect of Figures 1 and 2 is that many galaxies that lie on the photometric red sequence (and blueward) lie well behind the cluster.
We quantify these trends in Figure 5. We divide the galaxies into three populations: red sequence galaxies within 0.1 mag of our assumed red sequence, and “very red” and “blue” galaxies for galaxies outside this color range. The upper left panel of Figure 5 shows the membership fraction as a function of apparent magnitude for these three classes as well as for the total population. Using these membership fractions, we define the cluster population by assuming that these membership fractions are constants for each population.

The lower left panel of Figure 5 shows the fraction of the total cluster population in each of the three classes. Galaxies on the red sequence dominate the cluster population at all magnitudes. Because most of the member galaxies in the “very red” population lie close to the cutoff, the fraction of “very red” cluster members is almost certainly overestimated. Similarly, the membership fraction of the very red population should be regarded as an upper limit.
The right-hand panels of Figure 5 show these fractions as functions of projected clustrocentric radius. As expected, the membership fractions generally decline with radius, and the fraction of blue galaxies increases with radius (and hence decreasing density, e.g., Abraham et al., 1996; Balogh et al., 2004; Tanaka et al., 2004; Rines et al., 2005). One surprising feature of the upper right panel of Figure 5 is that the membership fraction of blue galaxies does not decline monotonically with radius but instead reaches a minimum and then increases until it crosses the trend for red galaxies.
3.1.2 The Luminosity Function of A2199
Based on Figures 1 and 5, we estimate the total luminosity function in 0.5 mag bins by applying the membership fraction of spectroscopically observed galaxies to the three color populations. Figure 6 shows the luminosity function of A2199. The upper solid line shows the counts of galaxies in 0.5 mag bins when restricted to the “red sequence” and “blue” cuts defined above. The raw counts of galaxies on or bluer than the red sequence show a significant upturn at =-17, similar to the upturn seen by Popesso et al. (2006).
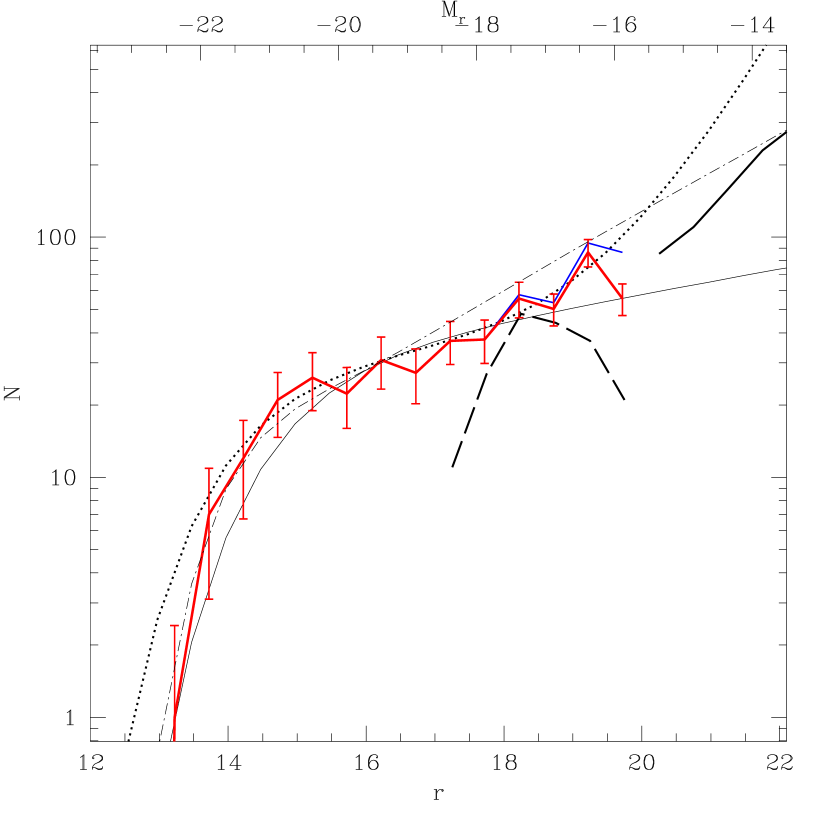
The dashed line at 1720 shows the counts of spectroscopic members, where members have 700011,000 (Rines et al., 2002). Note that the contrast in redshift space between cluster members and background galaxies is large; the exact velocity limits are not a significant source of uncertainty (Rines et al., 2002; Rines & Diaferio, 2006). The thick solid line in Figure 6 shows the resulting LF.
The LF of A2199 can be well fit by a function with the form proposed by Schechter (1976). This function has the form
| (1) |
where is the characteristic magnitude of the LF and is the faint-end slope. We fit the A2199 LF by minimizing and excluding the BCG. We find and (thin solid line in Figure 6). Both parameters are similar to those found for field galaxies in SDSS (Blanton et al., 2003) and the Century Survey (Brown et al., 2001). Blanton et al. (2005) investigate the field LF to fainter absolute magnitudes with SDSS and find that it is consistent with steeper faint-end slopes of . The LF of A2199 is therefore similar to or perhaps shallower than the field LF. We discuss systematic uncertainties in the LF of A2199 below. An independent, shallower () study of the A2199 LF found (Andreon, 2007), in excellent agreement with our result.
Figure 6 shows an extrapolation of the A2199 LF to fainter magnitudes. The thick solid line at faint magnitudes shows the LF inferred by assuming that the membership fraction for the three color bins remains constant at fainter apparent magnitudes, using the faintest bin with spectroscopy to estimate these values of . Because decreases steeply with apparent magnitude, this extrapolation is an approximate upper limit on the LF. We make two additional estimates of the extrapolated LF in A2199. The first assumes that all galaxies with in the “blue” and “red-sequence” bins are cluster members. This extrapolated LF yields a more conservative upper limit to the A2199 LF; this extrapolation contains a factor of 2 fewer galaxies than the Popesso LF at . The final estimate of the extrapolated LF assumes that at a given absolute magnitude is the same as in the Virgo cluster (Figure 7; ). Interestingly, the values of for Virgo and A2199 agree at the absolute magnitudes where they overlap, perhaps because the data extend to similar fractions of for the two clusters. This Virgo-based extrapolation of the LF is consistent with extending the best-fit Schechter function. Thus, the range of lines at faint magnitudes in Figure 6 encompasses the full range of reasonable extrapolations of the LF in A2199.
3.2. Virgo
3.2.1 Membership Fractions and Composition of Cluster Members
Figure 7 shows the membership fraction of the three galaxy populations (red sequence, very red, and blue) in the Virgo cluster. The large deficit of galaxies in the immediate background of Virgo (Ftaclas et al., 1984) means that the membership cuts in redshift space are robust. The scatter in color increases with increasing apparent magnitude (Figure 2), although part of this increased scatter reflects less reliable photometry for low surface brightness galaxies (Figure 3). Conselice et al. (2003) find a similar increase in scatter of colors of fainter galaxies in the Perseus cluster; they interpret this result as evidence that faint galaxies have more complex star formation histories than bright galaxies. To avoid the larger photometric uncertainties in these faint galaxies, we show the radial trends in Figure 7 only for galaxies with so that these can be compared directly with A2199.

Many of the trends apparent in Figure 5 for A2199 are also apparent for Virgo. Membership fractions decline with radius for all populations, and for very red galaxies. Virgo members are dominated by red-sequence galaxies, and the blue fraction increases (weakly) with radius. Again, the membership fractions of blue galaxies and red sequence galaxies are quite similar at large projected radii.
3.2.2 The Luminosity Function of Virgo
Figure 8 shows the luminosity function of the Virgo cluster within 1 Mpc of M87. The bright end of the LF is poorly constrained due to the difficulty of bright galaxy photometry in SDSS (Adelman-McCarthy et al., 2007). Open squares show the “minimal” luminosity function including only spectroscopically confirmed background galaxies. Figure 7 shows the membership fraction as a function of apparent magnitude. Note that decreases from unity at bright magnitudes to 0.03 at . Therefore, any attempt to measure the cluster LF at such faint magnitudes using statistical background subtraction requires a determination of the background population to per cent level accuracy and uniformity.

The number of background galaxies exceeds the number of Virgo galaxies at (first suggested by Shapley & Ames, 1929, and confirmed here), or , close to the absolute magnitude where the cluster LF from the stacked SDSS analysis indicates an upturn in the cluster LF (Popesso et al., 2005, 2006). There is a pronounced dip in the Virgo LF at . Because galaxies at these magnitudes may have inaccurate photometry from the SDSS pipeline (Adelman-McCarthy et al., 2007), we caution that this dip may be an artifact of the pipeline photometry.
The Virgo cluster LF is fit by a faint-end slope of (statistical). We hold fixed at the value in the field (Blanton et al., 2003) due to the problem with bright galaxy photometry in SDSS (Adelman-McCarthy et al., 2007). The faint-end slope increases by less than () if we fit to the “minimal” luminosity function.
For comparison, we show the composite cluster LF from Popesso et al. (2006), which has a steep upturn at faint magnitudes. We find no such upturn in the Virgo cluster. Figure 8 also shows the field LF determined from SDSS data (Blanton et al., 2005). This field LF is slightly steeper than the Virgo LF, although the Virgo LF is consistent with the faint-end slope of found for the raw counts in Blanton et al. (2005, i.e., with no correction for missing LSB galaxies). The faint-end slope we measure for Virgo is significantly steeper than that in A2199. Because of the different ranges of absolute magnitude sampled, it would be premature to conclude that there is true variation in the faint-end slope among clusters.
One remarkable aspect of our new determination of the Virgo LF is that it lies very close to the one determined by Sandage et al. (1985), who found a faint-end slope of from the raw counts and after correcting for incompleteness at the surface brightness limit of the survey. Another interesting feature of our determination of the Virgo LF is that it requires assumptions about the membership of low surface brightness galaxies. Sandage et al. (1985) assumed a relation between absolute magnitude and surface brightness (based on galaxies in the RSA catalog) to conclude that only low surface brightness galaxies are Virgo members. The extensive SDSS spectroscopy demonstrates that the vast majority of high surface brightness galaxies are indeed in the background, but the low surface brightnesses of the presumed Virgo members prevents them from having well-measured redshifts even with SDSS spectroscopy.
4. Discussion
We separate our discussion of the cluster luminosity function into two parts. First, we discuss possible systematic effects in the detection and photometry of galaxies that may affect the LF. Second, we discuss the astrophysical implications of the cluster LF.
4.1. Systematic Effects in Determining the Cluster LF
4.1.1 Treatment of Red Galaxies
Figure 1 shows that there are essentially no cluster galaxies significantly redward of the red sequence. At least some of the apparent discrepancy between the LF in A2199 and claims of steeper slopes can be explained by the treatment of red galaxies, in particular those redward of the red sequence. Some studies contain no color information (Sandage et al., 1985; Phillipps et al., 1998). They are thus unable to identify background galaxies by using the red sequence.
Jenkins et al. (2007) use SDSS colors to select candidate members in Coma from an IRAC object catalog using a generous color cut of 2, despite the fact that there are no spectroscopically confirmed members redward of =1.0 (their Figure 11). They then use the optical spectroscopy of Mobasher et al. (2003) to determine the fraction of galaxies that are Coma members in each IRAC Ch1 magnitude bin. If the spectroscopic target selection were independent of color, this procedure would yield an accurate estimate of the membership fraction in each IRAC bin. However, the spectroscopic targets are strongly biased to lie blueward of the large population of faint red galaxies (their Figure 14). Thus, this membership fraction is biased high and the resulting LF is probably artificially steep.
A caveat to the conclusion that nearly all “very red” galaxies are background galaxies is the larger scatter in the color-magnitude diagram at faint magnitudes (; Conselice et al., 2003). This increased scatter may cause very faint cluster members to be scattered redward of the red sequence.
4.1.2 Constraints on the LF From Gravitational Lensing
The deep gravitational potentials of clusters produce gravitational lensing of background galaxies. Lensing distortions are usually measured from systematic distortions in the shapes of faint galaxies which lie behind the cluster. A fascinating application of gravitational lensing to the LF problem was implemented by Medezinski et al. (2007). Using deep HST/ACS photometry of A1689, they showed that the weak lensing signal depends on the location of faint galaxies relative to the cluster’s red sequence. The shear signal is stronger for galaxies redward of the red sequence than it is for galaxies on the red sequence. The diminution of the shear signal for galaxies on the red sequence is directly correlated with the fraction of galaxies that are cluster members and therefore unlensed. The amplitude of the diminution in a given magnitude bin is then a measurement of the membership fraction in that bin. The LF estimated with this procedure has a significantly shallower slope () than many estimates based on background subtraction.
4.1.3 Photometry Around Bright Galaxies
As part of a weak lensing analysis of systems in SDSS, Mandelbaum et al. (2005) found that SDSS catalogs contain a deficit of objects near bright galaxies. They conclude that this deficit is produced by overestimation of the sky background because of the stellar haloes of the bright galaxies. Because bright galaxies are significantly more common in fields containing galaxy clusters than in offset fields, there should be fewer objects in cluster fields. This deficit could lead to an apparent deficit of faint galaxies in cluster fields and hence potentially mask a steep LF.
We noticed a related effect which may counteract this deficit during the visual inspection of Virgo cluster galaxies. Many large galaxies, especially those with low surface brightnesses, have small pieces detected as separate objects. These detections have little effect on the photometry of the “parent” galaxies because they are usually 3 mag fainter than the parent galaxy. However, these pieces are included in the SDSS Galaxy tables. If these pieces of galaxies are not removed, they could produce an artificial excess of faint galaxies in cluster fields.
4.1.4 Determining Membership from Photometry and Morphology
The VCC assigned membership via the photometric and morphological properties of galaxies. It is quite striking that our Virgo LF reproduces their results even after the extensive spectroscopy of SDSS. We saw in (Figure 3) that Virgo galaxies are cleanly separated from background galaxies in the distribution of apparent magnitude versus central surface brightness. The relatively tight relation between absolute magnitude and surface brightness assumed by Sandage et al. (1985) enabled them to efficiently select Virgo members and determine the Virgo LF accurately. The SDSS spectroscopy confirms that most of the galaxies omitted from the VCC due to photometric properties are indeed background galaxies. At faint magnitudes, the SDSS spectroscopy is not sufficient to confirm the Virgo membership of many of the “Possible” members from the VCC (due to their low surface brightness).
The study of the NGC 5846 group by Mahdavi et al. (2005) uses a similar approach to the one used here: using spectroscopy of a subsample to estimate the fraction of galaxies identified as probable members by their photometric properties. They find that all galaxies they classify as “probable” members are in fact members, while about half of the “possible” members are true members.
4.1.5 Low Surface Brightness Galaxies
One longstanding problem in determining the LF is the low surface brightness of dwarf galaxies (e.g., Impey et al., 1988). Indeed, some investigators have used the correlation between magnitude and surface brightness as a way of identifying likely cluster members (Conselice et al., 2002; Mieske et al., 2007). However, low surface brightness galaxies can be difficult to detect, especially in shallow photometric surveys such as SDSS (see discussion in Blanton et al., 2005) and they are challenging objects for accurate spectroscopy.
We show the distribution of surface brightness as a function of apparent magnitude for A2199 in Figure 9. At the faintest magnitudes probed (), there are several galaxies excluded from spectroscopic targeting due to their low surface brightnesses, fiber magnitudes . These low surface brightness galaxies lie on both the red sequence and on the locus of surface brightness and apparent magnitude traced by cluster members (Figure 9). It therefore seems likely that many of these low surface brightness galaxies are members of A2199. Including these galaxies steepens the LF slightly, and this systematic uncertainty is large enough that the LF could be consistent with the LF of Popesso et al. (2006). Our analysis in suggests that the faint end of the A2199 LF is likely intermediate between the slope of found for our spectroscopic sample and for field galaxies (Blanton et al., 2005). It is quite possible that the difference in the measured values of for A2199 and Virgo is created by missing dwarf galaxies in A2199, either from the SDSS photometric pipeline or our spectroscopic cutoff of .

It is curious to note that the distinction between A2199 members and background galaxies (Figure 9) is not nearly as clean as in Virgo (Figure 3). This difference probably indicates that there is lower contrast between A2199 and “near-background” galaxies (those within ) than in the Virgo cluster.
In the Virgo cluster, there have been many searches for low surface brightness galaxies missing from the VCC (e.g., Impey et al., 1988; Trentham & Tully, 2002; Sabatini et al., 2003), including studies with deep CCD imaging using the Subaru 8-m telescope. Because these studies have failed to reveal a much larger population of low surface brightness galaxies, Trentham & Hodgkin (2002) conclude: “the major concern is now that the sample may be missing a sample of high surface brightness galaxies that we have culled from the sample because we think that they are background galaxies.” With the extensive spectroscopy available in SDSS DR6, the lingering concern over high surface brightness galaxies can be laid to rest.
Unlike A2199, the difference between the Virgo LF and that of Popesso et al. (2006) cannot be explained by missing LSB galaxies. The difference between the two LFs becomes significant at and is greater than a factor of 2 at . At these bright magnitudes, the incompleteness due to surface brightness is not significant (Figure 4). Also, galaxies in Virgo missed by SDSS due to surface brightness would be missed by SDSS in the number counts used by Popesso et al. (2006).
Our efforts to identify additional LSB galaxies in Virgo (see Appendix) turned up a number of new galaxies, although these additional galaxies have little effect on the LF. The LF from the Virgo catalog prior to these additions (essentially the spectroscopic catalog with the addition of bright galaxies and LSB spectroscopic targets with failed or no spectra) has a best-fit faint end slope of , or less than 1 different from our final estimate. The issue of low surface brightness galaxies remains a serious systematic uncertainty fainter than (beyond the limit of the measurements presented here). A systematic search for LSB galaxies in the SDSS imaging but below the detection threshold of the photometric pipeline would be very instructive, but such a search lies beyond the scope of this work.
4.2. Implications of the Cluster LF
An accurate determination of the LF in different environments is a powerful constraint on models of galaxy formation and evolution. When previous work indicated a relative excess of dwarf galaxies in clusters, attempts were made to explain this environmental dependence due to the varying effects of reionization in different environments (Tully et al., 2002; Benson et al., 2003).
4.2.1 Radial Dependence of the LF
One aspect of recent claims about the faint-end slope of the LF in clusters is difficult to explain with the effects described in . Several studies have claimed that the faint-end slope is steeper at large clustrocentric radii and shallower in the cluster core (; e.g., Popesso et al., 2006; Barkhouse et al., 2007). The potential excess from pieces of galaxies described in would naturally produce a faint-end slope which increased continuously towards cluster centers: the density of bright galaxies generally increases towards cluster centers. The number of galaxy pieces should do the same. The shallower faint-end slope in cluster centers suggested by Popesso et al. (2006) and Barkhouse et al. (2007) is therefore difficult to explain with this potential systematic bias.
Some recent studies claim that LF fits also yield brighter at larger clustrocentric radii. The direction of the changes in both parameters is along the well-known degeneracy between and in Schechter function fits. There is, however, an important systematic effect in these studies that is often ignored. The BCGs are usually explicitly excluded from the LF fits. Because BCGs tend to lie near cluster centers, this procedure acts to produce an apparent brightening of with radius.
Figure 10 shows the LF as a function of radius in Virgo and A2199. We again show the LFs of Popesso et al. (2006); Blanton et al. (2005); Trentham & Tully (2002) for comparison (with arbitrary normalization). The LF does not have a strong dependence on clustrocentric radius, counter to claims by Popesso et al. (2006) and (Barkhouse et al., 2007).
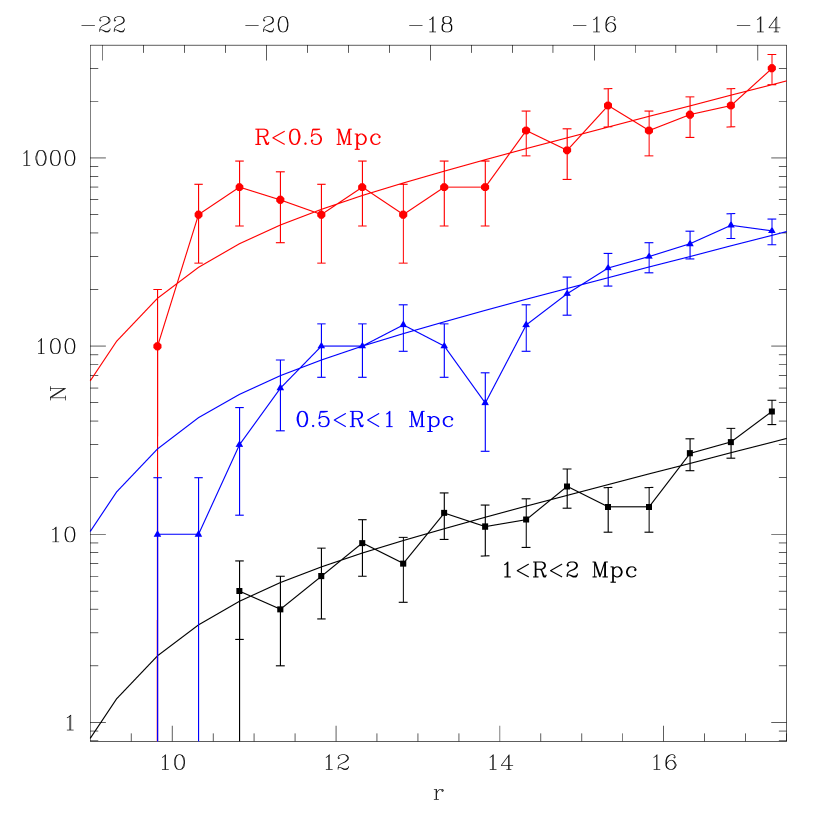
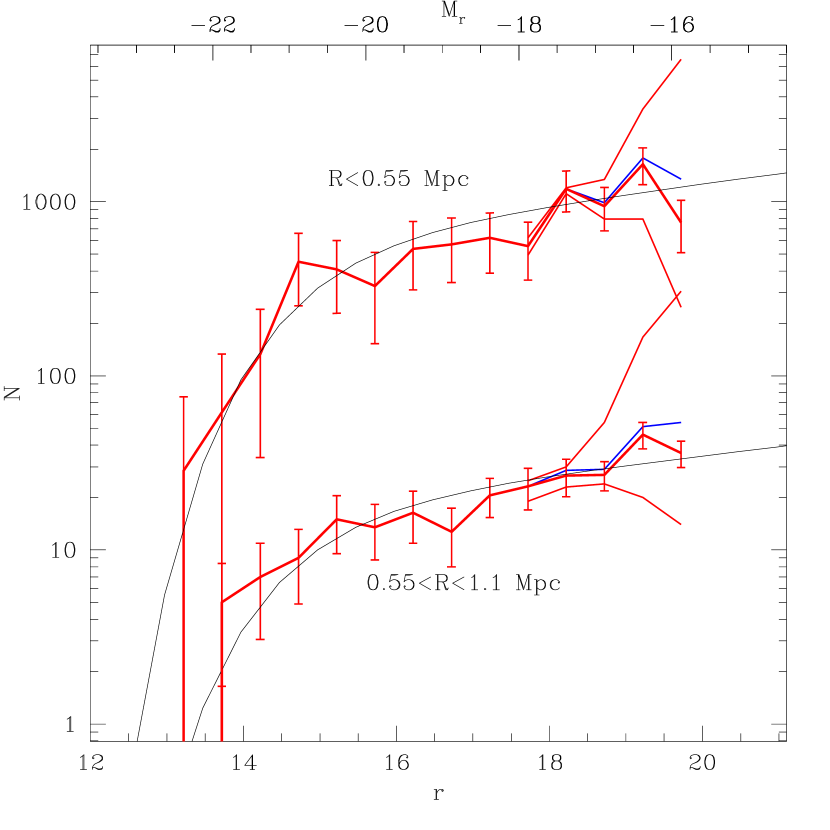
There is some evidence that is brighter at smaller radii in Virgo, but A2199 shows the opposite trend. The trend of brighter at smaller radii (and hence denser environments) is expected due to the tendency of very luminous galaxies to inhabit the densest environments (e.g., Hogg et al., 2003; Zehavi et al., 2005). Note that the dip in the Virgo LF at appears to be confined to the annulus 0.51.0 Mpc. A more detailed treatment of the photometry of all Virgo members would be required to test the significance of this dip.
4.2.2 Total Cluster Luminosity: Intracluster Light and the LF
One motivation for determining the LF in clusters is to assess the total amount of starlight in a given cluster. Recent studies of intracluster light in nearby clusters have shown that it contributes a significant fraction of the total cluster light (e.g., Gerhard et al., 2007).
If we adopt the faint-end slope from Virgo, the contribution to total galaxy light from galaxies fainter than () is 27.43.0% (14.62.5%). Thus, the uncertainty in the total cluster starlight due to faint galaxies is significantly smaller than the uncertainty due to intracluster light, which may contribute 5-50% of the total stars in a cluster (e.g., Mihos et al., 2005; Krick & Bernstein, 2007; Gonzalez et al., 2007).
Future studies of intracluster light which extend to very low surface brightness will be very useful for quantifying the number and luminosity of LSB galaxies missed in existing surveys. Similarly, future surveys of intracluster planetary nebulae and other tracers should provide upper limits on the fraction of galaxian light in clusters contributed by LSB galaxies below the detection limits of galaxy surveys.
5. Conclusions
Determining the faint end of the luminosity function in clusters has remained an unresolved problem for many years. We report a new estimate of the luminosity function in A2199 from MMT/Hectospec spectroscopy, and of the Virgo cluster from SDSS DR6 data. Both LFs extends to fainter absolute magnitudes than most previous determinations of the LF in massive clusters. The LF closely follows a Schechter function to in A2199 and to in Virgo. There are no large populations of high surface brightness galaxies or galaxies redder than the red sequence that contribute significantly to the LF in either cluster.
In A2199, we find that essentially no galaxies redward of the photometric red sequence are cluster members. However, the red sequence itself contains a significant number of background galaxies.
We find no evidence of an upturn in the A2199 LF at faint magnitudes as claimed by some recent studies (Popesso et al., 2006; Jenkins et al., 2007; Milne et al., 2007; Adami et al., 2007; Yamanoi et al., 2007; Barkhouse et al., 2007), although the range of absolute magnitudes precludes a conclusive result. A simple extrapolation of the A2199 LF using the membership fractions at the spectroscopic limit provides an approximate upper limit of the LF at fainter magnitudes; this extrapolation suggests that the faint end slope is probably comparable to that of Virgo.
In the Virgo cluster, we find an LF consistent with a moderate faint-end slope (). The Virgo LF extends much fainter than the A2199 LF, and we conclusively demonstrate that the Virgo LF is inconsistent with the steeper LFs found by Popesso et al. (2006).
The discrepancy between the LFs may be due to systematic uncertainties in statistical background subtraction, and we discuss some possibilities. Other estimates of the LF using deep spectroscopy find slopes similar to ours (Mobasher et al., 2003; Christlein & Zabludoff, 2003; Mahdavi et al., 2005). Recent estimates of the LF in Fornax using surface brightness as a membership classification (Hilker et al., 2003) or surface brightness fluctuations to estimate distances (Mieske et al., 2007) indicate a shallow LF similar to the Virgo SDSS LF. Similarly, a clever application of gravitational lensing in A1689 by Medezinski et al. (2007) suggests a LF consistent with those we find in Virgo and A2199.
Low surface brightness galaxies remain problematic for determining cluster LFs. Their low surface brightnesses prohibit reliable redshift estimates using SDSS DR6 spectroscopy. Perhaps the most significant impact of the SDSS spectra is to demonstrate conclusively that higher surface brightness galaxies are virtually all in the background of Virgo. A simple division in apparent magnitude versus surface brightness is a surprisingly powerful membership classification (Figure 3, ). Careful inspection of SDSS galaxies failing the spectroscopic target selection criteria reveals many low surface brightness galaxies that are likely Virgo members. It is somewhat ironic that almost all galaxies within 1 Mpc of M87 without well-measured redshifts are the LSB galaxies most likely to be Virgo members. We list these galaxies in the Appendix as an aid for future efforts to obtain spectroscopy of these galaxies.
The spectroscopically determined LFs we find for the A2199 and Virgo clusters are similar to the field LF, an important result for models of galaxy formation. Future studies of the LF in more clusters and at larger clustrocentric radii will constrain cluster-to-cluster variations in the LF and any radial dependence. The fraction of galaxies belonging to a cluster decreases dramatically with both increasing magnitude and increasing projected radius. Even at the relatively small radii we probe here, we show that statistical background subtraction is problematic due to the high precision required. We therefore recommend that future investigations of the LF in clusters avoid statistical background subtraction and instead identify member galaxies via spectroscopy or photometric information such as colors or surface brightness fluctuations.
Appendix A Construction of the SDSS Virgo Cluster Catalog
Here we describe our methods for analyzing the SDSS DR6 data and identifying spectrocopically confirmed members of the Virgo cluster as well as several additional galaxies that are probable members. We begin our analysis with a sample drawn from the “Galaxy” view of SDSS DR6 from the CAS server.222http://casjobs.sdss.org/CasJobs/ This database contains basic photometric and spectroscopic parameters for galaxies in the SDSS spectroscopic survey. We address the issue of galaxies without spectra below.
One disadvantage of the proximity of Virgo is that the largest galaxies in Virgo are often “shredded” by the SDSS pipeline processing, a problem discussed in detail in the context of measuring the field LF Blanton et al. (2005). To assess the importance of this “shredding” we visually inspect images of all 408 galaxies classified as Virgo members according to the cut: , from M87 and spectral class equal to “Galaxy”. We edit the photometric catalog as follows: if a SDSS galaxy is identified as being a part of a larger galaxy, we eliminate the “galaxy part” from the catalog. We find 52 “galaxy parts” in the catalog. If the larger galaxy is not included in the catalog, we add it manually. If no photometric object within the photometric outline of the target galaxy is less than 3 mag (using model magnitudes) fainter than the primary galaxy, we classify the galaxy photometry as “clean”. We classify galaxies as “clean” if the secondary component is clearly a separate object, i.e., an unrelated star or galaxy. We also search around the member galaxies for unresolved galaxies. There are very few of these, indicating that the standard SDSS pipeline is more likely to split a galaxy into multiple pieces than to merge multiple galaxies into one detection. These photometric splits very rarely have a large effect on the estimated magnitude of the galaxy. We explore the effects of adding back the flux from secondary components versus ignoring the additional flux and find that the effect on the LF is minimal.
We also visually inspect the 888 objects with spectra not classified as “Galaxy” but satisfying the velocity criterion (thus including all Milky Way stars) to find any misclassified galaxies. Several galaxies have their spectra classified as “Star”. Many of these galaxy spectra have prominent Balmer features and very low redshifts consistent with Galactic objects. Several galaxies with poor spectra are classified as “Unknown”. Many of these galaxies have low surface brightness, and most of them are members of the Virgo Cluster Catalog (VCC, Binggeli et al., 1985). Although the redshifts for many of these low surface brightness galaxies are unreliable, they are likely to be members of the Virgo cluster. We compare SDSS to the VCC below.
Similarly, we visually inspect all objects with spectra classified as “Galaxy” outside the redshift cuts if they have low-confidence redshifts (zConf0.9). We again find many LSB galaxies with low signal-to-noise spectra and incorrect redshifts. Because most of these galaxies are likely Virgo members, we include these in the catalog of Virgo members.
We match targets selected from the SDSS DR6 photometric “Galaxy” table to those with spectroscopy. There are many more photometric objects than spectroscopic objects brighter than , the limit of the spectroscopic survey for Main Sample galaxies. We inspected several hundred of these objects with the Image List tool and confirm that they are nearly all misclassified stars or pieces of stars (e.g., diffraction spikes or double stars). The remaining objects are mostly Main Sample target galaxies without spectra or pieces of larger galaxies such as HII regions. There are only a handful of galaxies that have been missed, usually due to problems with the photometry (e.g., poor deblending of nearby stars or galaxies). In particular, we do not find a large number of low surface brightness galaxies that could have been excluded from the Main Sample target selection. We conclude that the Main Galaxy target sample is an essentially complete sample of galaxies from the SDSS database.
We use Petrosian magnitudes for Virgo galaxies; we use composite model magnitudes for A2199 galaxies. We take this approach because of the difference in the range of apparent magnitude covered by the faint galaxies in the two clusters. The SDSS web site recommends using Petrosian magnitudes for relatively bright galaxies like those in the SDSS spectroscopic survey. The site recommends using composite model magnitudes for fainter galaxies because the estimates of the Petrosian radius are less robust at fainter magnitudes. This difference means that the stated absolute magnitude limits for these two clusters might not be directly comparable. Our primary goal here is to measure the faint end slope of the LF. The magnitude definition should have only a small effect on this measurement (except for an issue with low surface brightness galaxies discussed below).
We use NED to search for literature redshifts for all SDSS objects that were targeted for spectroscopy but not selected by the tiling algorithm (e.g., due to fiber collisions). We find 20 galaxies with redshifts that place them in Virgo. Inspired by the ability of a simple surface brightness cut to select probable Virgo members (), we inspect all SDSS objects that were targeted for spectroscopy but not selected by the tiling algorithm (e.g., due to fiber collisions). We find 39 LSB galaxies that are probable Virgo members and add these to the catalog. We classify 37 of the targets satisfying the surface brightness cut as probable members. We classify only 2 of the higher surface brightness galaxies as probable members despite their significantly greater numbers.
Finally, we note that careful studies of the surface brightness profiles of bright galaxies in SDSS show that the Petrosian magnitudes systematically underestimate galaxy flux (see discussion in Adelman-McCarthy et al., 2007). This effect is likely caused by the pipeline overestimating the sky background in the vicinity of large galaxies. This underestimate decreases with increasing magnitude, but it can still produce a 10% underestimate of flux at =16. Unfortunately, no simple fix is effective. Therefore, the constraints on the LF at the bright end are probably not robust. Because the brightest galaxies in A2199 lie at , this issue affects both Virgo and A2199.
A.1. Comparison to Previous Virgo Catalogs
Another way of determining the incompleteness of low surface brightness galaxies in SDSS is to match the DR6 data with previous catalogs of Virgo. The largest of these is the Virgo Cluster Catalog based on B band photographic plates (Binggeli et al., 1985), but we find that the positional uncertainties of the VCC are too large to make robust matches with SDSS galaxies. Various updates to VCC positions have been incorporated into NED. We use the NED positions for matching galaxies. We analyze the SDSS data for 155 VCC objects within 1 Mpc of M87 that do not have SDSS spectroscopic matches within 10′′. Several of these objects show no obvious counterpart in the SDSS imaging, and have no other references in NED other than the VCC, suggesting that these are possible plate flaws in the VCC. Several more have likely matches with SDSS galaxies within 1′.
The more recent Virgo Photometry Catalog (Young & Currie, 1998) has better positional accuracy and magnitudes measured in U, Bj, and RC bands, although it covers a much smaller area than the VCC. The area of the VPC is well matched to the DR6 footprint, and we find that only 26 VPC objects do not have DR6 photometric counterparts within a match radius of 10′′. These 26 objects mostly result from inaccurate positions in VPC. Three are small galaxies in VPC which are not deblended from larger galaxies by the DR6 pipeline (two near M84, one near M86), two are stars, and two are galaxies not detected in DR6, one likely due to a nearby asteroid trail.
Some recent studies have focused specifically on detecting low surface brightness galaxies in Virgo (Trentham & Hodgkin, 2002; Trentham & Tully, 2002; Sabatini et al., 2003, 2005; Gavazzi, 2005). We explore the properties of low surface brightness galaxies in SDSS by examining relatively bright LSB galaxies () studied by Sabatini et al. (2005). The magnitude cut is approximately the limit for which (generally very blue) LSB galaxies would lie below the SDSS spectroscopic limit. All of the LSB galaxies are detected by the standard SDSS pipeline, but they are subject to the “shredding” problem found for large galaxies. The model magnitudes appear to be more robust to this problem than the Petrosian magnitudes: the model magnitudes for many galaxies are significantly brighter. This result motivates us to search for LSB galaxies by selecting galaxies with and that would not have been selected as spectroscopic targets. These searches yield 53 additional probable Virgo members.
We conclude that the current SDSS photometric pipeline is insufficient to select all low surface brightness galaxies in Virgo as spectroscopic targets, but the pipeline usually detects these galaxies (see also Blanton et al., 2005). Comparison to published photometry of LSB galaxies in Virgo from deeper CCD imaging (Trentham & Hodgkin, 2002; Trentham & Tully, 2002; Sabatini et al., 2003, 2005; Gavazzi, 2005) indicates that the SDSS pipeline magnitudes are usually within 0.3 mag of the magnitudes from the deeper data. The SDSS magnitudes may not be adequate for measuring precise luminosities of individual LSB galaxies, but they should be correct statistically for estimating the LF. Thus, although the SDSS spectroscopic targets alone do not provide a complete sample of candidate Virgo cluster members, careful treatment of the SDSS spectroscopic and photometric catalogs enables us to recover a sample of candidate Virgo members that is substantially more complete and probably not severely biased against low surface brightness galaxies.
A.2. The SDSS Virgo Cluster Catalog
Table 2 lists basic photometric and spectroscopic information for spectroscopically confirmed Virgo cluster members. The table includes coordinates (Columns 1 and 2), magnitude corrected for Galactic extinction (Column 3), color (Column 4), -band central surface brightness (Column 5), redshift (Column 6), projected distance from M87 in degrees (Column 7) and Mpc (Column 8), and flags indicating galaxies with problematic photometry or spectroscopy (Column 9). Table 3 lists the photometric properties of probable Virgo members lacking reliable redshifts. The columns in Table 3 are the same as Table 2 except there is no column for redshifts.
References
- Abraham et al. (1996) Abraham, R. G. et al. 1996, ApJ, 471, 694
- Adami et al. (2007) Adami, C., Durret, F., Mazure, A., Pelló, R., Picat, J. P., West, M., & Meneux, B. 2007, A&A, 462, 411
- Adelman-McCarthy et al. (2007) Adelman-McCarthy, J. K. et al. 2007, ArXiv e-prints, 707
- Andreon (2007) Andreon, S. 2007, ArXiv e-prints, 710
- Andreon & Cuillandre (2002) Andreon, S. & Cuillandre, J.-C. 2002, ApJ, 569, 144
- Balogh et al. (2004) Balogh, M. et al. 2004, MNRAS, 348, 1355
- Barkhouse et al. (2007) Barkhouse, W. A., Yee, H. K. C., & López-Cruz, O. 2007, ArXiv e-prints, 709
- Barnes & Hernquist (1992) Barnes, J. E. & Hernquist, L. 1992, Nature, 360, 715
- Bekki et al. (2001) Bekki, K., Couch, W. J., & Drinkwater, M. J. 2001, ApJ, 552, L105
- Benson et al. (2003) Benson, A. J., Frenk, C. S., Baugh, C. M., Cole, S., & Lacey, C. G. 2003, MNRAS, 343, 679
- Binggeli et al. (1985) Binggeli, B., Sandage, A., & Tammann, G. A. 1985, AJ, 90, 1681
- Binggeli et al. (1988) —. 1988, ARA&A, 26, 509
- Blanton et al. (2005) Blanton, M. R., Lupton, R. H., Schlegel, D. J., Strauss, M. A., Brinkmann, J., Fukugita, M., & Loveday, J. 2005, ApJ, 631, 208
- Blanton et al. (2003) Blanton, M. R. et al. 2003, ApJ, 592, 819
- Bohringer et al. (1994) Bohringer, H., Briel, U. G., Schwarz, R. A., Voges, W., Hartner, G., & Trumper, J. 1994, Nature, 368, 828
- Brown et al. (2001) Brown, W. R., Geller, M. J., Fabricant, D. G., & Kurtz, M. J. 2001, AJ, 122, 714
- Chilingarian & Mamon (2007) Chilingarian, I. V. & Mamon, G. A. 2007, ArXiv e-prints, 712
- Christlein & Zabludoff (2003) Christlein, D. & Zabludoff, A. I. 2003, ApJ, 591, 764
- Conselice et al. (2002) Conselice, C. J., Gallagher, J. S., & Wyse, R. F. G. 2002, AJ, 123, 2246
- Conselice et al. (2003) Conselice, C. J., Gallagher, III, J. S., & Wyse, R. F. G. 2003, AJ, 125, 66
- de Propris et al. (1995) de Propris, R., Pritchet, C. J., Harris, W. E., & McClure, R. D. 1995, ApJ, 450, 534
- Drinkwater et al. (1999) Drinkwater, M. J., Phillipps, S., Gregg, M. D., Parker, Q. A., Smith, R. M., Davies, J. I., Jones, J. B., & Sadler, E. M. 1999, ApJ, 511, L97
- Driver et al. (1994) Driver, S. P., Phillipps, S., Davies, J. I., Morgan, I., & Disney, M. J. 1994, MNRAS, 268, 393
- Fabricant et al. (2005) Fabricant, D. et al. 2005, PASP, 117, 1411
- Ftaclas et al. (1984) Ftaclas, C., Struble, M. F., & Fanelli, M. N. 1984, ApJ, 282, 19
- Gavazzi (2005) Gavazzi, R. 2005, A&A, 443, 793
- Gerhard et al. (2007) Gerhard, O., Arnaboldi, M., Freeman, K. C., Okamura, S., Kashikawa, N., & Yasuda, N. 2007, A&A, 468, 815
- Gonzalez et al. (2007) Gonzalez, A. H., Zaritsky, D., & Zabludoff, A. I. 2007, ApJ, 666, 147
- Haşegan et al. (2005) Haşegan, M. et al. 2005, ApJ, 627, 203
- Hilker et al. (1999) Hilker, M., Infante, L., Vieira, G., Kissler-Patig, M., & Richtler, T. 1999, A&AS, 134, 75
- Hilker et al. (2003) Hilker, M., Mieske, S., & Infante, L. 2003, A&A, 397, L9
- Hogg et al. (2003) Hogg, D. W. et al. 2003, ApJ, 585, L5
- Impey et al. (1988) Impey, C., Bothun, G., & Malin, D. 1988, ApJ, 330, 634
- Jenkins et al. (2007) Jenkins, L. P., Hornschemeier, A. E., Mobasher, B., Alexander, D. M., & Bauer, F. E. 2007, ApJ, 666, 846
- Jones et al. (2006) Jones, J. B. et al. 2006, AJ, 131, 312
- Kelson et al. (2002) Kelson, D. D., Zabludoff, A. I., Williams, K. A., Trager, S. C., Mulchaey, J. S., & Bolte, M. 2002, ApJ, 576, 720
- Krick & Bernstein (2007) Krick, J. E. & Bernstein, R. A. 2007, ArXiv e-prints, 704
- Kurtz et al. (2007) Kurtz, M. J., Geller, M. J., Fabricant, D. G., Wyatt, W. F., & Dell’Antonio, I. P. 2007, AJ, 134, 1360
- Kurtz & Mink (1998) Kurtz, M. J. & Mink, D. J. 1998, PASP, 110, 934
- Mahdavi et al. (2005) Mahdavi, A., Trentham, N., & Tully, R. B. 2005, AJ, 130, 1502
- Mandelbaum et al. (2005) Mandelbaum, R. et al. 2005, MNRAS, 361, 1287
- Markevitch et al. (1999) Markevitch, M., Vikhlinin, A., Forman, W. R., & Sarazin, C. L. 1999, ApJ, 527, 545
- McLaughlin (1999) McLaughlin, D. E. 1999, ApJ, 512, L9
- Medezinski et al. (2007) Medezinski, E. et al. 2007, ApJ, 663, 717
- Mei et al. (2007) Mei, S., Blakeslee, J. P., Côté, P., Tonry, J. L., West, M. J., Ferrarese, L., Jordán, A., Peng, E. W., Anthony, A., & Merritt, D. 2007, ApJ, 655, 144
- Mieske et al. (2007) Mieske, S., Hilker, M., Infante, L., & Mendes de Oliveira, C. 2007, ArXiv e-prints, 707
- Mihos et al. (2005) Mihos, J. C., Harding, P., Feldmeier, J., & Morrison, H. 2005, ApJ, 631, L41
- Milne et al. (2007) Milne, M. L., Pritchet, C. J., Poole, G. B., Gwyn, S. D. J., Kavelaars, J. J., Harris, W. E., & Hanes, D. A. 2007, AJ, 133, 177
- Mobasher et al. (2003) Mobasher, B. et al. 2003, ApJ, 587, 605
- Phillipps et al. (1998) Phillipps, S., Parker, Q. A., Schwartzenberg, J. M., & Jones, J. B. 1998, ApJ, 493, L59+
- Popesso et al. (2006) Popesso, P., Biviano, A., Böhringer, H., & Romaniello, M. 2006, A&A, 445, 29
- Popesso et al. (2005) Popesso, P., Böhringer, H., Romaniello, M., & Voges, W. 2005, A&A, 433, 415
- Rines et al. (2004) Rines, K., Geller, M. J., Diaferio, A., Kurtz, M. J., & Jarrett, T. H. 2004, AJ, 128, 1078
- Rines et al. (2002) Rines, K., Geller, M. J., Diaferio, A., Mahdavi, A., Mohr, J. J., & Wegner, G. 2002, AJ, 124, 1266
- Rines et al. (2003) Rines, K., Geller, M. J., Kurtz, M. J., & Diaferio, A. 2003, AJ, 126, 2152
- Rines et al. (2005) —. 2005, AJ, 130, 1482
- Rines & Diaferio (2006) Rines, K. J. & Diaferio, A. 2006, AJ, 132, 1275
- Sabatini et al. (2003) Sabatini, S., Davies, J., Scaramella, R., Smith, R., Baes, M., Linder, S. M., Roberts, S., & Testa, V. 2003, MNRAS, 341, 981
- Sabatini et al. (2005) Sabatini, S., Davies, J., van Driel, W., Baes, M., Roberts, S., Smith, R., Linder, S., & O’Neil, K. 2005, MNRAS, 357, 819
- Sandage et al. (1985) Sandage, A., Binggeli, B., & Tammann, G. A. 1985, AJ, 90, 1759
- Schechter (1976) Schechter, P. 1976, ApJ, 203, 297
- Shapley & Ames (1929) Shapley, H. & Ames, A. 1929, Harvard College Observatory Bulletin, 865, 1
- Stoughton et al. (2002) Stoughton, C. et al. 2002, AJ, 123, 485
- Strauss et al. (2002) Strauss, M. A. et al. 2002, AJ, 124, 1810
- Tanaka et al. (2004) Tanaka, M., Goto, T., Okamura, S., Shimasaku, K., & Brinkman, J. 2004, AJ, 128, 2677
- Tolman (1930) Tolman, R. C. 1930, Proceedings of the National Academy of Science, 16, 511
- Tonry et al. (2001) Tonry, J. L., Dressler, A., Blakeslee, J. P., Ajhar, E. A., Fletcher, A. B., Luppino, G. A., Metzger, M. R., & Moore, C. B. 2001, ApJ, 546, 681
- Trentham & Hodgkin (2002) Trentham, N. & Hodgkin, S. 2002, MNRAS, 333, 423
- Trentham & Tully (2002) Trentham, N. & Tully, R. B. 2002, MNRAS, 335, 712
- Tully et al. (2002) Tully, R. B., Somerville, R. S., Trentham, N., & Verheijen, M. A. W. 2002, ApJ, 569, 573
- Vale & Ostriker (2006) Vale, A. & Ostriker, J. P. 2006, MNRAS, 371, 1173
- Visvanathan & Sandage (1977) Visvanathan, N. & Sandage, A. 1977, ApJ, 216, 214
- Yamanoi et al. (2007) Yamanoi, H. et al. 2007, AJ, 134, 56
- Yang et al. (2007) Yang, X., Mo, H. J., & van den Bosch, F. C. 2007, ApJin press, ArXiv e-prints, 710
- Young & Currie (1998) Young, C. K. & Currie, M. J. 1998, A&AS, 127, 367
- Zehavi et al. (2005) Zehavi, I. et al. 2005, ApJ, 630, 1
| RA | DEC | Flag | ||||||
|---|---|---|---|---|---|---|---|---|
| (J2000) | (J2000) | mag | mag | mag | Degrees | Mpc | ||
| 184.27314 | 12.28983 | 14.35 | 0.55 | 20.39 | 0.001340 | 3.355 | 0.992 | – |
| 184.28865 | 12.45403 | 14.21 | 0.71 | 20.51 | 0.007241 | 3.338 | 0.987 | – |
| 184.33188 | 11.94347 | 14.94 | 0.65 | 20.37 | 0.004756 | 3.328 | 0.984 | – |
| 184.36687 | 12.93234 | 16.64 | 0.22 | 21.18 | 0.006919 | 3.302 | 0.976 | – |
| 184.38049 | 11.95444 | 20.07 | 0.15 | 22.60 | 0.001316 | 3.280 | 0.970 | – |
Note. — Flags: (1) indicates problematic centroiding, often caused by blends, (2) Galaxy light is “shredded” into multiple components, (3) Redshift taken from NED, (4) Alternate redshift taken from NED.
| RA | DEC | Flag | |||||
|---|---|---|---|---|---|---|---|
| (J2000) | (J2000) | mag | mag | mag | Degrees | Mpc | |
| 184.40237 | 12.25983 | 16.81 | 0.27 | 21.68 | 3.230 | 0.955 | 4 |
| 184.75826 | 13.98245 | 15.06 | 0.68 | 21.61 | 3.281 | 0.970 | 4 |
| 184.87540 | 13.99070 | 16.78 | 0.60 | 23.05 | 3.186 | 0.942 | 5 |
| 184.88830 | 11.01534 | 17.58 | 0.32 | 22.50 | 3.083 | 0.911 | 4 |
| 184.93511 | 12.28262 | 17.28 | 0.57 | 23.48 | 2.709 | 0.801 | 4 |
Note. — Flags: (1) indicates problematic centroiding, often caused by blends, (2) Galaxy light is “shredded” into multiple components, (3) modelMag instead of petroMag, (4) No redshift available; (5) Low confidence SDSS redshift available; (6) Low confidence NED redshift available.