Magnetic-field fluctuations around the radio galaxy 3C 31
Abstract
We present an analysis of the magnetic-field fluctuations in the magnetoionic medium in front of the radio galaxy 3C 31 derived from rotation-measure (RM) fits to high-resolution polarization images. We first show that the Faraday rotation must be due primarily to a foreground medium. We determine the RM structure functions for different parts of the source and infer that the simplest form for the power spectrum is a power law with a high-frequency cutoff. We also present three-dimensional simulations of RM produced by a tangled magnetic field in the hot plasma surrounding 3C 31, and show that the observed RM distribution is consistent with a spherical plasma distribution in which the radio source has produced a cavity.
ESO, Karl-Schwarzschild-Straße 2, 85748 Garching-bei-München, Germany
NRAO, 520 Edgemont Road, Charlottesville, VA 22903-2475, U.S.A.
1. Observed Faraday rotation and depolarization
Our knowledge of the structure and origin of magnetic fields in elliptical galaxies, groups and clusters is still rudimentary, but Faraday rotation of linearly-polarized radio emission can be used to probe the fields in ionized foreground gas. Here, we present an analysis of the magnetic-field fluctuations in the magnetoionic medium in front of the FR I radio galaxy 3C 31 (z = 0.0169) derived from rotation-measure (RM) fits to high-resolution polarization images.
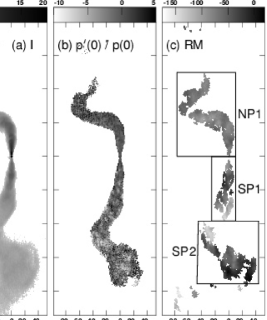
Our analysis is based on VLA observations at 6 frequencies in the range 1.4 – 8.4 GHz with resolutions of 5.5 and 1.5 arcsec FWHM (Figs 1 and 2). We show images of normalized polarization gradient from fits to , where is the degree of polarization at wavelength and a prime denotes differentiation with respect to , together with RM images derived from fits to at 4 – 6 wavelengths, where is the E-vector position angle.
The residual depolarization at 1.5 arcsec resolution is very small and the rotation is accurately proportional to , indicating almost completely resolved foreground rotation. There is a large asymmetry across the nucleus: the lobe with the brighter jet shows a much smaller RM fluctuation amplitude than the counter-jet lobe on all scales, qualitatively as expected from relativistic jet models (Laing 1988).
2. Structure functions and power spectra

We quantify the spatial variation of RM using the structure function , where and are separation vectors in the plane of the sky and denotes an average over . Our data are consistent with isotropy, so we plot as a function of scalar separation for five regions of 3C 31 in Fig. 3. In order to interpret these results, we start from a model RM power spectrum , where is the wave-number. Its Hankel transform is the RM autocorrelation function , and the structure function is . A novel feature of our analysis is that we include the effects of the observing beam explicitly (this can be done straightforwardly provided that the rotation across the beam is small, as is the case for our observations). Our data are consistent with a power spectrum which has the same form everywhere, but varying normalization. We have found two acceptable functional forms for the power spectrum: with a high-frequency cut-off at arcsec-1 (a scale of 12 arcsec or 4 kpc) and a broken power-law form with (as expected for Kolmogorov turbulence) for arcsec-1 and at larger scales. The predicted structure functions are very similar if the effects of the beam are included. This may explain why earlier studies have come to different conclusions regarding the index of the power spectrum on the basis of RM analysis alone (Vogt & Enßlin 2003, 2005; Murgia et al. 2004; Govoni et al. 2006). The cut-off power-law model with predicts significantly less residual depolarization, however, in better agreement with our data for 3C 31.
3. Three-dimensional simulations
The easiest way to explain an asymmetry in RM fluctuation amplitude that is correlated with jet sidedness is to postulate that the rotation arises in a large-scale gas component surrounding the source – most plausibly the group-scale hot component. The asymmetry is then simply due to the differing path lengths through this gas to the approaching (brighter) and receding jets (Laing 1988). In order to model the asymmetry, we simulate the Faraday rotation from an isotropic, random magnetic field with a power spectrum corresponding to that derived from the RM structure-function analysis embedded in ionized gas with a smooth density distribution (cf. Murgia et al. 2004). We first assume a spherically-symmetric density distribution with a core radius of 150 arcsec as fit to rosat data for the 3C 31 group by Komossa & Böhringer (1999). An example RM distribution for a radio source of negligible thickness inclined by 52∘ to the line of sight (Laing & Bridle 2002) is shown in Figs 4(d) – (f). The rms central magnetic field strength for this model is = 0.21 nT (2.1 G). The predicted RM distribution shows an asymmetry, but there is no sharp change at the nucleus and the profile falls too rapidly with distance on the counter-jet side. The most plausible reason for the discrepancy is that the radio lobes have displaced the surrounding gas, which is therefore highly non-spherical. Cavities in the X-ray-emitting gas associated with radio lobes are indeed observed in similar sources such as 3C 449 (Croston et al. 2003). We assume that the contents of the cavity produce negligible Faraday rotation. If we model the cavity as initially conical, with a half-opening angle of 55∘ within 100 arcsec of the nucleus and thereafter cylindrical, we can approximately reproduce the RM distribution (Figs 4g – i). Such a cavity would not have been apparent in the existing X-ray data (Komossa & Böhringer 1999), but should be detectable with XMM-Newton.
Acknowledgments.
The National Radio Astronomy Observatory is a facility of the National Science Foundation operated under cooperative agreement by Associated Universities, Inc.
References
- Croston et al. (2003) Croston, J.H., Hardcastle, M.J., Birkinshaw, M., Worrall, D.M., 2003, MNRAS, 346, 1041
- Dolag, Vogt & Enßlin (2005) Dolag, K., Vogt, C., Enßlin, T.A., 2005, MNRAS, 358, 726
- Govoni et al. (2006) Govoni F., Murgia M., Feretti L., Giovannini G., Dolag K., Taylor G.B., 2006, A&A, 460, 425
- Komossa & Böhringer (1999) Komossa, S., Böhringer, H., 1999, A&A, 344, 755
- Laing (1988) Laing, R.A., 1988, Nature, 331, 149
- Laing & Bridle (2002) Laing, R.A., Bridle, A.H., 2002, MNRAS, 336, 328
- Murgia et al. (2004) Murgia, M., Govoni, F., Feretti, L., Giovannini, G., Dallacasa, D., Fanti, R., Taylor, G.B., Dolag, K., 2004, A&A, 424, 429
- Vogt & Enßlin (2003) Vogt, C., Enßlin, T.A., 2003, A&A, 412, 373
- Vogt & Enßlin (2005) Vogt, C., Enßlin, T.A., 2005, A&A, 434, 67