Broad band X-ray spectroscopy of A0535+262 with
Abstract
The transient X-ray binary pulsar A0535+262 was observed with on 2005 September 14 when the source was in the declining phase of the August-September minor outburst. The 103 s X-ray pulse profile was strongly energy dependent, a double peaked profile at soft X-ray energy band ( 3 keV) and a single peaked smooth profile at hard X-rays. The width of the primary dip is found to be increasing with energy. The broad-band energy spectrum of the pulsar is well described with a Negative and Positive power-law with EXponential (NPEX) continuum model along with a blackbody component for soft excess. A weak iron Kα emission line with an equivalent width 25 eV was detected in the source spectrum. The blackbody component is found to be pulsating over the pulse phase implying the accretion column and/or the inner edge of the accretion disk may be the possible emission site of the soft excess in A0535+262. The higher value of the column density is believed to be the cause of the secondary dip at the soft X-ray energy band. The iron line equivalent width is found to be constant (within errors) over the pulse phase. However, a sinusoidal type of flux variation of iron emission line, in phase with the hard X-ray flux suggests that the inner accretion disk is the possible emission region of the iron fluorescence line.
1 Introduction
Be X-ray binaries consist of a neutron star in an eccentric orbit around a Be star companion. The orbit of the Be X-ray binaries is generally wide and eccentric with orbital periods in the range of 16 days to 400 days (Coe 2000). Mass transfer from the Be companion to the neutron star takes place through the circumstellar disk. When the neutron star passes through the disk or during the periastron passage, it shows strong outbursts with an increase in X-ray luminosity by a factor 100 (Negueruela 1998).
A0535+262 is a 103 s Be/X-ray binary pulsar discovered by during a large outburst in 1975 (Coe et al. 1975). The binary companion HDE 245770 is an O9.7-B0 IIIe star in a relatively wide eccentric orbit ( = 0.47) with orbital period of 111 days and at a distance of 2 kpc (Finger et al. 1996; Steele et al. 1998). The pulsar shows regular outbursts with the orbital periodicity. Occasional giant X-ray outbursts are also observed when the object becomes even brighter than the Crab. The pulsar shows three typical intensity states, such as quiescence with flux level of below 10 mCrab, normal outbursts with flux level in the range 10 mCrab to 1 Crab, and giant outbursts during which the object becomes the brightest X-ray source in the sky with the flux level of several Crab (Kendziorra et al. 1994).
103 s pulsations were detected during past X-ray observations of A0535+262 in quiescence, outburst, and giant outbursts. The pulse profile was single peaked in quiescence (in 1-10 keV range; Mukherjee & Paul 2005, 3-20 keV; Negueruela et al. 2000), double peaked with a clearly asymmetric ”main” and a more symmetric ”secondary” pulse during the X-ray outbursts (Mihara 1995; Kretschmar et al. 1996, Maisack et al. 1997). The X-ray spectrum of the pulsar has been studied at soft and hard X-rays with various instruments at different luminosity levels. The spectrum of the object, during outbursts, shows cyclotron resonant scattering features at higher energies than that of the other pulsars. Two harmonic features at around 50 keV and 100 keV were detected in its 1989 outburst with the HEXE/TTM instrument on Mir/Kvant (Kendziorra et al. 1994). The CGRO/OSSE observations of 1994 outburst of the pulsar showed a significant absorption feature at 110 keV (Grove et al. 1995). These detections did not resolve whether the magnetic field of the pulsar is 5 1012 G (when the fundamental occurs at 55 keV) or 1013 G (for the 110 keV fundamental).
The most recent major X-ray outburst was detected in 2005 May/June with the BAT instrument on Swift when the 15-195 keV count rate was greater than 3 times that of the Crab Nebula (Tueller et al. 2005). Following the detection of the recent outburst, the pulsar was observed by INTEGRAL, RXTE and the recently launched . A cyclotron resonance feature at 45 keV was detected in the Hard X-ray Detector (HXD) spectrum of with estimated magnetic field of the pulsar as 4 1012 Gauss (Terada et al. 2006). The detection of the absorption feature at 45 keV and its first harmonic at 100 keV is reported from the INTEGRAL and RXTE observations of the pulsar during the 2005 August/September outburst (Caballero et al. 2007). Using the same Suzaku observation used for the analysis of the cyclotron resonance feature (Terada et al. 2006), we study the broad-band spectral properties of the pulsar in the present paper.
2 Observation
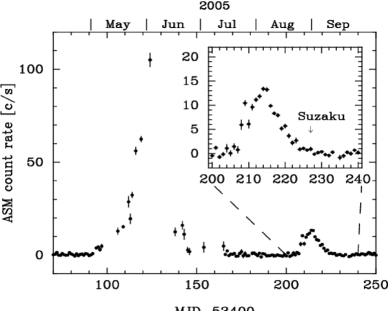
The detection of the recent outburst of A0535+262 on 16 May 2005 with the BAT instrument on Swift prompted many observatories to observe the pulsar during this period. The RXTE/ASM monitoring of the pulsar showed one major outburst of the pulsar which lasted from 2005 May 06 to June 24. During this outburst, the peak luminosity was about 1.4 Crab (103 ASM counts s-1). Approximately after one orbital period of 111 days, the pulsar was again detected with the RXTE/ASM and RXTE/PCA with peak luminosity of about 0.2 Crab (12 ASM counts s-1). During this minor outburst, the pulsar was observed with the RXTE, INTEGRAL, and . The RXTE/ASM one-day averaged light curve of A0535+262 between 2005 April 10 and 2005 October 07 is shown in Figure 1. The arrow mark in the inset figure indicate the observation of the pulsar with . During the declining phase of the minor outburst, A0535+262 was observed with on 2005 September 14 from 13:40 UT to 01:00 UT on the next day (orbital phase range of 0.42-0.43; Finger et al. 1994). This Target of Opportunity (TOO) observation was carried out at “XIS nominal” pointing position for effective exposures of 22.3 ksec with the XIS and 21.7 ksec with the HXD. The XIS was operated with “1/4 window” option which gives a time resolution of 2 sec, covering a field of view of 17′.84′.4.
, the fifth Japanese X-ray astronomy satellite (Mitsuda et al. 2007), was launched on 2005 July 10. It covers 0.2–600 keV energy range with the two sets of instruments, X-ray Imaging Spectrometer (XIS; Koyama et al. 2007) covering the soft X-rays in 0.2-12 keV energy range, and the Hard X-ray Detector (HXD; Takahashi et al. 2007) which covers 10–70 keV with PIN diodes and 30–600 keV with GSO scintillators. There are 4 sets of XIS, each with a 1024 1024 pixel X-ray-sensitive CCD detector at the focus of each of the four X-ray Telescopes (XRT). One of the four CCDs is back illuminated (BI) whereas the other three are front illuminated (FI). The field of view of the XIS is 18’18’ in a full window mode with an effective area of 340 cm2 (FI) and 390 cm2 (BI) at 1.5 keV. The energy resolution was 130 eV (FWHM) at 6 keV just after the launch. The HXD is a non-imaging instrument that is designed to detect high-energy X-rays. The HXD has 16 identical units made up of two types of detectors, silicon PIN diodes ( 70 keV) and GSO crystal scintillator ( 30 keV). The effective areas of PIN and GSO detectors are 145 cm2 at 15 keV and 315 cm2 at 100 keV respectively. For a detailed description of the XIS and HXD detectors, refer to Koyama et al. (2007) and Takahashi et al. (2007).
3 Analysis and Results
The HXD data of the observation of A0535+262 has already been presented by Terada et al. (2006). The same procedure was followed for the HXD/GSO data reduction to obtain the GSO source and background spectra. For HXD/PIN and XIS data reduction, we used the cleaned event data (ver 1.2 products) to obtain the PIN and XIS light curves and source spectra. The simulated background events (bgd-a) were used to estimate the HXD/PIN background (Kokubun et al. 2007) for the A0535+262 observation. The response files, released in March 2006 and August 2006 were used for HXD/GSO, and HXD/PIN spectra, respectively. The accumulated events of the XIS data were discarded when the telemetry was saturated, data rate was low, the satellite was in the South Atlantic Anomaly (SAA), and when the source elevation above the earth’s limb was below 5∘ for night-earth and below 20∘ for day-earth. Applying these conditions, the source spectra were accumulated from the XIS cleaned event data by selecting a circular region of 4′.3 around the image centroid. Because this extraction circle is larger than the optional window, the effective extraction region is the intersection of the window and this circle. The XIS background spectra were accumulated from the same observation by selecting rectangular regions away from the source. The response files and effective area files for XIS were generated by using the ”xissimarfgen” and ”xisrmfgen” task of FTOOLS (V6.2). X-ray light curves of 2 s time resolution were extracted from the XIS and PIN event data. In the ver 1.2 products of Suzaku observations, it is known that the XIS time assignment contains an error of 6 seconds compared to HXD when the ’1/4 window’ option was applied111http://www.astro.isas.jaxa.jp/suzaku/analysis/xis/timing/. The HXD absolute time assignment was verified to be correct better than 360 s with the observation of the Crab pulsar (Terada et al. 2007). Although the time assignment error in XIS was much smaller than the pulse period of A0535+262, we corrected it before the analysis of the XIS data.

3.1 Timing Analysis
Barycentric correction was applied to the light curves of A0535+262 for the measurement of the pulse period. Pulse folding and a maximization method was applied to the light curves yielding the pulse period of the pulsar to be 103.3750.09 s (as reported in Terada et al. 2006). The pulse profiles obtained from the XIS and PIN light curves of the observation of the pulsar are shown in Figure 2. From the figure, it is observed that the shape of the pulse profile in the XIS energy band (0.2 – 12 keV) is different from that in the HXD/PIN energy band (8-70 keV). The dip in the pulse profile in pulse phase range 0.17-0.35, hereafter referred to as a primary dip, is narrow at soft X-rays (XIS energy band) and broad in the hard X-ray energy band. Apart from the variable width of the dip, a dip like structure is present in the soft X-ray pulse profile in 0.65-0.80 pulse phase range which is absent in the hard X-ray profile. To investigate the energy dependence of the pulse profile of A0535+262, we generated light curves in different energy bands from XIS and PIN event data. The light curves are folded with the pulse period and the corresponding pulse profiles are shown in Figure 3. The energy resolved pulse profiles of the pulsar obtained from observation are found to be different from that of the previous observations (Mukherjee & Paul 2005; Negueruela et al. 2000; Kretschmar et al. 1996; Mihara 1995). The dip like structure (in pulse phase range 0.65-0.80) is found to be very prominent below 1 keV. The width and depth of this structure decrease gradually with energy up to 8 keV, beyond which it becomes indistinguishable from the fine structures in the pulse profile. A gradual decrease in the normalized intensity in 0.0-0.17 pulse phase range (as shown in the figure) is found at soft X-ray profiles which finally merged with the primary dip, making the hard X-ray pulse profiles smooth and single peaked. Pulse phase resolved spectroscopy would help in understanding the nature of the dip like structure and the gradual decrease of normalized intensity with energy prior to the primary dip in the pulse profile of A0535+262.
3.2 Spectral Analysis

3.2.1 Pulse phase averaged spectroscopy
We calculated the energy spectrum from the events selected in the energy ranges of 0.3-10.0 keV for the back illuminated CCD (XIS-1), 0.5-10.0 keV for front illuminated CCDs (XIS-0, 2, 3), 10-70 keV for the HXD/PIN and 45-135 keV for the HXD/GSO detectors. After appropriate background subtraction, simultaneous spectral fitting was done using the XIS, PIN and GSO spectra. All the spectral parameters other than the relative normalization, were tied together for all the detectors. We tried to fit the broad-band energy spectra with a model consisting of a blackbody component, a power-law with exponential cutoff, a Gaussian function for the iron fluorescence line at 6.4 keV and the cyclotron resonance factor (CYAB) at 45 keV (as detected by Caballero et al. 2007). The analytical form of CYAB is
| (1) |
where is the resonance energy, is the width of the absorption structure, and is the depth of the resonance.
This model gave a reduced of 1.41 (for 804 dof). The parameters of the cyclotron resonance feature are found to be consistent with that reported in Terada et al. (2006). It is found that the residual structures below 1 keV contribute significantly to the statistics of the spectral fitting. Because the spectral shape in this energy range is determined mainly by the low-energy absorption, detailed modeling of the absorber (in terms of abundance, uniformity, etc.) may be necessary to improve fitting. However, we are interested in the global shape of the energy spectrum, not in the local structures, so we simply ignored the data below 1 keV for the subsequent spectral fitting. Simultaneous spectral fitting to the XIS and HXD spectra in 1.0-135.0 keV with above model improved the fitting result with a reduced of 1.33 (for 733 dof). However, a blackbody temperature of 1.36 keV is unusual in accretion-powered X-ray pulsars. This does not directly mean that the model is unacceptable, but it is worth pursuing another model. We have also tried to fit the continuum spectrum using a power-law with a Fermi-Dirac cutoff, as described by Coburn et al. (2002) along with a blackbody component, Gaussian function, and cyclotron resonance factor. The spectral fitting, however, was very poor with reduced of 2.2 (for 736 dof).
We then tried to fit the broad band spectrum of A0535+262 using the NPEX continuum component along with the cyclotron resonance factor (CYAB) and interstellar absorption. The analytical forms of the NPEX model is
| (2) |
where is the X-ray energy (in keV), and are the normalization and photon index of the negative power-law respectively, and are those of the positive power-law, and is the cutoff energy in units of keV. All five parameters of the NPEX continuum component were kept free. However, as in the case of Terada et al. (2006), we could not constrain the positive power-law index () very well. Terada et al. fixed to 2, but we found that a little larger value of improved the overall fit to the data. The value of found by fixing the value of to 2 and 3 are 1029 and 933 for 730 degrees of freedom respectively. Therefore, we fixed the second index () to 3 in the subsequent analysis. The relative instrument normalizations of the four XISs, PIN and GSO detectors were kept free and the values are found to be 1.0:1.0:0.92:1.0:1.1:1.04 for XIS3:XIS0:XIS1:XIS2:PIN:GSO with a clear agreement with the detector calibration.
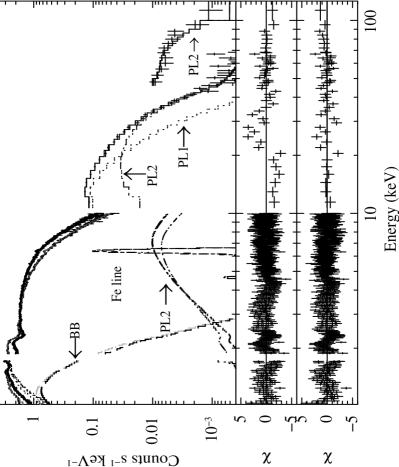
The CYAB parameters were initially set around the value quoted in Terada et al. (2006) and then allowed to find the corresponding best-fit values. The NPEX continuum model showed significant improvement over the Fermi-Dirac cutoff and cutoff power-law models in the spectral fitting with reduced of 1.28 for 730 dof. It was found that the NPEX continuum model fits the Suzaku 1.0-135 keV spectrum better than the cutoff power-law continuum model which was used to described the RXTE and INTEGRAL spectra of the pulsar (Caballero et al. 2007). The spectral parameters of the best-fit model obtained from the simultaneous spectral fitting to the XIS, PIN, and GSO data of the observation of A0535+262 are given in Table 1. The count rate spectra of the observation is shown in Figure 4 along with the model components (top panel) and residuals to the cutoff power-law continuum model (middle panel) and the best-fit NPEX continuum model (bottom panel). We need to note that the iron line width could be an artifact, because no degradation of the energy resolution is included in the response files. In such a case, an artificial line width of 20 eV (1, at 5.9 keV) may be obtained even at the time of A0535+262 observation (Koyama et al. 2007).
| Parameter | Value |
|---|---|
| NH (1022 atoms cm-2) | 1.100.01 |
| (keV) | 0.160.01 |
| Iron line Energy (keV) | 6.390.01 |
| Iron line width (keV) | 0.030.02 |
| Iron line eq. width (eV) | 253 |
| Iron line fluxa | 0.80.1 |
| Power-law index () | 0.840.02 |
| Power-law normalization (N1) | 3.21 10-2 |
| Power-law normalization (N2) | 3.10.2 10-7 |
| Exponential cutoff energy (keV) | 9.120.06 |
| CYAB energy (, in keV) | 44.8 |
| CYAB depth () | 1.6 |
| CYAB width (, keV) | 9.51.2 |
| Blackbody fluxa | 3.40.2 |
| Source fluxb | 9.4 |
| Reduced | 1.28 (730 dof) |
and are the normalizations of negative and positive power-laws respectively with kept fixed at 3
a : in 10-12 ergs cm-2 s-1 unit and estimated in 1.0-10.0 keV energy range.
b : in 10-10 ergs cm-2 s-1 unit and estimated in 1.0-70.0 keV energy range.
3.2.2 Pulse phase resolved spectroscopy
The presence of significant energy dependent dips in the pulse profile of A0535+262 prompted us to make a detailed study of the spectral properties at different pulse phases of the pulsar. To investigate the changes in the spectral parameters at soft X-rays at different pulse phases of the pulsar, we used data from the XIS (both BI and FIs) and HXD/PIN detectors. The XIS and PIN spectra were accumulated into 10 pulse phase bins by applying phase filtering in the FTOOLS task XSELECT. The XIS and PIN background spectra and response matrices used for the phase averaged spectroscopy, were also used for the phase resolved spectroscopy. Simultaneous spectral fitting was done in the 1.0-70.0 keV energy band.

The phase resolved spectra were fitted with the same continuum model used to describe the phase averaged spectrum. Because of the coupling among the parameters, we had to fix some of them to get meaningful constraints to the model parameters. The CYAB model parameters, the blackbody temperature, the iron line energy and line width were kept fixed at the phase averaged values. The positive power law index () was fixed at 3, as in the case of the phase-averaged spectroscopy. The ratio of the negative and positive power-law normalizations (N1/N2) was also fixed at the value obtained from the phase averaged spectroscopy. The relative instrument normalizations were fixed at the values obtained from the phase averaged spectroscopy. The parameters obtained from the simultaneous spectral fitting to the XIS and PIN phase resolved spectra are shown in Figure 5 along with the XIS ( keV) and PIN (8-70 keV) count rates at left top and right top panels. We note that the value of in phase 0.2-0.3 (31021 atoms cm-2) is lower than the galactic hydrogen column density towards the pulsar (5.91021 atoms cm-2). However, because the interstellar medium can be highly non-uniform, we consider that this value is within the acceptable range.
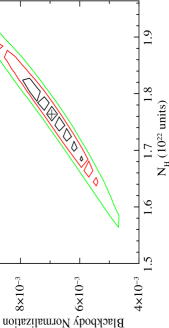
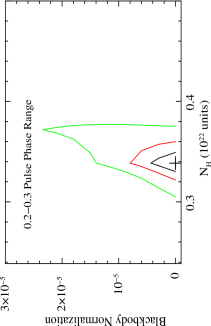
Minimum values for the blackbody flux, absorption column density, and photon index occur at phase 0.2-0.3. Although the minimum looks significant, we should be careful about the correlation among the parameters. In Figure 6, we plot confidence contours between NH and the blackbody normalization (NBB) to check the acceptable ranges of these parameters taking two extreme phases, namely 0.3-0.4 (left panel) and 0.2-0.3 (right panel) pulse phases. For the phase 0.2-0.3, we found that the (99%) upper limits to NH and the blackbody normalization (NBB) are found to be 3.81021 atoms cm-2 and 2.4 10-5, respectively. However, for phase 0.3-0.4, the acceptable ranges of NH and NBB are found to be (1.56-1.94) 1022 atoms cm-2 and (4.5-9.5) 10-3, respectively (for 99% confidence level). The confidence contours for above two phases show that the absorption column density and the blackbody flux are low at pulse phase 0.2-0.3 and high at 0.3-0.4 phase. During the dip-like structure, a hint of decrease in the blackbody flux and higher value of NH can be seen in the figure. This implies that the dip-like structure at soft X-rays in the pulse profile is due to the increase in the absorption column density resulting in the reduction of the apparent blackbody flux. The iron line equivalent width does not show any systematic variation over pulse phases. On the other hand, the modulation is a little larger in the line intensity, whose profile is similar to that of the NPEX flux. To statistically quantify these variations, we estimated the values of by fitting a constant model to the data. The results are 9.2 (for 9 degrees of freedom) for the line intensity and 7.0 (9 degrees of freedom) for the equivalent width, respectively. However, if we exclude the 0.2-0.3 phase bin, the value of the line intensity is reduced to 3.4 (8 degrees of freedom). If we apply the F-test, the reduction corresponds to F=13.3 and probability of 6.5510-3. This means that the line intensity at phase 0.2-0.3 is significantly different from that of the other phases. In the case of equivalent width, is 6.3 (8 degrees of freedom) even if we excluded the 0.2-0.3 phase bin, which indicates no significant difference in the bin. The pulsating nature of the line flux suggests that the matter emitting the iron fluorescence line is distributed asymmetrically around the pulsar.
4 Discussion
Apart from two RXTE observations and three BeppoSAX observations during the quiescence, all other observations reported before 2005 August were made during the giant outbursts when the source flux was about equal to or more than that of the Crab nebula. The RXTE and INTEGRAL observations of the pulsar, during the 2005 August-September minor outburst, confirmed the earlier discovery of a cyclotron feature at 45 keV along with the detection of its first harmonic at 100 keV (Caballero et al. 2007). Suzaku observation of A0535+262 during the declining phase of the 2005 August-September normal outburst provided new data on spectral properties of the pulsar up to 100 keV and how they might evolve throughout the outburst.
4.1 Pulse Profile
During the present observation of the minor outburst, the pulse profile of A0535+262 is different from that in the quiescence or during the earlier reported outbursts. The pulse profile in the hard energy band is known to show energy and luminosity dependence in outbursts, which is described in Bildsten et al. (1997) based on the BATSE observations. The profile tends to be double peaked when the luminosity is high, eg. erg s-1 (20–100 keV), whereas it becomes a single peak at erg s-1. The current observation had even lower luminosity ( erg s-1 in 20–100 keV band), and showed almost sinusoidal profile above 25 keV. The hard band observation found a single peaked profile, as was seen by BATSE.
Hard X-ray pulse profiles of A0535+262, obtained from the RXTE and INTEGRAL observations of the same 2005 outburst with a peak luminosity of 1037 erg s-1, appear to be double-peaked (Caballero et al. 2007). The two peaks with a shallow valley constitute a trapezoid-like profile above 35 keV separated by a wide trough. Though the observations were carried out during the peak and the decay of the outburst, the added pulse profile may be dominated by the profile during the peak of the outburst. Therefore, the profile presented by Caballero et al. (2007) probably reflect that at the higher luminosity observations (at the peak of the outburst). The double-peaked hard X-ray profiles at a source luminosity of 1037 erg s-1 agrees with the luminosity dependence of pulse profiles observed with BATSE. The profiles obtained from Suzaku observation, however, appear to be different from that of the RXTE and INTEGRAL observations. This is interpreted due to the luminosity dependent effect as the Suzaku observation was at a luminosity level of two orders of magnitude less compared to the peak luminosity.
On the other hand, the Suzaku pulse profile in the soft energy band ( keV) is found to be similar to that obtained from the observation of the 1989 outburst (Mihara 1995). The dip-like structure, prominent only at soft X-rays is also recognized in the profile. Because the observation was made during the outburst when the source was 80 times brighter than the present observation, the profile may be interpreted that A0535+262 in outbursts generally contains a dip-like structure at soft X-rays as seen in 2005 observation. This type of structure is also seen in the RXTE observation of the pulsar during the same minor outburst in 2005 August/September (Caballero et al. 2007). This dip-like structure is absent in the pulse profiles when the pulsar was in quiescence (Mukherjee & Paul 2005). As other observations of A0535+262 in giant outbursts focused on the hard X-ray energy ranges, the dip-like structure could have been missed in the pulse profiles.
4.2 Phase-Averaged Spectroscopy
The X-ray spectrum of A0535+262 has been described by different continuum models at different energy ranges. Hard X-ray observations during outbursts, meant for the study of cyclotron absorption features and hence the pulsar magnetic field, were fitted by different continuum models such as optically thin thermal bremsstrahlung, power-law, power-law with an exponential cut-off, Wien’s law or different combinations of above components (dal Fiume et al. 1988; Kendziorra et al. 1994; Grove et al. 1995), whereas the 2–37 keV spectrum, obtained from the observation of the 1989 outburst, was well fitted with NPEX continuum model (Mihara 1995). Current analysis of the data showed that the NPEX continuum model fits well to the source spectrum.
Selection of an appropriate continuum model may be crucial to investigate the broad features in the spectrum, such as the soft excess represented by a blackbody component. The spectral fitting to the 0.3–10 keV BeppoSAX spectra, during quiescence, yielded a blackbody component of temperature 1.3 keV along with a power-law component of index 1.8 (Mukherjee & Paul 2005). On the other hand, the Suzaku data when fitted with NPEX continuum model yielded a much lower temperature of 0.16 keV, which is common for most of the X-ray pulsars. We suspect that the difference arises from the different selection of the continuum model. In fact, when the Suzaku wide band spectra were fitted by a power-law with an exponential cutoff, we did indeed obtain a blackbody temperature of 1.36 keV. This demonstrates the importance of the continuum selection to quantify the blackbody component. However, the selection criteria for the continuum choice have yet to be rigorously defined.
Most of the transient Be/X-ray binary pulsars undergo periodic outbursts due to the enhanced mass accretion when the neutron star passes through the dense regions of the circumstellar disk. During the passage, there is every possibility of the increase in the absorption column density. In case of A0535+262, we found that the absorption column density was higher than the Galactic column density towards A0535+262 (5.9 1021 atoms cm-2) during the minor outburst in 2005 August-September. Note that the observation was made near the apastron at the orbital phase of 0.42–0.43. From BeppoSAX observations of the pulsar in quiescence (orbital phases 0.77, 0.05, 0.42), though, the estimated value of the absorption column density was found to be similar to that of the Galactic column density (Mukherjee & Paul 2005). During the 1998 RXTE/PCA observations (in quiescence, orbital phases of 0.0 and 0.77), the value of the absorption column density was found to be a factor of about 10 higher than that of the Galactic column density (Negueruela et al. 2000). During the observation of the pulsar in the 1989 outburst (orbital phase of 0.96), the estimated absorption column density was found to be 4.8 1021 atoms cm-2 (Mihara 1995), which is compatible with the Galactic value. These are only three instances where the absorption column density of the pulsar is reported so far. Although the available data are scarce, the absorption column density does not show clear correlation with the source intensity or the orbital phase. In this sense, it is note worthy that the observations of the large absorption column with RXTE/PCA were made when the circumstellar disk around the Be companion (Be disk) was absent (Negueruela et al. 2000).
Haigh et al. (2004) suggest that the X-ray activity of the pulsar is correlated with the change of the truncation radius of the Be disk. The truncation of the disk by the tidal interaction with the neutron star, which defines the truncation radius, could explain the observed X-ray outbursts in Be/X-ray binary systems. When the truncation radius reduces, the material from the outer portions of the disk are expelled and may be found elsewhere in the binary system. This may trigger the giant X-ray outburst. When the Be disk disappears, as the case of RXTE/PCA observations, all the disk material is considered to be accreted and/or ejected throughout the binary system. The presence of the expelled material in the line of sight may have caused a moderately large absorption column. Haigh et al. (2004) argues that the reduction of the Be disk continues for several orbital periods before/after the giant outburst. Because the Suzaku observation was made about an orbital period after the giant outburst in May/June 2005, the reduced Be disk may have caused moderately large absorption column.
Broad-band spectroscopy of A0535+262 shows the presence of a weak iron Kα emission line with 25 eV equivalent width. Other than the 1989 observation and recent RXTE and INTEGRAL observations of the same minor outburst, none of the previous observations of the pulsar could detect the weak emission line at 6.4 keV. The emission line is interpreted as due to the fluorescent line from the cold ambient matter in the vicinity of the neutron star. If the cold matter is distributed spherically symmetric around the neutron star, the excess column density over the Galactic value, atoms cm-2, would produce an iron emission line with an equivalent width of only a few eV (Makishima 1986). The larger equivalent width we detected may be interpreted as the cold matter having an asymmetric distribution, and more matter is distributed outside the line of sight. The fluorescence of the atmosphere of the binary companion could be a possible source of the iron emission line. However, we consider that it does not have a major contribution to the observed equivalent width, because the solid angle subtended by the companion, which is estimated as 10-4 at apastron, is very small due to the long-orbital period of A0535+262. Instead, we conjecture that the accretion disk is the probable reprocessing site to produce the iron fluorescent line. Because the pulse phase with higher line flux covers more than a half of the pulse period, the reprocessing site should subtend a large solid angle against the neutron star. The accretion disk conforms to this condition.
4.3 Pulse Phase Resolved Spectroscopy
Pulse phase resolved spectroscopy of A0535+262 showed that the blackbody component, used to describe the soft excess, is pulsating as seen in some other accreting X-ray pulsars, such as LMC X-4, SMC X-1 etc. (Naik & Paul 2004a, Naik & Paul 2004b, Paul et al. 2002 and references therein). The pulsation is found to be in phase with that of the middle-band X-ray emission (eg. 2.5–5.0 keV band; see Figure 3). However, in case of Her X-1, the pulsating soft component is found to be shifted by about 230∘ in phase from the power-law continuum component (Endo et al. 2000). A systematic and detailed study of the accreting X-ray pulsars which show soft excess revealed that the soft excess is a common feature in the X-ray pulsars (Hickox et al. 2004). Both the pulsating and non-pulsating natures of the soft excess seen in various X-ray pulsars suggest a different origin of emission of the soft components. The possible origins of the soft excess in accretion powered X-ray pulsars are (a) emission from accretion column, (b) emission by a collisionally energized cloud, (c) reprocessing by a diffuse cloud, and (d) reprocessing by optically thick material in the accretion disk (Hickox et al. 2004). The soft excess emission from the accretion column and by the reprocessing of harder X-rays by optically thick material in the accretion disk, are expected to show pulsations whereas in other cases, it is non-pulsating in nature. The pulsation of the soft component (blackbody component) in phase with the middle-band X-ray emission in A0535+262 suggests that the most probable region of soft X-ray emission is the accretion column and/or the inner accretion disk.
The absorption column seems to have significant contribution to produce the dip like structure at soft X-rays at phases 0.65-0.80 in the count rate profile (left top panel of Figure 5). Column density takes large values, atoms cm-2, at phase 0.7-0.8. This may contribute to produce the dip like structure in the profiles below 1 keV which disappears from the profiles at higher energies. On the other hand, the primary dip exists at all the energies. The observed primary dip in the pulse profile can be understood by the change in the NPEX model parameters over pulse phase. The NPEX continuum model is an approximation of the unsaturated thermal Comptonization in hot plasma (Makishima et al. 1999). At low energies, it reduces to the ordinary power-law with negative slope. The lower value of the power-law index () at the primary dip phase implies large optical depth to the Compton scattering. This means that many photons are scattered-out from the line of sight. It explains the presence of the primary dip in the soft and hard X-ray pulse profiles at same phase. In addition to the primary dip, the deepening of the dip at the phases 0.0-0.17 (Figure 3) can also be understood by the changes of the parameters of the Comptonizing plasma. The power-law index () tends to be larger and the exponential cut-off energy is smaller in this phase range. This means that the Comptonizing plasma has a relatively smaller optical depth and a lower temperature. This reduces the efficiency of Compton up-scattering and the number of hard photons, which causes the deepening of the dip at phases 0.0-0.17 above 5 keV.
5 Summary
Using the Suzaku observation of A0535+262, we performed the timing and spectral analysis in broad band energy range. The 103 s pulsation is detected both in HXD/PIN and XIS light curves of the pulsar. Apart from the primary dip, the pulse profile at soft X-rays shows a dip like structure which disappears at higher energies. When the source spectrum was modeled by a cut-off power-law continuum model with a blackbody component for the soft excess, it yielded a blackbody temperature of 1.36 keV. However, the NPEX continuum model provided a blackbody component of 0.16 keV temperature, which is common in case of accretion powered X-ray pulsars, along with a weak iron emission line of equivalent width of about 25 eV. The value of the absorption column density (NH) is found to be higher than that of the galactic value towards the pulsar. The pulsating nature of the blackbody component, as seen from the phase resolved spectroscopy, suggests that the accretion column and/or inner part of the accretion disk is the possible source of soft excess emission in A0535+262. The iron line equivalent width remains more or less constant over the pulse phase with an average value of about 25 eV. This value of equivalent width is found to be high for a symmetric distribution of circumstellar matter corresponding to NH of 51021 atoms cm-2. This rules out the fluorescence from the atmosphere of the companion and fluorescence by the surrounding material in the line of sight as the dominant source of iron line emission. The pulsating nature of the iron line flux in phase with the hard X-ray (NPEX) flux suggests that the inner part of the accretion disk is the probable site of iron fluorescence emission.
Acknowledgments
The authors would like to thank all the members of the Science Working Group for their contributions in the instrument preparation, spacecraft operation, software development, and in-orbit instrumental calibration. The authors also thank the referee for useful comments and suggestions. SN acknowledges the support by JSPS (Japan Society for the Promotion of Science) post doctoral fellowship for foreign researchers (P05249). This work was partially supported by grant-in-aid for JSPS fellows (1705249).
References
- (1) Bildsten, L., Chakrabarty, D., Chiu, J., et al. 1997, ApJS, 113, 367
- (2) Caballero, I., Kretschmar, P., Santangelo, A., et al. 2007, A&A, L21
- (3) Coburn, W., Heindl, W. A., Rothschild, R. E., et al. 2002, ApJ, 580, 394
- (4) Coe, M. J., Carpenter, G. F., Engel, A. R., & Quenby, J. J. 1975, Nature, 256, 630
- (5) Coe, M. J. 2000, ASPC, 214, 656
- (6) dal Fiume, D., Frontera, F., & Morelli, E. 1988, ApJ, 331, 313
- (7) Endo, T., Nagase, F., & Mihara, T. 2000, PASJ, 52, 223
- (8) Finger, M. H., Cominsky, L. R., Wilson, R. B., et al. 1994, AIPC, 308, 459
- (9) Finger, M. H., Wilson, R. B., & Harmon, B. A. 1996, ApJ, 459. 288
- (10) Grove, J. E., Strickman, M., Johnson, W., et al. 1995, ApJ, 438, L25
- (11) Haigh, N. J., Coe, M. J., & Fabregat, J. 2004, MNRAS, 350, 1457
- (12) Hickox, R. C., Narayan, R., & Kallman, T. R. 2004, ApJ, 614, 881
- (13) Inoue, H., Kunieda, H., White, N., et al. 2005, Astron. Telegram, 613
- (14) Kendziorra, E., Kretschmar, P., Pan, H. C., et al. 1994, A&A, 291, L31
- (15) Kokubun, M., Makishima, K., Takahashi, T., et al. 2007, PASJ, S53
- (16) Koyama, K., Tsunemi, H., Dotani, T., et al. 2007, PASJ, S23
- (17) Kretschmar, P., Pan, H. C., Kendziorra, E., et al. 1996, A&AS, 120, 175
- (18) Kretschmar, P., Kreykenbohm, I., Pottschmidt, K., et al. 2005, Astron. Telegram, 601
- (19) Maisack, M., Grove, J. E., Kendziorra, E., et al. 1997, A&A, 325, 212
- (20) Makishima, K. 1986, in Physics of Accretion onto Compact Objects, ed. K. O. Mason, M. G. Watson, & N. E. White (Berlin: Springer), 249
- (21) Makishima, K., Mihara, T., Nagase, F., & Tanaka, Y. 1999, ApJ, 525, 978
- (22) Mihara, T. 1995, Ph.D. thesis, Univ. Tokyo
- (23) Mukherjee, U., & Paul, B. 2005, A&A, 431, 667
- (24) Naik, S., & Paul, B. 2004a, ApJ, 600, 351
- (25) Naik, S., & Paul, B. 2004b, A&A, 418, 655
- (26) Negueruela, I. 1998, A&A, 338, 505
- (27) Negueruela, I., Reig, P., Finger, M., & Roche, P. 2000, A&A, 356, 1003
- (28) Paul, B., Nagase, F., Endo, T., et al. 2002, ApJ, 579, 411
- (29) Steele, I. A., Negueruela, I., Coe, M. J., & Roche, P. 1998, MNRAS, 297, L5
- (30) Takahashi, T., Abe, K., Endo, M., et al. 2007, PASJ, S35
- (31) Terada, Y., Mihara, T., Nakajima, M., et al. 2006, ApJL, 648, 139
- (32) Terada, Y., Enoto, T., Miyawaki, R., et al. 2007, PASJ (submitted)
- (33) Tueller, J., Ajello, M., Barthelmy, S., et al. 2005, Astron. Telegram, 504
- (34) Wilson, C. A., & Finger, M. H. 2005, Astron. Telegram, 605