SPITZER IRAC OBSERVATIONS OF WHITE DWARFS.
I. WARM DUST AT METAL-RICH DEGENERATES
Abstract
This paper presents the results of a Spitzer IRAC m photometric search for warm dust orbiting 17 nearby, metal-rich white dwarfs, 15 of which apparently have hydrogen dominated atmospheres (type DAZ). G166-58, G29-38, and GD 362 manifest excess emission in their IRAC fluxes and the latter two are known to harbor dust grains warm enough to radiate detectable emission at near-infrared wavelengths as short as 2 m. Their IRAC fluxes display differences compatible with a relatively larger amount of cooler dust at GD 362. G166-58 is presently unique in that it appears to exhibit excess flux only at wavelengths longer than about 5 m. Evidence is presented that this mid-infrared emission is most likely associated with the white dwarf, indicating that G166-58 bears circumstellar dust no warmer than K. The remaining 14 targets reveal no reliable mid-infrared excess, indicating the majority of DAZ stars do not have warm debris disks sufficiently opaque to be detected by IRAC.
1 INTRODUCTION
The Spitzer Space Telescope opened a new phase space to white dwarf researchers interested in the infrared properties of degenerate stars and their environments. The majority of white dwarfs are inaccessible from the ground beyond 2.4 m due to their intrinsic faintness combined with the ever-increasing sky brightness towards longer wavelengths (Glass, 1999). This limits any white dwarf science which aims to study matter radiating at K. Prior to the launch of Spitzer, only one previously published, directed mid-infrared study of white dwarfs exists ; an Infrared Space Observatory search for dust emission around 11 nearby white dwarfs, 6 of which have metal-rich photospheres (Chary, Zuckerman, & Becklin, 1999).
Owing to the superb sensitivity of Spitzer (Werner et al., 2004), a Cycle 1 IRAC program was undertaken to search for warm dust emission associated with cool, hydrogen atmosphere white dwarfs with photospheric metals, the DAZ stars. This paper presents a synopsis of the IRAC results, including the detection of m flux excess at G166-58, m data on G29-38 and GD 362, and also includes Gemini m spectroscopy of G29-38.
2 SCIENTIFIC MOTIVATION
2.1 White Dwarfs Are Metal-Poor
The origin and abundances of photospheric metals in isolated white dwarfs has been an astrophysical curiosity dating back to the era when the first few white dwarfs were finally understood to be subluminous via the combination of spectra and parallax; Sirius B, 40 Eri B, and van Maanen 2 (van Maanen, 1919; Adams, 1915, 1914). In a half page journal entry, van Maanen (1917) noted that his accidentally discovered faint star with large proper motion had a spectral type of “about F0” (van Maanen, 1917). It was not until forty years(!) later that it became clear that van Maanen 2 was metal-poor with respect to the Sun (Weidemann, 1960). Over the course of the another decade and a half, it became gradually clear that white dwarfs in general – both hydrogen atmosphere degenerates void of metallic features and helium atmosphere degenerates with photospheric metal lines – had heavy element abundances a few to several orders of magnitude below solar (Wehrse, 1975; Grenfell, 1974; Shipman, 1972; Wegner, 1972; Bues, 1970). Oxymoronically, white dwarfs with detectable, yet evidently sub-solar, heavy element abundances are now referred to as metal-rich.
The two fundamental classes of metal-poor-yet-rich white dwarfs are essentially the same as their metal-free counterparts, which are designated by the main atmospheric constituent; either hydrogen or helium. It is easiest to think of white dwarfs as type DA (hydrogen) or non-DA (helium). For a wide range of temperatures, white dwarfs with hydrogen atmospheres will manifest Balmer lines (type DA), excepting perhaps the very hottest cases where hydrogen may be ionized (e.g. PG 1159 stars). White dwarfs with helium atmospheres display a variety of spectral behaviors which depend primarily on their effective temperatures; helium II lines (type DO) for the hottest, helium I lines (type DB) for a wide temperature range, and no lines (type DC) for the coolest. Although there do exist cases of mixed atmospheres, either inferred or directly observed, typically one of the two light gases dominates the composition and photosphere; a notable exception is the case of carbon opacity in a helium atmosphere (type DQ). There are both subtleties and complexities in the composition and spectral characteristics of white dwarfs which will not be discussed here, but for the full guided tour of the white dwarf spectral zoo, the reader is referred to both the definition of the current classification scheme (Sion et al., 1983) and a broad spectral atlas (Wesemael et al., 1993). The important points to take away from a given designated spectral type is: 1) the first letter after D indicates the dominant gas in the atmosphere; 2) when metals are detected in an ultraviolet or optical spectrum of a white dwarf, the letter Z is added to the designation (with DC becoming DZ).
2.2 Metals Are Contaminants
Any primordial heavy elements in white dwarfs can only be sustained in their photospheres for the brief ( yr) period while the degenerate is still rather hot and contracting significantly, and then only to a certain degree. This is achieved through radiative levitation at K for hydrogen atmospheres and K for helium atmospheres (Chayer, Fontaine, & Wesemael, 1995; Fontaine & Michaud, 1979). Below these temperatures, the cooling degenerate stars develop significant convection zones, which enhance the gravitational settling of the elements, now unimpeded by radiative forces (Chayer, Fontaine, & Wesemael, 1995; Paquette et al., 1986; Muchmore, 1984; Alcock & Illarionov, 1980; Vauclair, Vauclair, & Greenstein, 1979; Fontaine & Michaud, 1979; Fontaine & Van Horn, 1976; Schatzman, 1958). Diffusion timescales for the sinking of metals are always orders of magnitude shorter than the evolutionary (cooling) timescales of white dwarfs. Therefore, external sources are responsible for the presence of the metals within cool white dwarf photospheres.
Although there were suspects and many spurious detections reported, all metal-rich white dwarfs were historically helium atmosphere degenerates until the confirmation of G74-7, the first DAZ star (Lacombe et al., 1983). Even so, a decade later all other known metal-bearing white dwarfs were still restricted to the helium-rich variety, despite reports to the contrary; an examination of Tables 1 and 2 in Dupuis, Fontaine, & Wesemael (1993) with hindsight reveals that only G74-7 remains classified as DAZ (Zuckerman et al., 2003; Wolff, Koester, & Liebert, 2002; Wesemael et al., 1993). This situation began to change a little less than a decade ago with a couple of individual discoveries, followed by many more, now totalling around fifty objects (Koester et al., 2005; Zuckerman et al., 2003; Zuckerman & Reid, 1998; Holberg, Barstow, & Green, 1997; Koester, Provencal, & Shipman, 1997). The reason DAZ stars are latecomers to the metal scene is because helium atmospheres are quite transparent relative to hydrogen atmospheres; all else being equal, a given calcium abundance will produce an equivalent width of order times stronger in a helium as opposed to hydrogen atmosphere, making it far easier to infer the presence of photospheric metals in helium-rich degenerates (Zuckerman et al., 2003; Dupuis, Fontaine, & Wesemael, 1993).
Convection zones can be many orders of magnitude larger in helium atmosphere white dwarfs, resulting in diffusion times for heavy elements up to yr (Dupuis et al., 1992; Paquette et al., 1986; Muchmore, 1984; Alcock & Illarionov, 1980; Fontaine & Michaud, 1979; Vauclair, Vauclair, & Greenstein, 1979; Fontaine & Van Horn, 1976). This relatively long-lived photospheric retention allows for the possibility that extant metals in such objects are the remnant of a long ago (up to several diffusion timescales) interstellar cloud encounter (Dupuis et al., 1993, 1993, 1992). However, it was shown that the Galactic positions and space motions of DZ and DBZ stars are not correlated with local interstellar clouds (Aannestad et al., 1993; Aannestad & Sion, 1985). Additionally with regards to cool helium atmosphere white dwarfs, there is the ever-present and still unexplained lack of detectable hydrogen (or more specifically in the case of those bearing metal lines, the very high inferred metal to hydrogen abundance ratios), which should be expected in quantity, and readily visible in low opacity helium-dominanted photospheres, if accretion from the interstellar medium has occurred at any time during their cooling (Dupuis, Fontaine, & Wesemael, 1993).
The timecales for the diffusion of metals in hydrogen atmosphere white dwarfs diminish quite drastically relative to those in their helium atmosphere counterparts, owing to significantly smaller convection zones for K, and in warmer cases ( K) where the convection zone is almost negligible, these diffusion times can be just a few days (Koester & Wilken, 2006; Zuckerman et al., 2003; Paquette et al., 1986). Unless such objects have just emerged from interstellar accretion episodes within these short periods (unlikely), they must be currently accreting at rates sufficient to produce the observed abundances. Zuckerman et al. (2003) find no correlation between enhanced interstellar medium densities and the current positions of accreting DAZ stars. In contrast, Koester & Wilken (2006) conclude that, with certain caveats, the warm, partially ionized medium can explain the observed accretion rates and abundances in DAZ stars.
2.3 Minor Planets Are Metal-Rich
Two decades ago it was proposed that accretion of circumstellar material might be the cause of the heavy metal abundances seen in some white dwarfs, so that the origin of contaminating elements seen is bimodal in nature; either interstellar or circumstellar (Sion et al., 1990; Alcock, Fristrom, & Siegelman, 1986). The first such model invoked episodic cometary impacts from reservoirs which managed to survive the post-main sequence mass loss phases, particularly the asymptotic giant branch (Debes & Sigurdsson, 2002; Parriott & Alcock, 1998; Alcock, Fristrom, & Siegelman, 1986). This particular model fails to explain 1) the DAZ stars with the highest metal abundances, and 2) the observed distribution of abundances in general (Zuckerman et al., 2003). A more promising model of circumstellar accretion invokes the tidal disruption of an asteroid, which goes on to form a ring of debris around the white dwarf, from which the photospheric heavy elements originate (Jura, 2003). Given that a typical solar system asteroid is around times more massive than a typical comet, this model can explain both the relatively high metal abundance and the observed infrared excess seen at several metal-rich white dwarfs (Jura et al., 2007; Farihi et al., 2007; Becklin et al., 2005; Jura, 2003). While it may be the case that both mechanisms create contaminated white dwarf photospheres – perhaps circumstellar in the case of high metal abundances and interstellar for those in the lower range – there are a growing number of metal-rich white dwarfs which are either confirmed or suspected to harbor circumstellar dust (Jura, Farihi, & Zuckerman, 2007; von Hippel et al., 2007; Kilic et al., 2006; Jura, 2006; Reach et al., 2005a).
Observations in the mid-infrared are most sensitive to both warm and cool orbiting dust at metal-bearing white dwarfs, providing a direct test of circumstellar accretion hypotheses. Additionally, such a search can constrain the frequency of orbiting material more strongly than ground-based near-infrared observations, which are sensitive only to dust not far from its sublimation temperature.
3 OBSERVATIONS AND DATA
3.1 IRAC Imaging of DAZ Degenerates
Table SPITZER IRAC OBSERVATIONS OF WHITE DWARFS. I. WARM DUST AT METAL-RICH DEGENERATES lists the 17 metal-rich white dwarfs observed with IRAC, taken from Zuckerman et al. (2003) with the exception of GD 362 (Gianninas, Dufour, & Bergeron, 2004). All targets were chosen as DAZ stars, but recent evidence implies that two of the white dwarfs (G77-50 and GD 362) are helium-rich (Koester et al. 2005; D. Koester 2007, private communication). For the purposes of this paper and the statistics which follow, many targets are nominally referred to as DAZ, even though future observations may reveal helium-rich atmospheres in some. This fact is simply unavoidable as helium becomes spectroscopically undetectable in white dwarfs cooler than K and its presence can only be inferred by indirect methods. (Bergeron, Saffer, & Liebert, 1992). These stars were chosen among available Spitzer Cycle 1 observations for their high metal abundances.
Between 2004 November and 2005 August, observations were executed with the Infrared Array Camera (IRAC; Fazio et al. 2004) in all four bandpasses: 3.6, 4.5, 5.7, and 7.9 m. A 20-point cycling dither pattern (of medium step size) was used for each target in each bandpass, with 30 s frame times at each position, yielding a total exposure time of 600 s at all wavelengths. The data were processed with the IRAC calibration pipeline (versions ) to create a single, fully processed and reduced image ( pixels in all four channels) upon which to perform measurements. Aperture photometry was carried out with the standard IRAF task apphot, and measured fluxes were corrected for aperture size, but not for color. Generally, the flux and signal-to-noise were measured in a pixel aperture radius, dependent upon target brightness and neighboring sources, with a pixel sky annulus. The measured fluxes were converted to the standard IRAC aperture using corrections described in the most recent version of the IRAC Data Handbook (Spitzer Science Center, 2006). The results are listed in Table 2.
3.2 Photometric Errors
Listed in Table 2 are the total errors in the measured and calibrated flux, together with IRAC pipeline versions with which the data were extracted from the archive. The photometric errors were estimated by taking the per pixel standard deviation in the extracted sky level and multiplying by the area of a 2 pixel radius photometric aperture, the smallest radius for which there exist derived aperture corrections in the IRAC Data Handbook (Spitzer Science Center, 2006). This approach is conservative and does not assume Gaussian, random noise for the following reasons. It was found in general that the observations went sufficiently deep as to approach or reach the confusion limit, primarily, but not exclusively, at the two shorter wavelengths. Additionally, there was sometimes low spatial frequency structure seen in the background of the two longer wavelength images, which appeared to be from either real diffuse sources such as cirrus, or from imperfections in the IRAC pipeline. These factors led to difficulty in the determination of the true sky level in the vicinity of the science target, the per pixel noise in the sky, and in the flux measurement itself. Even in the smallest, 2 pixel radius, aperture used for photometry, there was occasional possible flux contamination from neighboring sources in this relatively large 18.1 square arcsecond area, compounded by the undersampled pixels. This possibility was evident from a few (typical) to several (rare) percent increase in photometric flux that was sometimes seen as the aperture radius was increased from 2 to 3 pixels, which should not occur for single point sources and accurate aperture corrections. All targets were unambiguously detected at all wavelengths.
There are five other sources of photometric error in the IRAC camera which were considered (Spitzer Science Center, 2006). First, the absolute calibration uncertainty in the IRAC instrument is reported as 3% (Reach et al., 2005b). Second, color corrections have been ignored and are typically smaller than 1%. Third, there is the pixel phase dependent correction, which is reported to be no more than 4% peak to peak or % for a single image at 3.6 m (Spitzer Science Center, 2006). The images analyzed here were produced by a set of 20 pseudo-random dithers which essentially annihilates this source of error. Fourth, there is the array location dependent correction for Rayleigh-Jeans type stellar sources. This effect is the largest source of photometric uncertainty in the IRAC instrument and may reach 10% peak to peak or %, therefore a typical error of this type should be %. However, experiments have shown that for well dithered data, as that analyzed here, the effect tends to average out (as would be expected) and is less than 1% (Carey, 2006; Spitzer Science Center, 2006).
To assess the reliability of the absolute IRAC calibration, a couple of experiments were undertaken (M. Jura 2007, private communication). First, the 3.6 to 4.5 m flux ratios of the target stars with K, and no evidence for the presence of warm dust, were examined and found to vary typically within 5% of the mean, however a couple of targets deviated by as much as 10% – quite significant for such a small number of white dwarfs. Second, a similar result was obtained by examining 4.5 to 7.9 m flux ratios of identically warm white dwarfs from Mullally et al. (2007). In this instance the relatively lower signal-to-noise at 7.9 m may have been a factor as evidenced by the result of Tremblay & Bergeron (2007) who fit a subsample of the Mullally et al. (2007) white dwarfs with current models to within 4% at 4.5 m, yet only to within 10% at 7.9 m. White dwarf models themselves cannot account for the observed deviations in flux ratios at these warmer temperatures, which can only amount to around 1% for extreme values of surface gravity and temperature (P. Bergeron 2007, private communication). Furthermore, Hines et al. (2006) report observed IRAC fluxes for 33 main sequence stars which deviate from model predicted photospheric values, on average, by 8% at 3.6 m, 4% at 4.5 m, and 6% at 7.9 m. Silverstone et al. (2006) find similar deviations between measured IRAC fluxes and model predictions for 74 young main sequence stars, amounting to 5% on average at all wavelengths. Based on these analyses and findings, it seems appropriate to assign a IRAC calibration uncertainty of 5%. For bright targets, the total error is dominated by the absolute calibration uncertainty, while for the faintest targets the total error is dominated by the uncertainty in the aperture photometry. For these reasons, the total errors represented in Table 2 should be considered conservative.
3.3 NIRI -grism Spectroscopy of G29-38
On three nights in 2006 January G29-38 was observed at Gemini Observatory at Mauna Kea with the Near-Infrared Imager (NIRI; Hodapp et al. 2003) in spectroscopy mode using the -grism, which covers m. Spectra were taken at two positions along the slit with 1 s exposures and 60 coadds. Overall, approximately 2 hours of usable science frames were gathered. Calibration frames taken each night included spectral flats as well as observations of one of the two A0V telluric standards HIP 110578 or HIP 12640, utilizing 0.2 s exposures and coadds nodded at two positions along the slit.
Both the science and telluric standard frames from each night were pairwise subtracted at the two nod positions in order to best remove the bright, variable sky at these wavelengths. The subtracted frames were flat fielded and then median combined, with bad pixels and cosmic rays fixed manually, creating two spectra of opposite polarity which were extracted using standard IRAF tasks. The two extracted spectra from each night were wavelength calibrated using aborption lines from the night sky, and averaged. The science spectrum each night was divided by the telluric spectrum and multiplied by a blackbody of the appropriate temperature. The science spectra from all three nights were shifted and averaged to create the final spectrum. The flux was converted from to , normalized to one, then flux calibrated using IRAC 3.6 m photometry. The signal-to-noise was estimated by measuring the standard deviation along 20 sections of 50 pixels each spanning the entire wavelength range, yielding values between 4 and 10 (average 7) over m, and between 8 and 15 (average of 12) over m. These were calculated assuming continuum or pseudo-continuum over all regions.
4 ANALYSIS AND RESULTS
4.1 Spectral Energy Distributions
The IRAC fluxes for all targets, together with optical and near-infrared data, are plotted as spectral energy distributions in Figures 1–5. In general, the short wavelength photometry was taken from the most accurate and reliable sources available, including but not limited to: McCook & Sion (2003) and references therein; 2MASS (Skrutskie et al., 2006); DENIS (DENIS Consortium, 2005); and various other sources (Liebert, Bergeron, & Holberg, 2005; Monet et al., 2003; Zuckerman et al., 2003; Bergeron, Leggett, & Ruiz, 2001, 1997). Because the aim of the survey was to identify significant mid-infrared photometric excess due to opaque dust, blackbody fits to the spectral energy distributions of the target white dwarfs will suffice to model their expected, essentially Rayleigh-Jeans, behavior at IRAC wavelengths. If the total uncertainty in the IRAC photometry decreases sufficiently, white dwarf models should prove more useful in this regard.
Of the 17 observed stars, three display excess radiation within their IRAC beams (considered here to be the solid angle contained within a full width at half maximum Airy disk, typically in diameter and square arcseconds in area at m), with a high degree of certainty. The case of G166-58 is discussed in some detail below and shows evidence for continuum emission from K dust. Both G29-38 and GD 362 show warm ( K) thermal continuum and strong silicate emission in their mid-infrared spectra and have therefore been confirmed to harbor orbiting rings of dust (Jura et al., 2007; Reach et al., 2005a). For the remainder of the targets, the IRAC observations either rule out emission from warm, opaque debris or are of sufficiently low signal-to-noise as to preclude a definitive conclusion either way. Unfortunately, there was a single target (G21-16) for which accurate fluxes could not be extracted due to unavoidable source confusion within and around the IRAC beam. An unsuccessful attempt was made to photometrically isolate the white dwarf with the IRAF task daophot; based on the signifiant crowding, it is likely that the IRAC beam itself is contaminated at all wavelengths.
From the present work, 3 of 17 metal-rich white dwarfs, or 18% display definite IRAC continuum excess consistent with orbiting dust. However, this fraction is only 2 in 15 DAZ stars, or 13%. If one counts all DAZ white dwarfs observed with IRAC in Cycle 1, the total which display IRAC flux excess is 3 of 25 targets or 12 % (von Hippel et al., 2007; Kilic et al., 2006).
4.2 GD 362
The spectral energy distribution of GD 362, together with its IRAC data, is displayed in Figure 5. As expected on the basis of ground-based photometry (Becklin et al., 2005), the m region is dominated by warm thermal emission from orbiting dust, whose flux can be reproduced out to m by a K blackbody. This approximation is physically nonviable as it corresponds to a ring (or sphere) with a single temperature and radius, yet does not deviate much from a ring model of substantial radial extent Jura (2003) at these shorter mid-infrared wavelengths. The measured flux at 7.9 m has not been corrected for color and shows an indication that the broad and strong 10 m silicate emission feature (Jura et al., 2007; Farihi et al., 2007) contributes significantly into that relatively wide ( m) bandpass.
In Figure 6, the m photometric data on GD 362 are plotted together with the more realistic model of Jura (2003). The model invokes a face-on geometrically thin opaque dust ring of finite radial extent, with an inner temperature of K and an outer temperature range K. For GD 362, these temperatures correspond to a ring which extends from to (Chiang & Goldreich, 1997). The data agree reasonably well with the higher temperature curve, excepting the 24 m flux (disregarding the silicate emission-enhanced 7.9 m flux). There are two possibilities based on this model: 1) the outermost opaque grains have a temperature K or; 2) the flux at 24 m is affected by another dust emission feature (which would indicate forsterite, if present). Photometric and spectroscopic observations of GD 362 utilizing all three instruments aboard Spitzer, including a detailed model fit of the orbiting dust, its mid-infrared thermal continuum and emission features, dust mass estimates, temperature and particle size distribution, dimensions and types of the emitting regions are presented in Jura et al. (2007).
4.3 G29-38
The spectral energy distribution of G29-38, together with its IRAC data, is displayed in Figure 5. While the overall similarity between G29-38 and GD 362 is apparent, there are some distinctions. Although their inner dust temperatures are clearly similar, the thermal continuum flux of G29-38 over m appears to be falling, while for GD 362 it is rising; likely an indication of varying amounts of opaque dust both slightly warmer and cooler than the K blackbody approximations for the excess at each of these stars. In order to fit the slope of the m photometry of G29-38 with a blackbody, a temperature near 1100 K is necessary, greatly overpredicting the near-infrared flux. Yet as can be seen from the figure, the 3.6 m flux is somewhat underpredicted by 900 K.
Using the more plausible and physical model of Jura (2003), Figure 6 plots the thermal infrared excess of G29-38 from m from all available Spitzer photometric data, together with the model curves. These disk models are exactly those applied to G29-38 in Jura (2003), now plotted with more accurate data with greater wavelength coverage. For the same inner and outer temperatures given above, the extent of the opaque ring is from to for G29-38. In this case, unlike GD 362, all the photometric data are fitted decently by the model where the outermost grains have a temperature near 600 K, with the possible exception of the 3.6 m flux.
The apparently excessive flux from G29-38 at the shortest wavelength IRAC channel was first noticed when the data were initially retrieved from the Spitzer archive using pipeline version 11.0. It was present again one version later, and then triple checked in 2006 November with version 14.0, which was used for all the IRAC data on G29-39 in this work. The deviation between the models and the measured flux at 3.6 m is mJy from the best fit ring model or the blackbody. Taking photometric error into account, which is entirely due to instrument calibration uncertainty, the average deviation is 0.70 mJy; approximately of the flux error, or 10% of the excess. m spectroscopy was undertaken to investigate possible sources of this extra emission, and to better assess if it is real.
As can be seen from Figure 7, the -grism spectrum of G29-38 is essentially featureless, with an apparent, slight, upward slope towards 4 m (a thermal continuum approximated by a 900 K blackbody would peak longward of 5 m in ). Previous to this investigation, the only spectral information in this wavelength regime came from data presented in Tokunaga, Becklin, & Zuckerman (1990), where a relatively low signal-to-noise spectrum is not inconsistent with emission over m. The spectral flux error in the Figure 7 data, translated to mJy via the IRAC 3.6 m flux, is typically 1.2 mJy over m (outside the atmospheric transmission window, an area very sensitive to water vapor and prone to large variability), and 0.7 mJy over m (atop the -band).
There exist a plethora of emission features in this region associated with polycyclic aromatic hydrocarbons and their multitudinous close relatives: specifically, features between 3.2 and 3.6 m seen in the interstellar medium (Draine, 2003; Allamandola, Tielens, & Barker, 1989; Geballe et al., 1985); circumstellar matter (Malfait et al., 1998; Beintema et al., 1996; Geballe et al., 1985); ultraviolet-excited (planetary, proto-planetary, and reflection) nebulae (Geballe et al., 1992, 1989, 1985); as well as in comets (Bockelée-Morvan, Brooke, & Crovisier, 1995; Brooke, Tokunaga, & Knacke, 1991; Baas, Geballe, & Walther, 1986). The well known 3.3 m feature, when present, is always significantly weaker than its other family members at 6.2, 7.7, 8.6, and 11.3 m (Draine, 2003; Malfait et al., 1998; Beintema et al., 1996; Allamandola, Tielens, & Barker, 1989). Because these stronger features are absent from the IRS m spectrum of G29-38 (Reach et al., 2005a), it is expected no feature should be present at 3.3 m, although the IRS data were published after the the -grism observations were planned. There are additional features around 3.4 m (primarily due to methanol, ethane, and other hydrocarbon species) which typically dominate this region when observed towards comets (Mumma et al., 2001; Crovisier et al., 1997; Bockelée-Morvan, Brooke, & Crovisier, 1995; Baas, Geballe, & Walther, 1986), but which are much weaker than the 3.3 m feature in circumstellar environments (Malfait et al., 1998; Beintema et al., 1996). Because of these observational facts, in addition to the relatively fragile nature of hydrocarbons (some small species are more volatile than water ice) in the vicinity of high density ultraviolet radiation fields (Joblin, Boissel, & de Parseval, 1997; Brooke, Tokunaga, & Knacke, 1991), it is unlikely that a cometary feature would be seen in the vicinity of the circumstellar dust ring at G29-38.
The failure to detect any possible sources of excess emission in the m region at G29-38 leaves a few possibilities for the 2.8 disagreement between its measured IRAC flux and the applied models. The first is that the photometry in the 3.6 m bandpass is improperly calibrated, making it inaccurate. The second is that both the ring model of Jura (2003) and the single temperature blackbody fail to predict the correct flux at this wavelength. A K blackbody (Figure 6) is not inconsistent with the m photometry, but underpredicts the three longer wavelength Spitzer data points, requiring that dust emission affects those bandpasses. The third possibility is the discrepancy arises from photometric variability. It is well-known that G29-38 is a pulsating white dwarf; -band light curves reveal periods of 615, 268, 243, and 186 s with amplitudes of 0.12, 0.03, 0.03, and 0.02 mag respectively, which are mirrored at -band with corresponding strengths of 0.02, 0.02, 0.03, and 0.03 mag respectively (Patterson et al., 1991; Graham et al., 1990). Although matching periods were searched for at , none were found, but with sufficiently large upper limits which do not exclude variations similar to those seen at (Patterson et al., 1991). Because the IRAC observations lasted 600 s, these photometric variability timescales cannot explain the 3.6 m flux being possibly high. Given that the IRAC channel 1 ( m; Fazio et al. 2004) data agree reasonably well with ground-based -band ( m; Tokunaga 2000) data with no color corrections to either, the discrepancy is likely to be model disagreement. The 4.5 and 7.9 m fluxes for G29-38 in Table 2 agree well with the quoted (uncorrected for color) fluxes reported by Reach et al. (2005a). It is possible that the deviation arises from variability which has not yet been seen or reported, but no such claim is being made based on the present data. A fourth possibility might be a companion, but all substellar models of appropriate age range predict about twice as much excess at 4.5 m relative to 3.6 m, as well as a commensurate rise from 3 to 4 m which is not observed in the -grism spectrum (Baraffe et al., 2003; Burrows, Sudarsky, & Lunine, 2003).
4.4 G166-58
Figure 4 displays the spectral energy distribution of G166-58 together with its IRAC flux measurements. The plotted data are optical from Bergeron, Leggett, & Ruiz (2001), the average of 2 -band values cited in McCook & Sion (2003), and near-infrared which are the average of values given in Zuckerman et al. (2003) and Bergeron, Leggett, & Ruiz (2001). The effective temperature of the white dwarf is taken from both Liebert, Bergeron, & Holberg (2005) and Zuckerman et al. (2003), where the determinations are both within 0.6% of 7400 K. G166-58 displays clear excess emission within its IRAC beam beginning at 5 m, making it unique among white dwarfs confirmed or suspected to harbor orbiting dust. In all other cases, the excess becomes unambiguous by 3 m, as in G29-38 and GD 362 (von Hippel et al., 2007; Kilic et al., 2006; Becklin et al., 2005; Zuckerman & Becklin, 1987b). The implied temperature of the m excess can be reproduced by a blackbody of K, and is substantially cooler than the K temperatures inferred in all other dusty white dwarfs with m excess. Yet circumstellar dust at 400 K is still considered warm relative to the overwhelming majority of main sequence stars with infrared excess attributed to a debris disk; with a few notable exceptions, these are all Kuiper belt analogs with K, and AU (Beichman et al., 2006; Song et al., 2005; Laureijs et al., 2002; Zuckerman, 2001; Chen & Jura, 2001).
Before proceeding further with any analysis and interpretation, owing both to the uniqueness of the IRAC data on G166-58 and the IRAC field in its vicinity, the nature and validity of the excess must be examined.
4.4.1 IRAC Beam Contamination
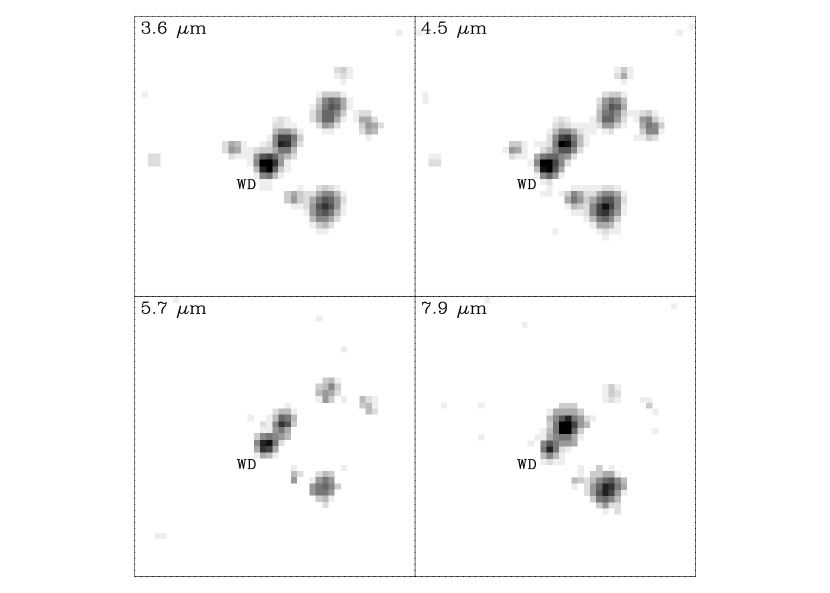
There is another source from G166-58 seen in all four IRAC images, which are displayed in Figure 8. This source is also present in the SDSS Photometric Catalog (release 5) where it is designated SDSS J145806.96+293726.3 and classified as a galaxy (Adelman-McCarthy et al., 2007). This object has optical and mid-infrared colors that are consistent with an extragalactic source. The IRAC images of G166-58 and the nearby galaxy overlap near from their image centers. Both sources appear point-like at all four wavelengths. The percentage of flux from the nearby galaxy in a 2 pixel radius centered at G166-58, measured relative to the total flux of the white dwarf over the same area, is relatively benign at %, with the exception of 7.9 m where it is 12%. This was determined by folding the IRAC point spread function of G166-58 in two along the axis of symmetry (up-down in the Figure 8 images), and subtracting one side from the other. Exploiting this symmetry, it was straightforward to remove the contamination in the aperture photometry of G166-58 and vice versa for similar measurements of the nearby galaxy (its flux is 0.18, 0.17, 0.13, and 0.43 mJy at 3.6, 4.5, 5.7, and 7.9 m respectively). The values in Table 2 for G166-58 correspond to the signal after removal of this unwanted flux.
Two additional methods used to obtain the flux of G166-58 are discussed below, and a comparison of the fluxes obtained for the white dwarf by each method is shown in Table 3. First, the white dwarf and nearby galaxy were photometrically fitted and spatially deconvolved using daophot. Second, photometry was obtained by radial profile analysis of the white dwarf. Figure 9 displays overlaying and identical linear contour plots for 7.9 m images of G166-58 both before and after the removal of the nearby galaxy. The parameters from a 2.0 pixel gaussian radial profile fit (image centroid and full width at half maximum) of the white dwarf remain essentially unchanged by inclusion of the galaxy. Radial profile analysis of G166-58 at each IRAC channel yields a measurement for the white dwarf, via comparison with the radial profiles and fluxes of G29-38 and GD 362. Examination of G166-58 in a 7.9 m image where only the galaxy is fitted and subtracted reveals a clear point-like source and excess at the location of the white dwarf. In summary, Table 3 illustrates excellent agreement among the three photometric methods used to determine the flux of G166-58, with the exception of daophot at 3.6 m (which may be due to undersampled data, which is most germaine at this shortest wavelength.)
Further support that the two IRAC sources are separated photometrically is evidenced by their 5.7 to 7.9 m colors; the nearby galaxy has a flux ratio of 0.30, while the excess detected at G166-58 has a flux ratio of 0.46. Hence, with regards to the adjacent galaxy, there should be no doubt of its lack of influence in the white dwarf data presented.
The known density of background galaxies, along with the presence of the relatively bright nearby source on the IRAC chips, prompted an evaluation of the probability that yet another, hidden source could be contaminating flux measurements within the beam of G166-58 itself, and therefore be responsible for the m excess. The white dwarf is located at galactic latitude , hence any contaminating source would almost certainly be extragalactic in nature. To assess the probability of such a line of sight coincidence, the following estimations were made. The 7.9 m excess emission at G166-58 is about 0.07 mJy, or 14.9 mag. Spitzer IRAC 7.9 m source counts from Fazio et al. (2004b) indicate approximately 3,000 galaxies per magnitude per square degree at magnitude. Taking the distribution to be flat over a 0.5 magnitude interval centered at 15.0 mag, this yields around 1500 galaxies per square degree of appropriate brightness to reproduce the 7.9 m excess seen at G166-58. Because the white dwarf and its excess display a point-like nature at this wavelength (see Figure 9), any unresolved background source would have to lie within a small fraction of the IRAC beam width of G166-58 in the plane of the sky, certainly within an area of 2 square arcseconds, conservatively speaking. Therefore, the probability of finding a galaxy of 0.07 mJy brightness at 7.9 m within 2 square arcseconds of G166-58 is about 1 in 4300. The odds that 1 in 17 target stars is contaminated by such a background galaxy should then be around 1 in 250.
Therefore, the most likely explanation for the excess m emission at G166-58 is circumstellar dust associated with the white dwarf.
4.4.2 Circumstellar Dust
If the m IRAC fluxes are the sum of the white dwarf and another source, one can immediately rule out a cold companion. A substellar object with an energy distribution similar to that implied by the 400 K blackbody fit, would have a radius of roughly m, more than twice the size of Jupiter. Furthermore, the combined spectral energy distribution appears nothing like what might be expected from such an orbiting cold degenerate; it most notably lacks significant flux expected at 4.5 m (Farihi, Zuckerman, & Becklin, 2005; Burrows, Sudarsky, & Lunine, 2003). Therefore, the excess emission must be due to warm circumstellar material.
As a first stab at modeling the excess, one might invoke tidal dust rings similar to those which have been successful for both G29-38 and GD 362 (Jura et al., 2007; Jura, 2003). Following the formalism of Chiang & Goldreich (1997), a flat opaque ring (or disk) geometry, implies a dust grain temperature-radius relation given by
| (1) |
where , , , and are the temperature of the emitting grains, their distance from the star, the stellar effective temperature, and the stellar radius, respectively. If one assumes that G166-58 is a single, carbon-oxygen core white dwarf with log and K (Liebert, Bergeron, & Holberg, 2005), then its radius is (Bergeron, Saumon, & Wesemael, 1995). These stellar parameters yield a distance of to 400 K grains. If one assumes the ring extends to where the grain temperature is 200 K, then the ring would extend to . These inner and outer disk radii would be significantly larger than those implied for G29-38, where the ring probably does not extend much further than (around 30 stellar radii) for outer grain temperatures of K, which seem to fit the data in Figure 6 quite well. This is also true of the implied size of the tidal ring about GD 362, where models (Jura et al., 2007) also yield an outer radius (around 40 stellar radii).
Regarding the outer edge of the disk and an appropriate scale for the tidal breakup of a rocky body such as an asteroid or comet, Davidsson (1999) provides a thorough review and revision of effective Roche limits. The distance, , at which a small orbiting body will be disrupted by the gravitational field of a large body of radius , can be expressed, in simplified form, as
| (2) |
where and are the densities of the large and small bodies, and is a constant which typically has a value in the range , but can be smaller. The coefficient depends on the model, which may include factors such as; composition, heterogeneity, size, shape, rotation, orbital characterisitcs, shear and tensile strengths. The classical value of is for the case of a rotating, uniform, self-gravitating liquid in a circular orbit, whereas for a nonrotating, spherical satellite of solid rock or ice, the value becomes . This last approximation is likely to be valid for typical asteroids and comets with radii km, at least to within 50% (Davidsson, 1999; Boss, Cameron, & Benz, 1991). Taking g , which lies within the range of densities for both asteroids and comets ( g , g ; Binzel, Hanner, & Steel 2000), and calculating the average density of G166-58 with the parameters above, an estimate of the Roche limit using is . Hence, if an optically thick, flat ring orbits G166-58 at distances corresponding to 200 K dust grains, these would lie within a region consistent with tidal disruption of a minor planet. However, at grain temperatures of 100 K, the implied distance from G166-58 would be 2.4 , a region where asteroids or comets should remain intact, even if liquified (Roche, 1848).
Integrating the flux of the 400 K blackbody fit to the IRAC excess yields , while the stellar luminosity given by models for a hydrogen atmosphere white dwarf with K and log , yields (Bergeron, Saumon, & Wesemael, 1995). Together, these determine , which is logarithmically about midway between found for the main sequence A3 star Leporis, and for both G29-38 and GD 362 (Jura et al., 2007; Becklin et al., 2005; Reach et al., 2005a; Chen & Jura, 2001). Therefore, instead of invoking an optically thick, flat ring, it may be more appropriate to suppose an optically thin shell of blackbody grains in radiative equilibrium, whose distance is given by (Chen & Jura, 2001)
| (3) |
In this case, 400 K grains would be located near 2.3 , about 6 times further out than predicted by the opaque disk model and well beyond the Roche limit for large rocks. An advantage of this assumption is that it allows an estimation of the minimum dust mass contained in the disk. Because white dwarfs have masses , yet greatly reduced luminosities , radiation pressure on dust grains cannot compete with gravitational attraction. This can be seen by examining the ratio of these two forces, represented by the parameter
| (4) |
where is the dust particle radius and is the radiation pressure coupling coefficient (Artymowicz, 1988). Assuming the case of geometric optics, where the effective grain cross section equals its geometric cross section and , yields the maximum possible value for near m. For g , , , and hence gravitational forces dominate over radiation pressure. This simply serves to show that sub-micron size dust and gas particles could certainly be present at white dwarfs without any danger of being lost to radiation pressure. The minimum dust mass of an optically thin disk is approximately
| (5) |
Although both smaller and larger particles are almost certainly present, the size of the thermally emitting dust is on the order of m. Taking the density of silicate grains to be 2.5 g gives a rough lower limit to the mass of the the dust disk of g, a mass of a very large comet. While radiation pressure cannot remove dust at white dwarfs, drag forces can. The timescale for Poynting-Robertson removal of particles is given by (Burns, Lamy, & Soter, 1979)
| (6) |
For white dwarfs in general, the ratio for optically thin dust will be times smaller than for main sequence stars. Silicates of 1 m size and g orbiting G166-58 at 2.3 will be removed by the drag force in yr. The ratio increases to a maximum near m, implying removal timescales about 10 times more rapid. For smaller particles, the radiation coupling efficiency swiftly declines and this ratio decreases, levelling off near m at a value similar to that for 1 m grains (Artymowicz, 1988). Hence, in an optically thin disk, all particles up to 1 m in size should be removed by Poynting-Robertson drag within 500 yr. Assuming a present balance between accretion and diffusion with the above stellar parameters for G166-58, the rate at which it currently gains refractory circumstellar material is g (Koester & Wilkens 2006; where a factor of 0.01 has been included to reflect the absence of accreted hydrogen and helium). If this accretion occurs over a single diffusion timescale of yr, the total accreted mass would g, equivalent to the mass of a small solar system asteroid.
4.4.3 Double Degeneracy
Based on available data, it appears possible or perhaps likely that G166-58 is not a single white dwarf. Although this target was not listed in Table 2 of Zuckerman et al. (2003) for white dwarfs known or suspected to be in binary systems, they determine a low surface gravity of log via a combination of optical through near-infrared photometry and parallax. At 7400 K, contemporary white dwarf models predict that such a low surface gravity implies a radius , which is about 25% too large for a normal carbon-oxygen core degenerate (Bergeron, Saumon, & Wesemael, 1995). An inferred oversized radius and corresponding overluminosity can be explained either by a single, low mass, helium core degenerate or via binarity involving two components of similar ( mag) brightness – a double degenerate. Actually, the fact that G166-58 appears overluminous based on its spectral energy distribution and parallax has existed since the analysis of Bergeron, Leggett, & Ruiz (2001). There, using an essentially identical procedure, a low surface gravity of log was determined, carrying the same implication. The near-infrared measurements of both Zuckerman et al. (2003) and Bergeron, Leggett, & Ruiz (2001) agree to within their respective errors.
Because the implied overluminosity of G166-58 relies fairly heavily on its trigonometric parallax(es), a careful literature search was performed in order to assess all available astrometric data. The value employed by Bergeron, Leggett, & Ruiz (2001) comes from the most recent version of the Yale Parallax Catalog, and is given as (van Altena, Lee, & Hoffleit, 1995). The source of the Yale catalog parallax is the US Naval Observatory (H. C. Harris 2006, private communication), first published in Routly (1972) and then updated (and possibly revised) in Harrington & Dahn (1980). This parallax is given as and in their Table 1. McCook & Sion (2003) quote a value of while citing Routly (1972), but this is merely the relative (i.e. measured) parallax quoted above. Paying careful attention to detail, one can see the Yale and US Naval Observatory values are not identical, but reflect slightly different astrometric corrections to obtain the absolute parallaxes, with the Yale galactic model being more recent and likely more reliable. Therefore, the only existing parallax measurement for G166-58, upon which its overluminosity rests, is or pc.
Bergeron, Leggett, & Ruiz (2001) use this parallax for G166-58, together with its optical and near-infrared spectral energy distribution to deduce K, , and mag. However, fitting models to the slope and Balmer line profiles of an optical spectrum, Liebert, Bergeron, & Holberg (2005) determine a nearly identical temperature but log , , , and pc instead. This disparity still can be explained by the presence of another white dwarf which contributes the extra flux at , but not by a single low mass white dwarf with an overly large radius, which is inconsistent with the Balmer line profile fit. The apparent discrepancy might also be explained by supposing that G166-58 is located closer to 29 pc, which is near the 30.3 pc lower limit implied by the uncertainty in its parallax. Zuckerman et al. (2003) remark that radial velocity measurements in 1998 June, 1999 April and July agree within their errors and hence there is some weak evidence against radial velocity variability in G166-58. A DA or DC white dwarf companion at mag would dilute the Balmer lines and possibly redden the optical spectrum, depending on its effective temperature (Bergeron, Greenstein, & Liebert, 1990). It may be the case that such a companion should have already caused notice in the data analyzed by Liebert, Bergeron, & Holberg (2005), but nothing was noted.
Figure 4 appears to imply that a single temperature blackbody does not fit the optical and near-infrared data perfectly. In fact, there seems to be a slight near-infrared excess at , which would become more prominent if a higher temperature model were used to fit only. Yet the IRAC m data lie very close to the plotted blackbody, so perhaps there is another explanation for any apparent mismatch between model and published flux, such as data which are not photometric or calibration errors. In any case, follow up observations of G166-58 would help to evaluate the possibility that it may be a double degenerate. Specifically, a radial velocity study, a careful model analysis of its spectral energy distribution with accurate and precise photometry, or another trigonometric parallax measurement would all be useful.
4.4.4 Circumbinary Debris
Identification of a double degenerate suspect follows more or less as it does for main sequence stars; the object lies superior to its expected position in a Hertzsprung-Russell (or equivalent) diagram. This requires that the distance and effective temperature of the star are known or constrained in some fashion. For white dwarfs in the field, the nominal sequence is located near and about a radius corresponding to , or log for cool to warm white dwarfs (Bergeron, Leggett, & Ruiz, 2001, 1995c, 1992). A single target which lies above the log sequence can either be a single white dwarf responsible for the bulk of the luminosity via an overly large radius (and a comparably low mass and surface gravity), or a near equal brightness binary. Somewhat oxymoronically, single, low mass ( , helium core) white dwarfs are understood to be the end products of close binary evolution and more likely than not still attached to their stellar cannibals (Hansen & Phinney, 1998; Marsh, Dhillon, & Duck, 1995; Bergeron, Saffer, & Liebert, 1992). But a single white dwarf with low surface gravity will have appropriately thinned Balmer lines due to a reduction in Stark broadening, and this is not seen in G166-58 (Liebert, Bergeron, & Holberg, 2005). Therefore, if G166-58 is binary, it must be composed of two relatively normal mass white dwarfs of similar brightness.
Given the fact that several such double degenerate suspects have turned out to be bona fide (Farihi, Becklin, & Zuckerman, 2005; Zuckerman et al., 2003; Bergeron, Leggett, & Ruiz, 2001; Marsh, Dhillon, & Duck, 1995), it is appropriate to consider dust models which conform to this distinct possibility in addition to those above for a single white dwarf (see Table 4 for a summary of possible parameters). The average stellar parameters for G166-58 from the two analyses which utilize its trigonometric parallax, both of which find a similar overluminosity, are log , and K (Zuckerman et al., 2003; Bergeron, Leggett, & Ruiz, 2001). The resulting effective radiating surface for such a solution is (Bergeron, Saumon, & Wesemael, 1995). Applying the opaque, flat ring model and Equation (1) with these stellar parameters yields a distance of to 400 K grains. This is a valid model for a single, low mass white dwarf with the above large radius, but not for a binary. In short, it is not possible to fit two similar white dwarfs within such a tight disk while avoiding interactions (mass transfer) and at the same time maintaining relatively cool, and sufficiently distant 400 K grains. Additionally, there would be gravitational interactions between the binary and such a disk which would probably preclude a flat geometry. Returning to the optically thin case, Equation (3) places 400 K grains at 2.7 . With some adjustment of parameters, this scenario allows ample space for a double degenerate to orbit without interaction (Morales-Rueda et al., 2005), and sufficient distance from the binary in order to maintain 400 K dust.
Observations of G166-58 with the Fine Guidance Sensors aboard the Hubble Space Telescope show that it is spatially unresolved to approximately (E. P. Nelan 2006, private communication). This precludes separations wider than 0.3 AU or 60 , yet still permits binarity with dust located at one white dwarf component.
4.5 Metal-Rich Double Degenerates
In Table SPITZER IRAC OBSERVATIONS OF WHITE DWARFS. I. WARM DUST AT METAL-RICH DEGENERATES, there are three confirmed or suspected double degenerates: G77-50, EC 1124293, G166-58. These white dwarfs are relisted in Table SPITZER IRAC OBSERVATIONS OF WHITE DWARFS. I. WARM DUST AT METAL-RICH DEGENERATES together with their divergent spectroscopic and photometric parameters. In light of the potential binarity of G166-58, a brief focus on the other similar systems is appropriate.
G77-50. This white dwarf has a recent parallax measurement from Smart et al. (2003) of over a 6.2 yr baseline, placing it firmly at pc. Thus, its derived spectroscopic parameters in Table SPITZER IRAC OBSERVATIONS OF WHITE DWARFS. I. WARM DUST AT METAL-RICH DEGENERATES, which consist of a good determination from optical and near-infrared photometry, but only a crude log estimate from a rough fit to a weak H feature (Bergeron, Ruiz, & Leggett, 1997), are not consistent with the astrometric distance. As can be seen in the Table, the relatively low spectroscopic log value makes G77-50 appear underluminous; this is atypical as overluminosity is the signpost of binarity. This discrepancy is resolved by presuming the H profile examined by Bergeron, Ruiz, & Leggett (1997) is due to two velocity-shifted lines (indeed the line profile shown in Figure 23 of Bergeron, Ruiz, & Leggett (1997) appears asymmetric) or perhaps weak magnetism which also causes Balmer line broadening and mutation in cool white dwarfs where the lines are already weak (Zuckerman et al., 2003; Bergeron, Leggett, & Ruiz, 2001, 1997). Its binarity has been almost certainly confirmed via the detection of two Ca lines with disparate velocities, observed at two epochs with both lines revealing individual velocity varation (Zuckerman et al., 2003). Therefore, G77-50 is a double degenerate in which both components are metal-rich, one or both of which have detectable hydrogen lines. For equally luminous components, models predict (log ), and mag for K hydrogen atmosphere white dwarfs. Since both components are polluted with metals, only accretion from circumbinary or interstellar material is consistent with the observations and a circumstellar origin can be ruled out. Koester et al. (2005) lists this system as helium-rich based on the absence of H (D. Koester 2007, private communication)
EC 1124293. The parallax reported in Bergeron, Leggett, & Ruiz (2001) is an unpublished trigonometric measurement (M. T. Ruiz 2006, private communication) of which implies a very low mass white dwarf or a binary (or both), if accurate. The difference in the absolute magnitudes of the spectroscopic ( mag) and photometric ( mag) parameter determinations implies an extra source with mag which is obviously much brighter than an equally luminous companion to the spectroscopically identified star. Therefore, either the system contains a very low mass DZ white dwarf with a proportionally large radius so that it dominates the binary spectral energy distribution, or the trigonometric parallax is inaccurate. Given the spectroscopic analysis of Koester et al. (2001), which yields a very normal 0.6 DA white dwarf, it is difficult to currently reconcile this system as binary. Radial velocity measurements by Zuckerman et al. (2003) in 1998 December and 1999 April agree within the errors and give a gravitational redshift corrected velocity of km for the H line (no errors are given, but are likely no greater than a few km ), while similar measurements reported by Pauli et al. (2006, 2003) yield km (no epoch given).
Zuckerman et al. (2003) find narrow to damning evidence of binarity at some known or suspected double degenerates (Bergeron, Leggett, & Ruiz, 2001, 1997) such as: broad H cores (e.g. G141-2, Case 2), presumably from two velocity-shifted yet unresolved cores; two separate H cores (e.g. G271-115, G77-50); and a single, variable H core (e.g. LHS 1549). Two of these have been confirmed as binary by other methods: G141-2 has been spatially resolved with the Hubble Fine Guidance Sensors (E. P. Nelan 2006, private communication) and radial velocity monitoring of LHS 1549 has determined its orbital period (Nelemans et al., 2005).
4.6 PG 0235064
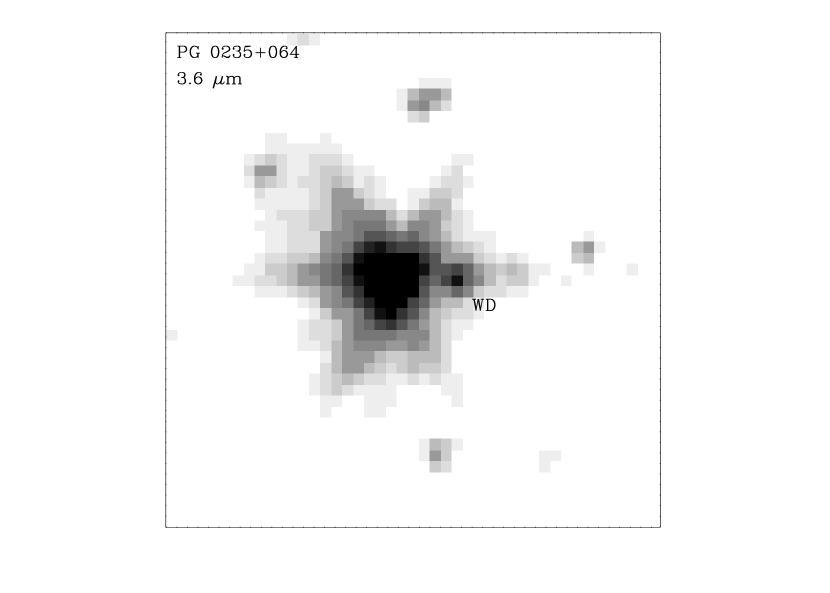
The IRAC photometry of this target was problematic due to a nearby M dwarf common proper motion companion which is reported here for the first time. The companion, PG 0235064B, is separated from the white dwarf primary by at in the IRAC 3.6 m image (epoch 2005.6), shown in Figure 10. Examining archival images from 2MASS, and the DSS reveals separations and position angles between the A and B components which remain essentially constant between 1950 and 2001. Blinking the 1950 and 1990 DSS frames clearly shows the pair moving together over 40 yr. The USNO-B1.0 catalog has at for the white dwarf (Monet et al., 2003), which would have caused the pair to separate by almost over the last 55 yr if the secondary were background. Hence the pair is bound.
PG 0235064B has reliable 2MASS photometry consistent with an early M dwarf which has very likely contaminated some previously published photometry and spectroscopy of the white dwarf, even as far as the blue optical region, causing it to appear too cool (red) (Zuckerman et al., 2003; Green, Schmidt, & Liebert, 1986). Figure 1 shows K (DA3.4) provides a better fit to the white dwarf data (Bergeron, Wesemael, & Beauchamp, 1995) than previously published, lower effective temperatures corresponding to DA4.4 and DA8 (Homeier et al., 1998; Green, Schmidt, & Liebert, 1986). The shorter wavelength photometric data in Figure 1 were selected as to be minimally, or not at all contaminated by the cool companion: from Green, Schmidt, & Liebert (1986); from Skrutskie et al. (2006); and from Kilic et al. (2006). Assuming log , very close to that determined by Homeier et al. (1998) from a spectrum likely to be contaminated by the M dwarf, the white dwarf would lie at pc. Using the Hubble GSC2.2 (Space Telescope Science Institute, 2001) blue and red magnitudes, one can estimate mag and for the red dwarf. This corresponds to a spectral type near M3 and agrees reasonably well with the expected absolute magnitude of mag at the estimated white dwarf distance (Kirkpatrick & McCarthy, 1994).
For all of the IRAC images, the task daophot was used in an attempt to remove the light of the M dwarf, but it was found that this generally oversubtracted its flux in the region of the white dwarf, and combined with the mag difference in brightness between components, proved unreliable. Instead, the symmetry of the point spread function was exploited to self-subtract the flux on the opposite side of the M dwarf at the location of the white dwarf, introducing an additional error component equal to the square root of the percent flux removed.
5 DISCUSSION AND CONCLUSIONS
Although a survey of only 17 stars does not allow robust statistics, it is clear that the majority of DAZ white dwarfs do not harbor warm dust of sufficient emitting surface area to be detected with IRAC. If most or all of these stars do host circumstellar material, the fractional luminosities must be relatively low compared to currently known dusty white dwarfs. This could result from a modest amount of dust (as in the zodiacal cloud), large particle sizes, or cooler material further from the star.
Another possibility is that any warm dust produced within the Roche limit of a white dwarf is swiftly destroyed through mutual collisions, not unlike ice in a blender, as it orbits with Keplerian velocities near . In optically thin disks, particles with orbital period will collide on a timescale given by . The tidal rings at G29-38 and GD 362 have been modeled to extend from approximately , where a typical orbital period is only hr and the resulting collision timescale for is dy. If a sizeable fraction of dust produced in a tidal disruption event is initially optically thin, then both collisions and Poynting-Robertson drag will compete to quickly annihilate this material. The ratio of these two timescales for dust particles orbiting a distance from a star of mass can be written as
| (7) |
where and are in solar units, is in AU, is in g , and is in microns. This fraction reaches a minimum for 0.1 m grains with 1 g at the inner disk edge, and yields for all possible white dwarf disk parameters. Table 6 gives minimum values for at the inner edges of the disks at G29-38, GD 362, and G166-58. Therefore collisions will erode dust grains faster than they can be removed by angular momentum loss. This is also true in the case of optically thick disks where: 1) the bulk of material is shielded from starlight, and hence the Poynting-Robertson effect is diminished, and 2) the collision timescale is less than half the orbital period (Esposito, 1993). Hence, for a wide range of disk densities, it is plausible that mutual collisions within an evolving dust ring at a typical white dwarf will result in the relatively rapid self-annihilation of the micron size grains required to radiate efficiently at m.
Following the tidal disruption of an asteroid, if one models the dust produced as a collisional cascade, the expected particle size distribution behaves classically as (Dohnanyi, 1969). For dust at main sequence stars, this distribution is reshaped on short timescales as sub-micron size grains are removed by radiation pressure which, as shown above, does not apply in the case of white dwarfs. In the absence of radiation pressure, the average particle in will have a size . For practical purposes, at white dwarfs one can assume m, where particles are already inefficient absorbers and emitters of infrared radiation, and anything smaller approaches the size of gas molecules and atoms. With such a distribution of extant dust, 99.7% of the particles will have sizes m, leaving a paltry fraction of larger particles which could effectively support infrared emission from the disk. Clearly, such small particles and gas might be present at most or all white dwarfs which show signs of circumstellar accretion such as the DAZ stars.
On the other hand, the persistence of warm dust disks at several white dwarfs (Jura, Farihi, & Zuckerman, 2007) must be explained despite the fact that in some or most cases where it is produced, it may also be efficiently destroyed. One possibility is that the disk density (which could contain gas) becomes sufficiently high as to damp out collisions in the disk and also make it optically thick, thus somewhat protecting it from self-erosion and drag forces simultaneously. The evolution of such a dense, fluid-like ring is then dominated by viscous forces (differential rotation and random motions) which cause it to spread, losing energy in the process (Esposito, 1993). The maximum lifetime of such a ring occurs at minimum viscosity
| (8) |
where is the radial extent of the ring and is the surface mass density (Esposito, 1993). If the mass of a large solar system asteroid, g, were spread into a tidal ring of negligible height ( m), a radial extent , consisting of micron size particles orbiting a typical white dwarf, the resulting volume mass density (0.55 g ) would be sufficiently high that the mean free path of particles is on the same order as their size. This could effectively damp out collisions, thus minimizing viscosity, and with a resulting surface mass density of g , permit a potential disk lifetime – in the absence of competing forces – longer than the Gyr white dwarf cooling timescales. However, for sustained accretion rates as low as g , a g disk would become fully consumed within several Myr.
Large rocks and colder material orbiting at will be unaffected by any of the aforementioned processes, and such a reservoir of material is strictly necessary to supply some fraction of DAZ white dwarfs with photospheric metals, regardless of circumstellar dust production (collisional versus tidal) and evolution (persistence versus destruction).
The overall number of white dwarfs with remnant planetesimal belts may be rather high based on a growing number of detections. If one takes 12% (§4.1) as the fraction of DAZ stars with circumstellar dust as observed by Spitzer to date, 20% as the fraction of DAZ stars among cool DA white dwarfs (Zuckerman et al., 2003), and 80% as the number of cool DA stars among all white dwarfs in the field (Eisenstein et al., 2006), then a lower limit to the number of white dwarfs with asteroid-type belts is at least 2%. This fraction could be as high as 20% if the majority of metal-rich white dwarfs harbor circumstellar matter, which raises important questions about the implied frequency of planetesimal belts around main-sequence stars and the current detection rate (see the Appendix of Jura 2006).
Owing to their low luminosities, white dwarfs which may have been polluted by heavy elements in winds or transferred material from substellar companions (Debes, 2006; Dobbie et al., 2005; Zuckerman et al., 2003; Sion & Starrfield, 1984) are easily identified with IRAC observations (Mullally et al., 2007; Hansen, Kulkarni, & Wiktorowicz, 2006; Farihi, Becklin, & Zuckerman, 2005, 2005) down to T dwarf temperatures. There is no evidence of such companions in the data presented here, ruling out all but the coldest brown dwarfs, active planets and moons as close orbiting, companion-like polluters (Farihi et al. 2008, in preparation).
References
- Aannestad et al. (1993) Aannestad, P. A., Kenyon, S. J., Hammond, G. L., & Sion, E. M. 1993, AJ, 105,1033
- Aannestad & Sion (1985) Aannestad, P. A., & Sion, E. M. 1985, AJ, 90, 1832
- Adams (1914) Adams, W. S. 1914, PASP, 26, 198
- Adams (1915) Adams, W. S. 1915, PASP, 27, 236
- Adelman-McCarthy et al. (2007) Adelman-McCarthy, J. K. 2007, ApJS, 172, 634
- Allamandola et al. (1989) Allamandola, L. J., Tielens, A. G. G. M., & Barker, J. R. 1989, ApJS, 71, 733
- Alcock et al. (1986) Alcock, C., Fristrom, C. C., & Siegelman, R. 1986, ApJ, 302, 462
- Alcock & Illarionov (1980) Alcock, C., & Illarionov, A. 1980, ApJ, 235, 534
- Artymowicz (1988) Artymowicz, P. 1988, ApJ, 335, L82
- Baas et al. (1986) Baas, F., Geballe, T. R., & Walther, D. M. 1986, ApJ, 311, L97
- Bakos et al. (2002) Bakos, G. A., Sahu, K. C., & Nemeth P. 2002, ApJS, 141, 187
- Baraffe et al. (2003) Baraffe, I., Chabrier, G., Barman, T. S., Allard, F., & Hauschildt, P. H. 2003, A&A, 402, 701
- Becklin, & Zuckerman. (1988) Becklin, E. E., & Zuckerman, B. 1988, Nature, 336, 656
- Becklin et al. (2005) Becklin, E. E., Farihi, J., Jura, M., Song, I., Weinberger, A. J., & Zuckerman, B. 2005, ApJ, 632, L119
- Beichman et al. (2006) Beichman, C. A., et al. 2006, ApJ, 639, 1166
- Beintema et al. (1996) Beintema, D. A., et al. 1996, A&A, 315, L369
- Bergeron et al. (1990) Bergeron, P., Greenstein, J. L., & Liebert, J. 1990, ApJ, 361, 190
- Bergeron et al. (2001) Bergeron, P., Leggett, S. K., & Ruiz, M. T. 2001, ApJS, 133, 413
- Bergeron et al. (1995c) Bergeron, P., Liebert, J., & Fullbright, M. S. 1995c, ApJ, 444, 810
- Bergeron et al. (1997) Bergeron, P., Ruiz, M. T., & Leggett, S. K. 1997, ApJS, 108, 339
- Bergeron et al. (1992) Bergeron, P., Saffer, R. A., & Liebert, J. 1992, ApJ, 394, 228
- Bergeron et al. (1995) Bergeron, P., Saumon, D., & Wesemael, F. 1995, ApJ, 443, 764
- Bergeron et al. (1995) Bergeron, P., Wesemael, F., & Beauchamp, A. 1995, PASP, 107, 1047
- Binzel et al. (2000) Binzel, R. P., Hanner, M. S., & Steel, D. I. 2000, in Allen’s Astrophysical Quantities, ed. Cox, A. N. ( ed.; New York: AIP Press; Springer), 315
- Bockelée-Morvan et al. (1995) Bockelée-Morvan, D., Brooke, T. Y., & Crovisier, J. 1995, Icarus, 116, 18
- Boss et al. (1991) Boss, A. P., Cameron, A. G. W., & Benz, W. 1991, Icarus, 92, 165
- Brooke et al. (1991) Brooke, T. Y., Tokunaga, A. T., & Knacke, R. F. 1991, AJ, 101, 268
- Bues (1970) Bues, I. 1970, A&A, 7, 91
- Burns et al. (1979) Burns, J. A., Lamy, P. L., & Soter, S. 1979, Icarus, 40, 1
- Burrows et al. (2003) Burrows, A., Sudarsky, D., & Lunine, J. I. 2003, ApJ, 596, 587
- Carey (2006) Carey, S. 2006, Spitzer Calibration Workshop, (Pasadena: SSC)
- Chary et al. (1999) Chary, R., Zuckerman, B., & Becklin, E. E. 1999, in the Universe as Seen by ISO, ed. P. Cox & M. F. Kessler (Noordwijk: ESA/ESTEC), 289
- Chayer et al. (1995) Chayer, P., Fontaine, G., & Wesemael, F. 1995, ApJS, 99, 189
- Chen & Jura (2001) Chen, C. H., & Jura, M. 2001, ApJ, 560, L171
- Chiang & Goldreich (1997) Chiang, E. I., & Goldreich, P. 1997, ApJ, 490, 368
- Crovisier et al. (1997) Crovisier, J., Leech, K., Bockelée-Morvan, D., Brooke, T. Y., Hanner, M. S., Altieri, B., Keller, H. U., & Lellouch, E. 1997, Science, 275, 1904
- Davidsson (1999) Davidsson, B. J. R. 1999, Icarus, 142, 525
- Debes & Sigurdsson (2002) Debes, J. H., & Sigurdsson, S. 2002, ApJ, 572, 556
- Debes (2006) Debes, J. H. 2006, ApJ, 652, 636
- DENIS Consortium (2005) DENIS Consortium. 2005 The DENIS Database, Release (Strasbourg: CDS)
- Dobbie et al. (2005) Dobbie, P. D., Burleigh, M. R., Levan, A. J., Barstow, M. A., Napiwotzki, R., Holberg, J. B., Hubeny, I., & Howell, S. B. 2005, MNRAS, 357, 1049
- Dohnanyi (1969) Dohnanyi, J. W. 1969, JGR, 74, 2531
- Draine (2003) Draine, B. T. 2003, ARA&A, 41, 241
- Dupuis et al. (1992) Dupuis, J., Fontaine, G., Pelletier, C., & Wesemael, F. 1992, ApJS, 82, 505
- Dupuis et al. (1993) Dupuis, J., Fontaine, G., Pelletier, C., & Wesemael, F. 1993, ApJS, 84, 73
- Dupuis et al. (1993) Dupuis, J., Fontaine, G., & Wesemael, F. 1993, ApJS, 87, 345
- Eggen & Greenstein (1965) Eggen, O. J., & Greenstein, J. L. 1965, ApJ, 141, 83
- Eisenstein et al. (2006) Eisenstein, D. J., et al. 2006, AJ, 132, 676
- Esposito (1993) Esposito, L. W. 1993, AREPS, 21, 487
- Farihi (2004) Farihi, J. 2004, Ph.D. Thesis, UCLA
- Farihi et al. (2005) Farihi, J., Becklin, E. E., & Zuckerman, B. 2005, ApJS, 161, 394
- Farihi & Christopher (2004) Farihi, J., & Christopher, M. 2004, AJ, 128, 1868
- Farihi et al. (2006) Farihi, J., Hoard, D. W., & Wachter, S. 2006, ApJ, 646, 480
- Farihi et al. (2005) Farihi, J., Zuckerman, B., & Becklin, E. E. 2005, AJ, 130, 2237
- Farihi et al. (2007) Farihi, J., Zuckerman, B., Becklin, E. E., & Jura, M. 2007, Proceedings of the European Workshop on White Dwarfs, eds. M. R. Burleigh & R. Napiwotzki (San Francisco: ASP)
- Fazio et al. (2004) Fazio, G. G., et al. 2004, ApJS, 154, 10
- Fazio et al. (2004b) Fazio, G. G., et al. 2004b, ApJS, 154, 39
- Finley et al. (1997) Finley, D. S., Koester, D., & Basri, G. 1997, ApJ, 488, 375
- Fontaine & Michaud (1979) Fontaine, G., & Michaud, G. 1979, ApJ, 231, 826
- Fontaine & Van Horn (1976) Fontaine, G., & Van Horn, H. M. 1976, ApJS, 31, 467
- Geballe et al. (1985) Geballe, T. R., Lacy, J. H., Persson, S. E., McGregor, P. J., & Soifer, B. T. 1985, ApJ, 292, 500
- Geballe et al. (1989) Geballe, T. R., Tielens, A. G. G. M., Allamandola, L. J., Moorhouse, A., & Brand, P. W. J. L. 1989, ApJ, 341, 278
- Geballe et al. (1992) Geballe, T. R., Tielens, A. G. G. M., Kwok, S., & Hrivnak, B. J. 1992, ApJ, 387, L89
- Gianninas et al. (2004) Gianninas, A., Dufour, P., & Bergeron, P. 2004, ApJ, 617, L57
- Glass (1999) Glass, I. S. 1999, Handbook of Infrared Astronomy, (Cambridge; New York: Cambridge University Press)
- Graham et al. (1990) Graham, J. R., Matthews, K., Neugebauer, G., & Soifer, B. T. 1990, ApJ, 357, 216
- Green et al. (1986) Green, R. F., Schmidt, M., & Liebert, J. 1986, ApJS, 61, 305
- Grenfell (1974) Grenfell, T. C. 1974, A&A, 31, 303
- Hansen et al. (2006) Hansen, B. M. S., Kulkarni, S., & Wiktorowicz, S. 2006, AJ, 131, 1106
- Hansen & Phinney (1998) Hansen, B. M. S., & Phinney, E. S. 1998, MNRAS, 294, 557
- Harrington & Dahn (1980) Harrington, R. S., & Dahn, C. C. 1980, AJ, 85, 454
- Hines et al. (2006) Hines, D. C. et al. 2006, ApJ, 638, 1070
- Hodapp et al. (2003) Hodapp, K. W., et al. 2003, PASP, 115, 1388
- Holberg et al. (1997) Holberg, J. B., Barstow, M. A., & Green, E. M. 1997, ApJ, 474, L127
- Homeier et al. (1998) Homeier, D., Koester, D., Hagen, H. J., Jordan, S., Heber, U., Engels, D., Reimers, D., & Dreizler, S. 1998, A&A, 338, 563
- Houck et al. (2004) Houck, J. R., et al. 2004, ApJS, 154, 18
- Joblin et al. (1997) Joblin, C., Boissel, P., & de Parseval, P. 1997, Planet. Space Sci., 45, 1539
- Jura (2003) Jura, M. 2003, ApJ, 584, L91
- Jura (2006) Jura, M. 2006, ApJ, 653, 613
- Jura et al. (2007) Jura, M., Farihi, J., Zuckerman, B., & Becklin, E. E. 2007, AJ, 133, 1927
- Jura et al. (2007) Jura, M., Farihi, J., & Zuckerman, B. 2007, ApJ, 663, 1285
- Kilic et al. (2005) Kilic, M., von Hippel, T., Leggett, S. K., & Winget, D. E. 2005, ApJ, 632, L115
- Kilic et al. (2006) Kilic, M., von Hippel, T., Leggett, S. K., & Winget, D. E. 2006, ApJ, 646, 474
- Kirkpatrick & McCarthy (1994) Kirkpatrick, J. D., & McCarthy, D. W. 1994, AJ, 107, 333
- Koester & Wilken (2006) Koester, D., & Wilken, D. 2006, A&A, 453, 1051
- Koester et al. (1997) Koester, D., Provencal, J., & Shipman, H. L. 1997, A&A, 230, L57
- Koester et al. (2005) Koester, D., Rollenhagen, K., Napiwotzki, R., Voss, B., Homeier, D., & Reimers, D. 2005, A&A, 432, 1025
- Koester et al. (2001) Koester, D., et al. 2001, A&A, 378, 556
- Lacombe et al. (1983) Lacombe, P., Wesemael, F., Fontaine, G., & Liebert, J. 1983, ApJ, 272, 660
- Laureijs et al. (2002) Laureijs, R. J., Jourdain de Muizon, M., Leech, K., Siebenmorgen, R., Dominik, C., Habing, H. J., Trams, N., & Kessler, M. F. 2002, A&A, 387, 285
- Leggett et al. (1998) Leggett, S. K., Ruiz, M. T., & Bergeron, P. 1998, ApJ, 497, 294
- Liebert et al. (2005) Liebert, J., Bergeron, P., & Holberg, J. B. 2005, ApJS, 156, 47
- Luyten (1979) Luyten, W. J. 1979, LHS Catalogue, ed. (Minneapolis: University of Minnesota)
- Malfait et al. (1998) Malfait, K., Waelkens, C., Waters, L. B. F. M., Vandenbussche, B., Huygen, E., & de Graauw, M. S. 1998, A&A, 332, L25
- Marsh et al. (1995) Marsh, T. R., Dhillon, V. S., & Duck, S. R. 1995, MNRAS, 275, 828
- Mermilliod (1986) Mermilliod, J. C. 1986, Catalog of Eggen’s UBV Data (Strasbourg: CDS)
- McCook & Sion (2003) McCook, G. P., & Sion, E. M. 2003, Spectroscopically Identified White Dwarfs (Strasbourg: CDS)
- Monet et al. (2003) Monet, D., et al. 2003, AJ, 125, 984
- Morales-Rueda et al. (2005) Morales-Rueda, L., Marsh, T. R., Maxted, P. F. L., Nelemans, G., Karl, C., Napiwotzki, R., & Moran, C. K. J. 2005, MNRAS, 359, 648
- Muchmore (1984) Muchmore, D. 1984, ApJ, 278, 769
- Mullally et al. (2007) Mullally, F., Kilic, M., Reach, W. T., Kuchner, M., von Hippel, T., Burrows, A., & Winget, D. E. 2007, ApJS, 171, 206
- Mumma et al. (2001) Mumma, M. J., et al. 2001, ApJ, 546, 1183
- Nelemans et al. (2005) Nelemans, G., et al. 2005, A&A, 440, 1087
- Paquette et al. (1986) Paquette, C., Pelletier, C., Fontaine, G., & Michaud, G. 1986, ApJS61, 197
- Parriott & Alcock (1998) Parriott, J., & Alcock, C. 1998, ApJ, 501, 357
- Patterson et al. (1991) Patterson, J., Zuckerman, B., Becklin, E. E., Tholen, D. J., & Hawarden, T. 1991, ApJ, 374, 330
- Pauli et al. (2006) Pauli, E. M., Napiwotzki, R., Heber, U., Altmann, M., & Odenkirchen, M. 2006, A&A, 447, 173
- Pauli et al. (2003) Pauli, E. M., Napiwotzki, R., Altmann, M., Heber, U., Odenkirchen, M., & Kerber, F. 2003, A&A, 400, 877
- Probst (1983) Probst, R. 1983, ApJS, 53, 335
- Reach et al. (2005a) Reach, W. T., Kuchner, M. J., von Hippel, T., Burrows, A., Mulally, F., Kilic, M., & Winget, D. E. 2005a, ApJ, 635, L161.
- Reach et al. (2005b) Reach, W. T., et al. 2005b, PASP, 117, 978
- Rieke et al. (2004) Rieke, G., et al. 2004, ApJS, 154, 25
- Roche (1848) Roche, É. 1848, La figure d’une masse fluide soumise à l’attraction d’un point éloigné, Académie des sciences de Montpellier, Vol. 1, 243
- Routly (1972) Routly, P. M. 1972, Publications of the US Naval Observatory XX, Part VI
- Salim & Gould (2003) Salim, S., & Gould, A. 2003, ApJ, 582, 1011
- Schatzman (1958) Schatzman, E. L. 1958, White Dwarfs, (Amsterdam: North-Holland; New York: Interscience)
- Shapiro & Teukolsky (1983) Shapiro, S. L., & Teukolsky, S. A. 1983, Black Holes, White Dwarfs, and Neutron Stars: The Physics of Compact Objects (New York: Wiley-Interscience)
- Shipman (1986) Shipman, H. L. 1986, in Astrophysics of Brown Dwarfs, eds. M. C. Kafatos, R. S. Harrington, & S. P. Maran, (Cambridge; New York: Cambridge University Press), 71
- Shipman (1972) Shipman, H. L. 1972, ApJ, 177, 723
- Silverstone et al. (2006) Silverstone, M. D., et al. 2006, ApJ, 639, 1138
- Sion et al. (1983) Sion, E. M., Greenstein, J. L., Landstreet, J. D., Liebert, J., Shipman, H. L., & Wegner, G. A. 1983, ApJ, 269, 253
- Sion et al. (1990) Sion, E. M., Hammond, G. L., Wagner, R. M., Starrfield, S. G., & Liebert, J. 1990, ApJ, 362, 691
- Sion & Starrfield (1984) Sion, E. M., & Starrfield, S. G. 1984, ApJ, 286, 760
- Skrutskie et al. (2006) Skrutskie, M. F., et al. 2006, AJ, 131, 1163
- Smart et al. (2003) Smart, R. L., et al. 2003, A&A, 404, 317
- Song et al. (2005) Song, I., Zuckerman, B., Weinberger, A. J., & Becklin, E. E. 2005, Nature, 436, 363
- Space Telescope Science Institute (2001) Space Telescope Science Institute 2001, The Guide Star Catalog Version 2.2, (Baltimore: STScI)
- Spitzer Science Center (2006) Spitzer Science Center. 2006, IRAC Data Handbook Version 3.0 (Pasadena: SSC)
- Telesco et al. (1990) Telesco, C. M., Joy, M., & Sisk, C. 1990, ApJ, 358, L21
- Tokunaga (2000) Tokunaga, A. T. 2000, in Allen’s Astrophysical Quantities, ed. Cox, A. N. ( ed.; New York: AIP Press; Springer), 143
- Tokunaga et al. (1990) Tokunaga, A. T., Becklin, E. E., & Zuckerman, B. 1990, ApJ, 358, L17
- Tremblay & Bergeron (2007) Tremblay, P. E., & Bergeron, P. 2007, ApJ, 657, 1013
- van Altena et al. (1995) van Altena, W. F., Lee, J. T., & Hoffleit, E. D. 1995, The General Catalogue of Trigonometric Stellar Parallaxes, ed. (New Haven: Yale University Observatory)
- van Maanen (1917) van Maanen, A. 1917, PASP, 29, 258
- van Maanen (1919) van Maanen, A. 1919, PASP, 31, 42
- von Hippel et al. (2007) von Hippel, T., Kuchner, M. J., Kilic, M., Mullaly, F., & Reach, W. T. 2007, ApJ, 662, 544
- Vauclair et al. (1979) Vauclair, G., Vauclair, S., & Greenstein, J. L. 1979, A&A, 80, 79
- Vennes (1999) Vennes, S. 1999, ApJ, 525, 995
- Vennes et al. (1997) Vennes, S., Thejll, P. A., Galvan, R. G., & Dupuis, J. 1997, ApJ, 480, 714
- Vennes et al. (1996) Vennes, S., Thejll, P. A., Wickramasinghe, D. T., Bessell, M. S. 1996, ApJ, 467, 782
- Wachter et al. (2003) Wachter, S., Hoard, D. W., Hansen, K. H., Wilcox, R. E., Taylor, H. M., & Finkelstein, S. L. 2003, ApJ, 586, 1356
- Wegner (1972) Wegner, G. 1972, ApJ, 172, 451
- Wehrse (1975) Wehrse, R. 1975, A&A, 39, 169
- Weidemann (1960) Weidemann, V. 1960, ApJ, 131, 638
- Werner et al. (2004) Werner, M. W., et al. 2004, ApJS, 154, 1
- Wesemael et al. (1993) Wesemael, F., Greenstein, J. L., Liebert, J., Lamontagne, R., Fontaine, G., Bergeron, P., & Glaspey, J. W. 1993, PASP, 105, 761
- Wolff et al. (2002) Wolff, B., Koester, D., & Liebert, J. 2002, A&A, 385, 995
- Zuckerman (2001) Zuckerman B. 2001, ARA&A, 39, 549
- Zuckerman & Becklin (1987a) Zuckerman, B., & Becklin, E. E. 1987a, ApJ, 319, 99
- Zuckerman & Becklin (1987b) Zuckerman, B., & Becklin, E. E. 1987b, Nature, 330, 138
- Zuckerman et al. (2003) Zuckerman, B., Koester, D., Reid, I. N., & Hünsch, M. 2003, ApJ, 596, 477
- Zuckerman & Reid (1998) Zuckerman, B., & Reid, I. N. 1998, ApJ, 505, L143
| WD | Name | (K) | (mag) | [Ca/H] | References |
|---|---|---|---|---|---|
| 0032175 | G266-135 | 9240 | 14.94 | -10.20 | 1,2 |
| 0235064 | PG | 15000 | 15.5 | -9.03 | 1,3 |
| 0322019 | G77-50 | 5220 | 16.12 | -11.36 | 1,4 |
| 0846346 | GD 96 | 7370 | 15.71 | -9.41 | 1,5 |
| 1102183 | EC | 8060 | 15.99 | -10.43 | 1,5 |
| 1124293 | EC | 9680 | 15.02 | -8.53 | 1,4,6 |
| 1204136 | EC | 11500 | 15.67 | -7.72 | 1,7 |
| 1208576 | G197-47 | 5880 | 15.78 | -10.96 | 1,8 |
| 1344106 | G63-54 | 7110 | 15.12 | -11.13 | 1,8 |
| 1407425 | PG | 10010 | 15.03 | -9.87 | 1,9 |
| 1455298 | G166-58 | 7390 | 15.60 | -9.31 | 1,8,9 |
| 1632177 | PG | 10100 | 13.05 | -10.75 | 1,9 |
| 1633433 | G180-63 | 6690 | 14.84 | -8.63 | 1,8,9 |
| 1729371 | GD 362 | 10500 | 16.23 | -5.1 | 7,10 |
| 1826045 | G21-16 | 9480 | 14.58 | -8.83 | 1,8 |
| 1858393 | G205-52 | 9470 | 15.63 | -7.84 | 1,5 |
| 2326049 | G29-38 | 11600 | 13.04 | -6.93 | 1,5 |
References. — (1) Zuckerman et al. 2003; (2) Mermilliod 1986; (3) This work; (4) Bergeron, Ruiz, & Leggett 1997; (5) McCook & Sion 2003; (6) Koester et al. 2001; (7) Salim & Gould 2003; (8) Bergeron, Leggett, & Ruiz 2001; (9) Liebert, Bergeron, & Holberg 2005; (10) D. Koester 2007, private communication)
| WD | (Jy) | (Jy) | (Jy) | (Jy) | Pipeline |
|---|---|---|---|---|---|
| 0032175 | 11.0 | ||||
| 0235064 | 12.4 | ||||
| 0322019 | 12.4 | ||||
| 0846346 | 10.5 | ||||
| 1102183 | 11.0 | ||||
| 1124293 | 12.4 | ||||
| 1204136 | 12.4 | ||||
| 1208576 | 11.0 | ||||
| 1344106 | 12.4 | ||||
| 1407425 | 12.4 | ||||
| 1455298 | 12.4 | ||||
| 1632177 | 11.4 | ||||
| 1633433 | 11.4 | ||||
| 1729371 | 12.4 | ||||
| 1826045 | 12.4 | ||||
| 1858393 | 10.5 | ||||
| 2326049 | 14.0 |
Note. — Error calculations, including both photometric measurements and instrumental uncertainties are described in §3.2.
| Method | (Jy) | (Jy) | (Jy) | (Jy) |
|---|---|---|---|---|
| 1aaAperture photometry. | ||||
| 2bbPoint spread function fitting (daophot) photometry. | ||||
| 3ccRadial profile analysis. |
Note. — See §4.4.1 for a detailed description of the methods used to account for and eliminate any and all flux from the nearby galaxy.
| Disk Type | log | () | () | () |
|---|---|---|---|---|
| Circumstellar | 7.97 | 0.0132 | 0.38 | 2.3 |
| Circumbinary | 7.62 | 0.0163 | 0.47aaA close binary surrounding by a flat optically thick disk is not physically possible (§4.4.4). | 2.7 |
Note. — In the case of a wide binary where dust orbits a single, normal mass, white dwarf component, the dust is circumstellar. A single, low mass white dwarf of large radius is ruled out by spectroscopy (Liebert, Bergeron, & Holberg, 2005).
| SpectroscopicaaParameters derived from model fits to spectroscopic continuum flux and Balmer line profiles. | PhotometricbbParameters derived from model fits to photometric fluxes and trigonometric parallax. | |||||||||
|---|---|---|---|---|---|---|---|---|---|---|
| Star | (K) | log | (pc) | (K) | log | (pc) | References | |||
| G77-50 | 5220 | 7.5 | 23.3 | 5200 | 8.04 | 16.8 | 1,2,3 | |||
| EC 1124293 | 9550 | 8.04 | 33.6 | 9440 | 7.10 | 61.1 | 4,5 | |||
| G166-58 | 7390 | 7.97 | 29.1 | 7340 | 7.62 | 35.5 | 4,6,7 |
| Star | aa. | () | log() | () | |
|---|---|---|---|---|---|
| G29-38 | 0.030 | 0.69 | 0.14 | 19 | |
| G166-58bbSingle white dwarf with an optically thick circumstellar disk. | 0.0023 | 0.58 | 0.38 | 12 | |
| G166-58ccDouble white dwarf with an optically thin circumbinary disk. | 0.0023 | 1.2 | 2.7 | 30 | |
| GD 362 | 0.030 | 0.75 | 0.12 | 34 |
Note. — The minimum value of is achieved, realistically, at g and m.