Diffuse Interstellar Bands in Ca ii Absorbers††thanks: Based on observations made with ESO Telescopes at the Paranal Observatories under programme ID 077.C-0737(A)
Abstract
The diffuse interstellar bands (DIBs) probably arise from complex organic molecules whose strength in local galaxies correlates with neutral hydrogen column density, (H i), and dust reddening, . Since Ca ii absorbers in quasar (QSO) spectra are posited to have high (H i) and significant , they represent promising sites for the detection of DIBs at cosmological distances. Here we present the results from the first search for DIBs in 9 Ca ii-selected absorbers at . We detect the 5780 Å DIB in one line of sight at ; this is only the second QSO absorber in which a DIB has been detected. Unlike the majority of local DIB sight-lines, both QSO absorbers with detected DIBs show weak 6284 Å absorption compared with the 5780 Å band. This may be indicative of different physical conditions in intermediate redshift QSO absorbers compared with local galaxies. Assuming that local relations between the 5780 Å DIB strength and (H i) and apply in QSO absorbers, DIB detections and limits can be used to derive (H i) and . For the one absorber in this study with a detected DIB, we derive = 0.23 mag and (H i) 20.9, consistent with previous conclusions that Ca ii systems have high H i column densities and significant reddening. For the remaining 8 Ca ii-selected absorbers with 5780 Å DIB non-detections, we derive upper limits of 0.1–0.3 mag.
keywords:
quasars: absorption lines – dust, extinction – ISM: abundances – ISM: lines and bands – ISM: molecules – line: identification1 Introduction
Damped Lyman alpha (DLA) systems are usually considered to be the class of QSO absorber with the highest neutral hydrogen column densities [(H i) cm-2]. Nonetheless, the DLAs are characterised by generally low metallicities and gas-phase depletion fractions (e.g. Khare et al., 2004; Akerman et al., 2005; Prochaska et al., 2007) and low reddening due to dust (Murphy & Liske 2004; Ellison, Hall & Lira 2005). The DLAs are also poor in molecules, as demonstrated by both their generally low fractions of H2 (e.g. Ledoux et al., 2003) and the lack of a detection for any other molecular species, such as OH or CO (e.g. Curran et al., 2006). Although the handful of DLAs which do exhibit molecular H2 absorption may be biased, e.g. towards high metallicities (Petitjean et al., 2006), such systems can offer a novel insight into the physical conditions of the galactic interstellar medium (ISM, e.g. Srianand et al., 2005; Noterdaeme et al., 2007). In addition to the study of H2, one avenue that is just starting to be explored is how the diffuse interstellar bands (DIBs; see reviews by Herbig, 1995; Sarre, 2006) may be used to probe the intermediate redshift ISM. Although lacking definitive identifications, the strength (both absolute and relative) of these broad absorption features in the Milky Way (MW) and other nearby galaxies exhibit dependencies on (and sometimes, tight correlations with) neutral gas content, dust reddening, metallicity and local radiation field (e.g. Herbig, 1993; Cox & Spaans, 2006; Welty et al., 2006; Cox et al., 2007). Moreover, if DIBs are as strong in DLAs as they are in the MW [i.e. for a given (H i)], then they should be relatively easy to detect at intermediate redshifts.
The first systematic search for DIBs in DLAs has recently been carried out by Lawton et al. (in preparation) in 7 absorbers. In only one case were DIBs detected: the 4428, 5705 and 5780 Å features111We cite all DIBs with reference to their normal air wavelengths, although their vacuum values have been used in practice in order to be consistent with our spectral wavelength calibration; see Section 2. were all detected in the DLA towards AO 0235164 (Junkkarinen et al., 2004; York et al., 2006a). Lawton et al. showed that for the 6 non-detections in their DLA sample, the strength of the 5780 Å DIB [which shows one of the tightest correlations with (H i) in the MW] is often at least 3 times weaker in DLAs for a given (H i) compared with Galactic sight-lines. The 6284 Å DIB is even more under-abundant in DLAs for a given (H i): 4–10 times weaker than towards Galactic sight-lines. A similar result has been found for DIBs in the Large and Small Magellanic Cloud (LMC and SMC; Welty et al., 2006) where the 5780 Å DIB is typically 10–30 times weaker than expected from the Galactic relation. On the other hand, the 5780 Å DIB strength correlates well with in both Galactic and Magellanic Cloud sight-lines, and the detection towards AO 0235164 also lies on the same relationship (York et al., 2006a). These results hint that DIB formation/survival and high dust content are closely linked and that DIBs are therefore most likely to be detected in galaxies with high reddening.
Wild, Hewett & Pettini (2006) have recently suggested that absorbers identified via high equivalent widths (EWs) of Ca ii may select the highest (H i) and highest absorbers. For example, whereas DLAs have been constrained to have 0.04 (Murphy & Liske, 2004; Ellison et al., 2005), Wild et al. (2006) find that absorbers with Ca ii 3934 EWs 0.7 Å have values up to 0.1 mag. Ca ii absorbers may therefore be promising sites for the detection of DIBs.
2 Target Selection, Observations and DIB Search
Wild & Hewett (2005) presented a sample of Ca ii absorbers selected from the Sloan Digital Sky Survey (SDSS). However, the typical rest wavelengths of the strong DIB features (approximately 4500–7000 Å) makes the Wild & Hewett (2005) sample unsuitable for an optical search for the diffuse bands. We have recently conducted an independent search for Ca ii absorbers in the SDSS at (see Zych et al., 2007, for details) and found over 40 new absorbers. We selected 9 high-EW (Ca ii 3934 EW0.35 Å) systems whose redshift places at least one of the strong DIBs (specifically, the 4428, 5705, 5780, 5797, 6284 and 6613 Å bands were targeted) in regions of the spectrum free from atmospheric absorption and night sky emission. We note that due to the small impact parameters between the QSO and the galaxy causing absorption (typically 10 kpc, e.g. Zych et al., 2007) and the relatively large contribution by galactic light in the SDSS fibre, it is probable that some of the Ca ii EW is contributed by galactic photospheric absorption. The SDSS Ca ii EWs may therefore not be an accurate measure of the interstellar Ca ii content (this effect may be minimised when the Ca ii EW can be measured from the FORS long slit spectrum; see Table 2). However, the small impact parameters also mean that these galaxies are likely to produce significant absorption from their ISM in the QSO spectrum and the potential contamination from photospheric absorption does not alter the conclusions of this work [e.g. inferred (H i) and ]. Table 1 lists the targets222In Table 1 we give the full SDSS identification for each QSO but elsewhere we use abbreviated names. in our sample, as well as their emission and absorption redshifts, and (the latter being derived from a Gaussian fit to the Ca II 3934 Å line), and SDSS -band magnitudes, .
| QSO | Grism | Resolution | Coverage | Exp. time | S/N | |||
|---|---|---|---|---|---|---|---|---|
| [mag] | [Å] | [Å] | [s] | |||||
| SDSS J001342.44002412.6 | 1.644 | 0.1556 | 18.6 | 1200R | 2.3 | 5960–7370 | 5280 | 60–80 |
| SDSS J100943.55052953.8 | 0.942 | 0.3862 | 16.9 | 600RI | 5.2 | 5495–8620 | 3960 | 130–180 |
| 1028z | 2.7 | 7930–9575 | 2640 | 70–130 | ||||
| SDSS J104029.94070528.3 | 1.532 | 0.2063 | 18.6 | 600I | 4.0 | 6925–9470 | 2640 | 40–55 |
| SDSS J113702.03013622.1 | 1.641 | 0.4492 | 18.6 | 600RI | 5.2 | 5495–8620 | 5280 | 55–75 |
| SDSS J121911.23004345.5 | 2.293 | 0.4485 | 18.0 | 600RI | 5.2 | 5495–8620 | 2640 | 90–115 |
| SDSS J122608.02000602.2 | 1.125 | 0.5179 | 18.4 | 600RI | 5.2 | 5495–8620 | 5280 | 100–120 |
| SDSS J143701.20010418.0 | 0.286 | 0.0725 | 19.1 | 1200R | 2.4 | 5960–7370 | 10560 | 70–85 |
| SDSS J213502.45103823.5 | 1.511 | 0.0984 | 18.8 | 600B | 4.8 | 3490–6360 | 13200 | 70–85 |
| SDSS J225913.74084419.6 | 1.290 | 0.5293 | 18.4 | 600RI | 5.2 | 5495–8620 | 5280 | 75–100 |
The 9 targets in Table 1 were observed in long slit mode with the FORS2 spectrograph on the Very Large Telescope (VLT) in Chile during ESO’s Period 77 (1 April 2006 – 30 September 2006). Observations were obtained through a 1 arcsec slit with the CCD binned 22. Grism selection depended on absorber redshift; the exposure time, choice of grism and the resulting FWHM resolutions333The FWHM resolution was calculated as an average across the wavelength range based on Gaussian fits to unresolved sky lines and 2D arc frames. and signal-to-noise (S/N) ratios per pixel are listed in Table 1. The data reduction procedure followed standard steps for long slit spectra using IRAF: a median bias frame was subtracted from each science frame, followed by division by an average lamp flat field. The spectra were optimally extracted, wavelength calibrated by use of a CuAr lamp and converted to a vacuum-heliocentric scale. We experimented with different methods of combining individual exposures, including the usual SCOMBINE task in IRAF with weightings according to S/N, and also using UVES_popler, as described in Zych et al. (2007). Both gave very similar results.
We searched the final spectra for absorption associated with the 4428, 5705, 5780, 5797, 6284 and 6613 Å diffuse bands. The first of these bands is intrinsically broad with an average (rest-frame) FWHM measured from 4 Galactic stellar sight-lines of FWHM 12.3 Å (Jenniskens & Desert, 1994). The other 5 DIBS are narrower, with FWHM values of 2.2, 2.1, 1.0, 2.6 and 1.1 Å respectively in Galactic sight-lines (Jenniskens & Desert, 1994)444These values are in good agreement with the slightly newer compilation of Tuairisg et al. (2000), with the exception of the 4428 Å DIB which is reported to have an average (over 3 reddened Galactic lines of sight) of FWHM of 17.5 Å.. Comparing these values with the resolution of our spectra in Table 1 it can be seen that the 4428 Å DIB is always resolved in our spectra. We usually do not resolve the narrower DIBs; taking into account the broadening, the expected FWHM values of the DIBs is 2–3 Å, compared with our typical spectral resolution of 3–5 Å.
| QSO | 4428 | 5705 | 5780 | 5797 | 6284 | 6613 | Ca ii H and K | Na i D1 and D2 | ||
|---|---|---|---|---|---|---|---|---|---|---|
| [mÅ] | [mÅ] | [mÅ] | [mÅ] | [mÅ] | [mÅ] | 3934, 3969 [Å] | 5891, 5897 [Å] | [mag] | ||
| J00130024 | 0.1556 | … | 62 | 9416 | 45 | 78 | … | 1.090.18, 1.340.17 (S) | 1.120.02, 0.940.02 | |
| J10090529 | 0.3862 | 124 | 41 | 42 | 42 | 58 | … | 0.510.05, 0.190.05 (S) | … | 0.12 |
| J10400705 | 0.2063 | … | … | 127 | 127 | 155 | 146 | 0.610.12, 0.250.15 (S) | , | 0.30 |
| J11370136 | 0.4492 | 176 | 81 | 82 | 82 | … | … | 0.350.04, 0.140.04 (F) | , | 0.21 |
| J12190043 | 0.4485 | 120 | 58 | 60 | 60 | … | … | 0.400.02, 0.320.02 (F) | 0.090.02, | 0.16 |
| J12260006 | 0.5179 | 114 | … | … | … | … | … | 0.670.02, 0.420.02 (F) | … | … |
| J14370104 | 0.0725 | … | … | 53 | 61 | … | 51 | 1.070.20, 0.980.30 (S) | 1.310.02, 0.850.02 | 0.15 |
| J21351038 | 0.0984 | 184 | 99 | 102 | … | … | … | 0.900.19, 0.430.28 (S) | … | 0.25 |
| J22590844 | 0.5293 | 136 | … | … | … | … | … | 0.380.02, 0.190.03 (F) | … | … |
Our search yielded one DIB detection: the 5780 Å band at towards J00130024, the absorber with the highest apparent Ca ii EW in our sample. Figure 1 shows this detection together with the corresponding Ca ii (from the SDSS spectrum) and Na i absorption. The redshifts of the 5780 Å DIB and Na i lines are in excellent agreement with the Ca ii absorption. Depending on the method of weighting the individual exposures, the velocity offsets between various absorption features in the final spectrum are always km s-1, i.e. less than one half of a resolution element; often the agreement is 20 km s-1. We measure the EW of the 5780 feature using both a simple integration of optical depth, as well as by a Gaussian de-blend in order to account for the presence of a second (unidentified) absorption feature offset by 130 km s-1 to the red of the DIB. The unidentified feature does not correspond to any known stellar or interstellar features at and we conclude that it is likely to be due to gas at a different redshift. We also repeat the EW measurements in the UVES_popler reduction; all EW values are in excellent agreement and lie within the statistical 1 error derived from the spectral error array. Our final quoted EW (see Table 2) adopts an average of the EWs determined from various measurement methods and spectral combinations.

For all other Ca ii absorbers with non-detections, the 3 detection limits are given in Table 2. For the DIBs that we would expect to be resolved in our spectra (the 4428 Å band in all cases and, e.g., the 6284 Å band towards J1009+0529) we assumed that the absorption would have an observed FWHM of times the typical Galactic value (see above). This allowed us to calculate the number of pixels over which the absorption would be expected to extend. For the unresolved lines, we assumed that the number of pixels was equal to the FWHM spectral resolution (in Å, see Table 1) divided by the dispersion (in Å/pixel).
3 Discussion
In local (e.g. Galactic, LMC, SMC) sight-lines, the 6284 Å DIB is typically 2–3 times stronger than the 5780 Å DIB (e.g., York et al. 2006a and references therein). The one exception is the unusual SMC wing sight-line towards Sk 143 where the 6284 Å DIB has an EW less than half that of the 5780 Å DIB (Welty et al., 2006). York et al. (2006a) also found that in the one DLA sight-line with a 5780 Å band detection out of the 7 studied by Lawton et al. (in preparation), the EW of the 6284 Å feature was also constrained to be less than the EW of the 5780 Å line. York et al. (2006a) suggested that these unusual line ratios could be an indication of an ISM that is more protected from the ambient UV radiation field. In the Ca ii-selected absorber towards J00130024, we constrain the EW of the 6284 Å DIB to be at least 20% weaker than the 5780 Å band. The DIB ratios in this absorber are therefore consistent with those in the DLA detection of York et al. (2006a) and the SMC wing sight-line Sk 143 but inconsistent with other local sight-lines, including starburst galaxies (Heckman & Lehnert, 2000) and the Magellanic Clouds (Welty et al., 2006).
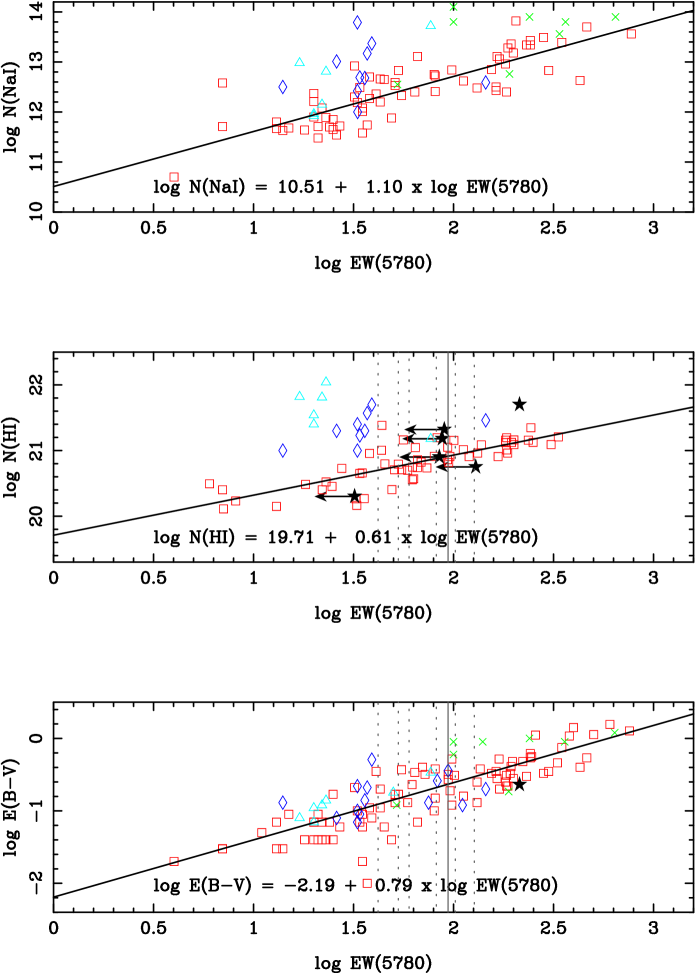
In the Galaxy, many DIBs show correlations with (H i) and (Na i) (e.g. Herbig, 1993, 1995). In Table 2 we tabulate the EWs of the Na i doublet for our Ca ii-selected absorbers. However, we do not calculate the Na i column density because, if the lines are strong enough to be detected in our moderate resolution spectra, they are likely to be saturated. The Galactic correlations of (H i) and (Na i) with the 5780 Å DIB, which is one of the tightest of the DIB relations, is shown in Fig. 2. We also show data for the Magellanic Clouds (Welty et al., 2006) and DLAs (York et al. 2006a; Lawton et al. in preparation), where it can be seen that the DIBs are weak for their (H i) compared with the Galactic correlation. As shown in Fig. 2, the DIBs in extra-galactic sight-lines are also weak for their Na i column densities. These departures from the Galactic relations are probably due to a combination of effects including ambient radiation field, metallicity and dust-to-gas ratios (Cox & Spaans, 2006). Assuming that the Galactic 5780–(H i) relation provides a lower limit for the H i column density, DIB detections may be useful for constraining (H i) in the absence of Ly observations. For example, Wild & Hewett (2005) and Wild et al. (2006) have argued that Ca ii absorbers represent the high column density end of the DLA distribution. Our detection of the 5780 Å DIB in the absorber towards J00130024 supports this hypothesis, and we derive (H i) 20.9 for this absorber.
Unlike correlations with (H i) and (Na i), Welty et al. (2006) have shown that the 5780 Å DIB strength follows a single relationship with in both Galactic and Magellanic Cloud sight-lines. York et al. (2006a) found that the single DLA 5780 Å DIB detection towards AO 0235164 fell on the same relationship. It is not yet clear whether the apparent universality of this correlation is driven by a tight physical connection between dust properties and DIB formation (Cox et al., 2007) or whether it is coincidence of different physical drivers working in different directions (Cox & Spaans, 2006). However, if the 5780– is applicable to QSO absorbers, we can use our DIB detection limits to constrain their reddening. Welty et al. (2006) derive a best fit correlation between the 5780 Å DIB (in mÅ) and the for Galactic sight-lines: log = 2.70 + 1.01 log EW(5780). We derive the best fit relation to the 5780– data points of the Galactic plus Magellanic Cloud plus AO 0235164 DLA sight-lines and find log = 2.19 + 0.79 log EW(5780) (see Figure 2). The range in log values around the best fit relation is 0.4 dex. This correlation gives a reddening for the Ca ii absorber towards J00130024 of mag and upper limits for the other 8 Ca ii absorbers in our sample of 0.1–0.3 mag. These values provide independent estimates of reddening associated with Ca ii-selected absorbers that do not depend directly on the choice of extinction law and can be applied for individual absorbers and not just in a statistical fashion (e.g. Murphy & Liske, 2004; Wild & Hewett, 2005; Wild et al., 2006). The Ca ii EWs of our sample are typically Å (see Table 2); for this range of EWs, Wild et al. (2006) determine average reddenings of = 0.02, 0.03 and 0.03 mag for MW, LMC and SMC extinction curves respectively.
4 Summary and Future Prospects
We have reported the results from the first search for DIBs towards 9 Ca ii-selected absorbers in the redshift range . In one case, the absorber towards J00130024, we detect the 5780 Å DIB. This absorber has the highest Ca ii 3934 EW in our sample, although there is some contribution from galactic photospheric absorption in the SDSS EW measurement. J14370104 has only a marginally lower Ca ii EW, but a 5780 Å DIB upper limit that is half that of J00130024. J00130024 is only the second QSO absorber in which DIBs have been detected. Assuming that the Galactic relation between (H i) and 5780 EW can be used to derive a lower limit for H i column density, we find (H i) 20.9. Similarly, the correlation between 5780 EW and seen in all sight-lines (Galactic and extra-galactic) to date implies a high reddening in this absorber of = 0.23 mag. These results provide independent support for the suggestion by Wild et al. (2006) that the Ca ii absorbers are amongst the highest (H i) and most highly reddened of the QSO absorbers. Indeed, the derived for J00130024 is even higher than the typical statistical values derived by Wild et al. (2006). For the other absorbers in our sample we derive upper limits to the reddening of 0.1–0.3 mag. We also find the interesting result that, in contrast to essentially every local sight-line (with the exception of one SMC wing cloud), both QSO absorbers with detected DIBs have stronger 5780 Å features than 6284 Å features, possibly due to less intense radiation fields.
What are the prospects for further detections of DIBs in Ca ii and other QSO absorption line systems? If the relationship of the 5780 Å DIB strength with is widely applicable, then targetting the most reddened systems is likely the most profitable path. Nonetheless, this is a challenging prospect; even for an absorber with = 0.1 mag, the rest frame 5780 EW will be 30 mÅ, which would require an improvement in our current detection limits by typically a factor of 2–3. The best candidates for future observations are likely to be the highest EW Ca ii and Mg ii absorbers, since these appear to be the most highly reddened of the QSO menagerie (Wild et al., 2006; York et al., 2006b; Ménard et al., 2007). However, with more detections in hand, it would be possible not only to infer the gas and dust properties of the absorbers, as described above, but also to obtain new insight into the nature of the DIBs themselves. For example, York et al. (2006a) showed that, in the DLA towards AO 0235164, the ratio of the 5705/5780 Å DIBs was consistent with those in Galactic sight-lines (e.g. Thorburn et al., 2003). The identification of such DIB ‘families’ may indicate which bands are associated with the same molecular carrier and hence provide guidelines for their chemical identification. If the Galactic 5705/5780 relation holds for the Ca ii absorber towards J00130024, we would expect to detect it with an increase of a factor of three in S/N, possible with approximately one more night of integration.
Acknowledgments
SLE was funded by an NSERC Discovery grant. BAY was partially funded by an NSERC PGS-M award. MTM thanks the STFC for an Advanced Fellowship, held at the Institute of Astronomy. BJZ and AMS thank STFC and EPSRC, respectively, for studentships.
References
- Akerman et al. (2005) Akerman C.J., Ellison S.L., Pettini M., Steidel C.C., 2005, A&A, 440, 499
- Cox et al. (2007) Cox N.L.J. et al., 2007, A&A, 470, 941
- Cox & Spaans (2006) Cox N.L.J., Spaans M., 2006, A&A, 451, 973
- Curran et al. (2006) Curran S.J., Whiting M.T., Murphy M.T., Webb J. K., Longmore S.N., Pihlström Y.M., Athreya R., Blake C., 2006, MNRAS, 371, 431
- D’Odorico et al. (1989) D’Odorico S., di Serego Alighieri S., Pettini M., Magain P., Nissen P.E., Panagia N., 1989, A&A, 215, 21
- Ellison et al. (2005) Ellison S.L., Hall P.B., Lira P., 2005, AJ, 130, 1345
- Heckman & Lehnert (2000) Heckman T.M., Lehnert M.D., 2000, ApJ, 537, 690
- Herbig (1993) Herbig G.H., 1993, ApJ, 407, 142
- Herbig (1995) Herbig G.H., 1995, ARA&A, 33, 19
- Jenniskens & Desert (1994) Jenniskens P., Desert F.-X., 1994, A&AS, 106, 39
- Junkkarinen et al. (2004) Junkkarinen V.T., Cohen R.D., Beaver E.A., Burbidge E. M., Lyons R.W., Madejski G., 2004, ApJ, 614, 658
- Khare et al. (2004) Khare P., Kulkarni V.P., Lauroesch J.T., York D.G., Crotts A.P.S., Nakamura O., 2004, ApJ, 616, 86
- Ledoux et al. (2003) Ledoux C., Petitjean P., Srianand R., 2003, MNRAS, 346, 209
- Ménard et al. (2007) Ménard B., Nestor D., Turnshek D., Quider A., Richards G., Chelouche D., Rao S., 2007, preprint (arXiv:0706.0898)
- Murphy & Liske (2004) Murphy M.T., Liske J., 2004, MNRAS, 354, L31
- Noterdaeme et al. (2007) Noterdaeme P., Petitjean P., Srianand R., Ledoux C., Le Petit F., 2007, A&A, 469, 425
- Petitjean et al. (2006) Petitjean P., Ledoux C., Noterdaeme P., Srianand R., 2006, A&A, 456, L9
- Prochaska et al. (2007) Prochaska J.X., Wolfe A.M., Howk J.C., Gawiser E., Burles S.M., Cooke J., 2007, ApJS, 171, 29
- Sarre (2006) Sarre P.J., 2006, J. Molecular Spectrosc., 238, 1
- Sollerman et al. (2005) Sollerman J., Cox N., Mattila S., Ehrenfreund P., Kaper L., Leibundgut B., Lundqvist P., 2005, A&A, 429, 559
- Srianand et al. (2005) Srianand R., Petitjean P., Ledoux C., Ferland G., Shaw G., 2005, MNRAS, 362, 549
- Thorburn et al. (2003) Thorburn J.A., Hobbs L.M., McCall B.J., Oka T., Welty D. E., Friedman S.D., Snow T.P., Sonnentrucker P., York D.G., 2003, ApJ, 584, 339
- Tuairisg et al. (2000) Tuairisg S.Ó., Cami J., Foing B.H., Sonnentrucker P., Ehrenfreund P., 2000, A&AS, 142, 225
- Vidal-Madjar et al. (1987) Vidal-Madjar A., Andreani P., Cristiani S., Ferlet R., Lanz T., Vladilo G., 1987, A&A, 177, L17
- Vladilo et al. (1987) Vladilo G., Crivellari L., Molaro P., Beckman J.E., 1987, A&A, 182, L59
- Welty et al. (2006) Welty D.E., Federman S.R., Gredel R., Thorburn J.A., Lambert D.L., 2006, ApJS, 165, 138
- Wild & Hewett (2005) Wild V., Hewett P.C., 2005, MNRAS, 358, 1083
- Wild et al. (2006) Wild V., Hewett P.C., Pettini M., 2006, MNRAS, 367, 211
- York et al. (2006a) York B.A., Ellison S.L., Lawton B., Churchill C.W., Snow T.P., Johnson R.A., Ryan S.G., 2006, ApJ, 647, L29
- York et al. (2006b) York D.G. et al., 2006b, MNRAS, 367, 945
- Zych et al. (2007) Zych B.J., Murphy M.T., Pettini M., Hewett P.C., Ryan-Weber E.V., Ellison S.L., 2007, MNRAS, 379, 1409
This paper has been typeset from a TeX/LaTeX file prepared by the author.