11email: gaspard.duchene@obs.ujf-grenoble.fr 22institutetext: OASU/LAB-UMR5804, CNRS, Université Bordeaux I, 2 rue de l’Observatoire, BP 89, 33270 Floirac, France 33institutetext: CEA/DSM/DAPNIA, Service d’Astrophysique, CEA Saclay, 91191 Gif-sur-Yvette, France 44institutetext: Laboratoire AIM, Unité Mixte de Recherche CEA/DSM – CNRS – Université Paris Diderot, C.E.A. Saclay, France 55institutetext: Nordic Optical Telescope, Apdo 474, 38700 Santa Cruz de La Palma, Spain 66institutetext: Department of Physics and Astronomy, UCLA, Los Angeles, CA 90095-1562, USA
Multiple protostellar systems
Abstract
Context. Multiple systems are the product of protostellar core fragmentation. Studying their statistical properties in young stellar populations therefore probes the physical processes at play during star formation.
Aims. Our project endeavors to obtain a robust view of multiplicity among embedded Class I and Flat Spectrum protostars in a wide array of nearby molecular clouds to disentangle “universal” from cloud-dependent processes.
Methods. We have used near-infrared adaptive optics observations at the VLT through the , and filters to search for tight companions to 45 Class I and Flat Spectrum protostars located in 4 different molecular clouds (Taurus-Auriga, Ophiuchus, Serpens and L1641 in Orion). We complemented these observations with published high-resolution surveys of 13 additional objects in Taurus and Ophiuchus.
Results. We found multiplicity rates of 326% and 478% over the 45–1400 AU and 14–1400 AU separation ranges, respectively. These rates are in excellent agreement with those previously found among T Tauri stars in Taurus and Ophiuchus, and represent an excess of a factor 1.7 over the multiplicity rate of solar-type field stars. We found no non-hierarchical triple systems, nor any quadruple or higher-order systems. No significant cloud-to-cloud difference has been found, except for the fact that all companions to low-mass Orion protostars are found within 100 AU of their primaries whereas companions found in other clouds span the whole range probed here.
Conclusions. Based on this survey, we conclude that core fragmentation always yields a high initial multiplicity rate, even in giant molecular clouds such as the Orion cloud or in clustered stellar populations as in Serpens, in contrast with predictions of numerical simulations. The lower multiplicity rate observed in clustered Class II and Class III populations can be accounted for by a universal set of properties for young systems and subsequent ejections through close encounters with unrelated cluster members.
Key Words.:
binaries: close – stars: formation – stars: pre-main sequence1 Introduction
The prevalence of binary and multiple systems among stellar populations in our Galaxy is generally understood as a consequence of the natural tendency of prestellar cores for fragmentation during or immediately after their free-fall collapse (see Tohline 2002 for a detailed review). Numerical simulations have long predicted that this fragmentation, hence the frequency and properties of multiple systems, is strongly dependent on the initial conditions reigning in the core (e.g., Bonnell et al. 1992; Durisen & Sterzik 1994; Boss 2002; Goodwin et al. 2004b). Millimeter observations over the last two decades have provided a detailed view of the initial conditions of star formation. For instance, the basic properties of individual prestellar cores, outer radius and central density, differ significantly from one molecular cloud to another (Motte & André 2001). It is also likely that the temperature in prestellar cores vary from cloud to cloud depending on the strength of the interstellar radiation field (e.g., Stamatellos et al. 2007). Finally, there is now good evidence that protostellar collapse is generally more violent in a cluster-forming environment than in isolated dense cores, e.g., induced by strong external disturbances as opposed to spontaneous or self-initiated (André et al. 2003; Belloche et al. 2002, 2006). Considering these differences, one may therefore expect to observe substantial differences in the properties of multiple systems in independent stellar populations.
Early high-angular resolution surveys of Myr-old T Tauri stars in nearby T associations, such as Taurus and Ophiuchus (Ghez et al. 1993; Leinert et al. 1993; Reipurth & Zinnecker 1993) revealed a significant excess over the multiplicity rate among field stars (Duquennoy & Mayor 1991, hereafter DM91; Fischer & Marcy 1992). It was then rapidly discovered that clustered populations of equally young stars, such as the Orion Nebula Cluster (ONC), do not possess such a high multiplicity rate and rather resemble field stars from this point of view (Padgett et al. 1997; Petr et al. 1998; Duchêne et al. 1999). While this could be evidence that supports the environment-dependent fragmentation of prestellar cores, alternative explanations cannot be excluded. In particular, dynamical interactions with unrelated cloud members can disrupt most wide companions in less than 1 Myr in the densest clusters (Kroupa 1995). In other words, T Tauri multiple systems have had sufficient time to evolve since their formation, so that their observed properties may not be considered as directly representative of core fragmentation. To circumvent this problem, observations of less evolved, embedded, young stellar objects (YSOs) are required in order to determine the pristine properties of multiple systems.
Radio interferometric studies of embedded Class 0 and Class I sources have hinted at a high overall multiplicity rate, comparable to that observed among T Tauri stars in non-clustered populations (Looney et al. 2000; Reipurth et al. 2002; 2004). Non uniform and limited samples, as well as the fact that not all YSOs emits strongly at centimeter wavelengths, prevent conclusive comparisons at this point, however. In parallel to this effort, Haisch et al. (2002, 2004) and Duchêne et al. (2004, hereafter D04) conducted direct near-infrared imaging surveys of Class I protostars. These surveys also found a high multiplicity rate, consistent with that of somewhat more evolved T Tauri stars in the same clouds. D04 found marginal evidence that the multiplicity rate of these sources decreases on a timescale of yr, possibly a result of the internal or external dynamical ejection of wide companions. No strong evidence was found for a variation of the multiplicity rate of Class I sources from one cloud to another, in part because of small sample sizes and of the limited range of projected separations probed by these surveys. Whether fragmentation does indeed depend on environmental conditions remains to date a theoretical/numerical predictions that has not yet been confirmed observationally. In particular, the outcome of core fragmentation in a very rich molecular cloud such as Orion remains unknown.
To extend the analysis of D04, we have undertaken a high-angular resolution survey of embedded Class I protostars sampling the Serpens and Orion molecular clouds in addition to Taurus and Ophiuchus. This paper is organized as follows: we present our sample and observations in Section 2 and the results in Section 3. In Section 4, we analyze these results in view of other multiplicity surveys and of predictions of star formation theories. We summarize our findings in Section 5.
2 Sample, observations and data reduction
2.1 Sample definition
Our objective is twofold in this survey: to extend the range of spatial scales over which companions are searched for and to obtain a valuable comparison between star-forming regions that represent different types of star formation. We therefore performed our survey in the Taurus-Auriga, Ophiuchus, Serpens and Orion molecular clouds. More precisely, our survey in Orion focused on L1641, one of the clouds that is currently most actively forming stars. Throughout this paper, we adopt distances of 140 pc to the Taurus and Ophiuchus clouds, 260 pc to the Serpens cloud and 450 pc to L1641 (Bertout et al. 1999; Bertout & Genova 2006; Bontemps et al. 2001; Festin 1998; Warren & Hesser 1977).
| Target | Alt. Name | Class | Ref.a | Mult.b | Filters | Obs. Datec (UT) | |||||
| Taurus | |||||||||||
| 04113+2758 | 7.79 | -0.01 | FS | 1.6 | 4,7 | B | 0.54 | 8000 | 03/12/03 | ||
| 04239+2436 | 10.58 | 1.27 | I | 1.3 | 4,7 | B⋆ | 0.27 | 2000 | 04/12/03 | ||
| 04263+2426 | Haro 6-10 | 7.80 | 1.02 | I | 0.74 | 4,7 | B | 8000 | 03/12/03 | ||
| 04287+1801d | L1551 IRS 5 | 9.27 | 1.57 | I | 28. | 4,7 | S | 500 | 04/12/03 | ||
| 04295+2251 | L1536 IRS | 9.55 | 0.11 | FS | 0.6 | 4,7 | S | 0.39 | 900 | 04/12/03 | |
| 04361+2547 | TMR 1 | 10.55 | 1.27 | I | 3.7 | 4,7 | B | 140 | 04/12/03 | ||
| 04365+2535 | TMC 1A | 10.62 | 1.08 | I | 2.4 | 4,7 | S | 0.37 | 2800 | 04/12/03 | |
| 04385+2550 | Haro 6-33 | 9.65 | 0.14 | FS | 0.4 | 4,7 | S | 0.67 | 2800 | 03/12/03 | |
| 04489+3042 | 10.11 | 0.18 | FS | 0.3 | 4,7 | S | 0.63 | 2200 | 04/12/03 | ||
| Ophiuchus | |||||||||||
| Oph 29 | GSS 30 | 8.32 | 1.20 | I | 21. | 5,6 | S | 0.33 | 5000 | 01/06/03 | |
| Oph 31 | LFAM 1 | 13.59 | 1.08 | I | 0.13 | 3,6 | S | 0.57 | 35 | 19/06/04, 11/04/04 | |
| Oph 46 | VSSG 27 | 10.72 | 0.17 | FS | 0.41 | 5,6 | T | 0.35 | 1250 | 19/06/04 | |
| Oph 51 | 9.59 | -0.09 | FS | 0.71 | 6,11 | B | 0.17 | 750 | 02/06/03 | ||
| Oph 108 | EL 29 | 7.54 | 0.98 | I | 26. | 5,6 | S | 20000 | 01/06/03 | ||
| Oph 121 | WL 20 | 9.21 | 1.67 | I | 1.5 | 5,6,8 | S | 0.62 | 90 | 27/03/05, 07/06/05 | |
| Oph 132 | IRS 42 | 8.41 | 0.08 | FS | 5.6 | 5,6 | S | 0.52 | 5000 | 02/06/03 | |
| Oph 134 | WL 6 | 10.04 | 0.59 | I | 1.7 | 5,6 | S | 0.42 | 4000 | 01/06/03 | |
| Oph 141 | IRS 43 | 9.46 | 0.98 | I | 6.7 | 5,6 | B | 0.27 | 1500 | 01/06/03 | |
| Oph 143 | IRS 44 | 9.65 | 1.57 | I | 8.7 | 5,6 | B | 1900 | 30/04/05, 09/04/05 | ||
| Oph 147 | IRS 47 | 8.95 | 0.17 | FS | 3.7 | 5,6 | B⋆ | 2800 | 02/06/03 | ||
| Oph 159 | IRS 48 | 7.42 | 0.18 | FS | 7.4 | 5,6 | S | 0.29 | 2000 | 01/06/03 | |
| Oph 167 | IRS 51 | 8.93 | -0.04 | FS | 1.1 | 5,6 | B | 0.41 | 1500 | 01/06/03 | |
| Oph 182 | IRS 54 | 10.87 | 1.76 | I | 6.6 | 5,6 | B | 0.19 | 700 | 02/06/03 | |
| Oph 200 | 10.43 | 0.22 | FS | 1.3 | 6,11 | S | 0.50 | 2500 | 12/04/05 | ||
| Oph 204 | L1689 IRS 5 | 7.90 | -0.25 | FS | 2.4 | 3,6 | T | 0.45 | 2200 | 02/06/03 | |
| Serpense | |||||||||||
| Ser 159 | 8.58 | 0.11 | FS | (…) | 9,11 | S | 0.67 | 1500 | 01/06/03 | ||
| Ser 307 | SVS 2 | 8.95 | 0.06 | FS | (…) | 9,11 | S | 0.48 | 1200 | 01/06/03 | |
| Ser 312 A | EC 88 | 13.38 | 1.70 | I | 38. | 10,11 | T⋆ | 0.49 | 2900 | 30/04/05 | |
| Ser 314 | SVS 20 | 7.05 | -0.03 | FS | (…) | 9,11 | T⋆ | 0.66 | 6000 | 01/06/03 | |
| Ser 317 A | EC 92 | 10.50 | 0.50 | FS | 1.2 | 10,11 | S | 0.63 | 9500 | 22/05/05, 11/05/05 | |
| Ser 318 | EC 94 | 11.65 | -0.05 | FS | 4.6 | 9,10,11 | S | 0.63 | 800 | 22/05/05, 11/05/05 | |
| Ser 326 | EC 103 | 11.84 | 0.62 | I | (…) | 9,11 | S | 0.58 | 2000 | 11/05/05 | |
| Ser 347 | EC 129 | 9.92 | 0.06 | FS | (…) | 9,11 | S | 0.23 | 1200 | 01/06/03 | |
| L1641 (Orion A) | |||||||||||
| IRAS 29 | 9.8 | 1.30 | I | 32.2 | 2 | B⋆ | 2000 | 03/12/03 | |||
| IRAS 50 | 8.14 | -0.06 | FS | 99.6 | 1,2 | T⋆⋆ | 10000 | 03/12/03 | |||
| IRAS 72 | 9.49 | 0.15 | FS | 3.2 | 1,2 | B⋆ | 1600 | 04/12/03 | |||
| IRAS 79 | V883 Ori | 4.98 | 0.23 | FS | 241. | 1,2 | S | 0.12 | 13000 | 04/12/03 | |
| IRAS 87 | 10.7 | 0.56 | I | 10.2 | 2 | S | 0.54 | 1800 | 04/12/03 | ||
| IRAS 120f | 8.97 | -0.43 | II | 1.5 | 1,2 | S | 0.74 | 2000 | 04/12/03 | ||
| IRAS 171 A | 9.60 | -0.05 | FS | 2.4 | 1,2 | S | 0.66 | 500 | 03/12/03 | ||
| IRAS 171 B | 10.1 | -0.05 | FS | 2.4 | 1,2 | B⋆ | 0.66 | 100 | 03/12/03 | ||
| IRAS 187 | V1791 Ori | 8.11 | 0.01 | FS | 7.5 | 1,2 | S | 0.70 | 8000 | 03/12/03 | |
| IRAS 191 | DL Ori | 9.38 | 0.64 | I | 8.1 | 1,2 | S | 0.74 | 4000 | 03/12/03 | |
| IRAS 224 | 10.18 | 0.12 | FS | 1.5 | 1,2 | S | 0.39 | 700 | 04/12/03 | ||
| IRAS 237 | 9.5 | -0.21 | FS | 7.3 | 2 | S | 0.50 | 7000 | 04/12/03 | ||
| IRAS 270 | 9.8 | 0.47 | I | 5.4 | 2 | B⋆ | 3000 | 03/12/03 | |||
-
a
References: 1) Strom et al. (1989); 2) Chen & Tokunaga (1994); 3) Greene et al. (1994); 4) Kenyon & Hartmann (1995); 5) Barsony et al. (1997); 6) Bontemps et al. (2001); 7) Motte & André (2001); 8) Ressler & Barsony (2001); 9) Kaas et al. (2004); 10) Pontoppidan et al. (2004); 11) 2MASS Point Source Catalog.
-
b
Multiplicity status, counting only candidate companions within 1400 AU of their primary (i.e., excluding likely non-physical systems and candidate background companions). Asterisks indicate companions newly discovered in this survey (see Table 2).
-
c
When multiple observation dates are indicated, they are listed in the same order as the filters they correspond to.
-
d
IRAS 04287+1801 has been resolved into a multiple system in radio observations (Rodríguez et al. 1998; Lim & Takakuwa 2006) but only one of these components is detected in near-infrared images.
-
e
Bolometric luminosities are not available for all sources in Serpens due to source confusion in the far-infrared (Kaas et al. 2004; see Pontoppidan et al. 2004).
-
f
The Class II source IRAS 120 is listed here for completeness only and is not used in our statistical analyses of Class I and FS protostars.
We defined our sample on the basis of IRAS and ISO mid-infrared (IR) surveys of the clouds. Specifically, we used Kenyon & Hartman (1995) in Taurus, Bontemps et al. (2001) in Ophiuchus, Kaas et al. (2004) in Serpens and Chen & Tokunaga (1994) in L1641. Throughout this paper, we use the source naming conventions of these authors for the last three clouds (e.g., ISOCAM numbers in Ophiuchus and Serpens) and the IRAS Point Source Catalog names in Taurus. The protostars in our sample are classified as Class I or “flat spectrum” (FS) on the basis of their spectral index in the near- to mid-IR region, a well-documented proxy for the evolutionary status of YSOs (Greene et al. 1994). Specifically, we used indices from -band photometry and IRAS 12 m fluxes in Taurus and Orion. One source in L1641 (IRAS 171) has two possible counterparts, only separated by 6″, which have almost identical colors and are likely in a similar early evolutionary state (see Chen & Tokunaga 1994); we consider them as two separate targets in our analysis. In Ophiuchus and Serpens, we calculated indices from Bontemps et al. (2001) and Kaas et al. (2004). Ser 312 and Ser 317 both have two near-IR counterparts, which correspond to a single entry in our survey because they are separated by less than 1400 AU, the upper limit for binary separations considered here. To obtain independent mid-IR fluxes and spectral indices for their individual components, we used the refined analysis of Pontoppidan et al. (2004). Following Greene et al. (1994), we consider that sources with are Class I sources, sources with are FS, and sources with are Class II sources. The index and source classification for each target, as well as their estimated bolometric luminosities are listed in Table 1. In Serpens, source confusion at the longest wavelengths prevents assigning bolometric luminosities to most individual sources; these are however available for a subset of sources, based on the analysis of Pontoppidan et al. (2004). No individual source should have a luminosity higher than about 50, however. Because Serpens and Orion are further away then Taurus and Ophiuchus, the median bolometric luminosity is on order of 4–5 instead of 1–2 in the closer clouds. While this may induce a systematic bias from one cloud to the other, we note that our sample consists of objects whose mass is likely , i.e., low-mass protostars, except for IRAS 50 and IRAS 79.
We note that the use of only an IR spectral index to classify YSOs may not be the most physical criterion. In particular, Class I protostars are primarily defined by the fact that they are surrounded by a substantial remnant envelope (Lada 1987; André & Montmerle 1994). It is possible that some of the targets in our sample do not match this criteria, their spectral index being affected by source confusion, variability or a particular geometry, for instance (see discussion in Section 3.1.1). Also, Class I YSOs can be strongly variable at near-IR wavelengths, shading doubt on their actual nature. In the absence of a more refined criteria available for all targets, we use the spectral index to define our sample of “embedded protostars” and use this terminology throughout this paper. We note, however, that variability or photometric errors on the order of 20% on each measurement can lead to uncertainties of on the spectral index, so that objects close to a transition value may be classified differently in other studies. The case of IRAS 120 is particularly striking in this respect: discrepancies of up to 1 mag in the band, equivalent to changes of spectral index of up to 0.5, have been documented in the past (Strom et al. 1989; Chen & Tokunaga 1994; 2MASS Point Source Catalog). Similarly, Ser 317 B (EC 95) has been regularly referred to as a FS source (e.g., Preibisch 2003), although the photometry of Pontoppidan et al. (2004) and Haisch et al. (2006) suggest a Class II classification. On the other hand, recent Spitzer photometry indicate that this source is rather a Class I source (Winston et al. 2007). Both variability and crowding in the rich SVS 4 area can be held responsible for such uncertainty on the nature of EC 95. Although this is arguable, we decided to use homogeneous datasets for all sources of a given cloud, as far as possible. On the basis of Chen & Tokunaga (1994) in Orion and Pontoppidan et al. (2004) in Serpens, we do not include IRAS 120 and Ser 317 B in our analysis; our results on these targets are indicated for completeness only. Finally, we emphasize that our targets do not represent the earliest stage of stellar evolution, in which the envelope mass exceeds that of the central source. However, Class 0 sources are usually not detected in the near-IR and are not part of this study.
The objects in our sample are distributed throughout their parent clouds, without particular clustering, except for the SVS 4 group in the Serpens cloud which contains Ser 312 A and B, Ser 317 A and B and Ser 318. Even in Orion, which produced the ONC, one of the densest stellar clusters in the solar neighborhood, our sample rather represents a distributed population throughout the L1641 cloud.
Due to our choice of instrument (see below) and extremely red colors of our targets in the visible and near-IR, we were limited to for direct acquisition of high-resolution images. Due to time limitations, we observed all but a few known protostars brighter than this limit. On the other hand, we also observed a handful of fainter sources (1 in Ophiuchus, and 4 in Serpens) using a brighter nearby target as guide star. Our sample of 45 targets is therefore not exactly flux-limited. Rather, considering the lists of objects from Kenyon & Hartmann (1995), Bontemps et al. (2001), Kaas et al. (2004) and Chen & Tokunaga (1994), our survey covers roughly one third of all known Class I and FS targets in each molecular cloud, focusing primarily on the brightest objects.
2.2 Observations and data reduction
The observations were conducted with the Nasmyth Adaptive Optics System (NAOS) installed on the Yepun 8.2 m-Unit Telescope at ESO’s Very Large Telescope, in combination with the CONICA instrument (Rousset et al. 2002; Lenzen et al. 2003). We used the 00272 pixel scale, yielding a total field-of-view of 28″28″. The data were acquired in Visitor Mode in June and December 2003 and in Service Mode between April to June 2004 and between March to June 2005. The median seeing was 075, but varied between 04 and 125 from one observation to another. Sky conditions varied from photometric to transparent. A detailed observing log is presented in Table 1.
Because our targets are undetected in the optical, we used the IR wavefront sensor of NAOS, with two dichroics: the so-called N90C10 for (1.66 m) and (2.18 m) imaging and the so-called JHK for (3.80 m) imaging; their effective transmission to the detector is on the order of 5–10% at and and 90% at . All targets, except Oph 46 and IRAS 79, were imaged with the filter. All but Ser 326 were further observed with the filter and about 60% of the targets with the filter. At several tens to 200 short exposures were coadded to reach a total integration time of 10–30 sec without saturating the background. At and , a few (typically 5 to 30) longer exposures were similarly coadded to reach a similar signal-to-noise ratio (SNR). This sequence was repeated 4 to 10 times, each time after randomly jittering the location of the stars by a few arcseconds on the chip to better correct for bad pixels. The exact integration times and number of coadd images and jitter positions depend on the object brightness and the quality of the adaptive optics (AO) correction. This is measured by the achieved Strehl ratio (SR), which is the ratio of the peak pixel by the encircled energy divided by the same ratio for a perfect AO correction, namely an Airy function. We list in Table 1 the SR measured in the image (or image if the filter was not used), as well as the peak SNR calculated as the ratio of the value of the target’s peak pixel and the r.m.s. dispersion in the background.
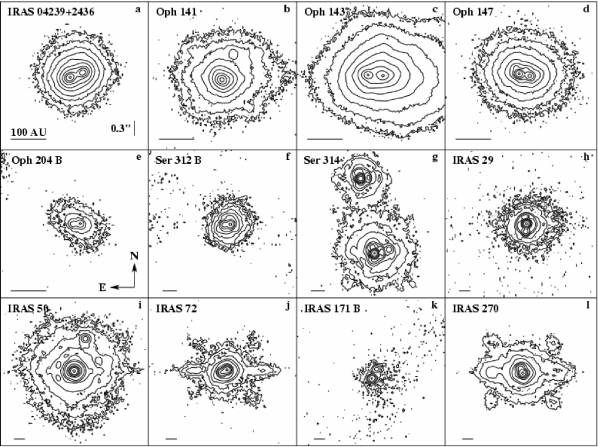
The data reduction was performed with eclipse (Devillard 2001) and consisted of the usual steps. First, all images were flat-fielded using flat fields taken as part of the ESO’s Calibration Plan. A sky was then created by clipped-median-combining all images of an object obtained with the same filter and that sky was subtracted from all images. A cosmetic correction was then applied for bad pixels and cosmic rays. Finally, the images were shift-and-added to produce the final images used in this survey. Contour plots for all sub-arcsecond companions detected in this survey are presented in Figure 1.
From objects which appear point-like in our images and that were observed with a good AO correction (SR50%, the median SR in our observations), we estimate that the FWHM of the point spread function (PSF) is about 0060, 0070 and 0110 at , and , respectively. Because our survey was primarily conducted at but with images available for almost all targets, we conservatively consider that we could unambiguously detect equal-flux companions down to 01, which we consider the lower limit for this survey, except for a few cases which appear extended in our images; these are discussed in Section 3.1. Our ability to detect companions depends on separation, flux ratio and quality of the AO correction. To illustrate this, we calculated our detection limit for companions as the 3 level in concentric annuli around 4 single stars. These stars were selected because they were observed with a very similar (2000–2200, roughly the median value in our observations), but with markedly different levels of quality in the AO correction ( ranging from 29 to 74%). As can be seen in Figure 2, the detection limit drops gradually with a slope that depends mostly on . At a separation of 01, companions can be detected down to mag independently of the AO correction quality; at 05, the detection limit drops to at least mag. Outside 1–2″, the detection limit is dominated by background noise and remains constant. For stars observed with , we could detect distant companions down to mag. Note that all the companions we detected are above the detection limit for our worse detection limit, as can be seen in Figure 2, implying that the risk of a bias induced by the varying quality of our AO images is very limited.
The only object for which the AO correction was too poor to include this dataset in our survey is IRAS 04361+2547 (). We failed to resolve the 031 binary identified by Terebey et al. (1998, 2001) on the basis of HST/NICMOS images. While it is not possible to determine from our dataset whether this source is intrinsically extended, we will take advantage of the HST images for this target, as well as for a few other objects (see Sect. 2.3).

Relative astrometry and photometry for all companions detected in our survey was performed with the DAOPHOT package within IRAF. We only considered companions within 1400 AU in projected separation of our targets, in line with our analysis of D04 and with previous multiplicity surveys among YSOs (e.g., Leinert et al. 1993; Simon et al. 1995). When the companions were wider than about 1″, relative photometry was performed using small enough apertures. For tighter systems, PSF-fitting was performed, using another star located in the field-of-view when available or another single target observed with a similar AO correction. We estimate that our typical astrometric uncertainty is on order 0.5% for the separation and 05 for the orientation. Uncertainties on the relative photometry are on order 0.05–0.1 mag, depending on the system’s separation, flux ratio and image quality. We assume that the brightest component at is the primary of the system, except for the wide systems Oph 31, Oph 121, Ser 312 and Ser 317, for which previous observations allow unambiguous identification of the components. In these cases, the relative astrometry and photometry is presented using the Class I or FS protostar, which is fainter than its companions in some images, as the primary. The flux ratio and separation of all companions detected in this survey are presented in Table 2 and in Figure 2. Most of the wide systems were known from previous surveys (Haisch et al. 2002, 2004; D04) as well as from the 2MASS database. The tight companion to Oph 204 B was first found by Ratzka et al. (2005). We note that the relative fluxes measured for some systems in Taurus and Ophiuchus (IRAS 04113+2758, IRAS 04263+2426, Oph 31, Oph 46, Oph 121) differ from the measurements of D04 by up to a magnitude, indicating that these sources are variable. Such near-IR variability is typical of Class I YSOs (e.g., Park & Kenyon 2002).
| Target | P.A. | Notea | ||||
| (″) | (°) | (mag) | (mag) | (mag) | ||
| 04113+2758 | 4.06 | 153.8 | -0.43 | 0.24 | 1.0b | |
| 04239+2436 | 0.279 | 326.9 | 1.7c | 1.07 | 0.42 | 1 |
| 04263+2426 | 1.29 | 173.7 | -3.2 | -1.57 | 0.9b | |
| Oph 31 | 9.44 | 105.7 | (…) | -5.2 | -2.7 | 2 |
| Oph 46 | 1.23 | 66.4 | 1.15 | 1.56 | (…) | |
| 5.77 | 96.5 | 4.9 | 5.2 | (…) | ||
| Oph 51 | 9.08 | 152.5 | (…) | 0.37 | 2.45 | |
| Oph 121 | 2.34 | 352.8 | (…) | -3.1 | -2.3 | 2 |
| 3.73 | 51.5 | (…) | -3.3 | -2.5 | 2 | |
| Oph 141 | 0.57 | 334. | 3.0c | 4.0c | 3.1 | |
| 7.17 | 323.0 | 1.30 | 2.90 | 4.27 | 2 | |
| Oph 143 | 0.302 | 87.0 | (…) | -1.4c | 0.05 | |
| Oph 147 | 0.232 | 258.2 | 0.25 | 0.51 | 0.76 | 1 |
| Oph 167 | 1.64 | 10.1 | 3.35 | 3.56 | 3.90 | |
| Oph 204 AB | 3.02 | 240.4 | 1.83 | 3.09 | 3.08 | |
| Oph 204 B | 0.142 | 93.3 | -0.18 | -0.18 | 0.29 | |
| Ser 312 AB | 4.36 | 11.7 | (…) | -0.55 | 2.14 | |
| Ser 312 B | 0.128 | 92. | (…) | 1.60 | 0.50 | 1 |
| Ser 314 | 0.321 | 284.3 | 4.0c | 4.0 | 3.60 | 1 |
| 1.58 | 10.2 | 1.35 | 1.28 | 1.04 | ||
| Ser 317 AB | 5.19 | 173.6 | (…) | 0.24 | 1.16 | 2 |
| Ser 317 A | 2.48 | 109.2 | (…) | 7.3 | 8.2 | 1,3 |
| Ser 317 B | 0.152 | 227.2 | (…) | -1.2 | 0.05 | 1,4 |
| IRAS 29 | 0.167 | 173.8 | 2.5c | 2.5c | 2.0 | 1 |
| IRAS 50 | 0.704 | 341.1 | 6.5c | 7.0c | 4.3b | 1 |
| 2.82 | 144.3 | 7.5c | 7.5c | 7.2b | 1 | |
| IRAS 72 | 0.125 | 115.1 | -0.4 | 0.1 | 0.8 | 1 |
| IRAS 171 B | 0.215 | 333.5 | 0.94 | 1.14 | 1.22 | 1 |
| IRAS 270 | 0.112 | 20.8 | 0.7 | 1.1 | 1.6 | 1 |
-
a
1: newly identified companion; 2: candidate non-physical system; 3: candidate background companion; 4: not part of the survey (given for completeness only).
-
b
At least one of the two components is saturated in the image so that relative photometry cannot be accurately extracted.
-
c
The companion is not detected and only an upper limit to its flux can be determined, based on its known location.
2.3 Additional datasets
To complement our survey, we searched the literature for uniform high angular resolution surveys of protostars in the clouds studied here. We found 14 targets in Taurus and Ophiuchus observed with HST/NICMOS and/or ground-based near-IR AO observations on a 4m-class telescope, representing a total of 5 companions111We have estimated in D04 that the faintest companion to Oph 33 is a likely background source and we exclude from our analysis. within 1400 AU. These observations are summarized in Table 3. Although other high-resolution images on specific targets have been published (e.g., IRAS 04325+2402, Hartmann et al. 1999), we do not include them in our analysis to avoid a likely bias towards binary/multiple systems. Two of the targets studied by Padgett et al. (1999), DG Tau B and CoKu Tau 1, are candidate edge-on disks and it is unclear whether the central sources are intrinsically Class I or Class II sources. We nonetheless maintain these sources in our sample on the basis of their observed IR spectral index, as we do for Oph 31 (see Section 3.1). We note that the survey of Allen et al. (2002) was conducted with a 02 pixel scale, resulting in a poor capacity to detect companions closer than 05. It is therefore possible that a few very tight companion were missed in that survey. Furthermore, the astrometry listed in Allen et al. (2002) appears inaccurate: the separations of the wide companions to Oph 33 and Oph 141 are 15–20% too large and 18% too small, respectively. We do not know the reason for this discrepancy. For Oph 33 we adopt the astrometry presented in D04 and for Oph 141 that obtained during this survey, which is consistent with D04.
| Target | Alt. Name | Class | Ref.a | P.A. | Ref.a | Noteb | ||||||
| (″) | (°) | (mag) | (mag) | |||||||||
| Taurus | ||||||||||||
| 04016+2610 | 9.33 | 1.06 | I | 3.7 | 2,7 | 5 | ||||||
| 04169+2702 | 11.22 | 0.89 | I | 0.8 | 2,7 | 8 | ||||||
| 04248+2612 | 10.65 | 0.48c | I | 0.4 | 2,7 | 0.160 | 266. | 0.20 | 0.40 | 5 | ||
| 4.55 | 15.1 | (…) | 4.60 | 10 | ||||||||
| 04302+2247 | 11.52 | 0.15c | FS | 0.3 | 2,7 | 5 | ||||||
| 04361+2547d | TMR 1 | 10.55 | 1.27 | I | 3.7 | 2,7 | 0.31 | 19. | 0.88 | 0.36 | 4,8 | |
| 04381+2540 | TMC 1 | 12.00 | 1.20 | I | 1.31 | 2,6 | 8 | |||||
| DG Tau B | 11.52 | 2.05e | I | 2,12 | 5 | 1 | ||||||
| CoKu Tau 1 | 10.85 | 0.82e | I | 0.065 | 1,2,12 | 0.240 | 111. | 1.32 | 1.03 | 5 | 1 | |
| Ophiuchus | ||||||||||||
| Oph 33 | GY 11 | 14.15 | 0.31 | I | 0.011 | 3,6 | 6.20 | 86.1 | 1.2 | 0.76 | 9,10 | |
| 6.73 | 40.9 | 3.1 | 2.10 | 9,10 | 2 | |||||||
| Oph 37 | LFAM 3 | 9.94 | -0.06 | FS | 0.58 | 3,6 | 9,10 | |||||
| Oph 85 | CRBR 51 | 14.00 | 0.03 | FS | 0.035 | 3,6 | 9 | |||||
| Oph 103 | WL 17 | 10.28 | 0.42 | I | 0.88 | 3,6 | 9 | |||||
| Oph 137 | CRBR 85 | 13.21 | 1.48 | I | 0.36 | 3,6 | 9 | |||||
| Oph 145 | IRS 46 | 11.46 | 0.94 | I | 0.62 | 3,6 | 9 | |||||
-
a
References: 1) Strom & Strom (1994); 2) Kenyon & Hartmann (1995); 3) Barsony et al. (1997); 4) Terebey et al. (1998); 5) Padgett et al. (1999); 6) Bontemps et al. (2001); 7) Motte & André (2001); 8) Terebey et al. (2001); 9) Allen et al. (2002); 10) D04; 11) Ratzka et al. (2005); 12) Luhman et al. (2006).
-
b
1: edge-on disk source, for which the classification based on the index is doubtful; 2: candidate background companion.
-
c
The spectral indices for IRAS 04248+2612 and IRAS 04302+2247 are calculated from their band and IRAS 25 m photometry as there are only upper limits on their IRAS 12 m fluxes.
-
d
We observed IRAS 04361+2547 in our survey but did not detect the previously known companion that is listed here.
-
e
Due to confusion with bright nearby sources, there is no spatially resolved fluxes for DG Tau B and CoKu Tau 1. The spectral indices listed here are values of based on recent Spitzer/IRAC photometry.
Combined with our VLT AO observations, these additional observations allow us to construct a sample of 29 Class I and 29 FS objects observed at high-angular resolution in the near-IR. This sample, which represents 50–60% of all known such sources in Taurus and Ophiuchus, is the basis for the statistical analysis that we conduct in the following.
3 Results
3.1 Notes on individual objects
3.1.1 Extended objects
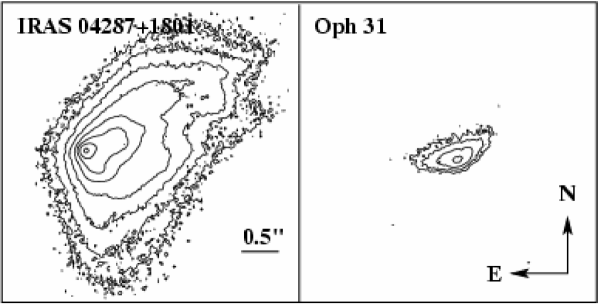
A few objects in our survey appeared extended in our AO images at and , resulting in a much poorer ability to detect nearby companions. While this is a consequence of a poor AO correction in the case of IRAS 04361+2547, the spatial extension of IRAS 04287+1801, Oph 31, Oph 121 and Oph 143 is real, as shown by images of point sources found in the field-of-view. These objects are discussed in more details below.
IRAS 04287+1801 presents a central point-like source surrounded by a vast nebulosity (Fig 3), similar to the case of Oph 143 (Fig 1c) and probably due to scattering off a circumstellar envelope or the base of a wide outflow. Our ability to detect tight companions is strongly reduced because of the enhanced background and the known radio companion located 035 South of the primary222The third companion recently detected by Lim & Takakuwa (2006) at 7mm is so close from the primary (009 projected separation) that we probably would not have detected it even in the absence of the extended nebulosity. is undetected in our images (Looney et al. 1997; Rodríguez et al. 1998). Because it has never been detected in the near-IR, this companion is not included in our study, but this illustrates that some companions may have been missed in our survey.
The apparent shape of Oph 31 (LFAM 1) appears different from the vast nebulosities surrounding other Class I protostars. Most noticeably, no central point source is found, even at (Fig 3). Furthermore, the overall extent of Oph 31 is much smaller. While this is in part due to the lower SNR of these observations, the contours appear to drop sharply, suggesting a small intrinsic size for this source333The HST/NICMOS images of Allen et al. (2002) also show that Oph 31 is a small, though clearly resolved, source.. Indeed, the elongated, slightly triangular shape of Oph 31 is reminiscent of images of T Tauri stars which possess an edge-on opaque circumstellar disk, such as HH 30 (Burrows et al. 1996) or HK Tau B (Stapelfeldt et al. 1998), albeit with a contrast between the main nebula and the counternebula that is too high for us to detect the latter. Our -band image reveals a similar shape, though with a poorer SNR. If this is confirmed with future, deep high-resolution imaging of the system, the possibility that this object is an envelope-free Class II source whose rising SED is the consequence of the presence of an edge-on disk will have to be revisited. We note however that several of the best studied Class II edge-on sources (HH 30, HK Tau B, HV Tau C) have observed spectral indices that are typical of normal Class II sources, i.e. , as a consequence of approximately gray scattering (Stapelfeldt & Moneti 1999; McCabe et al. 2006). Only a very specific configuration, in which the edge-on disks becomes optically thin between 2 and 10 m, may result in a misclassification of a Class II source in a Class I source. This is for instance the case of the newly discovered high-inclination disk surrounding IRAS 04158+2805, which has (Ménard et al. 2007; Glauser et al. 2007). We do not have evidence that this particular optical depth effect occurs for Oph 31, and we keep it in our sample for now on the basis of its very red spectral index.
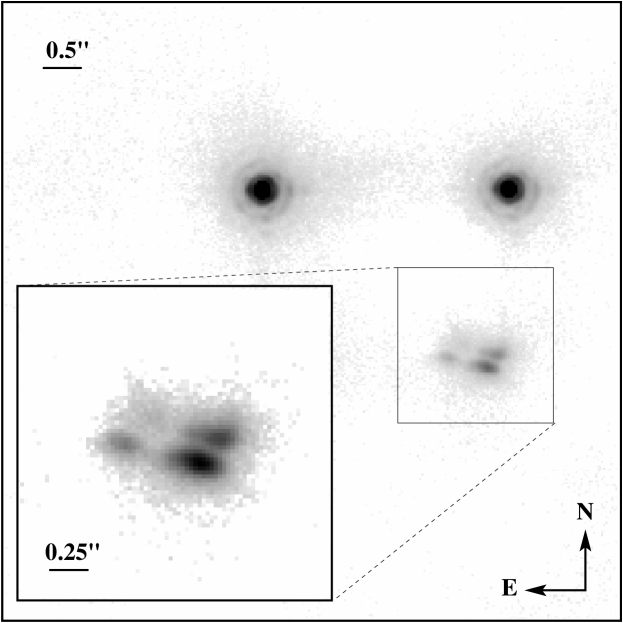
Oph 121 (WL 20 S), the southwestern component of a triple system, is also extended in our high-resolution images, as shown in Figure 4. This objects shows four elongated, roughly parallel nebula, most prominent at . The eastern, fainter nebulae, are significantly redder than the western nebulae (–2.8 instead of –2.1). The two nearby T Tauri stars, observed simultaneously, show that the AO correction was good and that the spatial extension of Oph 121 is intrinsic. This object was studied in detail by Ressler & Barsony (2001), as an “IR companion” to 2 T Tauri stars. From mid-IR images with 03 spatial resolution, they found the source to be extended on a scale of about 40 AU, roughly the size of the extended nebulosity in our images. The peak of the mid-IR emission is not exactly coincident with any of the nebulae we found, suggesting that we see only scattered light from a more embedded source that can be seen directly in the mid-IR, a regime in which dust absorbs much less. We defer a more detailed discussion of the nature of this source to a future dedicated paper but note that this could also be a Class II object that mimics a Class I source.
3.1.2 The tight companions to Oph 141 and Oph 143
Oph 141 (IRS 43) was resolved as a 05 binary in the mid-IR by Haisch et al. (2002), whose near-IR images did not have enough spatial resolution to detect it. Furthermore, Terebey et al. (2001) and Allen et al. (2002) failed to detect this companion with HST/NICMOS. We clearly detect the companion at (Figure 1b), with a relative astrometry consistent with that given by Haisch et al. (2002), but fail to detect it at and , as earlier HST surveys. Because of its point-source appearance at , we nonetheless consider this companion as real.
Both Terebey et al. (2001) and Ratzka et al. (2005) resolved Oph 143 (IRS 44) as a binary system with a separation 026 and a position angle similar to that found in our image (Figure 1c and Table 2). We failed to detect this companion at and over the bright extended nebulosity surrounding the protostar but both components appear point source-like in our image, i.e., with a 01 resolution. On the other hand, Allen et al. (2002) found two spatially extended structures separated by about 05, still along the same position angle (260°). Our image shows a bright, extended nebulosity up to 07 from the eastern component of the system, which may be what Allen et al. (2002) detected; again, their images suffered from a poor spatial sampling. We believe that the slight inconsistencies in astrometry are the consequence of the fact that the brightest component is embedded at and therefore it is difficult to pinpoint its location in previous observations. We therefore consider that this is the same companion, which is indeed the primary of the system.
3.1.3 The wide companions to Oph 31, Oph 121, and Oph 141
The wide companion to Oph 31 (LFAM 1) is Oph 34 (GY 12), a Class III object (Bontemps et al. 2001), while the two companions of Oph 121 (WL 20) are Class II objects (Ressler & Barsony 2001). Similarly, the wide companion to Oph 141 (IRS 43) is GY 263, an apparent Class II source (Haisch et al. 2002). It is unlikely, though not impossible, that an embedded protostar and a more evolved pre-Main Sequence star form a physical system. This suggests that at least some of these systems may result from a chance alignment of two/three cloud members in a crowded area of the Ophiuchus cloud.
Although we have estimated in D04 that the probability that these systems are physically bound is higher than 97%, it must be emphasized that such statistical tools are merely indicative when considering individual systems. Whenever possible, physical arguments should be given priority in confirming the physical nature of apparent systems. On the basis of their evolutionary status, we conservatively consider all these companions as non-physical in this study, but remind the reader that it is possible that some systems are indeed physically bound.
3.1.4 The faint companions to Oph 51 and Oph 182
In D04, we identified 2 faint companions to Oph 51, located 61 and 63, respectively, that we did not detect in this survey. Similarly, a faint 72 companion to Oph 182 (IRS 54) remained undetected in our higher-resolution images. In both cases, this is due to their faintness, since all these companions have mag, and to the poor AO correction we obtained at . At , we can place an upper limit to the brightness of the companions at mag. In the case of Oph 51, both of these companions have probabilities of being physically bound to the protostar () below the 2 level, and we consider them as likely background objects. On the other hand, we estimated in D04 the probability that the companion to Oph 182 is physically bound to be 97%. In the absence of more stringent physical arguments, we consider it as a candidate companion and include it in our analysis.
3.1.5 Ser 312, Ser 314 and Ser 317
Ser 312 (EC 88–89) and Ser 317 (EC 92–95) are both located in the rich SVS 4 complex. Our images reveal 10 stars in a 30″ square area. Most of these are known members of the Serpens clouds, with a mixture of Class I, FS and Class II sources (Pontoppidan et al. 2004). In such a crowded area, statistical arguments suggest that wide pairs may not be physically bound.
While Ser 317 A (EC 92) is undoubtedly a Class I source, the status of Ser 317 B (EC 95) is more uncertain. This object is frequently referred to as a Class I source in the literature (e.g., Preibisch 2003), although its spectral index is that of a Class II source (Pontoppidan et al. 2004). Since we have decided to use homogeneous estimates of the spectral index, we use the latter classification in our study. We therefore believe that this is an example of a non-physical system and we do not include it in our survey. As a consequence, the newly identified tight binary system Ser 317 B is not part of our studied sample either; its observed properties are nonetheless listed in Table 2 for completeness. Ser 317 A itself possesses a 25 companion which is extremely faint and much bluer than its Class I primary. As discussed in Section 3.3, we believe that this is a background star observed through the moderate extinction of the cloud at that location ( mag; Schnee et al. 2005). Ser 317 is therefore counted as a single star in our survey. On the other hand, despite the crowdedness of this region, we consider the wide Ser 312 A–B pair as physical as both objects have a protostar-like IR spectral index (Pontoppidan et al. 2004). Ser 312 B (EC 89) itself possesses a tight companion so that this system is counted as triple in our survey.
Ser 314 (SVS 20) is a well-known wide binary system (Eiroa et al. 1987). Our observations reveal that the primary of this system, SVS 20 S, also possesses an additional tight companion which was not known prior to this survey. This is therefore a triple system.
3.2 Multiplicity rate
3.2.1 Defining Complete and Extended Surveys
Within 1400 AU of the 58 Class I and FS targets surveyed in our sample, we have detected a total of 35 candidate companions, 12 of which are new discoveries. Including the faint companion to Oph 182 from D04 and excluding the probable background companion to Ser 317 and the likely non-physical systems in Ophiuchus and Serpens (see Sect. 3.1), we therefore have a total of 28 candidate companions, i.e., a raw multiplicity rate of 487% (uncertainties are calculated assuming binomial statistics). Since our sample was mostly defined on the basis of a flux limit, we may have biased our results towards finding too high a multiplicity rate. If a target slightly fainter than our limit has a tight and nearly equal flux companion, the combined system may be bright enough to enter our sample. In our sample, 46 targets have an unresolved photometry of , representing 25 candidate companions. Only 3 binary systems (IRAS 04248+2612, IRAS 04361+2547 and CoKu Tau 1) have a primary that is fainter than , so that the multiplicity rate of the subsample restricted to primaries brighter than this limit is 518%, indistinguishable from the rate quoted above. The flux bias is therefore negligible in our survey.
Because our targets lie at different distances from the Sun and represent a mixed bag of objects, with bolometric luminosities ranging from to 241 , it is difficult to compare this raw multiplicity rate to other surveys. We must therefore define a sample that is uniform in order to perform such comparisons. First of all, we discard the 2 most luminous targets in L1641 (IRAS 50 and IRAS 79, ), so that the most luminous targets in all clouds have , or . We then define a Complete Survey by considering a range of projected separation of 45–1400 AU. The lower limit corresponds to 01, our survey completeness limit, at the distance of L1641, the cloud furthest away from the Sun. This aims at circumventing the issue of the different distances to our targets. In this Complete Survey, we found 18 companions to 56 targets (see Table 4), i.e., a multiplicity rate of 326%. Taking advantage of the highest resolution achieved in our survey, we also define an Extended Survey that focuses on the Taurus and Ophiuchus clouds and spans the separation range 14–1400 AU. The multiplicity rate in this Extended Survey is 478% (18 companions to 38 targets).
Although the number of targets in each cloud is limited, we also consider the possibility of cloud-to-cloud differences in the multiplicity rates. In our Complete Survey, the Ophiuchus, Serpens and L1641 samples present the same multiplicity rate (average: 388%), which is however 1.5 higher than that found in Taurus (1910%), an effect reminiscent of the finding by Haisch et al. (2004). Fischer’s test indicates that the confidence level associated to this difference is on the order of only 84%. A deficit of companions in the Taurus cloud is surprising since our larger-scale survey in D04 showed that Taurus and Ophiuchus had indistinguishable multiplicity rates in the similar separation range 110-1400 AU. Furthermore, the difference between the Taurus and Ophiuchus multiplicity rates in our Extended Survey is negligible (). While there seems to be a higher proportion of companions in the 14–45 AU separation range in Taurus than in Ophiuchus, this is not statistically significant given the small size of our samples (confidence level 50% based on Student’s test). We therefore conclude that there is no significant difference in the multiplicity rates of Class I protostars across all four molecular clouds studied here.
| Cloud | Taurus | Ophiuchus | Serpens | Orion |
|---|---|---|---|---|
| 16 | 22 | 8 | 10 | |
| (45–1400 AU) | 3 | 8 | 3 | 4 |
| (14–1400 AU) | 7 | 11 | (…) | (…) |
3.2.2 Triple and higher order multiple systems
Overall, we found 6 triple systems, including the high-luminosity protostar IRAS 50 in Orion, and no higher order system in our survey. Within the Complete Survey, there are 40 single objects, 14 binaries and 2 triple systems. In other words, at least about 13% of all wide binaries are in fact higher order multiples. Since our survey probed a limited range of separations, this is to be considered a conservative lower limit to this ratio. For instance, Covey et al. (2006) found a large difference in radial velocity between the secondary of IRAS 04263+2426 and the surrounding gas cloud and suggested that the system may contain a third component. This component would be in such a tight orbit that we could not have resolved it here.
All triple systems in our surveys appear hierarchical: the ratio of their projected separations is always larger than 4, reaching more than 20 for IRAS 04248+2612, Oph 204 and Ser 312. The long term stability of triple systems depends on the ratio of semi-major axes, on the mass ratios and on the eccentricities of the inner and outer orbits (e.g., Eggleton & Kiseleva 1995). None of these quantities is directly available to us, but it is likely that most, if not all, of the multiple systems we discovered are stable on the long term. On the other hand, the fact that the Oph 121 triple systems is apparently non-hierarchical reinforces the suspicion that the companions to this protostar are not physically bound to it (see Section 3.1.3).
3.3 Colors of detected companions
In order to get a better understanding of the nature of the companions detected during this survey, we constructed an / color-color diagram and a / color-magnitude diagram. For this purpose, we used near-IR photometry from the literature for our sources and combined them with our relative photometry for resolved systems. The diagrams are presented in Figure 5. Photometric information was lacking for a few primaries in our survey, particularly in Orion, as well as for a few companions that were not observed or detected at one or several of the wavelengths of interest. Nonetheless, the diagrams show that the companions lie well within the magnitude and color ranges defined by the protostars in all clouds. The only exception is the companion to Ser 317 A, which is located 5–8 mag too low in the color-magnitude diagram. This companion is discarded from our survey as a background source (see Section 3.1). All other likely physical companions appear to have colors expected for Class I protostars, reinforcing the likelihood that they are related to their primaries.
The likely non-physical companions that we have identified in this survey (see Section 3.1) are located in the same general area of the diagrams as the primaries and singles of our sample, though with bluer colors on average (all have mag as opposed to only 3 out of 10 candidate physical companions). This is because they are likely to be unrelated Class II or Class III sources, which are expected to show a narrower and not-as-red range of near-IR colors than less evolved, more embedded objects. Their status is therefore consistent with their location in these plots. However, it is not possible to determine the physical nature of the companions newly identified in this survey based on these diagrams only because the and filters are too close in wavelengths and do not probe the overall behavior of the SED of the object in the IR. For instance, IRAS 04248+2612, which is classified as a Class I source here, has (Kenyon & Hartmann 1995) and is one of the least red objects in our sample. High-resolution mid-IR imaging is needed to classify the new companions and study, for instance, the pairing properties of Class I protostars (see Haisch et al. 2006).

4 Discussion
4.1 The initial rate of multiple stellar systems
Overall, we find a high multiplicity rate among our sample of Class I and FS protostars in both our Complete and Extended Surveys. To compare these multiplicity rates to those of Main Sequence field stars, we first note that our sample presents a wide range of bolometric luminosities, indicating that it spans a relatively wide range of stellar masses. With median and minimum luminosities of and respectively, it is likely that a substantial fraction of our targets will become low-mass stars. Among field stars, the multiplicity rate of low-mass stars is lower than that of solar-type stars (e.g., Fischer & Marcy 1992). Directly relevant to our analysis, Delfosse et al. (2004) found that the multiplicity rate of field M dwarfs is about 3 times lower than that of solar-type stars in the separation range 10–1000 AU. We can therefore safely consider that the DM91 field star multiplicity rate is a conservative upper limit to compare our survey to. We adopt the Gaussian prescription for the orbital period distribution of DM91, from which we derive a 19.5 % (27.8 %) multiplicity rate over the same separation range of our Complete (Extended) Survey, a factor of 1.7 lower than found in our survey. The probability of finding 18 or more companions out of 56 targets in our Complete Survey if the intrinsic multiplicity rate were that derived from DM91 is on the order of 3%, i.e., this hypothesis can be rejected at the 2.2 confidence level. Therefore, the multiplicity excess among embedded protostars over field stars can be considered as a robust result.
The overall multiplicity rate among Class I protostars is found to be independent of the molecular cloud, within our statistical uncertainties, even though these clouds span a wide range of physical conditions. The Taurus and L1641 samples, with maximum stellar densities of less than 100 star/pc-3 (Chen & Tokunaga 1994; Hartmann 2003), are representative of distributed star formation whereas both the Ophiuchus and Serpens samples represent clustered star formation, with densities in excess of 1000 star/pc-3 (Bontemps et al. 2001; Kaas et al. 2004), indicating that star formation has indeed proceeded to different outcomes in these clouds. Considering initial conditions, prestellar cores in Ophiuchus are on average times smaller and times denser than those found in Taurus (Motte & André 2001), probably a consequence of a more violent star formation process in Ophiuchus. This could also imply that the magnetic field is stronger in clouds like Ophiuchus and Serpens, since its strength is correlated with the cloud local density (Crutcher 1999). There is substantial scatter associated to this correlation, however, and it is not yet possible to compare the magnetic field strength in prestellar cores from one cloud to another. Besides the L1641 YSO population, Orion A has also formed the ONC, which contains high-mass stars that are not found in any of the other three clouds studied. Because of the presence of these high-mass stars, it is probable that the Orion A cloud is overall hotter than the other clouds, although it is unclear whether this is also true for prestellar cores, especially in the parts of L1641 that are quite distant from the ONC. Despite these differences between clouds, the outcome is an apparently universal multiplicity rate. This suggests that core fragmentation proceeds to form the same proportion of single and multiple systems irrespective of the cloud in which the stars form. Numerical simulations and semi-analytical considerations of cloud fragmentation suggest a strong dependence on the physical conditions in the cloud (Bonnell et al. 1992; Durisen & Sterzik 1994; Boss 2002; Sterzik et al. 2003), which is not supported by our findings. One possibility is that a self-regulatory process not included in these simulations would lead to a similar outcome of core fragmentation irrespective of the initial conditions. Recent 3-dimension magneto-hydrodynamics calculations suggest that the magnetic field could play such a role (e.g., Fromang et al. 2006; Hennebelle & Teyssier 2007). An alternative explanation is that core fragmentation can result in markedly different populations of multiple systems but that early ( yr) processes cancel out initial differences although it is difficult to imagine that different evolutionary paths lead to the same final state, however.
Since L1641 represents only a fraction of the entire Orion A cloud, it may not be representative of star formation throughout the whole molecular cloud. Unfortunately, no other survey for multiplicity among embedded protostars has been conducted in other parts of the cloud. Other parts of the Orion cloud, such as the ONC, host no significant population of Class I sources, so that it is impossible to determine what the initial conditions were before dynamical evolution reshaped the original multiple systems. Nonetheless, our survey reveals for the first time that the initial multiplicity rate can be high even in the Orion molecular cloud, i.e., that this property is not specific to low-mass clouds only. Furthermore, considering the range of total masses probed by the molecular clouds surveyed here and the size of typical star-forming regions in our Galaxy (Adams & Myers 2001; Lada & Lada 2003), we argue that this high multiplicity rate among the youngest stellar systems is the rule, not the exception. While it is possible that much richer clusters harbor a different proportion of multiple systems, these account for a minor fraction of all stars in our Galaxy.
4.2 Distribution of separations: a hint of cloud-to-cloud variation
While the overall multiplicity rates appear consistent from one cloud to another, we also searched for more subtle differences between our 4 subsamples. We find no obvious trend in the distribution of flux ratios as a function of molecular cloud. We note, however, that it is not possible to infer mass ratios from near-IR flux ratios for Class I protostars. Rather, one needs to determine bolometric luminosities, which require far-IR measurements, unavailable for the companions detected in this survey.
Using the distances to the molecular clouds, we transformed all angular separations into projected physical separations. From a statistical standpoint, the resulting distribution shown in Figure 6 should be similar to the distribution of actual semi-major axes (e.g., Brandeker et al. 2006). Beyond 140 AU, we combined the results of this survey with that of D04 in order to improve the statistical significance. The distribution shows a tentative peak towards short separations, as is the case for field solar-type binaries (DM91). The formal significance of this peak is weak, about 1.4, due to our limited sample size. However, we remind the reader that our completeness is poorer at the tightest separations than it is for wide systems. Therefore, taking statistical uncertainties at face value is improper in this case as there is a systematic bias against very tight companions in our survey. Note that if we had included the likely non-physical companions in this diagram, a secondary peak would have been observed in the outermost bin (19.54.2% combining this survey with D04), in sharp contrast with Main Sequence and T Tauri populations (DM91; Leinert et al. 1993). While it cannot yet be excluded that such systems are currently bound and will later be disrupted, this provides further support to the suspicion that most of these systems are indeed non-physical.

Interestingly, we note that the individual separation distributions for the Taurus, Ophiuchus and Serpens clouds all cover a similar wide range of separation and are indistinguishable. On the other hand, the distribution in L1641 seems different: none of the companions has a separation larger than 100 AU (excluding companions to the high luminosity protostars), suggesting a deficit of wider companions in this cloud. This is confirmed in our Complete Survey by a Mann-Whitney rank-sum statistical test which shows that the observed distribution of separations in Orion differs from that in the 3 other clouds at the 2.8 level (99.7% confidence level). While this is the most significant difference we can identify in the properties of multiple protostars in individual molecular clouds, the very small number of Orion companions included here (4) warrants a more extended survey to confirm this trend. It is nonetheless interesting to assess the possible implication of this result.
First of all, this result could be related to the finding by Brandner & Köhler (1998) that different parts of the Upper Scorpius OB association present different distributions of projected separations. These authors concluded that “same physical conditions that facilitate the formation of massive stars also facilitate the formation of closer binaries among low-mass stars, whereas physical conditions unfavorable for the formation of massive stars lead to the formation of wider binaries among low-mass stars”, a statement that seems to apply to the Orion A cloud as well, if the ONC and L1641 stellar populations had similar initial multiplicity properties. Interestingly, Sterzik et al. (2003) suggested that this behaviour could be understood as a consequence of differences in prestellar core temperatures: semi-analytical arguments led them to conclude that higher core temperatures should result in tighter binary systems. The temperature of prestellar cores in L1641 has not yet been measured yet and there are no more prestellar cores in Upper Scorpius, so we cannot test this scenario. The presence of high-mass stars in these clouds suggest higher overall cloud temperatures, but this effect may not apply to prestellar cores which are efficiently self-shielded from surrounding ultraviolet radiation.
We also note that such a preference for very tight systems in Orion was not found in multiplicity surveys of Class II objects. Previous surveys found companions throughout the 100–1000 AU range they probed (Prosser et al. 1994; Padgett et al. 1997; Petr et al. 1998; Beck et al. 2003; Köhler et al. 2006; Reipurth et al. 2007) even in the ONC444Scally et al. (1999) showed that there is essentially no binary system with a separation larger than 1000 AU in the whole ONC cluster, as opposed to the Taurus star-forming region or to the field binary population, but that study focused on larger separations than probed here., where prestellar core temperatures would likely have been hottest. This seems to cast some doubt on the temperature effect proposed by Sterzik et al. (2003), and furthermore, it is not easy to reconcile with our findings for Class I protostars. If confirmed, this result would indeed point towards a phenomenon that repopulates the “wide systems” category over a timescale of 1 Myr. However, Class II surveys focused on the clustered populations of young stars and may not be directly comparable to the Class I population we have studied here. It would therefore be premature to speculate about the nature of this pehnomenon.
4.3 Evolution of multiple systems within molecular clouds
If the multiplicity rate among Class I protostars is about 1.5 times higher than it is in the field in all molecular clouds, as suggested by our results, some systems must be disrupted before the populations disperse in the interstellar medium. We analyze here a possible scenario to account for this.
First of all, the multiplicity excess we find among Class I and FS protostars is reminiscent of that found among slightly more evolved Class II and III targets in Taurus and Ophiuchus (e.g., Ghez et al. 1993; Leinert et al. 1993; Duchêne 1999; Ratzka et al. 2005). Further testing the possibility of time evolution of the multiplicity rate, we separate the Taurus and Ophiuchus targets on the basis of the presence or absence of an extended millimeter envelope, as we have already done in D04. No significant difference is found between the two categories. This result seems to contradict our finding in D04 that there was a marginally significant decrease of multiplicity rate with evolutionary status. We do not confirm this trend here, a consequence of two factors. First, the sample sizes in the present survey are smaller. Second, most of the companions identified here as candidate non-physical systems (see Section 3.1) are associated with targets possessing extended millimeter envelopes. Indeed, re-analyzing the D04 sample excluding the candidate non-physical systems results in a confidence level of only 82%, down from the original 99.6% level. This latter point suggests that this trend may not have as strong a statistical support as previously thought. Overall, there appears to be no significant evolution of the multiplicity rate as a function of evolutionary status among the YSOs probed here. In other words, the high multiplicity rate is already set at an age of yr and it hardly evolves on a timescale of yr in clouds like Taurus and Ophiuchus. Comparison surveys of samples Class II objects in Serpens and L1641 do not exist yet, so we cannot extend this conclusion to the other clouds studied here.
Ejection of companions from bound systems can have two independent causes. First of all, if star formation proceeds to create many triple and higher-multiplicity systems, it is possible that some of them are unstable and eventually eject one or more of their components to reach a stable configuration (e.g., Reipurth 2000). Alternatively, numerical simulations have shown that wide companions can easily be stripped off their primary if they are located in a dense stellar populations because of the repeated near encounters of independent cluster members (e.g., Kroupa 1995). In the following we investigate both possibilities in the context of our observations.
The multiple systems in our survey are all triple and most of them appear safely hierarchical, suggesting that little companions will be expelled past the Class I phase. Furthermore, the ratio of binary to triple systems in our Complete Survey is consistent with the lower limit derived by Koresko (2002) and very similar to that obtained by Correia et al. (2006), both of whom searched for additional companions around known T Tauri binary systems. Among 52 binaries in the sample studied by Correia et al., 7 are triple (and none quadruple) in the 45–1400 AU separation range. The proportion of triple systems therefore remains constant on a yr timescale. It is difficult to directly compare the fraction of triple systems observed among Class I protostars to that found among field stars to probe longer timescale. As discussed in Tokovinin & Smekhov (2002), it is likely that the DM91 survey missed some faint, wide companions and therefore underestimated the number of triple and higher-order systems among field dwarfs. Correia et al. (2006) concluded that the difference between the fraction of Class II and solar-type field multiple systems is not significant. Therefore, it appears that the disintegration of unstable multiple systems, which is frequently observed in numerical simulations (Delgado-Donate et al. 2004; Goodwin et al. 2004a), is limited to a timescale of less than yrs. Only future large-scale surveys of the youngest, Class 0, sources will eventually test this common predictions of numerical simulations of core fragmentation. Nonetheless, the limited number of high-order multiples found in this and other surveys, combined with the high total multiplicity rate we have found, supports the conclusion by Goodwin & Kroupa (2005) that fragmentation generally leads to systems with or components, leaving little room for internal decays to play a role in the time evolution of the multiplicity rate.
If companions are not ejected from unstable multiple systems, they can be ejected as the result of the fly-by of an unrelated cloud member. The absence of a significant decrease of the multiplicity rate from Class I to Class II sources in a cloud like Taurus is not surprising. The stellar density, even in the densest sub-clusters, is too low to account for more than a handful of disrupted systems (Kroupa & Bouvier 2003). On longer timescale, the evolution is also very limited, since the sub-clusters dissolve in a few Myr and each member is then released into the galactic field, which can only disrupt the widest systems, with separations beyond AU (Weinberg et al. 1987). Therefore, the high multiplicity rate observed in Taurus will remain almost unchanged even on a timescale of several Gyr, implying that field stars are primarily populated from star-forming regions where the multiplicity rate is substantially reduced, typically denser clusters (Kroupa 1995).
The Ophiuchus and Serpens populations can be considered as clustered among those studied here. Indeed their peak stellar density is similar to that of “dominant-mode cluster” defined by Kroupa (1995). In Kroupa’s simulations, which assume a universal multiplicity rate and orbital period distribution, these populations will lose 40% of their initial companions over a timescale of Myr. Most of these companions should in fact be stripped off their primaries during the first few crossing times, which is about 3 Myr, as the clusters start expanding. No evolution is observed in Ophiuchus, where Class II and Class III sources exhibit a significant multiplicity excess (Ghez et al. 1993; Reipurth & Zinnecker 1993; Duchêne 1999). Considering that the age of the stellar population is Myr (Wilking et al. 1989; Greene & Meyer 1995), i.e., less than the crossing time, this is not so surprizing. In Serpens, Kaas et al. (2004) concluded that star formation underwent two separate bursts, so that the Class I aggregate will probably expand by a factor of 10 in volume over a timescale of 1 Myr. If the population of Class II sources resulting from the previous burst has underwent such an expansion, dynamical interaction may have ripped off some wide companions, although the cluster may not be old enough for its multiplicity rate to have substantialy decreased yet. Unfortunately, no high-angular resolution of Class II sources in this cloud have been conducted so far.
The situation in Orion is more complex. All multiplicity surveys among Class II populations in this cloud have found low multiplicity rate in the separation range 100–1000 AU, consistent with, or slightly lower than, that found in field-star surveys (e.g., Padgett et al. 1997; Petr et al. 1998; Beck et al. 2003; Köhler et al. 2006; Reipurth et al. 2007). These studies have considered both the inner and outer parts of the ONC in Orion A, as well as NGC 2024, 2068 and 2071 in Orion B. These latter clusters are intermediate in density between Serpens and the ONC but are all much denser than the distributed L1641 population surveyed here. A direct comparison of these surveys with our results is therefore not possible. However, if companions are as frequent in all Orion sub-clusters than in L1641 on scales of tens to hundreds of AU in the embedded phase, this implies that many wide companions are disrupted in less than 1 Myr. Kroupa et al. (1999) pointed out that the ONC is probably in a rapidly expanding phase and that it was much denser in the past. This suggests that all stellar systems already experienced several near encounters and that any loosely bound companion has already been ejected, even in the outer regions. The large optical high-angular survey recently conducted by Reipurth et al. (2007) presented supporting evidence for this scenario. In other words, multiplicity surveys among Class II and Class III sources are not sufficient to determine whether the initial multiplicity rate in Orion is similar or different from other molecular clouds (Kroupa 1995). Our finding is the first direct evidence that the initial multiplicity rate is indeed high in Orion, at least in some regions of the molecular cloud. Therefore, if they can be extended to the entire Orion cloud, our results support the view of Kroupa et al. (1999) of a binary-rich initial population that rapidly looses most of its widest systems due to close encounters with the cluster. In this framework, a multiplicity study of the distributed Class II population of L1641, a region of moderate stellar density, would provide the observational missing piece of the puzzle, i.e., the possibility to compare embedded and optically-detected YSOs in the same Orion population and to constrain the evolution of these systems on a timescale of yr.
5 Conclusion
We have used diffraction-limited imaging from 1.6 to 3.7 m with the 8m-VLT adaptive optics system to search for tight companions around 45 embedded Class I and FS protostars in the Taurus, Ophiuchus, Serpens and L1641 (Orion A) molecular clouds. We complement our analysis with published high-resolution surveys of similar objects in Taurus and Ophiuchus to build a sample of 58 Class I and FS targets. We derive an average multiplicity rate of 326% over the separation 45–1400 AU. In the Taurus and Ophiuchus clouds, the closest clouds in our sample, we further derive a multiplicity rate of 478% over the separation range 14–1400 AU. These rates are a factor of higher than those derived for nearby solar-type field stars, extending the multiplicity excess found among several populations of T Tauri star to even younger ages. Most importantly, we find that the embedded protostars in L1641 show a multiplicity rate similar to that in other clouds, indicating for the first time that a high multiplicity rate is achieved after core fragmentation in all types of nearby molecular clouds, including giant molecular clouds such as Orion A, which also hosts the dense ONC cluster. We also find a high multiplicity rate in Serpens, the densest cluster in our survey.
Our results support the view that core fragmentation results in a multiplicity rate for wide companions that does not depend on the initial conditions reigning in the cores, as opposed to predictions of most numerical simulations. Rather, our findings support a scenario in which all YSO populations start with a similar set of multiplicity properties and only evolve as a consequence of disruptive system-system interactions prior to dilution of the clusters in the field. Follow-up multiplicity surveys of the Class II and Class III populations of the Serpens and L1641 clouds would provide key empirical verifications of this scenario. We found 6 triple systems, all of them hierarchical, and higher-order systems are very rare among Class I/FS sources within the separation ranges studied here. It is unlikely that many companions will be ejected as a result of internal decay of unstable systems past the Class I phase. Finally, we also find a possible trend for the embedded Orion multiple systems to have different orbital properties than those in other clouds, namely systematically tighter projected separations, a hint that environmental conditions may impact on the properties of protobinaries.
Acknowledgements.
We are grateful to Monika Petr-Gozens for her referee report which helped us improve our manuscript. We thank the ESO Paranal staff for their precious help during our Visiting Observing programs and ESO’s User Support Department for our Service Observing programs. This research has made use of the SIMBAD database and the VizieR catalogue access tool, operated at CDS, Strasbourg, France, and the data products from the 2 Micron All Sky Survey consortium. This work was supported in part by the Programme National de Physique Stellaire of CNRS/INSU (France) and the National Science Foundation Science and Technology Center for Adaptive Optics managed by the University of California at Santa Cruz under cooperative agreement No. AST - 9876783.References
- (1) Adams, F. C., & Myers, P. C. 2001, ApJ, 553, 744
- (2) Allen, L. E., Myers, P. C., Di Francesco, J., et al. 2002, ApJ, 566, 993
- (3) André, P., & Montmerle, T. 1994, ApJ, 420, 837
- (4) André, P., Bouwman, J., Belloche, A., & Hennebelle, P. 2003, in Chemistry as a diagnostic of star formation, eds Curry & Fich, NRC Press, 127
- (5) Barsony, M., Kenyon, S. J., Lada, E. L. & Teuben, P. J. 1997, ApJS, 112, 109
- (6) Beck, T. L., Simon, M., & Close, L. M. 2003, ApJ, 583, 358
- (7) Belloche, A., André, P., Despois, D. & Blinder, S. 2002, A&A, 393, 927
- (8) Belloche, A., Hennebelle, P., & André, P. 2006, A&A, 453, 145
- (9) Bertout, C. & Genova, F. 2006, A&A, 460, 499
- (10) Bertout, C., Robichon, N. & Arenou, F. 1999, A&A, 352, 574
- (11) Bonnell, I., Arcoragi, J.-P., Martel, H., & Bastien, P. 1992, ApJ, 400, 579
- (12) Bontemps, S., André, P., Kaas, A. A., et al. 2001, A&A, 372, 173
- (13) Boss, A. P. 2002, ApJ, 568, 743
- (14) Brandeker, A., Jayawardhana, R., Khavari, P., Haisch, K. E. Jr., & Mardones, D. 2006, ApJ, 652, 1572
- (15) Brandner, W., & Koehler, R. 1998, ApJL, 499, L79
- (16) Burrows, C. J., Stapelfeldt, K. R., Watson, A. M., et al. 1996, ApJ, 473, 437
- (17) Chen, H., & Tokunaga, A. T. 1994, ApJS, 90, 149
- (18) Correia, S., Zinnecker, H., Ratzka, T. & Sterzik, M. F. 2006, A&A, 459, 909
- (19) Covey, K. R., Greene, T. P., Doppmann, G. W., & Lada, C. J. 2006, AJ, 131, 512
- (20) Crutcher, R. M. 1999, ApJ, 520, 706
- (21) Delfosse, X., Beuzit, J.-L., Marchal, L., et al. 2004, in Spectroscopically and Spatially Resolving the Components of the Close Binary Stars, eds. Hilditch, Hensberge & Pavlovski, ASP Conf. Series, 318, 166
- (22) Delgado-Donate, E. J., Clarke, C. J., Bate, M. R., & Hodgkin, S. T. 2004, MNRAS, 351, 617
- (23) Devillard, N. 2001, in Astronomical Data Analysis Software and Systems X, eds. Harnden, Primini & Payne, ASP Conf. Series, 238, 525
- (24) Duchêne, G. 1999, A&A, 341, 547
- (25) Duchêne, G., Bouvier, J., & Simon, T. 1999, A&A, 343, 831
- (26) Duchêne, G., Bouvier, J., Bontemps, S., André, P., & Motte, F. 2004, A&A, 427, 651 (D04)
- (27) Duquennoy, A., & Mayor, M. 1991, A&A, 248, 485
- (28) Durisen, R. H., & Sterzik, M. F. 1994, A&A, 286, 84
- (29) Eggleton, P., & Kiseleva, L. 1995, ApJ, 455, 640
- (30) Eiroa, C., Lenzen, R., Leinert, C. & Hodapp, K.-W. 1987, A&A, 179, 171
- (31) Festin, L. 1998, A&A, 336, 883
- (32) Fischer, D. A., & Marcy, G. W. 1992, ApJ, 396, 178
- (33) Fromang, S., Hennebelle, P., & Teyssier, R. 2006, A&A, 457, 371
- (34) Ghez, A. M., Neugebauer, G., & Matthews, K. 1993, AJ, 106, 2005
- (35) Glauser, A. M., Ménard, F., Pinte, C., et al. 2007, A&A, submitted
- (36) Goodwin, S. P., & Kroupa, P. 2005, A&A, 439, 565
- (37) Goodwin, S. P., Whitworth, A. P., & Ward-Thompson, D. 2004a, A&A, 414, 633
- (38) Goodwin, S. P., Whitworth, A. P., & Ward-Thompson, D. 2004b, A&A, 423, 169
- (39) Greene, T. P., & Meyer, M. R. 1995, ApJ, 450, 233
- (40) Greene, T., Wilking, B. A., André, P., Young, E. T., & Lada, C. J. 1994, ApJ, 434, 614
- (41) Haisch, K. E. Jr., Barsony, M., Greene, T. P., & Ressler, M. E. 2002, AJ, 124, 2841
- (42) Haisch, K. E. Jr., Greene, T. P., Barsony, M., & Stahler, S. W. 2004, AJ, 127, 1747
- (43) Haisch, K. E. Jr., Barsony, M., Ressler, M. E., & Greene, T. P. 2006, AJ, 132, 2675
- (44) Hartmann, L. 2003, ApJ, 578, 914
- (45) Hartmann, L., Calvet, N., Allen, L., Chen, H., & Jayawardhana, R. 1999, AJ, 118, 1784
- (46) Hennebelle, P., & Teyssier, R. 2007, A&A, in press (astro-ph/0709.2887)
- (47) Kaas, A. A., Olofsson, G., Bontemps, S., et al. 2004, A&A, 421, 623
- (48) Kenyon, S. J., & Hartmann, L. 1995, ApJS, 101, 117
- (49) Köhler, R., Petr-Gozens, M. G., McCaughrean, M. J., et al. 2006, A&A, 458, 461
- (50) Koresko, C. D. 2002, AJ, 124, 1082
- (51) Kroupa, P. 1995, MNRAS, 277, 1491
- (52) Kroupa, P., & Bouvier, J. 2003, MNRAS, 346, 343
- (53) Kroupa, P., Petr, M. G., & McCaughrean, M. J. 1999, New A., 4, 495
- (54) Lada, C. J. 1987, in Star forming regions, Dordrecht, IAU Symp. 115, 1
- (55) Lada, C. J., & Lada, E. A. 2003, ARA&A, 41, 57
- (56) Leinert, Ch., Zinnecker, H., Weitzel, N., et al. 1993, A&A, 278, 129
- (57) Lenzen, R., Hartung, M., Brandner, W., et al. 2003, SPIE, 4841, 944
- (58) Lim, J., & Takakuwa, S. 2006, ApJ, 653, 425
- (59) Looney, L. W., Mundy, L. G., & Welch, W. J. 1997, ApJL, 484, L157
- (60) Looney, L. W., Mundy, L. G., & Welch, W. J. 2000, ApJ, 529, 477
- (61) Luhman, K. L., Whitney, B. A., Meade, M. R., et al. 2006, ApJ, 647, 1180
- (62) McCabe, C., Ghez, A. M., Prato, L., et al. 2006, ApJ, 636, 932
- (63) Ménard, F., Dougados, C., Magnier, E., et al. 2007, ApJ, submitted
- (64) Motte, F., & André, P. 2001, A&A, 365, 440
- (65) Motte, F., André, P., & Neri, R. 1998, A&A, 336, 150
- (66) Padgett, D. L., Strom, S. E., & Ghez, A. M. 1997, ApJ, 477, 705
- (67) Padgett, D. L., Brandner, W., Stapelfeldt, K. R., et al. 1999, AJ, 117, 1490
- (68) Park, S., & Kenyon, S. J. 2002, AJ, 123, 3370
- (69) Petr, M. G., Coudé du Foresto, V., Beckwith, S. V. W., Richichi, A., & McCaughrean, M. J. 1998, ApJ, 500, 825
- (70) Pontoppidan, K. M., van Dishoeck, E. F., & Dartois, E. 2004, A&A, 426, 925
- (71) Preibisch, T. 2003, A&A, 410, 951
- (72) Prosser, C. F., Stauffer, J. R., Hartmann, L., Soderblom, D. R., Jones, B. F., Werner, M. W., & McCaughrean, M. J. 1994, ApJ, 421, 517
- (73) Ratzka, T., Köhler, R., & Leinert, Ch. 2005, A&A, 437, 611
- (74) Reipurth, B. 2000, AJ, 120, 3177
- (75) Reipurth, B., & Zinnecker, H. 1993, A&A, 278, 81
- (76) Reipurth, B., Rodríguez, L. F., Anglada, G., & Bally, J. 2002, AJ, 124, 1045
- (77) Reipurth, B., Rodríguez, L. F., Anglada, G., & Bally, J. 2004, AJ, 127, 1736
- (78) Reipurth, B., Guimarães, M. M., Connelley, M. S., & Bally, J. 2007, AJ, in press (astro-ph/0709.3824)
- (79) Ressler, M. E., & Barsony, M. 2001, AJ, 121, 1098
- (80) Rodíguez, L. F., D’Alessio, P., Wilner, D. J., et al. 1998, Nature, 395, 355
- (81) Rousset, G., Lacombe, F., Puget, P., et al. 2002, SPIE, 4839, 140
- (82) Scally, A., Clarke, C. J., & McCaughrean, M. J. 1999, MNRAS, 306, 253
- (83) Schnee, S. L., Ridge, N. A., Goodman, A. A., & Li, J. G. 2005, ApJ, 634, 442
- (84) Simon, M., Ghez, A. M., Leinert, C., et al. 1995, ApJ, 443, 625
- (85) Stamatellos, D., Whitworth, A. P., & Ward-Thompson, D. 2007, MNRAS, 379, 1390
- (86) Stapelfeldt, K., R., & Moneti, A. 1999, in The Universe as seen by ESO, Cox & Kessler eds., ESA-SP, 427, 521
- (87) Stapelfeldt, K. R., Krist, J. E., Ménard, F., et al. 1998, ApJL, 502, L65
- (88) Sterzik, M. F., Durisen, R. H., & Zinnecker, H. 2003, A&A, 411, 91
- (89) Strom, K. M., & Strom, S. E. 1994, ApJ, 424, 237
- (90) Strom, K. M., Newton, G., Strom, S. E., et al. 1989, ApJS, 71, 183
- (91) Terebey, S., van Buren, D., Padgett, D. L., Hancock, T., & Brundage, M. 1998, ApJL, 507, L71
- (92) Terebey, S., van Buren, D., Hancock, T., Padgett, D. L. & Brundage, M. 2001, in From Darkness to Light, eds. Montmerle & André, ASP Conf. Series, 243, 243
- (93) Tohline, J. E. 2002, ARA&A, 40, 349
- (94) Tokovinin, A., & Smekhov, M. G. 2002, A&A, 382, 118
- (95) Warren, W. H. Jr. & Hesser, J. E. 1977, ApJS, 34, 115
- (96) Weinberg, M. D., Shapiro, S. L., & Wasserman, I. 1987, ApJ, 312, 367
- (97) Wilking, B. A., Lada, C. J., & Young, E. T. 1989, ApJ, 340, 823