119–126
N-body simulations of star clusters
Abstract
Two aspects of our recent N-body studies of star clusters are presented:
1) What impact does mass segregation and selective mass loss have on integrated photometry?
2) How well compare results from N-body simulations using NBODY4 and STARLAB/KIRA?
keywords:
methods: n-body simulations, methods: numerical, stars: mass function, galaxies: star clusters1 Selective mass loss and integrated photometry
“Mass segregation” describes the effect that high-mass stars are preferentially found in the center of clusters, while the outskirts are preferentially occupied by lower-mass stars.
(Primordial) mass segregation is studied observationally in a number of clusters. Some examples are: the Orion Nebula Cluster ([Hillenbrand & Hartmann 1998]), 6 LMC clusters ([de Grijs et al.2002]).
Dynamical mass segregation is also found from N-body simulations (e.g. [Inagaki & Saslaw 1985, Giersz & Heggie 1997]), caused by two-body encounters and energy equipartition. A number of authors also point at the preferential mass loss of low-mass stars when the cluster evolves in a tidal field (e.g. [Spitzer & Shull 1975, Giersz & Heggie 1997]), as mass segregation populates the cluster outskirts preferentially with low-mass stars where they are most easily stripped from the cluster potential. The resulting changes in the overall stellar mass function inside the cluster are quantified by [Baumgardt & Makino (2003)].
In [Lamers et al. (2006)] we use the results from [Baumgardt & Makino (2003)] to incorporate the changing mass function slope in a simplified manner into the GALEV code (see [Anders & Fritze-v. Alvensleben 2003] and references therein) to calculate its impact on the integrated photometry of star clusters.
Our main findings are:
-
•
at 0 – 40 per cent of the cluster’s lifetime: the cluster colours are comparable to standard models (i.e. without preferential loss of low-mass stars)
-
•
at 40 – 80 per cent of the cluster’s lifetime: a cluster appears too blue/young (compared to standard models) due to the loss of lower main-sequence stars
-
•
at 80 – 100 per cent of the cluster’s lifetime: a cluster appears too red/old (compared to standard models) due to the loss of main sequence turn-off stars
-
•
when interpreting photometry of mass-segregated clusters, that have preferentially lost low-mass stars, with standard photometric models (without taking mass-segregation effects into account) the derived ages can be wrong by 0.3 – 0.5 dex
2 Benchmark test for N-body codes: Comparing NBODY4 with STARLAB/KIRA
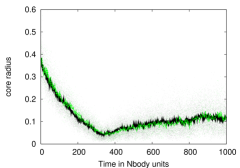
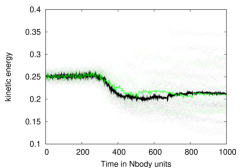
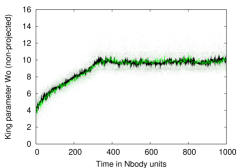
Here we propose a benchmark test for comparison of N-body codes: 1024 equal-mass particles, Plummer sphere model, without primordial binaries, external tidal field or stellar/binary evolution.
We performed simulations using the same input files (10 individual runs) for NBODY4 (see e.g. [Aarseth 1999]) and STARLAB (see e.g. [Portegies Zwart et al. 2001]), following the setup from the proposed benchmark test. We find stochastic effects to be of importance for 10 runs, hence we supplemented the STARLAB results with 20 additional runs (equivalent NBODY4 runs are in preparation). Some results are shown in Fig. 1. For most parameters studied the results are virtually indistinguishable. Some questions remain for the kinetic energy and the parameter distributions of dynamically formed binaries. Any differences there could be originating from the different treatment of binaries, or due to stochastical effects. Further tests (e.g. with primordial binaries) are in preparation.
 |
 |
 |
 |
Acknowledgements.
We thank the ISSI in Bern, Switzerland, where parts of this project were carried out. We thank Evghenii Gaburov and Simon Portegies Zwart for comments and suggestions.References
- [Aarseth 1999] Aarseth, S. 1999, PASP, 111, 1333
- [Anders & Fritze-v. Alvensleben 2003] Anders, P., & Fritze-v. Alvensleben, U. 2003, A&A, 401, 1063
- [Baumgardt & Makino (2003)] Baumgardt, H., & Makino, J. 2003, MNRAS, 340, 227
- [de Grijs et al.2002] de Grijs, R., Gilmore, G. F., Johnson, R. A., & Mackey, A. D. 2002, MNRAS, 331, 245
- [Giersz & Heggie 1997] Giersz, M., & Heggie, D. C. 1997, MNRAS, 286, 709
- [Hillenbrand & Hartmann 1998] Hillenbrand, L. A., & Hartmann, L. W. 1998, ApJ, 492, 540
- [Inagaki & Saslaw 1985] Inagaki, S., & Saslaw, W. C. 1985, ApJ, 292, 339
- [Lamers et al. (2006)] Lamers, H. J. G. L. M., Anders, P., & de Grijs, R. 2006, A&A, 452, 131
- [Portegies Zwart et al. 2001] Portegies Zwart, S. F., McMillan, S. L. W., Hut, P., & Makino, J. 2001, MNRAS, 321, 199
- [Spitzer & Shull 1975] Spitzer, L., Jr., & Shull, J. M. 1975, ApJ, 201, 773