The Lopsidedness of Present-Day Galaxies: Results from the Sloan Digital Sky Survey
Abstract
Large-scale asymmetries in the stellar mass distribution in galaxies are believed to trace non-equilibrium situations in the luminous and/or dark matter component. These may arise in the aftermath of events like mergers, accretion, and tidal interactions. These events are key in the evolution of galaxies. In this paper we quantify the large-scale lopsidedness of light distributions in 25155 galaxies at from the Sloan Digital Sky Survey Data Release 4 using the azimuthal Fourier mode. We show that the lopsided distribution of light is primarily due to a corresponding lopsidedness in the stellar mass distribution. Observational effects, such as seeing, Poisson noise, and inclination, introduce only small errors in lopsidedness for the majority of this sample. We find that lopsidedness correlates strongly with other basic galaxy structural parameters: galaxies with low concentration, stellar mass, and stellar surface mass density tend to be lopsided, while galaxies with high concentration, mass, and density are not. We find that the strongest and most fundamental relationship between lopsidedness and the other structural parameters is with the surface mass density. We also find, in agreement with previous studies, that lopsidedness tends to increase with radius. Both these results may be understood as a consequence of several factors. The outer regions of galaxies and low-density galaxies are more susceptible to tidal perturbations, and they also have longer dynamical times (so lopsidedness will last longer). They are also more likely to be affected by any underlying asymmetries in the dark matter halo.
1 Introduction
It has long been recognized that galaxies show large-scale asymmetries in their structure (Baldwin et al. 1980). Lopsided galaxies have such asymmetries where one side of their disk is more massive and/or more extended than the opposite side. This lopsidedness can be traced in the spatial structure of the stars (Rix & Zaritsky 1995) and/or the HI gas (Richter & Sancisi 1994) and/or in the large-scale kinematics of this material (Swaters et al. 1999).
There are a variety of mechanisms or events that have been proposed to produce the observed lopsidedness. All of them involve a time-dependent non-equilibrium dynamical state, in most cases triggered through an external process. Such external processes are a natural consequence of the standard Lambda Cold Dark Matter cosmological framework. This implies that galaxies assemble hierarchically (a process that is on-going). Examples that can lead to lopsidedness include a minor merger (Walker et al. 1996; Zaritsky & Rix 1997), the tidal interaction resulting from a close encounter between roughly equal-mass galaxies (Kornreich et al. 2002), and the asymmetric accretion of intergalactic gas into the disk (Bournaud et al. 2005; Kereš et al. 2005). Other mechanisms involve the dark matter halo: stars and gas orbiting in a lopsided dark matter halo (Weinberg 1994; Jog 1997; Jog 1999) or a stellar/gas disk that is offset with respect to the center of the dark matter halo (Levine & Sparke 1998; Noordermeer et al. 2001). These also involve past tidal interactions and/or mergers that have perturbed the dark matter halo, but such perturbations may be quite long-lived. Finally, dynamical processes internal to the disk that lead to mildly lopsided distributions have also been investigated (Shu et al. 1990; Syer & Tremaine 1996; Masset & Tagger 1997).
A variety of programs to study lopsidedness have been undertaken over the past decade. Most of these investigations have studied the lopsided distribution of the stellar component through analysis of optical and near-infrared images. Zaritsky & Rix (1997) studied a magnitude-limited sample of 60 field spiral galaxies. They measured lopsidedness as the radially averaged, azimuthal Fourier amplitude of the light (see Section 2.2 below) and computed lopsidedness between 1.5 and 2.5 scale lengths in the galactic disks. The value of indicates the typical large-scale variation in mass density from side to opposite side at the same distance from the galactic center. The mass density typically varies from between times the average density at the same radius. They found that % of field spiral galaxies exhibited significant lopsidedness (). Rudnick & Rix (1998) followed up this work by studying lopsidedness in 54 early-type galaxies and found that % had . Conselice et al. (2000) studied a sample of 113 galaxies (elliptical, spiral, and irregular) but used a 180-degree rotational asymmetry measure . They found that asymmetry is strongly dependent on morphological type, with lower asymmetry in elliptical and lenticular galaxies and higher asymmetry in late-type disk and irregular galaxies. More recently, Bournaud et al. (2005) have measured the Fourier parameter for 149 galaxies in the Ohio State University Bright Galaxy Survey. They confirmed that a large fraction of galaxies have significant lopsidedness in their stellar disks, with late-type galaxies being more lopsided.
Lopsidedness in the light distribution can be produced by either a corresponding asymmetry in the underlying mass distribution in the stellar population or by large-scale variations in the mass-to-light ratio (e.g., from star formation and dust obscuration). Rix & Zaritsky (1995) investigated this issue with a sample of 18 face-on spiral galaxies imaged in the K′ (2.2 m) band where the effect of young stars or dust is minimized. They found that about a third of the sample showed significant lopsidedness (similar to results from optical investigations). Similarly, Rudnick & Rix (1998) found that lopsidedness in early-type disk galaxies is nearly identical when observed in the , , and bands. They concluded that an asymmetric mass distribution then accounts for the majority of the asymmetry in the light distribution in these galaxies.
Lopsidedness has also been studied in the distribution of HI gas. Since the HI can frequently be traced to significantly larger radii than the stars, these investigations are highly complementary to the optical image analysis. Due to the time-consuming nature of HI interferometric mapping, only modest size samples have been analyzed in this way (Swaters et al. 1999). On the other hand, Richter & Sancisi (1994) have examined the global HI line profiles for roughly 1700 galaxies, and shown that at least 50% are significantly asymmetric (confirming that the large-scale HI distribution is frequently lopsided). HI maps also show that apart from a lopsided distribution of the gas the HI rotation curves are often asymmetric (Swaters et al. 1999). The connection between the phenomena of structural and kinematic lopsidedness in galaxies is not yet clear (Swaters et al. 1999).
Despite these diverse investigations and the abundance of proposed models, the origin of lopsidedness remains unsettled. For models involving tidal interactions or minor mergers, there is an expected link between lopsidedness and the local environment. The evidence in this regard has been mixed (e.g., Wilcots & Prescott 2004; Bournaud et al. 2005; Angiras et al. 2006, 2007; De Propris et al. (2007)).
The investigations summarized above have all involved relatively small samples of galaxies, making it difficult to assess the overall distribution of asymmetry or lopsidedness as a function of the basic parameters that characterize the structure of galaxies. This is the first of three papers in which we use the wealth of data available from the Sloan Digital Sky Survey (SDSS) to extend these studies of small samples (of-order one hundred galaxies) to large samples (tens of thousands). In this paper, we describe our sample selection and methodology. We also relate lopsidedness to the basic structural properties of the galaxies. In Paper II we will investigate the connection between lopsidedness and both star formation and black hole growth in galaxies. Finally, in Paper III we will examine the connection between lopsidedness and the local galaxy environment.
In §2, we begin by presenting an initial low-redshift sample from the SDSS and describe the observations and properties for its galaxies. Next, we explain our lopsidedness calculation. In §3, we address the major data quality issues that limit the reliability of the measurements for portions of the sample. On this basis, we apply cuts on the observational parameters to weed out the problematic cases for our subsequent analysis. Next, §4 describes the lopsidedness of galactic light distributions in different optical/near-IR bands, its correspondence with lopsided mass distributions, and its radial dependence. We then examine the relationship between lopsidedness and the basic structural properties of galaxies in §5. Finally, we summarize our findings in §6.
2 Data & Basic Methodology
2.1 Initial Sample
The initial sample of galaxies was taken from the Sloan Digital Sky Survey (York et al. 2000; Stoughton et al. 2002), a large survey of photometric and spectroscopic data across sr. of the northern sky. The sample is derived from SDSS Data Release 4 (Adelman-McCarthy et al. 2006). The survey’s dedicated 2.5-m telescope (Gunn et al. 2006) at Apache Point Observatory uses a unique CCD camera (Gunn et al. 1998) and drift-scanning to obtain -, -, -, -, and -band photometry (Fukugita et al. 1996; Hogg et al. 2001; Ivezić et al. 2004; Smith et al. 2002; Tucker et al. 2006). The pixel scale is 0396/px. Fiber spectroscopy is obtained using 3″ fibers and results in wavelength coverage between 38009200 Å at a resolution .
As we will show below, meaningful measurements of lopsidedness impose requirements on the angular size and signal-to-noise in the galaxy image. These criteria are not met by the full SDSS Main galaxy sample (median redshift and magnitude 17.8; citealtswl+02). Accordingly, our initial galaxy sample was selected from the Main sample with a simple redshift cut (). It contains 67107 galaxies. The SDSS photometric pipeline, PHOTO (Lupton et al. 2001), provides Petrosian apparent magnitudes and half- and 90%-light radii ( and ) in each of the five bands, along with seeing conditions and other photometric and structural properties. We use the methodology described in Kauffmann et al. (2003a) to use the spectral information to derive -band mass-to-light ratios and hence stellar masses (). These stellar masses and the -band half-light radii are then used to measure stellar surface mass densities (, defined as the mean mass per unit area inside the half-light radius; see Kauffmann et al. 2003b).
2.2 Measuring Lopsidedness
Lopsidedness in galactic light distributions has been computed in recent years by two useful approaches. One approach, used by Rix & Zaritsky (1995) and in later work, is to perform an azimuthal Fourier decomposition of galaxy light. The first mode, , quantifies the large-scale overabundance of light in one side of a galaxy with a corresponding under-abundance in the opposite side. The first mode quantifies a galaxy-wide lopsidedness that can be quickly computed for large numbers of galaxies. In the second approach, detailed in Abraham et al. (1996), a different asymmetry index was devised by subtracting a 180∘ rotated image from the original galaxy image and summing the residual light compared to the total galaxy light. This lopsidedness measure is sensitive to both large- and small-scale variations in symmetry. To convert into a measure of only large-scale lopsidedness, a smoothing filter can be applied beforehand to the image (Conselice 2003). Our interest is to examine lopsidedness in tens of thousands of galaxies, and we have determined that the modal lopsidedness algorithm is computationally less expensive than . We will therefore take the radially averaged first mode strength, , as the measure of lopsidedness for the galaxy as a whole in each band, as has been done in previous studies (Rix & Zaritsky 1995; Zaritsky & Rix 1997; Rudnick & Rix 1998; Rudnick et al. 2000). The details of the calculation will fill out this section, but we first summarize the general method.
The galaxy light is binned into radial and azimuthal bins, and then a finite Fourier transform is applied to the surface brightness in each radial bin. The transform for the th radial bin is
| (1) |
The transform gives the mode magnitudes and phases for each mode . The magnitudes are divided by the zeroth mode (average surface brightness) and radially averaged to calculate for that galaxy and band, including the lopsidedness .
We compute this average over the radial range between and . These are the practical limits: we can not go much inside because of the seeing effects discussed below, and can not go much outside because the data become unacceptably noisy. As we will show below, the average radial variation in beyond is modest, and the mean value for does not depend significantly on the precise choices of the inner and outer radii.
The transform also yields values of the higher-order modes. The second mode represents a combination of effects: ellipticity, inclination, two-arm spiral structure, and barred structure. Since we do not deproject the images to a face-on orientation, the amplitude of the second mode primarily measures the ellipticity of the image. Higher-order modes () may include multi-arm spiral structure as well as Fourier “ringing” of features also present in lower-order modes. For example, a galaxy with a high ellipticity will have a strong second mode with weaker even-order modes also present. Similarly, a lopsided galaxy will have a strong first mode with weaker odd-order modes present as well.
To begin our process, the galaxy center was determined. Precision centering is important because moving the center by more than px can increase the lopsidedness significantly. The inner region of the galaxy was smoothed in a 3 px radius to reduce the effects of Poisson noise in determining the center. 111Conselice et al. (2000) have employed a different centering technique with their asymmetry measure. They found that the best center to use for the calculation was the center that minimizes . In our multi-mode calculation, we have found that the center that minimizes the strength of one mode does not minimize the strengths of other modes. Thus the minimization technique would require a different center for each mode. Since the modes are calculated simultaneously in the Fourier transform, minimization is not feasible. We assume that the center point of the galaxy is within 3 px of the brightest pixel of the inner region of the galaxy. That brightest pixel is our initial estimate of the center point. To improve this estimate, the first moment of light was computed in a 3 3 px box centered on the brightest pixel. The first moment is the origin that minimizes the second moment and gives a central position in fractional units of a pixel that improves upon the brightest pixel estimate.
Our centering method was used on each image without reference to the centers determined for the same object in other bands. This means that each object was given a separate center point for each band. Nonetheless, the agreement between these independent center points is good. Of the three pairs of distances between centers in the three bands, the angular distance between the - and -band centers is the greatest. The variation between these bands is ( px). Some of the scatter may be attributable to the offset pixel locations between images of different bands, i.e., the coordinates of the center of the central pixel in one band will not be the located in the center of a pixel in another band. The rest of the scatter is due to variations in the central structure between the different bands. Our tests show that the mode strengths are significantly increased in a given image if the center point is moved more than 0.5 px from the best center. Thus the scatter of center points between the different bands should have no significant affect on the subsequent lopsidedness computation.
The value of the sky background was calculated using the DAOPHOT package in the IDL Astronomy Library. For each galaxy and each band, the sky-subtracted image was partitioned into a polar grid of logarithmic radial bins between the Petrosian radii and and centered at the determined galaxy center. We selected the minimum and maximum determined in the -, -, and -band images as the inner and outer radii of the grid, and the same grid size is used in the lopsidedness computation in all three bands. The radial bins were further partitioned into equal azimuthal bins. The number of radial bins was allowed to vary with the size of the galaxies by setting the innermost bin size as close to but no smaller than 1.0 pixel. Exactly 12 azimuthal bins were used in each grid so that the first six Fourier modes () could be determined. Each pixel that was split by the grid into more than one bin was divided into a array of sub-pixels, and bilinear interpolation of neighboring pixels’ surface brightness assigned each sub-pixel with a value of surface brightness. Higher-order interpolation, such as using bicubic splines, showed no significant improvement and thus was not worth the computational expense. The sub-pixels were then included in the appropriate polar bin.
Galaxies whose observed light distributions are contaminated with light from other galaxies and foreground stars pose a problem for this Fourier decomposition. The contaminating light results in a set of strong modes that describe the combination of galaxy and overlapping star or galaxy rather than the desired galaxy by itself. Foreground stars can be masked out with some ease once they are located in images. We use the DAOPHOT routines of the IDL Astronomy Library to locate them and then estimate radii where their light drops to half the level of the sky background noise. For intervening galaxies, we queried the SDSS PHOTO catalog for galaxy positions and Petrosian . Then a mask image was created that was the same size as the galaxy image, but each pixel accepted values of either 0 (pixel is masked) or 1 (pixel is “good”). The Fourier decomposition calculation uses only the “good” pixels after the stars and galaxies are masked in the image. Any pixels that lay within a star, another galaxy, or other extraneous light source were ignored.
After masking out the unwanted pixels, the surface brightness was computed in each bin of the grid. An azimuthal Fourier transform (Eq. 1) was performed in each radial bin to determine a magnitude and phase for each mode . The transform was formulated as a general linear least squares problem (Press 2002). Errors on the magnitudes and phases were deduced from the diagonal elements of the covariance matrix. The phase of the th mode is physically identical to phases for integers , so was chosen for each radial bin to minimize the radial dependence of the phases. The magnitudes were then divided by the zeroth mode to give relative magnitudes . These values give a profile of lopsidedness () and higher modes (), each normalized to the average brightness at radius .
For simplicity, we prefer to use a single value of the Fourier modes in each band rather than a radial profile. We calculate the average of at each radius between and , weighted by its error at each radius, to give a single, global measure for each galaxy in each band. The weighting naturally counts the dimmer, outer reaches of the galaxy less than the brighter, inner region and discounts any radial bin that is too contaminated with light from other sources. At radii where an extraneous light source has been masked out, the azimuthal Fourier transform can fail. Such radial bins are excluded from the weighted average.
Since is a positive definite quantity, random errors would preferentially overestimate the quantity. We therefore correct the average in the manner used in the past (e.g., Rudnick & Rix 1998) and adopt
| (2) |
as the strength of the th mode, where is the random error in the weighted mean mode. We will discuss systematic and random errors in in the next section (§3).
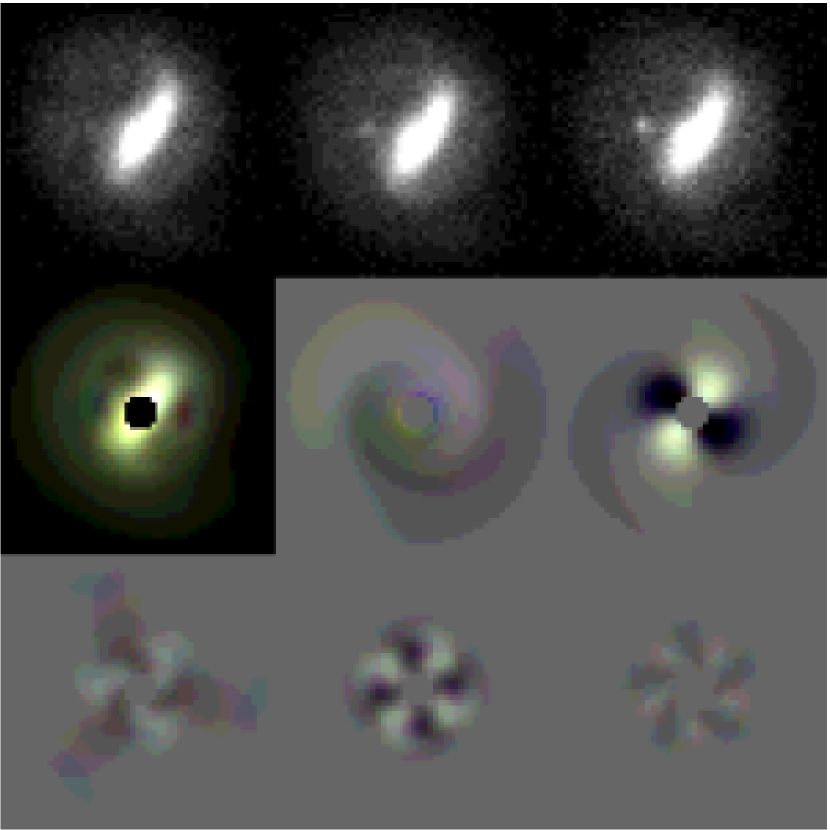
As an example, we show the Fourier decomposition of the nearly face-on, barred spiral galaxy SDSS J125416.38-020204.4 in Fig. 1. The first three panels show the , , and band images of this galaxy, a three-color image reconstructed from Fourier modes, and a three-color image of the through 5 Fourier modes. The core of the galaxy is omitted in the three-color images as the decomposition is not attempted in that region. However, for this illustration, we have extended the Fourier decomposition to radii interior to . The central bar is described by the strong even-order modes in all three bands at low radii . The bar weakens at larger radii, and the even-order modes then decrease with increasing radii. At , the brightness of the galaxy drops until sky noise becomes significant. The lopsidedness in this galaxy is easily seen outside the bright center of the galaxy. The bar’s brightness falls off more slowly with radius in the upper-right direction than in the lower-left direction. This lopsidedness is described in all three bands by the significant first mode strength, which rises from near 0.1 to 0.4 between 2 and 8. The radially-averaged lopsidedness, as computed between and in the -band, is 0.29.
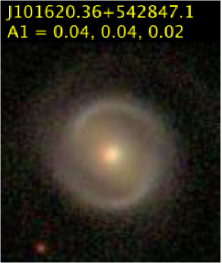
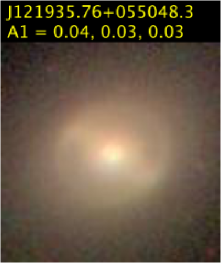
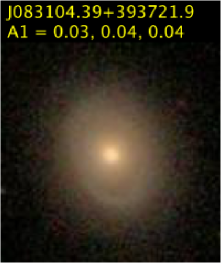
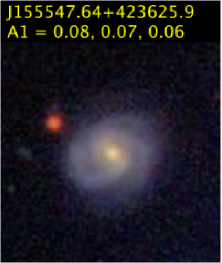
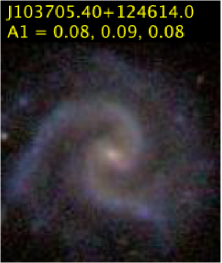
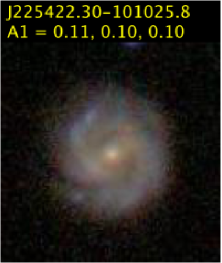
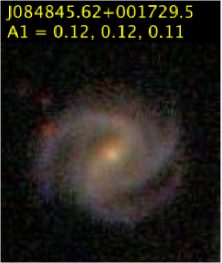
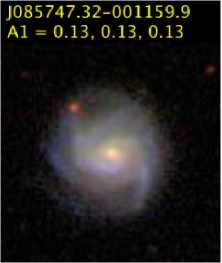
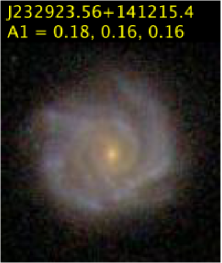
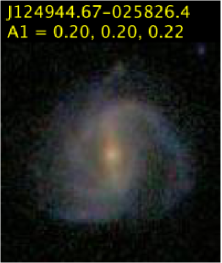
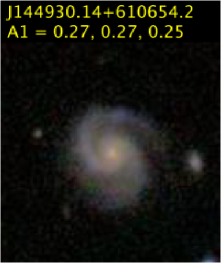
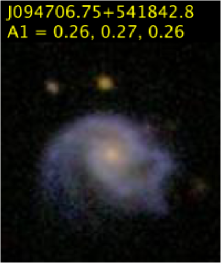
Next, in Fig, 2, we show twelve example late-type galaxies along with their lopsidedness values in a progression from symmetric to lopsided. The three galaxies shown in the top row each exhibit a regular and symmetric appearance and have low values of lopsidedness . The next 5 galaxies have moderate values of 0.080.13, and minor distortions are visible in each case. In cases of two-arm spiral galaxies, one or both arms are disturbed so that their shape and brightness are not identical at equal distances from the galactic center. In the case of SDSS J084845.62+001729.5 (third row, left), a second arm on the right has no clear counterpart on the left, and the lopsidedness of this galaxy is 0.110.12 depending on the band. The final four galaxies shown have clear asymmetry in brightness and shape and have in each band.
| Row | Column | Name | |||
|---|---|---|---|---|---|
| Left | J101620.36+542847.1 | 0.04 | 0.04 | 0.02 | |
| 1st | Middle | J121935.76+055048.3 | 0.04 | 0.03 | 0.03 |
| Right | J083104.39+393721.9 | 0.03 | 0.04 | 0.04 | |
| Left | J155547.64+423625.9 | 0.08 | 0.07 | 0.06 | |
| 2nd | Middle | J103705.40+124614.0 | 0.08 | 0.09 | 0.08 |
| Right | J225422.30101025.8 | 0.11 | 0.10 | 0.10 | |
| Left | J084845.62+001729.5 | 0.12 | 0.12 | 0.11 | |
| 3rd | Middle | J085747.32001159.9 | 0.13 | 0.13 | 0.13 |
| Right | J232923.56+141215.4 | 0.18 | 0.16 | 0.16 | |
| Left | J124944.67025826.4 | 0.20 | 0.20 | 0.22 | |
| 4th | Middle | J144930.14+610654.2 | 0.27 | 0.27 | 0.25 |
| Right | J094706.75+541842.8 | 0.26 | 0.27 | 0.26 |
3 Final Sample Selection: The Effect of Systematic Errors
Lopsidedness is ideally measured from an image of a bright, well resolved, and face-on galaxy without any overlapping background or foreground sources. In such an image, the Poisson noise of the detected light is negligible, and the size of the point-spread function is small compared to the characteristic size scale of the lopsidedness. Neither dust extinction nor inclination would significantly alter the light distribution. In real data, these conditions are not all met, and the resulting effects can systematically change the measurements of the Fourier modes.
Below we address in turn how various sources of systematic error affect the strengths of Fourier modes. We then use this information to refine our sample selection and define a final sample of galaxies whose images are only negligibly affected by these systematic errors. These will form the basis of our scientific analysis.
3.1 Ellipticity and Inclination
We employ a circular polar grid to bin light from each galaxy, even if the galaxy appears elliptical and/or inclined on the image. The measured lopsidedness of elliptically projected galaxies can be underestimated by using the circular grid if the deprojected bright side of the galaxy coincides with the minor axis of the galaxy. This occurs because the increment and decrement of light along the minor axis due to lopsidedness is compared to the average light along a circular ring that also intersects the brighter, inner region at the major axis. Similarly, the lopsidedness will be overestimated if the bright and dim sides of the galaxy are aligned with the major axis. The resulting systematic error is diminished if the phase angle of the first Fourier mode wraps at least a quarter of the way around the galaxy. In this case, the first mode strength would be overestimated at some radii and underestimated at other radii, and the radially averaged would have a smaller systematic error.
Our sample has galaxies imaged in random orientations, and the over- and under-estimates of lopsidedness average to cancel each other except for highly inclined galaxies. We show this result in Fig. 3, where we have plotted the distribution of (and also of ) as a function of as measured in the -band (similar results are seen in the and -bands).
The relationship between and is clear. Face-on galaxies have a small second mode, typically 0.1-0.3, while highly inclined galaxies have a much higher second mode that often exceeds unity for . Though not shown, higher-order even modes show a similar trend with as but with weaker magnitude.
Lopsidedness exhibits an increase at low but is mainly independent of for . The rise of observed lopsidedness for increasingly inclined galaxies arises for a few reasons. First, dust lanes appear more optically thick when a galaxy is viewed nearly edge-on. A lopsided, edge-on distribution of dust may obscure the light in a symmetric galaxy to make the galaxy light appear lopsided. Second, the systematic error in using a circular grid for an elliptically projected galaxy becomes more severe at low ratio. Nonetheless, shows little dependence on for , so our use of a circular polar grid and a finite-order transform on slightly elongated galaxies produces no significant systematic error when in reference to a large population of galaxies. The distributions of as measured in the -, -, and -bands are given in the lower panel of Fig. 3. A cut at in all three bands eliminates the 22% of the sample, and 52194 galaxies are retained. This cut on inclination is very similar to that adopted by Bournaud et al. (2005).


3.2 Spatial Resolution
Lopsided galaxies systematically appear more symmetric when observed in conditions of poor seeing. Light is smeared from the brighter regions of the galaxy into surrounding, dimmer regions, reducing the contrast of the brighter and dimmer sides of the galaxy. The effect is more pronounced when the point-spread function is wide compared to the physical size of the galaxy. It is useful to define a seeing resolution
| (3) |
as the relative size of the galaxy compared to the FWHM of the PSF in band .
To demonstrate how poor seeing reduces lopsidedness, we have selected from our galaxy sample a subsample of 13500 isolated, well resolved galaxies with and and convolved the -band images with a circular Gaussian PSF of 20 varying widths. We calculated of each galaxy at each level of blurring. The subsample was binned by of the original (not blurred) images. Fig. 4 shows how the median of the blurred images changes with seeing resolution in each bin of the original . Post-blurring exhibits little change for highly resolved galaxies. At moderate resolutions , lopsidedness decreases with the seeing resolution. Barely resolved galaxies with approach regardless of the lopsidedness at high resolution.

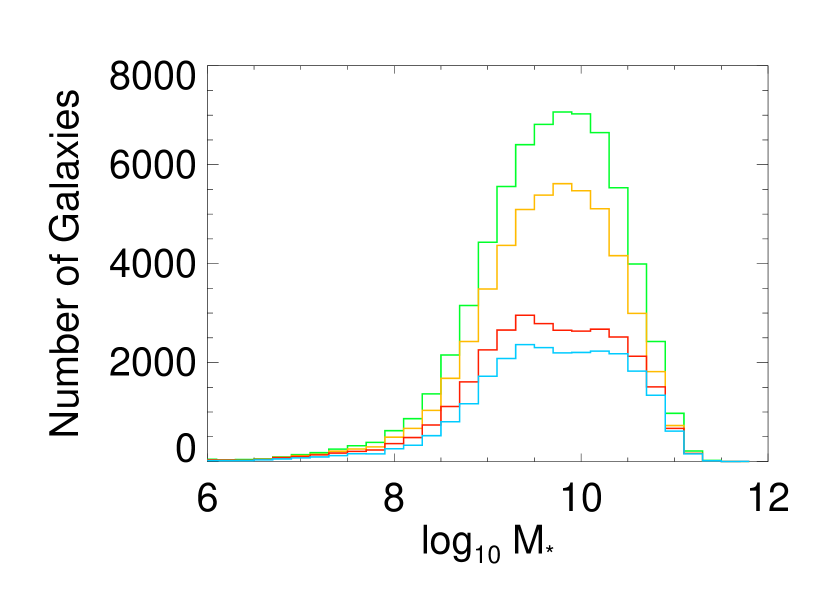
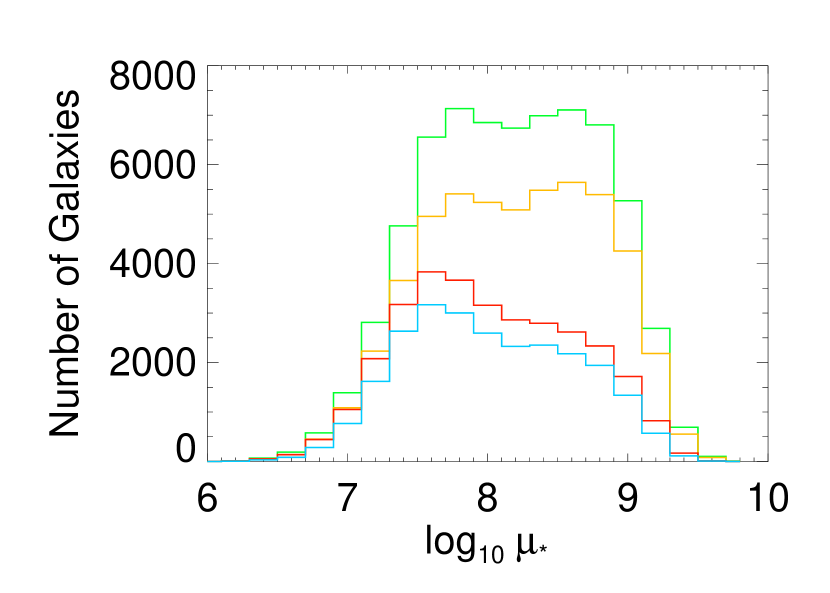
The same effect is seen in our primary sample of galaxies without convolving the images with a point-spread function. Fig. 5 shows the distribution of at different seeing resolutions along with the distributions of , , and for the whole sample (before the inclination cut is made). At low seeing resolution , the sample distribution of shifts to lower lopsidedness (0.07 median), and few galaxies have . At high resolution , the distribution has a median that levels off around 0.12, and high lopsidedness is found in 1 of every 4 galaxies. The 5th percentile increases with resolution to at .
Our simulations of poor seeing suggest that a distinction between symmetric and lopsided galaxies can be identified by the measure even if is diminished by moderately poor seeing. The relative lopsidedness of well-resolved galaxies is preserved as the seeing is worsened down to , i.e., the most symmetric galaxies with are likely to also be the most symmetric galaxies if they were observed instead at , and likewise for the more lopsided galaxies. However, the extremely lopsided galaxies may not be able to identified without higher resolution, perhaps . Trends at extreme lopsidedness may not be reliable because only well resolved galaxies can lie in this lopsidedness range. At , seeing reduces the lopsidedness of 75% of galaxies by less than a factor of 1.5. We cut our sample at this seeing value and keep only galaxies better resolved than in the , , and bands. The cut alone reduces the sample size by to 42558 galaxies. The more lopsided galaxies are underrepresented due to this systematic effect.

3.3 Flat-fielding error
Poor flat-fielding in a galaxy image can increase the apparent lopsidedness of the galaxy. Poor correction of the CCD’s spatial gradients in sensitivity can introduce a brighter sky level on one side of the galaxy and a dimmer sky level on the other side. Because a constant sky value is subtracted from the image in the lopsidedness computation, the gradient in sky brightness will increase the strength of the odd-order Fourier modes and overestimate the galaxy’s true lopsidedness. We have calculated flat-field errors in our images by calculating the sky level in regions in each of the four corners of the image and adopting the standard deviation of those sky levels as our flat-fielding error. We find that flat-fielding errors are typically negligibly small, % of the sky value, and only become significant at large radii from a galactic center. In our calculation of , the contribution of the modes at large radii is weighted less, and so flat-fielding errors do not significantly affect the lopsidedness values that we have computed. We therefore do not impose a cut based on flat-fielding error for our SDSS-detected galaxies.
3.4 Random Error
Noisy data from low-surface-brightness galaxies can bias measurements of lopsidedness in a systematic way. The uncertainty in the correct light-weighted center will be higher in a dim galaxy than in a bright one, and a shifted center leads to an overestimate of the lopsidedness.
We have undertaken two tests to determine the effect of noise on our measurements. First, we have compared the values of measured in the - and -bands. Lopsidedness values have been determined before to be mainly independent of wavelength in this range (Rudnick & Rix 1998), and we will confirm this result for our sample as a whole in §4.1. In the left panel of Fig. 6, we show the discrepancies between in the two bands as a rough indicator of random error on the measurement in general. Here the ratio is computed for light within the -to- annulus in which is computed. The interquartile (25th-75th percentile) range is small at high ( at ) and gradually increases at low as the distribution spreads out. At , the interquartile range has doubled to , and the median is skewed only slightly toward negative values of .
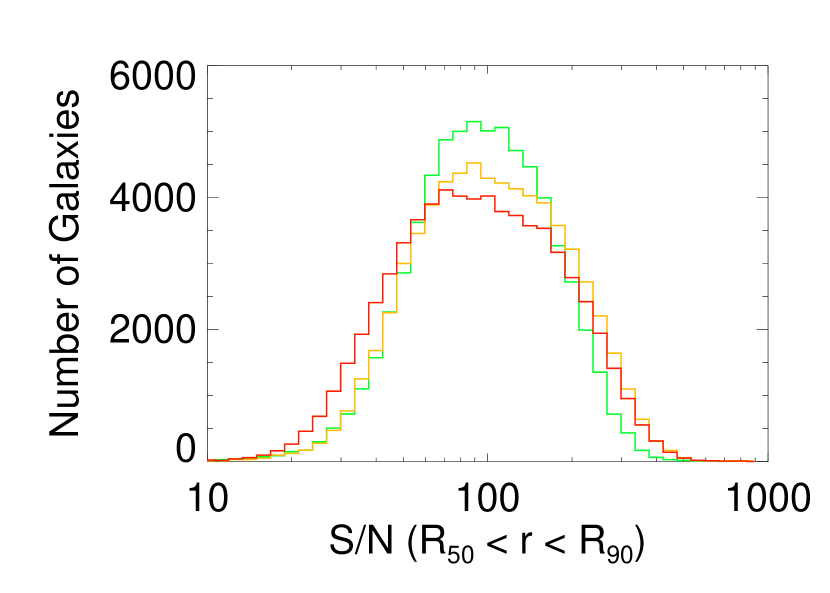
We have applied another cut to our sample to remove dim, noisy galaxies with in any of the three bands. The right panel of Fig. 6 shows the distribution of in three bands. The cut removes a 5% of the sample. The sample retains 25155 galaxies after this cut and also the inclination and seeing cuts have been made.

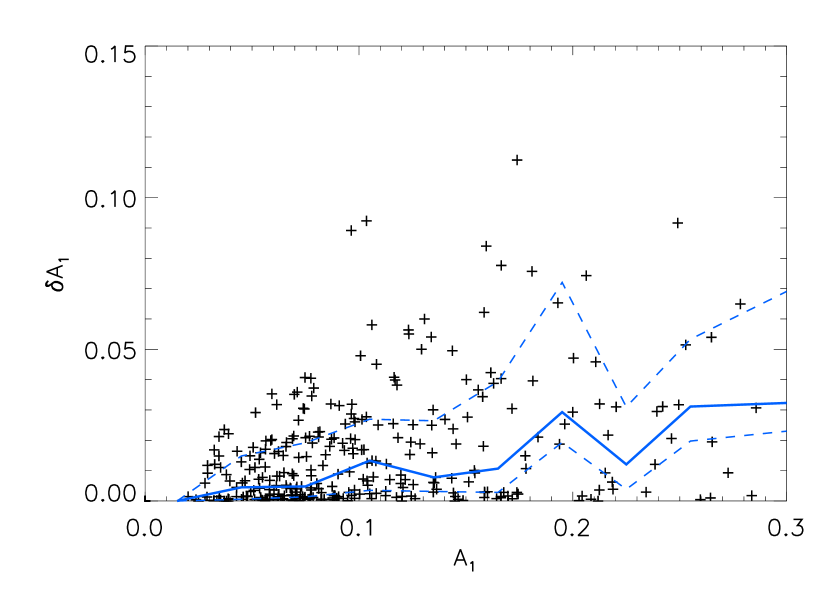
To further evaluate the effect of noise in calculating lopsidedness, we looked to the full SDSS DR4 dataset to retrieve a sample of galaxies that have been observed 3 or more times. We narrowed this sample down to a smaller sample where inclination, seeing resolution, and met the same cuts as our main sample (, , and ). We also required that the fractional RMS variations between different observations in seeing resolution and were at most 10%. This latter requirement ensures that the repeated observations had similar observing conditions. The resulting sample contained 328 galaxies with repeated observations. We calculated the RMS differences in in the repeated observations of these galaxies and adopted this measure as the error in lopsidedness for these galaxies.
Fig. 7 shows the distribution of vs. for the repeatedly observed galaxies. About a quarter of the galaxies show small errors in lopsidedness, , and median errors are typically . The largest errors are but affect only 5% of the sample. The third quartile rises as but can be as high as 0.02 at lopsidedness as low as 0.05. Typical errors can be expected to be the larger of 0.02 and . The majority of the sample has , and so 0.02 can be taken as the typical error for most of the sample, with larger errors for the most lopsided galaxies. This result is consistent with our estimate above based on comparing the -band and -band values for a much larger sample.
3.5 A Sample Suitable for Calculating Lopsidedness
We have discussed the systematic errors that skew our calculation of lopsidedness. Here we summarize the proposed cuts to weed out cases where the systematic effects give unphysical values of . After applying these cuts, we are left with a significant sample that is suitable for studying correlations between lopsidedness and other global properties of galaxies.
-
•
Inclined galaxies. We eliminate all galaxies with in any of the three bands to remove inaccurate values computed using a circular aperture on an elliptically projected galaxy. This cut also removes cases of obscuration from optically thick dust lanes on edge-on galaxies.
-
•
Poorly resolved galaxies. We eliminate all galaxies with seeing resolution in any of the three bands in order to remove galaxies whose lopsidedness is diminished due to poor seeing.
-
•
Dim galaxies. We eliminate all galaxies with in the -to- annulus (the region where is calculated) in any of the three bands to remove cases where lopsidedness is augmented by Poisson noise and poor centering.
Table 2 shows the census of galaxies retained after each cut is applied separately. The resolution cut alone removes the largest portion of the sample, and the noise cut removes the least amount. After all three cuts are applied to the initial sample of 67107 galaxies, 25155 (37%) are retained. Unless otherwise specified, we have employed these cuts in our sample for all analysis presented below. These cuts depend on parameters linked to the observation of the galaxies but may also depend on physical properties. We next look at the structural properties of the sample and compare them to the larger DR4 sample from which it was drawn.
| Percentage | Galaxies | |
|---|---|---|
| Cut | Retained | Retained |
| Initial Sample | 100% | 67107 |
| 78% | 52194 | |
| 63% | 42558 | |
| 95% | 63434 | |
| Final Sample after all 3 cuts | 37% | 25155 |
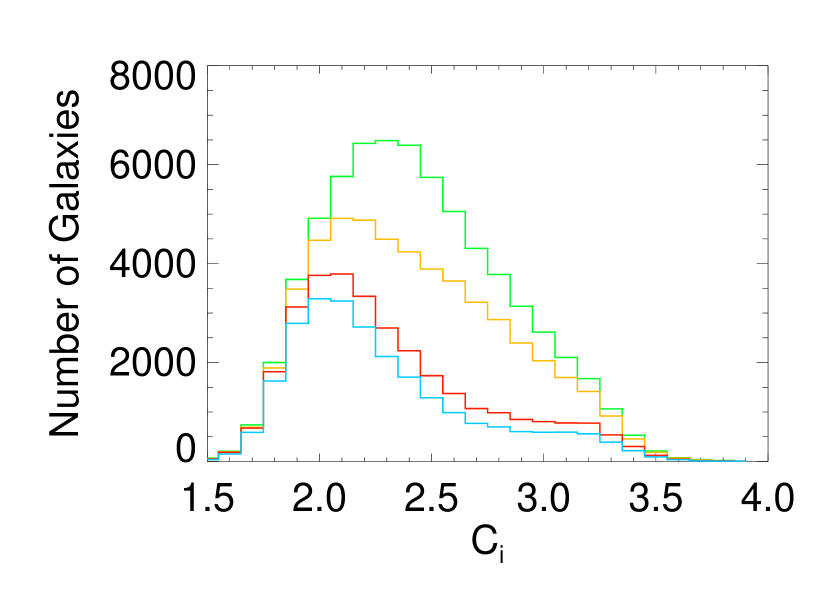
The main structural parameters we will utilize in the analysis below are the stellar mass , the effective stellar surface mass density (the mean stellar density interior to the z-band half light radius), and the concentration (defined as the ratio of in the i-band). See Kauffmann et al. (2003a) for a detailed description.
In Fig. 8, we show the distributions of these structural parameters , , and after we apply each cut in succession to the sample. The upper curve in each panel shows the distribution from the initial DR4 sample. Then the inclination cut is applied (2nd distribution from the top), followed by the resolution cut (3rd distribution from the top) and the cut (lower distribution). The inclination cut reduces the galaxy counts without any strong correlation with structural properties. The resolution cut rejects more massive, high-mass-density, and concentrated galaxies, leaving the sample with a preference of late-type galaxies. Finally, the cut causes little change in the relative proportions of massive, high-mass-density, or concentrated galaxies.
The final sample contains 25155 galaxies spanning 3 orders of magnitude in stellar mass (), 3 orders of magnitude of stellar mass density (), and a wide range of -band concentration (), with a larger proportion of late-type galaxies than early-type galaxies.
4 Properties of Lopsidedness
4.1 Light vs. Mass Distributions
The Fourier modes describe the two-dimensional light distribution of galaxies. We wish to link these modes, specifically the lopsidedness, with a description of the two-dimensional mass distribution as seen along the same line of sight. If the contrast between the bright and dim halves of a galaxy is significantly different in the -band than in the -band, the lopsidedness measure may be indicating an asymmetry in mass-to-light ratios from asymmetrically distributed star formation and/or dust extinction. On the other hand, similar values in the two bands would suggest similar mass-to-light ratios and a corresponding lopsidedness in surface mass density. To see which scenario is prevalent, we can look at the colors and magnitude differences between galaxies of different star formation histories and hence mass/light ratios. Then we can compare those differences to those of the bright and dim halves of the lopsided galaxies.
We start with a set of pairs of stellar population models. We have taken 32000 simulations of stellar populations with identical mass and varying star formation histories from Kauffmann et al. (2003a) and randomly paired them to look at their relative colors. The models were generated from a wide range of superimposed continuous and bursty star formation histories with varying metallicity, such that bursty and continuously star-forming models each contribute about half of the models. We plot in the upper left panel of Fig. 9 the distributions of the difference in color and in magnitude within the pairs. We find a tight relation between the difference in brightness and color within the pair ( in the median).
We next perform the same comparison using 113000 pairs of low-redshift () observed galaxies. The pairs were selected from the SDSS DR4 galaxy sample and have been matched in redshift with and stellar mass with . The relation between relative color and magnitude is shown in the upper right panel of Fig. 9. The brighter galaxy in the pair is the bluer galaxy, in agreement with the models. However the relation is somewhat shallower ( in the median). The difference in these relations may be due to a wider range of SFHs, especially the more extreme, bursty SFHs, in the models than in the observed galaxies. It may also reflect differences in the effects of dust extinction and reddening in the models vs. the data.
We now compare these paired color-magnitude relations of the galaxies and the models to that determined from the bright and dim sides of the galaxies in our lopsided galaxy sample. Having determined the position angle that maximized the light asymmetry, we then measured the , , and magnitudes for each galaxy half. Stars and intervening galaxies were masked out and excluded, as before, but for each masked pixel here, the corresponding pixel at the same radius and away is also excluded. Light is thus summed over the same area in each half.
We show in the lower panel of Fig. 9 the difference in color between the contrasting halves of galaxies in the DR4 sample as a function of their difference in magnitude. The median color difference is zero and has little dependence on relative brightness. This is completely different from the behavior of the models or real galaxies as the mass/light ratio is varied, and suggests that the lopsidedness is not due to variations in mass/light ratio. In fact, Kauffmann et al. (2007) have used SDSS galaxy spectra to show that the fiber color is an excellent proxy for the stellar mass/light ratio. The fact that there is no systematic difference in color between the brighter and dimmer sides of the lopsided galaxies then implies that the lopsided light distribution is primarily tracing a lopsided stellar mass distribution.
While there is no systematic offset in color with magnitude, we note that the spread in increases as increases. This implies that there are large-scale spatial variations in the mass/light ratio in lopsided galaxies (presumably due to enhanced star formation and/or dust extinction).


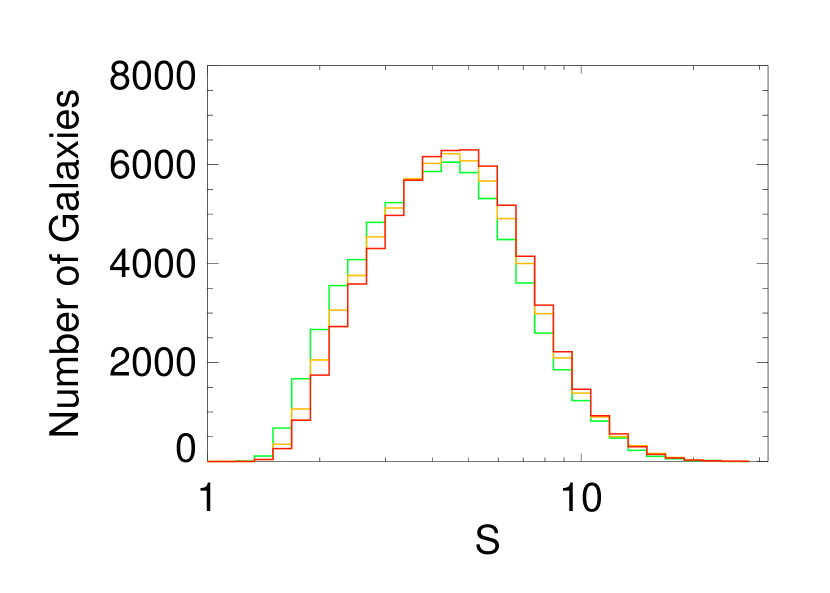
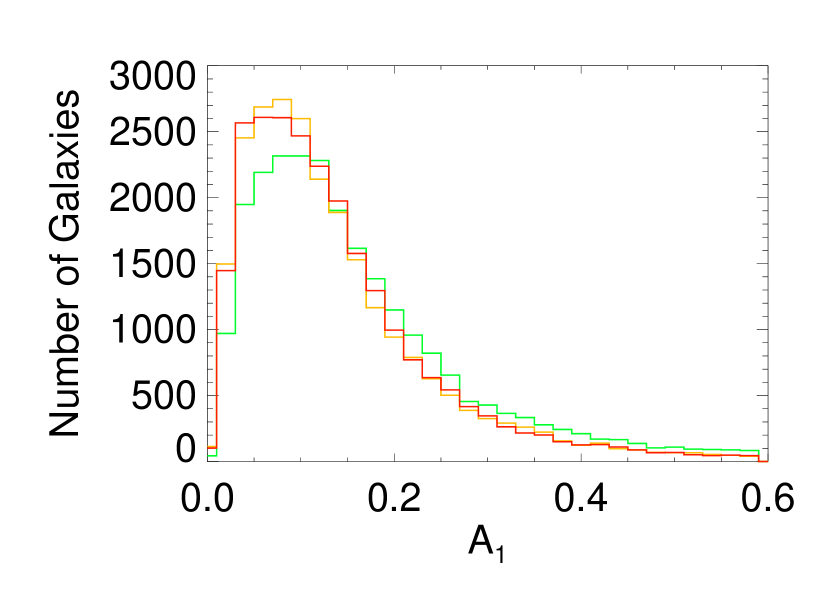
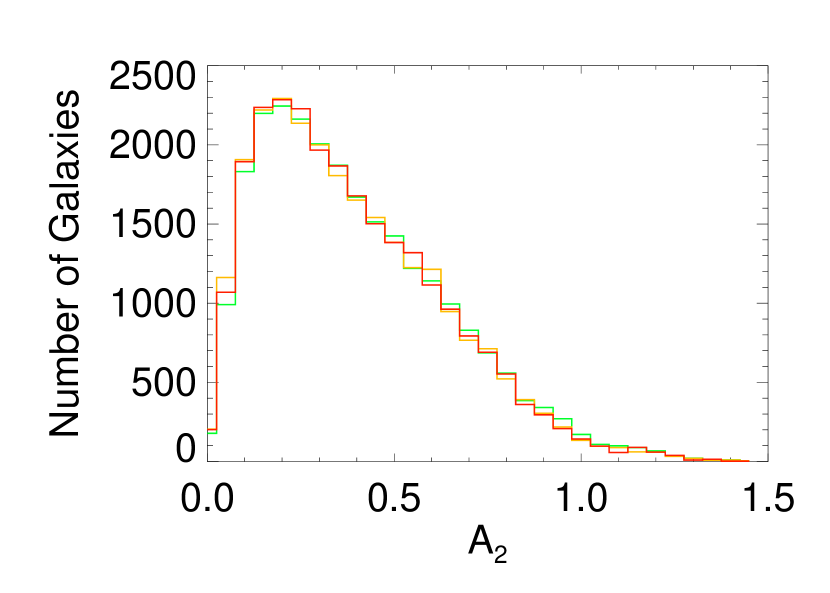
As another way of addressing the importance of variations in the the mass/light ratio in causing lopsidedness, we have compared the distribution of in three different bands in Fig. 10. The distribution measured from -, -, and -band images are shown in green, orange, and red, respectively.
The distributions of and are nearly identical, but the distribution is skewed toward slightly higher values. We have already shown that the lopsidedness of the light distribution primarily traces the lopsidedness of the underlying mass distribution. Here we see the weaker, secondary effect. Newly formed stars are not uniformly distributed, and so the lopsidedness of the light distribution includes a small contribution from the lopsidedness of the distribution of star formation.
4.2 Radial Dependence of Lopsidedness
Previous studies have shown that asymmetry in galaxies shows a clear radial dependence. Rudnick & Rix (1998) used a sample of 54 face-on, early-type disk galaxies and found that an increase in lopsidedness with radius was normal. Conselice et al. (2000) studied radial profiles of both elliptical and disk galaxies in a sample of 113 from the Frei et al. (1996) sample. They found that asymmetry typically increases at larger radii in disk galaxies but peaks at smaller radii in elliptical and lenticular galaxies. One would expect our larger sample of galaxies to confirm the dependence of lopsidedness on both radius and Hubble type. In what follows, we use concentration as a measure of Hubble type.


In Fig 11, we show radial profiles as the distribution of the first Fourier mode (lowercase) at radii extending outward to . The first three panels show profiles for late-type galaxies () partitioned into bins of global lopsidedness (capitalized ), and the last panel shows early-type () galaxy profile. corresponds to roughly to for these late-type galaxies. In all these profiles, lopsidedness increases steadily at radii larger than . Moderately and highly lopsided () late-type galaxies also show a gradual increase in lopsidedness with radius at smaller radii. The early-type and more symmetric late-type galaxies show a minor decline in lopsidedness at small radii and an increase at larger radii. The decline at small radii may be an effect originating from minor centering errors near the galactic center, causing a small overestimation of at the smallest radii. This effect diminishes with radius. At large radii, the increase in is tied to a real increase in light asymmetry, though there could also be some unphysical enhancement due to the low .
5 Structural Properties of Lopsided Galaxies
In §3.5, we showed that our working sample was drawn from a full sample of galaxies and was selected based on cuts on several observational parameters. The proportion of high-mass-density and highly concentrated galaxies was reduced, but a significant number of these galaxies was also retained. Our sample thus allows us to study lopsidedness of galaxies over a wide range of the basic structural properties of the galaxies, namely their concentration, stellar mass, and stellar mass density.
The concentration is a rough proxy for Hubble type, with higher values corresponding to earlier types. The correspondence between and Hubble Type has been considered by Strateva et al. (2001) and Shimasaku et al. (2001). The correspondence is not tight, but the value = 2.6 is the rough dividing line between early- and late-type galaxies (see also Kauffmann et al. 2003a. The top-left panel of Fig. 12 shows the distribution of the global as a function of concentration. At , has a moderate value near 0.10. For (typical of elliptical galaxies), the lopsidedness is typically too small to reliably measure. Below the lopsidedness rises systematically with decreasing concentration (later Hubble types). Lopsidedness is thus commonplace in the late-type field galaxies and the galaxies in low-density environments that dominate our sample, in agreement with previous studies (Matthews et al. 1998; Conselice et al. 2000; Bournaud et al. 2005). However, this result might not extend to other environments (Angiras et al. 2006, 2007).
The top-right panel of Fig. 12 shows the distribution of lopsidedness as a function of stellar mass. Kauffmann et al. (2003b) showed that the local galaxy population is bimodal, with the transition from late type star forming galaxies to early type old galaxies occurring at a value of . We see that lopsidedness is only significant for the low mass population, and increases systematically with decreasing mass.
Finally, we show that there is a similar but even stronger trend between lopsidedness and stellar mass density, as shown in the lower panel of Fig. 12. Kauffmann et al. (2003b) showed that the transition between late type star forming galaxies and early type old galaxies occurs at a value . We find that lopsidedness is only commonplace among the low density population. The lopsidedness increases very strongly with decreasing density in this regime. Indeed at the lowest densities () typical galaxies are significantly lopsided (), and few galaxies in this density range are less lopsided than 0.10.


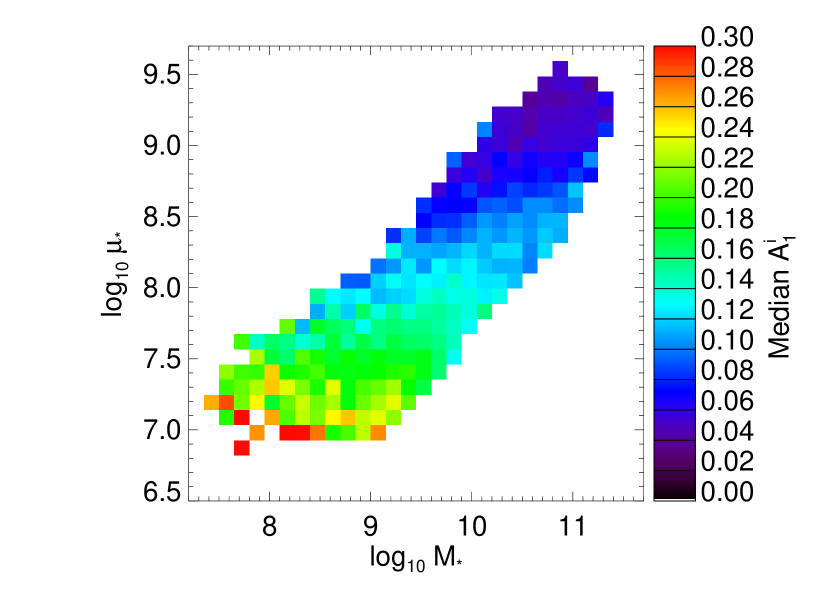
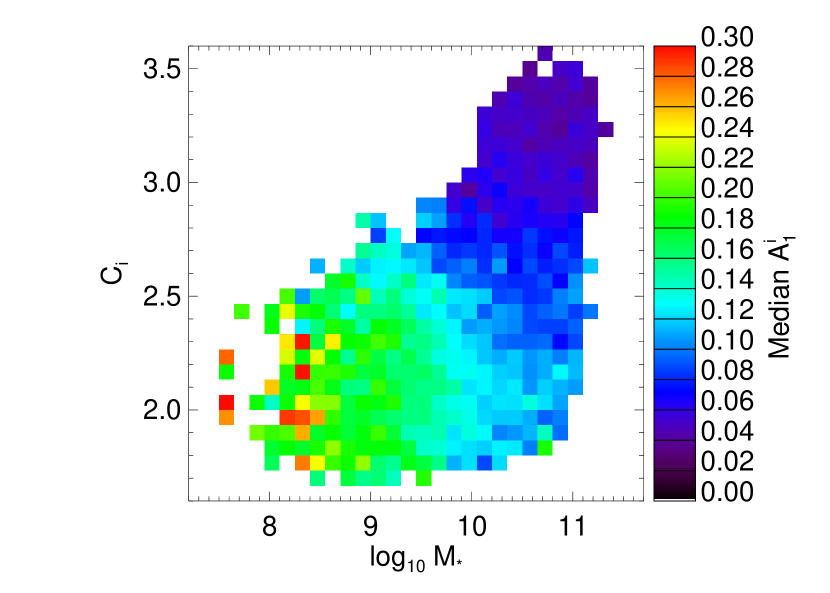
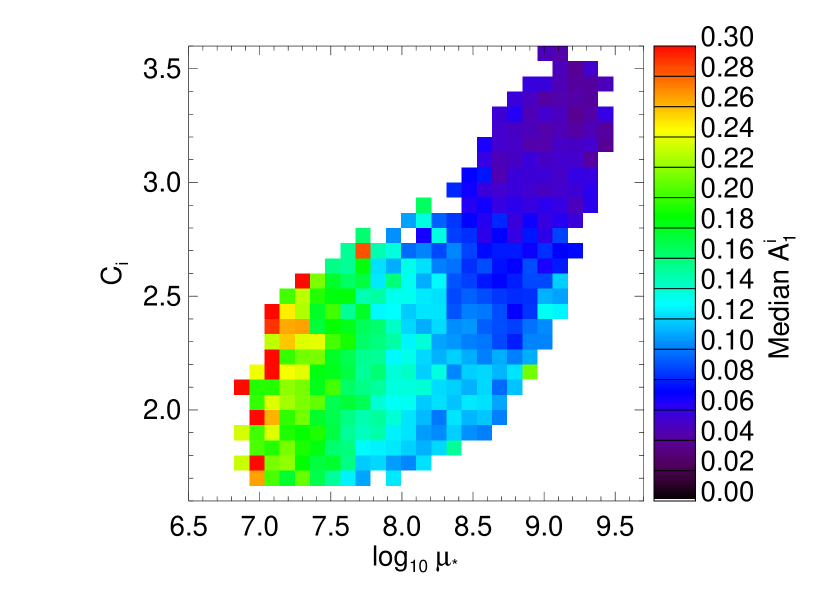
The above structural parameters of SDSS galaxies () are highly correlated with one another (e.g., Kauffmann et al. 2003a). From the above plots, it is not immediately clear whether there is a separate underlying physical correlation between lopsidedness and each of the structural parameters, or whether some of the apparent correlations are induced by mutual correlations between the parameters. To explore this, we now turn to Fig. 13 and compare the three structural properties, two at a time, with lopsidedness. First, we have plotted and against in two-dimensional bins and color-coded each bin holding at least 5 galaxies by its median . We see immediately that while lopsidedness does indeed simultaneously correlate with all these structural parameters, the correlation with is the strongest and most fundamental. In the plots of vs. and we see that the lopsidedness at a given value of is essentially independent of either or . Conversely, for given values of or , there is a systematic increase in lopsidedness with decreasing . The plot of vs. implies that both parameters are correlated with lopsidedness (neither is clearly the more fundamental).
We have used linear partial correlation analysis to see which pairs of these four structural properties show more fundamental correlations. We calculated the linear (Pearson) correlation coefficients for each of the six combinations of the four parameters. We use , , , and for this analysis because the relationships are more linear if logarithms are used for three of the parameters. For each pair, we also removed the dependence of the remaining two parameters and calculated the partial correlation coefficient. The coefficients are listed in Table 3. Lopsidedness correlates moderately with all three of the other parameters but most strongly with stellar mass density (corr. coeff. ), then concentration () and mass (). Once the correlations with stellar mass and concentration are removed, the correlation between lopsidedness and mass density is reduced in magnitude to . The partial correlations between lopsidedness and the other two structural parameters are weaker ( with and with log ). In agreement with Fig. 13, we see that the most fundamentral correlation between lopsidedness and a structural parameter is with the surface mass density.
| Dependence | (Partial) | ||
|---|---|---|---|
| Par. 1 | Par. 2 | Removed | Corr. Coeff. |
| 0.56 | |||
| & | 0.20 | ||
| 0.46 | |||
| & | 0.00 | ||
| & | |||
| & | |||
| & | |||
| & |
6 Conclusions & Discussion
We have measured large-scale galactic asymmetry for a large sample of low-redshift ( 0.06) galaxies drawn from the Sloan Digital Sky Survey. Our use of lopsidedness, a radially averaged azimuthal Fourier mode, has proven useful for a large fraction of the sample. Images of a minority of galaxies in the sample have poor observational properties that cause significant systematic errors in the lopsidedness calculation, and these galaxies were removed from the sample via cuts on angular size, signal-to-noise, and ellipticity/inclination. Those cuts removed a higher fraction of the high-mass, high-mass-density, and high-concentration galaxies than those with low values of these structural properties. Nonetheless, the resulting sample is well represented by the galaxies of the same range of structural properties as the original sample.
We find that there are no systematic differences between the colors of the brighter and fainter sides of lopsided galaxies. This implies that there is no systematic difference in the mass/light ratio (Kauffmann et al. 2007), and hence that the lopsided light distributions are primarily caused by lopsided distributions in the stellar mass. We have verified this through analysis of the relationship between color and mass/light ratio for both model galaxy spectral energy distributions and SDSS galaxy data. However, for our sample the lopsidedness in the -band tends to be slightly greater than in the - and -bands. Thus, some of the lopsidedness in the light does arise from the effects of star-formation and/or dust extinction (which will more strongly affect the band light).
Lopsidedness is a structural property that depends strongly on other structural properties. Galaxies with progressively lower concentration, stellar mass, or stellar mass density tend to have progressively higher lopsidedness. We show that the strongest and most fundamental correlation is between lopsidedness and stellar mass density. We also find that lopsidedness increases systematically with increasing radius, particularly for late-type galaxies.
Lopsidedness can be induced through tidal stress associated with interactions with a companion galaxy or through accretion or minor mergers (e.g. Zaritsky & Rix 1997; Bournaud et al. 2005). Galaxies with low density will be most affected by tidal stress, and the effects of a tidal perturbation will last longer in such systems due to the longer dynamical times. The same arguments pertain to the outer parts of galaxies. Thus, the two above results make good physical sense. Alternatively, if the dark matter halo is lopsided, its effects on the structure of the stellar disk will be more pronounced in the outer region and in galaxies with low mass and low density (where dark matter is more dynamically important). The relatively large values of lopsidedness we measure to be commonplace () appear to be too large to be generated by internally generated dynamical processes (e.g., Masset & Tagger 1997).
Our overall goal in this investigation has been to use lopsidedness as a way of quantifying the signature of moderate or weak global dynamical perturbations. The next step will be to determine the connections between such perturbations and both the on-going/recent star formation and the growth of supermassive black holes in galaxies. These connections can help constrain the processes and conditions that guide the formation and evolution of the galaxies. In future papers we will address these questions using the present sample of galaxies.
JB acknowledges the receipt of a FCT post-doctoral grant BPD/14398/2003. We would like to thank Vivienne Wild for reading a draft of the manuscript.
Funding for the SDSS and SDSS-II has been provided by the Alfred P. Sloan Foundation, the Participating Institutions, the National Science Foundation, the U.S. Department of Energy, the National Aeronautics and Space Administration, the Japanese Monbukagakusho, the Max Planck Society, and the Higher Education Funding Council for England. The SDSS Web Site is http://www.sdss.org/.
The SDSS is managed by the Astrophysical Research Consortium for the Participating Institutions. The Participating Institutions are the American Museum of Natural History, Astrophysical Institute Potsdam, University of Basel, University of Cambridge, Case Western Reserve University, University of Chicago, Drexel University, Fermilab, the Institute for Advanced Study, the Japan Participation Group, Johns Hopkins University, the Joint Institute for Nuclear Astrophysics, the Kavli Institute for Particle Astrophysics and Cosmology, the Korean Scientist Group, the Chinese Academy of Sciences (LAMOST), Los Alamos National Laboratory, the Max-Planck-Institute for Astronomy (MPIA), the Max-Planck-Institute for Astrophysics (MPA), New Mexico State University, Ohio State University, University of Pittsburgh, University of Portsmouth, Princeton University, the United States Naval Observatory, and the University of Washington.
References
- Abraham et al. (1996) Abraham, R. G., van den Bergh, S., Glazebrook, K., Ellis, R. S., Santiago, B. X., Suva, P., & Griffiths, R. E. 1996, ApJS, 107, 1
- Adelman-McCarthy et al. (2006) Adelman-McCarthy, J. K., et al. 2006, ApJS, 162, 38
- Angiras et al. (2006) Angiras, R. A., Jog, C. J., Omar, A., & Dwarakanath, K. S. 2006, MNRAS, 369, 1849
- Angiras et al. (2007) Angiras, R. A., Jog, C. J., Dwarakanath, K. S., & Verheijen, M. A. W. 2007, MNRAS, 378, 276
- Arp (1966) Arp, H. 1966, ApJS, 14, 1
- Baldwin et al. (1980) Baldwin, J. E., Lynden-Bell, D., & Sancisi, R. 1980, MNRAS, 193, 313
- Bournaud et al. (2005) Bournaud, F., Combes, F., Jog, C. J., & Puerari, I. 2005, A&A, 438, 507
- Bournaud & Duc (2006) Bournaud, F., & Duc, P.-A. 2006, A&A, 456, 481
- Brinchmann et al. (2004) Brinchmann, J., Charlot, S., White, S. D. M., Tremonti, C., Kauffmann, G., Heckman, T., & Brinkmann, J. 2004, MNRAS, 351, 1151
- Bruzual A. (1983) Bruzual A., G. 1983, ApJ, 273, 105
- Charlot & Longhetti (2001) Charlot, S., & Longhetti, M. 2001, MNRAS, 323, 887
- Charlot et al. (2002) Charlot, S., Kauffmann, G., Longhetti, M., Tresse, L., White, S. D. M., Maddox, S. J., & Fall, S. M. 2002, MNRAS, 330, 876
- Conselice et al. (2000) Conselice, C. J., Bershady, M. A., & Jangren, A. 2000, ApJ, 529, 886
- Conselice (2003) Conselice, C. J. 2003, ApJS, 147, 1
- De Propris et al. (2007) De Propris, R., Conselice, C. J., Driver, S. P., Liske, J., Patton, D., Graham, A., & Allen, P. 2007, ArXiv e-prints, 705, arXiv:0705.2528
- Frei et al. (1996) Frei, Z., Guhathakurta, P., Gunn, J. E., & Tyson, J. A. 1996, AJ, 111, 174
- Fukugita et al. (1996) Fukugita, M., Ichikawa, T., Gunn, J. E., Doi, M., Shimasaku, K., & Schneider, D. P. 1996, AJ, 111, 1748
- Gunn et al. (1998) Gunn, J. E., et al. 1998,
- Gunn et al. (2006) Gunn, J. E., et al. 2006, AJ, 131, 2332 AJ, 116, 3040
- Hogg et al. (2001) Hogg, D. W., Finkbeiner, D. P., Schlegel, D. J., & Gunn, J. E. 2001, AJ, 122, 2129
- Ivezić et al. (2004) Ivezić, Ž., et al. 2004, Astronomische Nachrichten, 325, 583
- Jog (1997) Jog, C. J. 1997, ApJ, 488, 642
- Jog (1999) Jog, C. J. 1999, ApJ, 522, 661
- Kauffmann & Haehnelt (2000) Kauffmann, G., & Haehnelt, M. 2000, MNRAS, 311, 576
- Kauffmann et al. (2003a) Kauffmann, G., et al. 2003a, MNRAS, 341, 33
- Kauffmann et al. (2003b) Kauffmann, G., et al. 2003b, MNRAS, 341, 54
- Kauffmann et al. (2003c) Kauffmann, G., et al. 2003c, MNRAS, 346, 1055
- Kauffmann et al. (2004) Kauffmann, G., White, S. D. M., Heckman, T. M., Ménard, B., Brinchmann, J., Charlot, S., Tremonti, C., & Brinkmann, J. 2004, MNRAS, 353, 713
- Kauffmann et al. (2007) Kauffmann, G., et al. 2007, ArXiv Astrophysics e-prints, arXiv:astro-ph/0609436
- Kereš et al. (2005) Kereš, D., Katz, N., Weinberg, D. H., & Davé, R. 2005, MNRAS, 363, 2
- Kornreich et al. (2002) Kornreich, D. A., Lovelace, R. V. E., & Haynes, M. P. 2002, ApJ, 580, 705
- Levine & Sparke (1998) Levine, S. E., & Sparke, L. S. 1998, ApJ, 496, L13
- Lupton et al. (2001) Lupton, R., Gunn, J. E., Ivezić, Z., Knapp, G. R., Kent, S., & Yasuda, N. 2001, ASP Conf. Ser. 238: Astronomical Data Analysis Software and Systems X, 238, 269
- Masset & Tagger (1997) Masset, F., & Tagger, M. 1997, A&A, 318, 747
- Matthews et al. (1998) Matthews, L. D., van Driel, W., & Gallagher, J. S., III 1998, AJ, 116, 1169
- Mihos & Hernquist (1996) Mihos, J. C., & Hernquist, L. 1996, ApJ, 464, 641
- Press (2002) Press, W. H. 2002, Numerical recipes in C++ : the art of scientific computing by William H. Press. xxviii, 1,002 p. : ill. ; 26 cm. Includes bibliographical references and index. ISBN : 0521750334,
- Noordermeer et al. (2001) Noordermeer, E., Sparke, L. S., & Levine, S. E. 2001, MNRAS, 328, 1064
- Richter & Sancisi (1994) Richter, O.-G., & Sancisi, R. 1994, A&A, 290, L9
- Rix & Zaritsky (1995) Rix, H., & Zaritsky, D. 1995, ApJ, 447, 82
- Rudnick & Rix (1998) Rudnick, G., & Rix, H. 1998, AJ, 116, 1163
- Rudnick et al. (2000) Rudnick, G., Rix, H., & Kennicutt, R. C. 2000, ApJ, 538, 569
- Sanders & Mirabel (1996) Sanders, D. B., & Mirabel, I. F. 1996, ARA&A, 34, 749
- Springel et al. (2005) Springel, V., Di Matteo, T., & Hernquist, L. 2005, ApJ, 620, L79
- Shimasaku et al. (2001) Shimasaku, K., et al. 2001, AJ, 122, 1238
- Shu et al. (1990) Shu, F. H., Tremaine, S., Adams, F. C., & Ruden, S. P. 1990, ApJ, 358, 495
- Smith et al. (2002) Smith, J. A., et al. 2002, AJ, 123, 2121
- Springel & Hernquist (2005) Springel, V., & Hernquist, L. 2005, ApJ, 622, L9
- Stoughton et al. (2002) Stoughton, C., et al. 2002, AJ, 123, 485
- Strateva et al. (2001) Strateva, I., et al. 2001, AJ, 122, 1861
- Strauss et al. (2002) Strauss, M. A., et al. 2002, AJ, 124, 1810
- Swaters et al. (1999) Swaters, R. A., Schoenmakers, R. H. M., Sancisi, R., & van Albada, T. S. 1999, MNRAS, 304, 330
- Syer & Tremaine (1996) Syer, D., & Tremaine, S. 1996, MNRAS, 281, 925
- Toomre & Toomre (1972) Toomre, A., & Toomre, J. 1972, ApJ, 178, 623
- Tucker et al. (2006) Tucker, D. L., et al. 2006, Astronomische Nachrichten, 327, 821
- Walker et al. (1996) Walker, I. R., Mihos, J. C., & Hernquist, L. 1996, ApJ, 460, 121
- Weinberg (1994) Weinberg, M. D. 1994, ApJ, 421, 481
- Wilcots & Prescott (2004) Wilcots, E. M., & Prescott, M. K. M. 2004, AJ, 127, 1900
- Worthey & Ottaviani (1997) Worthey, G., & Ottaviani, D. L. 1997, ApJS, 111, 377
- York et al. (2000) York, D. G., et al. 2000, AJ, 120, 1579
- Zaritsky & Rix (1997) Zaritsky, D., & Rix, H. 1997, ApJ, 477, 118