Statistical analysis of neutrino events from SN1987A neutrino burst: estimation of the electron antineutrino mass
Abstract
The method of the statistical sample moments was
used for the analysis of neutrino events from SN1987A burst in
Cherenkov detectors. In particular the coefficients of correlation
between the energies of electron antineutrinos
emitted by star and the ejection instants of for neutrino
events recorded by Cherenkov water detectors of KII and IMB collaborations
were calculated. values depend on the assumed mass of .
Modern model of the gravitational stellar core collapse with an accretion
phase predicts the low level of such correlation
averaged with respect to neutrino burst. On condition that empirical
values equal the theoretical model quantities one can
obtain as an estimate of the nonzero
mass. The error of this estimate implies that mass less than
is unlikely. The laboratory data of the tritium -decay
agree adequately with the presented astrophysical estimate provided that
the anomalous structure near the end point of -spectrum is taken
into account.
PACS: 14.60.Pq, 97.60.Bw
1 Introduction
The observation of SN1987A supernova neutrino burst gave valuable information related to the star collapse astrophysics and neutrino physics. Mainly this information was obtained by Cherenkov water detectors of Kamiokande II (KII) [1] and Irvine-Michigan-Brookhaven (IMB) [2] collaborations. Two decades before the burst, Zatsepin suggested the possibility of estimation of the neutrino mass taking into account that massive neutrino with rest energy and total energy passes distance from the source to detector in a time [3]
| (1) |
Here is the velocity of light. Large number of works was dedicated to the estimation of beginning from 1987, in which as a rule, the parameters of individual neutrino events, namely and the time of neutrino registration were compared. Such analysis has large uncertainty due to the finite duration of neutrino burst. An opinion was formed that the results of observations agree with zero neutrino mass or allow one to estimate only its upper limit.
2 Statistical analysis
In this paper the results of estimation the electron antineutrino mass by comparison of the lower empirical sample central moments of two dimensional density function of the source and of similar moments of this function predicted by a modern theoretical model [4] are presented 111 Below and stand for respectively two dimensional density function and the coefficient of correlation of variables and . Furthermore, and are the variance and the standard deviation of quantity respectively.. Empirical moments of depend on the assumed value of because , where is the instant of the emission from the source. As usual, the energy of neutrino during its motion from the source to detector is assumed to be constant.
Density function at distance from the source is
| (2) |
Here zero time corresponds to the beginning of emission of . If one considers a specific detector, it is convenient to normalize in formula (2) to unity in domain and . Here designates energy threshold of detection in considered detector. All sample empirical moments of were calculated with weight coefficients in order that they can be compared with theoretical ones. For -th event in the sample of events
| (3) |
Such structure of corresponds to the process of inverse -decay,
| (4) |
which, as it is assumed, causes the registration of in Cherenkov detectors. Really, process (4) is 15-20 times more probable than the competing process of the scattering of neutrinos (of all types) on electrons. Besides, precisely (4) allows one to compare the energy of neutrino and the number of events observed in [1, 2] with predictions of the stellar core collapse theoretical models. Formula (3) takes into account the quadratic growth of the capture cross section (4) with energy and registration probability of a positron with energy in a detector (data of KII and IMB collaborations presented in [5] were used in computations).
Usually the relation between and is expressed by formula
| (5) |
In this work a more accurate relation [6], which takes into account a small correction related to the recoil energy of neutron is used. However, in the case when , expression (5) is sufficiently accurate and it is not necessary to use information about the angular distribution of positron tracks in detectors for process (4). If one considers elastic scattering of neutrinos on electrons it is necessary to use such (very inaccurate) information.
The properties of the events from neutrino burst in KII [1] and IMB [2] detectors are summarized in the Tab. 1.
| KII detector [1] | IMB detector [2] | |||||
| Event numberb | Event time (sec) | Positron energy (MeV) | Event number | Event time (sec) | Positron energy (MeV) | |
| 1 | 0 | 20.0 2.9 | 1 | 0 | 38 9.5 | |
| 2 | 0.107 | 13.5 3.2 | 2 | 0.42 | 37 9.3 | |
| 3 | 0.303 | 7.5 2.0 | 3 | 0.65 | 40 10 | |
| 4 | 0.324 | 9.2 2.7 | 4 | 1.15 | 35 8.8 | |
| 5 | 0.507 | 12.8 2.9 | 5 | 1.57 | 29 7.3 | |
| 7 | 1.541 | 35.4 8.0 | 6 | 2.69 | 37 9.3 | |
| 8 | 1.728 | 21.0 4.2 | 7 | 5.01 | 20 5 | |
| 9 | 1.915 | 19.8 3.2 | 8 | 5.59 | 24 6 | |
| 10 | 9.219 | 8.6 2.7 | ||||
| 11 | 10.433 | 13.0 2.6 | ||||
| 12 | 12.439 | 8.9 1.9 | ||||
| aIt is suggested that all events were caused by the capture of . | ||||||
| bEvent no.6 has been excluded by authors from the signal analysis. | ||||||
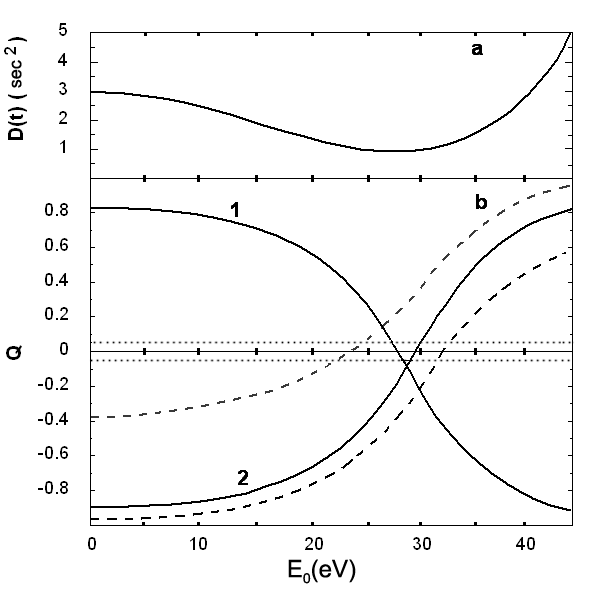
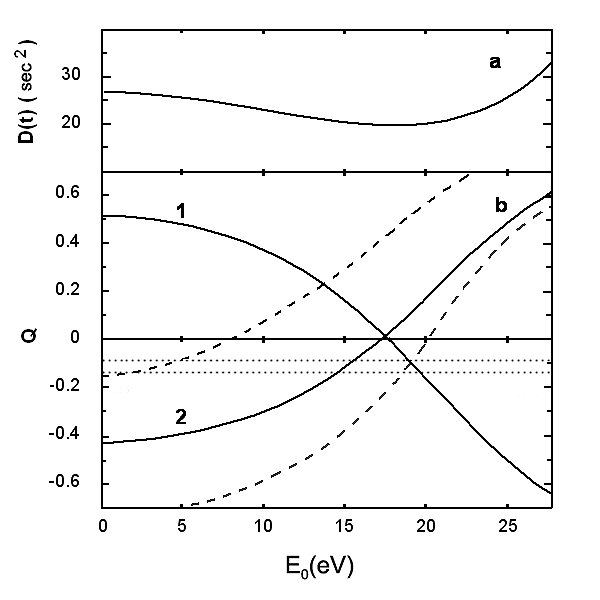
The distance to SN1987A is probably [6]. The value was chosen as well as in [4]. When we carry out the statistical analysis of neutrino events, it is significant that they all should be caused by the capture of (4). According to the estimates of authors of papers [1, 2], the background count rate during 10 s was (KII) and (IMB). One event in IMB was eliminated by authors as a background one. I considered all other 8 events. Amongst those eleven events presented by KII event no. 3 has value , which practically coincide with energy threshold of KII detector. With large probability this event may be considered as a background one [6], and it was not taken into account in our computations. Thus, two statistical samples of events were taken as initial data, one with size (KII) and another with (IMB). Each sample has its own function as population, since values of (as parameters) for considered detectors differ essentially. According to (1), for each of the assumed values of , the values were determined from values recorded for considered detector, which gave the sample of events specifying density function of the source. Sample variance and correlation coefficients and were computed. Fig. 1 and Fig. 2 represent the dependencies of these quantities on .

Let us note that these sample moments are invariant with respect to time shift. It is essential for our problem and makes possible comparison of the results obtained from detectors which are not synchronized in time. Let us emphasize also that considered functions do not depend on astrophysical model (except the assumption that process of capture (4) is real). It is evident from figures that curves have minima.
Is it possible to associate the location of the minimum on scale with sought value of the mass? Let us consider the relation between on the one hand and and on the other hand. It can be demonstrated from (2) that
| (6) |
where and are the standard deviations of quantities and . The first term in (6) is the variance of the observed values of (it coincides with when ), the second term is proportional to the variance of values, and is the coefficient of correlation of and variables in the third term. If one uses sample values of statistical moments in (6), relation (6) produces just the same values of as a direct method presented above. Expression (6) allows to understand the behaviour of curve in dependence on . When values of are small, two last terms are negative . When increases, the last term becomes positive, since inequality becomes correct. Computations demonstrate that the minimum in considered curve precisely corresponds to such value of where changes its sign. In this region both functions and have large derivative. The aforesaid is illustrated by Fig. 1 and Fig. 2. It is also evident from figures that standard correlation coefficient changes its sign at approximately the same value of as . Just function is considered below. It is evident from Fig. 1 and Fig. 2 that functions corresponding to direct observations either are close to unity with respect to modulus (IMB) or have the same order of magnitude (KII), i.e. there evident correlation ”” exist. Function specifies ”E-time” correlation near detector. Only modern astrophysical models of stellar core collapse can present information concerning near the source.

The results of [4] were used in order to compute coefficient of correlation averaged with respect to neutrino burst. In [4] the equations of hydrodynamics (in the framework of the general theory of relativity) and equations of multigroup (with respect to energy) transport of neutrinos which takes into account all types of neutrinos and antineutrinos were solved jointly numerically. In particular in [4] luminosity for and mean instantaneous (at ) energy of are represented as functions of time which are necessary for computation of . At the stage of the core cooling exponential decrease of the neutrinosphere temperature was assumed with time constant in accordance with graphical data [4]. Momentary energy spectra of were approximated by Fermi-Dirac (F-D) distributions. Such spectra which were computed in [4] differ from F-D spectra. They demonstrate steeper decrease at high energies of . The model energy spectra of with the same peculiarity at high energies [7] were used in one version of our computations. In this case resulting values of differ less than to 10%. Possibly it is caused by the fact that mean momentary energies of were fixed in computations according to data of [4]. The following approach was used in order to compute the model theoretical value of in the same manner as in the case of the sample empirical values of . Values of and were computed by Monte Carlo method in order to obtain samples of size (as a rule, these sizes coincided with empirical ones). Further value of was computed for each -th sample, and averaging with respect to was carried out. Obtained strips of values of limited by point straight lines as a result of the variation of energy spectra of and sizes are presented in Fig. 1 and Fig. 2. It is evident from figures that modulus of is much less that unity, i.e. the level of ”” correlations in neutrino burst is small on the average. This is caused by a large role of accretion phase in the process of gravitational collapse of stellar core. For cores with masses more than half of are emitted at the stage of accretion specified by positive sign of [4, 5]. Phase of cooling corresponds to negative values of . Thus both phases to some extent compensate each other in computation of . High energy threshold of neutrino detection increases the role of accretion phase since with higher energies are emitted at this phase. Values (IMB) and (KII) were used in computations. Thus one can understand a positive gap between the values of for IMB on the one hand and of KII on the other hand (see Fig. 1 and Fig. 2). Large (with respect to modulus) and negative (with respect to the sign) differences specifying neutrino events in two detectors, evidence that observed coefficients of correlation are mainly related to the effect of the delay of the neutrinos with less energy according to (1), i.e. suggest nonzero mass of .
Determining the curves intersection regions (as functions of ) with strips we arrive at the estimates of as for IMB and for KII. If we assume that the accuracy of IMB and KII measurements are equal, of electron antineutrino can be estimated as
| (7) |
Here presented error is the root-mean-square deviation for the sample of the size . Assuming that this error has random nature, let us employ Student’s distribution with degrees of freedom for the estimation of the probability of the assumption that is valid. This probability does not exceed . Thus we can discard this hypothesis at 85% significance level.
If we want to answer the question formulated above, one may say that the minimum of (according to scale) corresponds to the region of the possible values of since this minimum is related to the low level of ”” correlations.

Aside from random errors, ”true” value of can be distorted by initial assumption that all neutrino events are caused by process of capture (4). In [6] an assumption was considered that event no. 4 in KII was caused by the scattering of neutrino on electron. If one takes account of such possibility, it complicates the analysis since in particular it requires the construction of function including not only , but all other types of neutrinos and antineutrinos. Nevertheless let us consider for illustration how the values of and vary (depending on ) if we interpret event no.4 (KII) as the scattering of . Considering gravitational collapses of stellar cores one limits the energy of emitted neutrinos by . In this case the recoil electrons with energy exceeding should be scattered through angles . If to assume that for event no.4, we arrive at (instead of in the case of capture). Such value of leads to essential variation of the and values. In particular, , minimum value of the variance and . The numbers in parentheses correspond to the process of the capture. The intersection of axis with curve takes place at the value of which is larger by than the value represented in Fig. 2. For the estimation of in this case we obtain
| (8) |
Considered example demonstrates that taking into account the possibility scattering, allows one to make more similar the results obtained by data from both detectors, however it does not change essentially the estimate of mass.
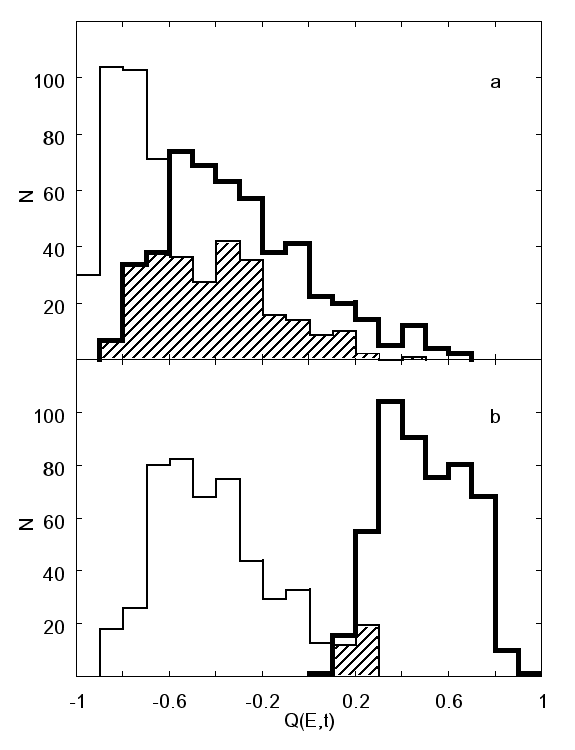
We used errors (standard deviations) [1, 2] in order to take into account the influence of inaccuracies in the determination of positrons energy in Cherenkov detectors. We computed the values for Gaussian distribution with prescribed value of and by Monte Carlo method. The results of computations were the samples with sizes ( () (KII) and (IMB)) for and . The coefficient of correlation for a number of values of was computed in each sample of values of . A number of samples were used for a fixed value of in order to obtain a distribution (histogram) according to the value of . Examples of such distributions are presented in Fig. 3.
Dashed lines in Fig. 1 and Fig. 2 limit FWHM of these distributions (smoothed histograms). It is evident that the distributions have sufficiently large FWHM. The point is: how significant is the difference of the values of for (the carried out analysis cannot distinguish in this interval) and for the value of estimated the mass of by the method presented above? Fig. 3 represents distributions with respect to for and similar distributions for . The regions of overlapping allow one to estimate the probability of coincidence of the distributions for and in the following manner: and . The probability of the fact that despite the data of both detectors (independent measurements), distributions for and do not differ is
Thus the statement that our analysis cannot distinguish and the estimate of in (7) can be rejected at significance level not less than 90%.
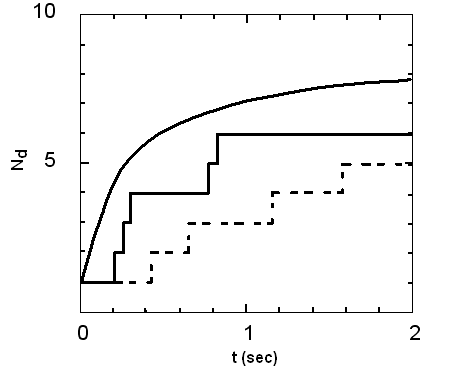
In the analysis presented above we used data [4] related to an iron stellar core with mass . Smooth curve in Fig. 4 represents integral neutrino event rate for IMB detector which was theoretically predicted [4]. Step integral spectrum represented by dotted line corresponds to experimental data. It is evident that these spectra do not agree well. On this basis author of [4] concluded that one should pass to the core of different mass (). Indeed, with the employment of Kolmogorov-Smirnov criterion one can reject theoretical model for at significance level . However, the time delay of slow neutrinos with respect to the fast ones on the path from the source to the detector is not taken into account in [4], i.e. the case was implicitly considered. Solid step lines in the same figure represent integral spectrum for . This spectrum much better agrees with theory and one can demonstrate that in this case theoretical model of the core with mass cannot be rejected with usually used significance levels. Let us note that value determined by fitting from the condition of best agreement with theoretical curve coincide with value obtained by the method presented above.

It is interesting to compare estimates (7) and (8) with experimental results where the mass of was determined from data of tritium -decay. New result of these experiments is the discovery of anomalous structure of -spectra [8, 9] – a very weak line near end point of -spectrum. In [10, 11] an approach was proposed which takes into account the anomalous structure and leads to the value .
3 Conclusions
Modern model of the gravitational stellar core collapse with an accretion phase predicts the low level of correlation between the energies of electron antineutrinos emitted by the star and the ejection instants of on the average.
Similar coefficients of ”” correlation can be calculated for neutrino events recorded by Cherenkov water detectors of KII and IMB collaborations from SN1987A neutrino burst.
These values depend on the assumed mass of . On condition that empirical values must be equal to the theoretical model quantities averaged with respect to neutrino burst it can obtained the value as an estimate of the nonzero mass.
The error of this estimate allows to consider that the mass less than can be realized only with little likelihood.
There are two ways of the mass estimation: one from the astrophysical observations by the method presented above, and the other from laboratory data of the tritium -decay. Both methods agree adequately when taken into account the anomalous structure near end point of the -spectrum.
Acknowledgements
The author is grateful to G. T. Zatsepin, L. I. Sarycheva, B. A. Khrenov and S. I. Svertilov for a fruitful discussion.
References
- [1] K. Hirata et al. Phys. Rev. Lett 58, 1490 (1987)
- [2] R.M. Bionta et al. Phys. Rev. Lett 58, 1494 (1987)
- [3] G.T. Zatsepin. Pis’ma Zh. Exp. Teor. Fiz 8, 333 (1968)
- [4] S.W. Bruenn. Phys. Rev. Lett. 59, 938 (1987)
- [5] D.N. Schramm and J.W. Truran. Physics Reports 189, 89 (1990)
- [6] E.W. Kolb, A.J. Stebbins, M.S. Turner. Phys. Rev. D 35, 3598 (1987)
- [7] D.K. Nadezhin and I.V. Otroshchenko. Astron.Zh. 57, 78 (1980)
- [8] W. Stoeffl, D.J. Decman. Phys. Rev. Lett. 75, 3237 (1995)
- [9] A.I. Belesev et al. Phys. Lett. B 350, 263 (1995)
- [10] B.I. Goryachev. Bulletin of the Lebedev Physics Institute 3, 26 (2003); Kratkie Soobsheniya po Fizike 3, 33 (2003)
- [11] B.I. Goryachev. Preprint of INPH of MSU 41/681 (2001)