IPPP/07/50
DCPT/07/100
LTH 755
27 September 2007
Small gluon from exclusive production
A.D. Martina, C. Nocklesb, M. Ryskina,c and T. Teubnerb
a Department of Physics and Institute for Particle Physics
Phenomenology,
University of Durham, Durham DH1 3LE, U.K.
b Department of Mathematical Sciences,
University of Liverpool, Liverpool L69 3BX, U.K.
c Petersburg Nuclear Physics Institute, Gatchina, St. Petersburg, 188300, Russia
Exclusive production, , offers a unique opportunity to determine the gluon density of the proton in the small domain. We use the available HERA data to determine the gluon distribution in the region and , where the uncertainty on the gluon extracted from the global parton analyses is large. The gluon density is found to be approximately flat at the lower scale; it is compared with those of recent global analyses.
1 Introduction
Global analyses do not reliably determine the gluon for at low, yet perturbative, as shown in Fig. 1. This is due partly to the lack of precise structure function data for and mainly due to the fact that the data included in global analyses actually probe the quark distribution, while the gluon density is constrained by the dependence of the data, that is by the evolution. In the low region the available interval decreases and the accuracy of the gluon determination becomes worse.
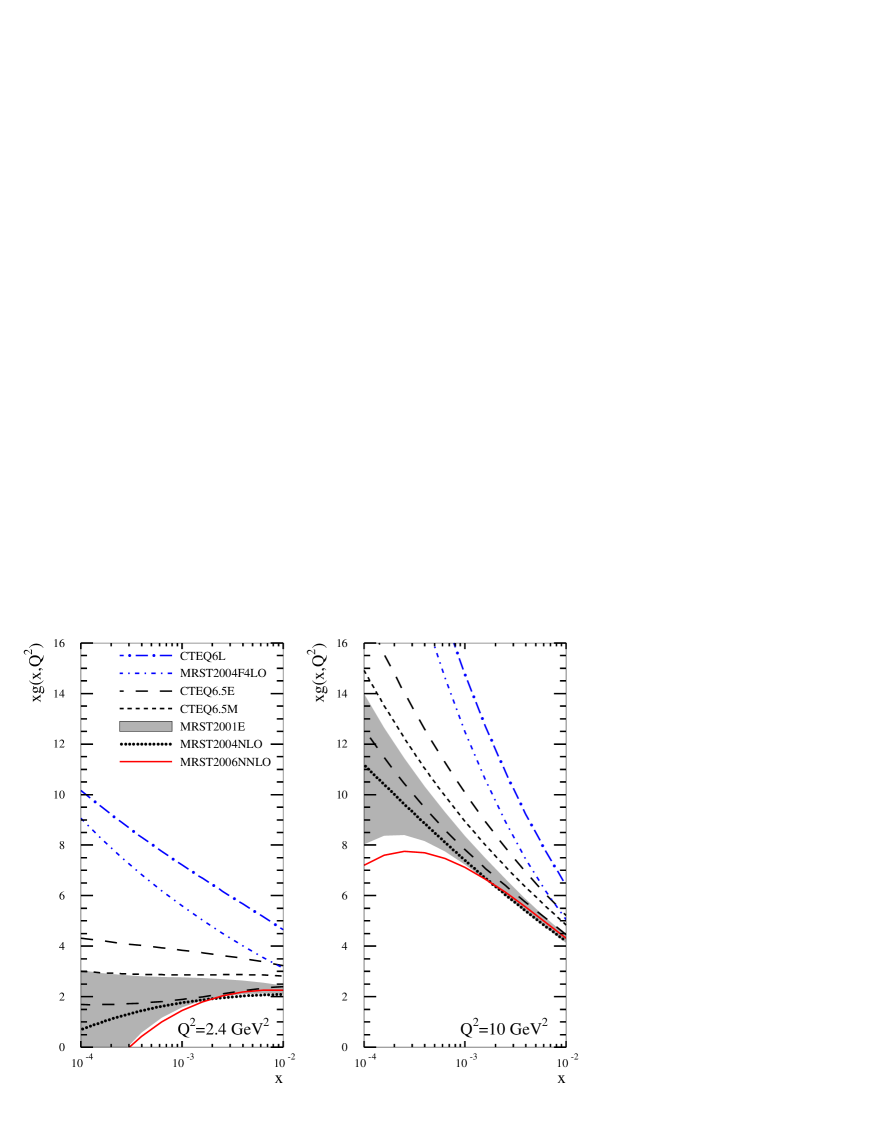
The strong dependence of the global fits for the gluon on the order of the analysis is clearly demonstrated in Fig. 1. Note that the recent gluon from the MRST NNLO analysis [6] receives sizeable corrections both in size and shape compared to the NLO fit, signalling a large uncertainty of the gluon in this regime. In this context it is also interesting to note that the gluon as obtained from global fits can significantly change, both in normalisation and shape, if small resummations are incorporated into the analysis [7].
Data for the exclusive process offer an attractive opportunity to determine the low gluon density in this domain, since here the gluon couples directly to the charm quark and the cross section is proportional to the gluon density squared [8]. Therefore the data are much more sensitive to the behaviour of the gluon. The mass of the vector meson introduces a relatively large scale, amenable to the perturbative QCD (pQCD) description not only of large diffractive electroproduction, but also photoproduction of . The available data probe the gluon at a scale in the range GeV2 for in the range ; that is just the domain where other data do not constrain the gluon reliably, see Fig. 1. It would be good to have comparable data on exclusive production to determine the gluon at larger scales, but here the available data are sparse, see Fig. 5 below.
2 Exclusive production at LO
To lowest order the amplitude can be factored into the product of the transition, the scattering of the system on the proton via (colourless) two-gluon exchange, and finally the formation of the from the outgoing pair. The crucial observation is that at high centre-of-mass energy, , the scattering on the proton occurs over a much shorter timescale than the fluctuation or the formation times, see Fig. 2. Moreover, at leading logarithmic accuracy, this two-gluon exchange amplitude can be shown to be directly proportional to the gluon density with
| (1) |
is the virtuality of the photon and is the rest mass of the . To be explicit, the lowest-order formula is [8]
| (2) |
where is the electronic width of the .
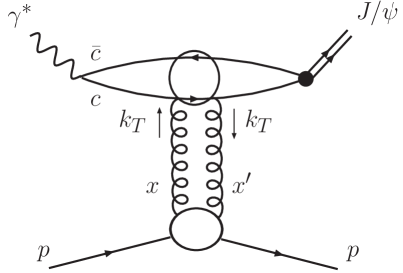
In the leading logarithmic approximation, the integral over the transverse momentum of the -channel gluons, see Fig. 2, gives rise to the integrated gluon density . As usual in collinear factorisation, the dependence of the integral is completely absorbed in the input gluon distribution (of the global analyses), taken at the factorisation scale . The integral over the charm quark loop is expressed in terms of the electronic width, , of , and the term in the final brackets reflects the contribution of the longitudinally polarised incoming . Equation (2) gives the differential cross section at zero momentum transfer, . To describe data integrated over , the integration is carried out assuming with the experimentally measured slope parameter. Throughout this work the value
| (3) |
is used, which is in agreement with [9, 10, 11].111We neglect a slight energy dependence of which is only observed for photoproduction, but which is of the order of differences between measurements of the two experiments H1 and ZEUS. The possible uncertainty is smaller than, or at most comparable to, other approximations used. Thus it becomes possible to extract the gluon density directly from the measured diffractive cross section.
3 Corrections to LO exclusive production
Expression (2) is a simple, first approximation, justified in the LO collinear approximation using the non-relativistic wave function. The relativistic corrections were intensively discussed in [12, 13]. The problem is that, simultaneously with the relativistic description of the quarks, one needs to consider higher order Fock component states of . Hoodbhoy [14] has studied these two effects to order . He has shown that relativistic corrections to (2), written in terms of the experimentally measured , are small, , see [14]. So we do not account further for relativistic corrections below.
NLO corrections arise, first, from an explicit integration over the gluon , which goes beyond the leading log contribution, arising from , and, second, from more complicated diagrams with one additional loop. To perform the explicit integration we have to use the unintegrated gluon distribution, , which is related to the integrated gluon by
| (4) |
Of course, the infrared contribution cannot be treated perturbatively, and so we have introduced a lower limit for the integral in the production amplitude,
| (5) |
Expression (5) replaces the factor in the LO result (2). To be precise, the unintegrated distribution embodies the Sudakov factor such that [15]
| (6) |
Thus in Eq. (4) is given by and correspondingly for (5), . In our numerics we have chosen . However, in the amplitude (5), the dominant contribution comes from the region of where is close to unity. The inclusion of the factor may be considered as an correction to the gluon density and suppresses the gluon in our analysis by 1.7% for photoproduction at . The contribution coming from is written in terms of the integrated gluon , that is the infrared part is absorbed into the input distribution at the ‘transition’ scale .
Of course, at low the gluon extracted from a global analysis may be affected by the presence of absorptive corrections which are usually neglected. Here, the absorptive corrections are expected to be smaller. The transverse size, , of the dipole produced by the ‘heavy’ photon in DIS has a logarithmic distribution starting from up to some hadronic scale. In the case of production the size of the dipole is limited by the size of the meson. Even in photoproduction it is of the order of . Since the probability of rescattering is proportional to , we anticipate a much smaller absorptive effect.
A more detailed analysis of the NLO corrections was done in [16, 17]. Part of these corrections generates the running of , while part is similar to gluon Reggeization in the BFKL approach. Indeed, for electroproduction it was shown [17] using the conventional collinear factorisation scheme, that there is a NLO correction of the form
| (7) |
In the factorisation approach such a correction may be included by replacing the -channel gluon by the Reggeized gluon. However this correction vanishes with a natural choice of the factorisation scale, , which was adopted in our prescription [18, 19, 15]. One therefore has reason to believe that the factorisation approach accounts for a major part of the NLO effect, and that the resulting ‘NLO’ gluon may be compared to that in a set of NLO global partons.222The global partons are defined in the regularization scheme. Our partons should also be considered to be in the scheme, since we use the definition of , and moreover the factorisation scale which provides the cancellation of the correction is also specified in the scheme. Therefore we shall refer to the resulting distributions as NLO gluons.
One also needs to account for the fact that the two gluons exchanged carry different fractions of the light-cone proton momentum, see Fig. 2. That is one has to use the generalised (skewed) gluon distribution.333In the formal analysis of the NLO contributions, there are effects arising from integrated quarks which generate gluons which then couple to the charm quark. In terms of our unintegrated gluon () description this should be considered as a NLO correction to the evolution of . Since we do not consider the evolution, but just parametrise the scale dependence of the gluons (see below), this correction is outside our analysis. In our case , and the skewing effect can be well estimated from [20]
| (8) |
where . That is in the small region of interest we take the gluon to have the form .
Recall that the integral (5) was written for the discontinuity (i.e. for the imaginary part) of the amplitude shown in Fig. 2. The real part may be determined using a dispersion relation. In the low region, for our positive-signature amplitude , the dispersion relation can be written in the form
| (9) |
Both corrections lead to an enhancement of the cross section.
4 Determination of the gluon from data
In the following, we present fits to the data for exclusive production from HERA using the perturbative description discussed above.
In the low region it is expected that the dependence of the gluon density is well approximated by the form . However, the evolution in modifies this behaviour, enlarging the power as increases. In particular, in the double leading log (DLL) approximation, we have the asymptotic form
| (10) |
Thus we need a dependent parametrisation. However, in the limited region of covered by the exclusive data, it is sufficient to use a simple parametric form444Such a form has already successfully been used in [21] for the analysis of inclusive diffractive DIS data.
| (11) |
The free parameters , and are determined by a non-linear fit to the exclusive data from H1 [9] and ZEUS [11, 22].555We also performed fits for the data from the H1 and ZEUS collaborations separately. These fits typically have a smaller , signalling a slight incompatibility between the data. However, they lead to similar results for the gluon. As the combined fit is very satisfactory (), we will not discuss fits of individual data sets in the following. This three-parameter form provides enough flexibility to accurately describe the and behaviour of production in the limited domain covered by the data, namely and , so we will use exactly Eq. (11) for the LO fit.
However, for the NLO approach, where we have the integral (5) which runs up to the kinematical limit , we face the problem of a badly convergent integral. Indeed the low gluons obtain a large anomalous dimension . Since we get . On the other hand, the expression (5) was calculated with running . Recall that the scale dependence of the power was generated by the evolution of the form . Accounting for the running , it is natural to replace the second term in the parametric form (11) by . Therefore, for the NLO fit, we use
| (12) |
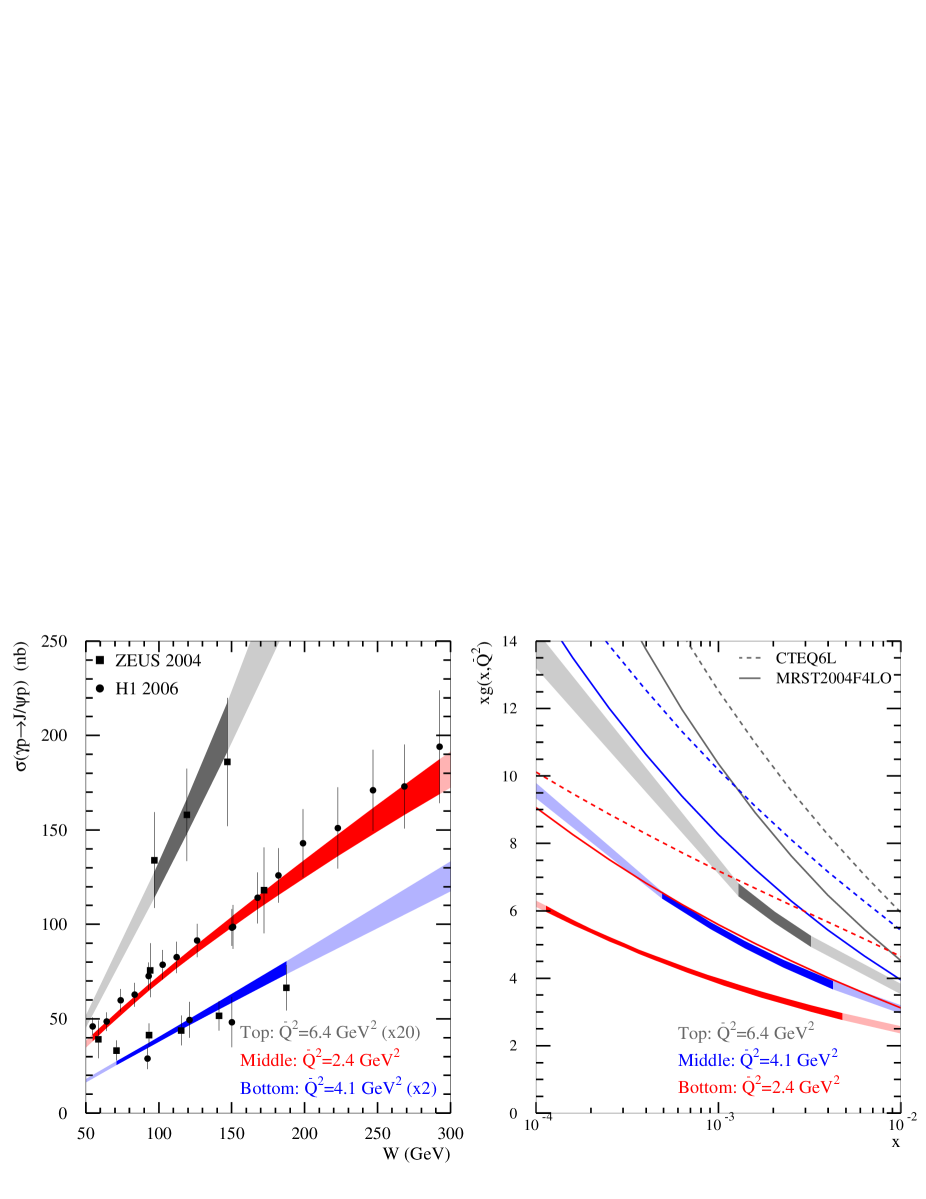
The gluon densities obtained from the LO fit, using (2) with (11), together with the skewing and real part corrections, to the exclusive data [9, 11, 22] are shown in Fig. 3.666Note that in Figs. 3, 4 only a subset of 51 data points used in the fits is displayed, and there are data points at up to GeV2, corresponding to GeV2. Inclusion of these corrections gives a 22% suppression of the gluon for photoproduction at , with the skewing correction giving the dominant suppression of 18%. We use a 1-loop running with . In the analysis, error bands on the gluon and cross section are generated using the full covariance matrix for the fitted parameters, where as input we have added the statistical and systematic experimental errors of the data in quadrature. Compared to the gluons from the global fits, the gluon from our LO fit is similar in shape, but slightly smaller in normalisation and shows less rise towards smaller with growing scales.
We now present the results of our NLO fit, which we obtain by modifying Eq. (2) by help of (5) with 2-loop running , and replacing the parametrisation (11) by (12). Of course we also include skewing and real part corrections as before, and the factor as discussed above.
| LO | 0.9 | |||
| NLO | 0.8 |
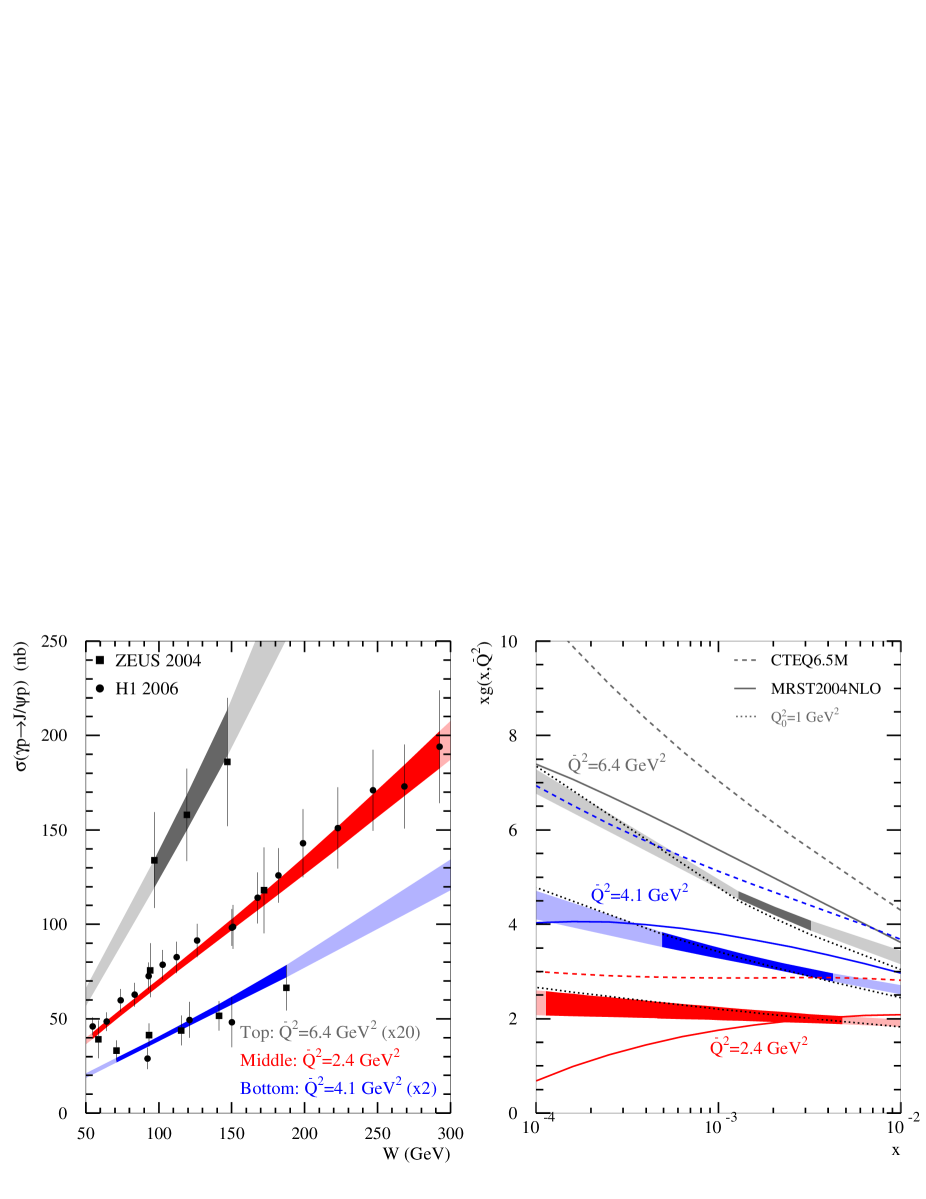
Figure 4 shows our fit using and . The dotted lines represent the central values of the gluons obtained using . The NLO gluon fit shows a better matching to the global gluons at than the LO gluon obtained. The analysis of the exclusive data indicates that, at the larger scales, the small behaviour of the gluon distribution is slightly flatter than that of the global analyses, both in their behaviour and in their scale dependence of . At low scales, the gluon obtained from the data still rises with decreasing , especially in contrast to the MRST fit. For completeness we also present the values of the parameters for the LO and NLO fits (Tab. 1). As can be seen from Figs. 3, 4 and the values quoted in Tab. 1, our simple ansatz for the form of the gluon, , using an independent power , works very well. To quantify the and behaviour, we tabulate the values of the power of the gluon, , from (12) at four values, compared to values estimated from MRST2004NLO [5] and CTEQ6.5M gluons [3] (Tab. 2). As is evident from Fig. 4 and Tab. 2, our NLO gluon fit seems to be incompatible with the strength of evolution of the MRST global fit (e.g. at our gluon increases by a factor from to GeV2 compared to for the MRST2004NLO gluon); however, there is fair agreement in the evolution between our gluon and the CTEQ fit (CTEQ evolves by a factor in the same regime, although in absolute normalisation our NLO prediction for the gluon agrees, on average, much better with the MRST NLO prediction). Of course, this should be seen in light of the large uncertainties of both the MRST and CTEQ gluons at small and scales, see Figs. 1 and 4. This uncertainty persists at the largest scales probed in our fit. As these scales are rather low, the accuracy of the DGLAP approach may already be seriously affected by small effects and absorptive and power suppressed corrections.
Of course, in the factorisation approach there is some uncertainty arising from the infrared cut-off , below which we cannot consider the integration literally. We have to express this low contribution in terms of the gluon integrated over up to . However, with our prescription for unintegrated partons, these two contributions match smoothly to each other. The ambiguity due to the choice of is quite small, as illustrated by the closeness of the dotted lines to our NLO gluons in Fig. 4.
Note that the difference between the LO and NLO gluons is large at the smallest values, both in the global parton analyses and for the gluons obtained from elastic production. For the global analyses this is due to the absence of the photon-gluon coefficient function at LO. At LO, the photon couples only to the quark parton, which is produced from a gluon at some scale , due to the strong ordering in . At low the gluon grows with , and, to provide the measured values of the proton structure function , we need a much larger gluon distribution in the LO formalism. At NLO the photon-gluon coefficient function is present, which provides a direct photon-gluon parton coupling at the scale , and, more importantly, a divergence appears in the quark-gluon splitting function, which accelerates the quark evolution and in turn requires less gluon. In elastic production we have an analogous situation. By carrying out the integration, we include the interaction with the gluon at large scales of the order of . Moreover, part of this integral has , and may be regarded as one step of backward evolution. In summary, in DGLAP analyses based on collinear factorisation, the large change in the gluon distribution in going from LO to NLO is due to the strong ordering in and the absence of an additional loop integral in the LO coefficient function and parton evolution. Inclusion of higher-order terms beyond NLO is expected to give a much smaller effect. They will mainly affect the normalisation and not the dependence of the gluon.
The higher-order corrections in our approach are , but may be enhanced by large logarithms. The corrections which are enhanced by , and which may lead to some dependence, are absorbed in the form of the gluon distribution by choosing the appropriate factorisation scale , see Eq. (7). Then, in our NLO approach, the part of the integral which may be logarithmically large, is accounted for explicitly in the factorisation formalism which is used to obtain the integral. After this, those higher-order corrections, which are not included in the integral, are concentrated in the domain . Thus the scale dependence of these higher-order corrections is driven mainly by the scale dependence of the running of which we take into account. The fact that the gluons obtained from our analysis turn out to be close to the gluon distributions coming from the global analyses for , where they are fairly stable, indicates that the omitted higher-order corrections are indeed small.
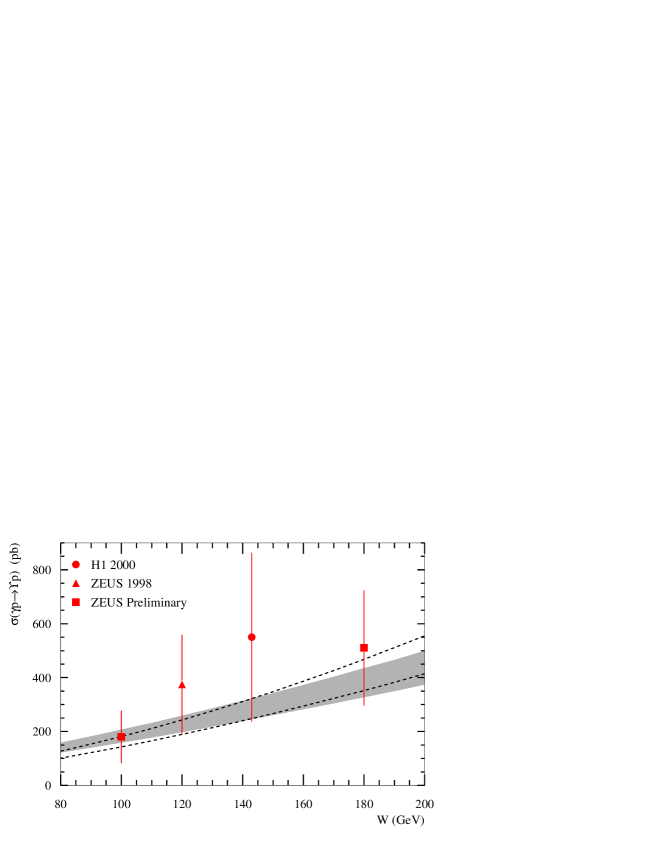
We have extended our framework to predict elastic photoproduction, using our LO and NLO gluon with our cross section formulae including corrections and factor, see Fig. 5. Although the data is sparse, the cross section predictions are reasonable.
We conclude that this new information coming from our NLO analysis of
elastic production data, in which the couple directly to the low gluon parton and where the cross section is
proportional to the square of the gluon, is especially valuable
to constrain the small behaviour of the gluon distribution. The
accuracy of the elastic data is now sufficient, as indicated by
the error bands (arising from the experimental uncertainties) on the
extracted gluon distribution shown in
Fig. 4, to improve our knowledge of the gluon distribution
at small , , considerably. This is in
comparison to the small behaviour of the ‘global’ gluon
distributions, which is not well constrained by the inclusive DIS
structure function data.
Acknowledgements
We would like to thank Robert Thorne for valuable discussions. TT thanks the UK Science and Technology Facilities Council for an Advanced Fellowship. The work of MR was supported in part by the Federal Program of the Russian Ministry of Industry, Science and Technology, RSGSS-5788.2006.02.
References
- [1] CTEQ Collaboration, J. Pumplin et al., JHEP 0207 (2002) 012.
- [2] A.D. Martin, W.J. Stirling and R.S. Thorne, Phys. Lett. B636 (2006) 259.
- [3] CTEQ Collaboration, W.-K. Tung et al., JHEP 0702 (2007) 053.
- [4] A.D. Martin, R.G. Roberts, W.J. Stirling and R.S. Thorne, Eur. Phys. J. C28 (2003) 455.
- [5] A.D. Martin, R.G. Roberts, W.J. Stirling and R.S. Thorne, Phys. Lett. B604 (2004) 61.
- [6] A.D. Martin, W.J. Stirling, R.S. Thorne and G. Watt, Phys. Lett. B652 (2007) 292.
- [7] C.D. White and R.S. Thorne, Phys. Rev. D75 (2007) 034005.
- [8] M.G. Ryskin, Z. Phys. C37 (1993) 89.
- [9] H1 Collaboration, A. Aktas et al., Eur. Phys. J. C46 (2006) 585.
- [10] ZEUS Collaboration, S. Chekanov et al., Eur. Phys. J. C24 (2002) 345.
- [11] ZEUS Collaboration, S. Chekanov et al., Nucl. Phys. B695 (2004) 3.
- [12] M.G. Ryskin, R.G. Roberts, A.D. Martin and E.M. Levin, Z. Phys. C76 (1997) 231.
- [13] L. Frankfurt, W. Koepf, M. Strikman, Phys. Rev. D54 (1996) 3194.
- [14] P. Hoodbhoy, Phys. Rev. D56 (1997) 388.
- [15] A.D. Martin, M.G. Ryskin and T. Teubner, Phys. Rev. D62 (2000) 014022.
- [16] D.Yu. Ivanov, M.I. Kotsky and A. Papa, Eur. Phys. J. C38 (2004) 195.
- [17] D.Yu. Ivanov, A. Schäfer, L. Szymanowski and G. Krasnikov, Eur. Phys. J. C34 (2004) 297.
- [18] E.M. Levin, A.D. Martin, M.G. Ryskin and T. Teubner, Z. Phys. C74 (1997) 671.
- [19] A.D. Martin, M.G. Ryskin and T. Teubner, Phys. Rev. D55 (1997) 4329, Phys. Lett. B454 (1999) 339.
- [20] K. Golec-Biernat, A.D. Martin, M.G. Ryskin and A.G. Shuvaev, Phys. Rev. D60 (1999) 014015.
- [21] A.D. Martin, M.G. Ryskin and G. Watt, Eur. Phys. J. C37 (2004) 285.
- [22] ZEUS Collaboration, J. Breitweg et al., Z. Phys. C75 (1997) 215; Eur. Phys. J. C6 (1999) 603.
- [23] ZEUS Collaboration, J. Breitweg et al., Phys. Lett. B437 (1998) 432.
- [24] H1 Collaboration, C. Adloff et al. Phys. Lett. B483 (2000) 23.
- [25] Results presented by I. Rubinsky at the HEP2007 conference in Manchester, July 2007.