Stability of the decagonal quasicrystal in the Lennard-Jones-Gauss system
Abstract
Although quasicrystals have been studied for 25 years, there are many open questions concerning their stability: What is the role of phason fluctuations? Do quasicrystals transform into periodic crystals at low temperature? If yes, by what mechanisms? We address these questions here for a simple two-dimensional model system, a monatomic decagonal quasicrystal, which is stabilized by the Lennard-Jones-Gauss potential in thermodynamic equilibrium. It is known to transform to the approximant Xi, when cooled below a critical temperature. We show that the decagonal phase is an entropically stabilized random tiling. By determining the average particle energy for a series of approximants, it is found that the approximant Xi is the one with lowest potential energy.
1 Introduction
Quasicrystals are long-range ordered materials without translational symmetry. Their structure is best understood as a decorated tiling. Each vertex of the tiling is an integer multiple of a finite set of basis vectors. As a consequence, the tiling can be projected from a periodic lattice in a higher-dimensional configuration space. The subset of the lattice used for the projection is called the de Bruijn surface.
Two scenarios for the stability of quasicrystals are currently under discussion [1]: the perfect tiling and the random tiling. In both of them, the atoms are restricted to a discrete set of equilibrium positions given by the underlying tiling structure. In the perfect tiling the de Bruijn surface is straight and rigid. As a consequence, the atom positions are strongly ordered. In contrast, the random tiling has an enhanced flexibility allowing phason fluctuations of the de Bruijn surface [2]. Both scenarios lead to similar diffraction patterns with identical Bragg peak positions. However in the case of the random tiling, additional diffuse scattering is present in the background.
The deviation of a general de Bruijn surface from the straight one is described by the phason displacement [3]. A constant phason displacement does not cost energy. Thus, the free energy can be written as a function of the phason strains . Because elementary tiling defects of the perfect tiling are matching rule violations whose number is proportional to the phason strain, the free energy is linear: . This shows that the perfect tiling is stabilized energetically. On the other hand, the stabilization of the random tiling is caused by the entropy of the phason fluctuations. The free energy is then analytic, in lowest order .
Since the importance of entropy increases with temperature, it is assumed that the random tiling is the preferred state at high . Upon lowering the temperature, a locking transition to the perfect tiling has been suggested [4]. Interestingly, this transition cannot appear in two dimensions, because thermal roughening of the de Bruijn surface occurs at all [5]. Furthermore, a phase transition to a periodic crystal as energetic ground state is possible. If the structure of the crystal is similar to the quasicrystal, in which case it is called an approximant, then the transformation has to involve a rotation of the de Bruijn surface. However, a full transformation via such a rotation is inefficient for large quasicrystals, because the required total number of flips increases faster with the size of the system than the number of atoms.
A more efficient transformation mechanism is the formation of a twinned nanodomain structure [6]. The twinning corresponds to a folding of the de Bruijn surface into piecewise straight segments, while leaving invariant the average orientation of the surface. Note that each approximant can appear in different orientations according to the symmetry of the quasicrystal. Indeed, experimental observations reveal that the ground state for many systems is a twinned approximant [6]. However it is not known, whether quasicrystals can be stable down to 0 K. If the phase transition occurs at low-temperatures, the flips will be frozen in.
Currently, there are still no realistic models for studying the transition to and from the quasicrystal state in simulations. The reason is the structural complexity and the necessity to simulate over long times in order to reach thermal equilibrium. Hence, we resort to a simple two-dimensional system of identical particles interacting with the Lennard-Jones-Gauss (LJG) potential. As far as we know, the LJG system is the only system that allows to observe a transition between quasicrystal and approximant in simulations.
2 Model system and computational methods
Motivated by the existence of Friedel oscillations in the effective pair potentials of many metals, we have recently introduced the LJG interaction potential [7] of the form
| (1) |
The potential consists of a Lennard-Jones term and an additional Gaussian minimum at position , with depth , and width given by . Its phase diagram in the - plane is surprisingly rich: several crystals and two quasicrystals can be grown from the melt in numerical simulations.
In the following, the parameters , , and are fixed. This stabilizes a decagonal quasicrystal at elevated temperatures. As shown in [7], a reversible phase transition to the approximant Xi occurs upon lowering the temperature below (). We note that the latter is not the ground state. There is a hexagonal phase, which is still more stable at low temperatures. However, we are not concerned with this phase, since its nucleation radius is too big. Although for smaller values the approximant Xi can be made stable down to , we chose , because the formation of the decagonal phase seems to be easiest and fastest there.
Simulations are run with a combination of molecular dynamics and Monte Carlo. Molecular dynamics is used to relax phonon strains. Periodic boundary conditions and a Nose-Hoover thermo-/barostat for constant temperature and pressure are applied. The potential is cut off at . Monte Carlo helps to speed up the phason strain relaxation. This is necessary, because the lowest energy approximant sometimes do not have a strictly straight, but slightly modulated de Bruijn surface. A single MC step consists of a random displacement of particles inside a ring with radius , which is the flip distance of the quasicrystal.
3 The decagonal random tiling
Above , the decagonal random tiling is the thermodynamic equilibrium state. At , which is of the melting temperature, in average flips per particle and time step are observed in molecular dynamics simulations. The number has to be compared with the average vibration time of a particle in its local potential minimum, which is of the order of MD steps. This means that there is about one phason flip per phonon vibrations. The flips are not correlated in space/time, although the positions of possible flips are of course restricted by the tiling structure.
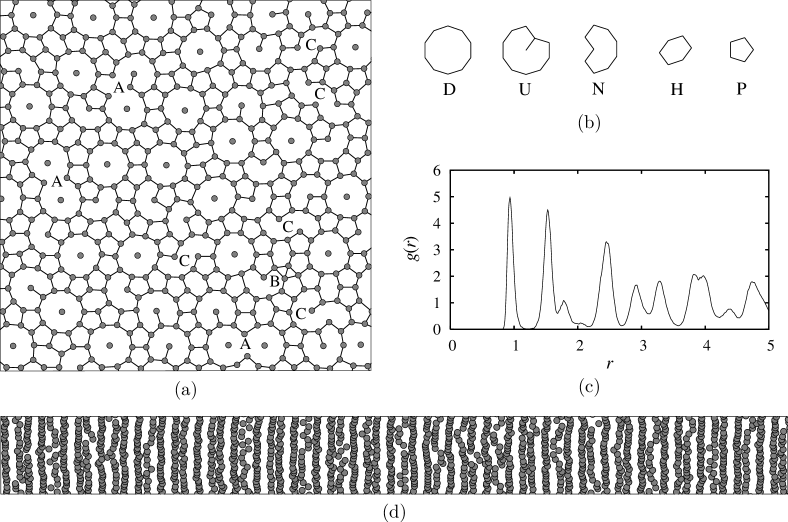
The diffraction image of a large sample with particles, equilibrated over molecular dynamics steps, has already been shown in Fig. 4 of Ref. [7]. Here, in Fig. 1(a), we present a snapshot of the particle configuration. A tiling is drawn by connecting nearest neighbors. It is found that the majority of the tiles are identical to one of the five basic tiles shown in Fig. 1(b). Additionaly, vacancies (marked as A in Fig. 1(a)), interstitials (B), as well as other tiles (C) are frequently found. However, the equilibrium density of these defects strongly decreases upon lowering the temperature. A small deformation of the tiles due to phonon motion is also observed. The radial distribution function in Fig. 1(c) has peaks near the minima of the potential at and . A third and a fourth smaller peak are found at and . The tiling is algebraically long-range ordered as seen in the oblique view (Fig. 1(d)). The particles align preferably on parallel lines with large () and small () separations, forming a randomized Fibonacci chain. The occurrence ratio of the separations is , i.e. close to the golden mean.
For pair interactions, the potential energy per particle is given by the radial distribution function and the interaction potential only:
| (2) |
Thus, we can determine by looking at the peak positions in . Since the bonds of the tilings are drawn from the nearest neighbor connections, they correspond to the first peak at . According to (2), this peak stabilizes single tiles, but does not prefer any arrangement of the tiles. It can be shown that the second-, third-, and fourth-nearest neighbor connections corresponding to , , and do not cross the boundaries of the tiles. Therefore, they also do not link neighboring tiles energetically. Further peaks at are not important for the stabilization, because the potential function has already decayed significantly. Together, this means that there are no matching rules at all in the tiling. The decagonal phase is stabilized completely indirectly by geometric constraints.
We calculate the potential energy of a hypothetical tiling built from a single tile only. To do so, we determine the coordination numbers for each of the five basic tiles. is equal to the number of neighbors corresponding to the peak at . For , bonds contribute to avoid counting them twice. Additionally, is the effective number of particles per tile: Each particle on the tile boundary contributes to , where denotes the interior angle formed by the tile boundaries at the position of the particle. A particle inside the tile contributes a factor of 1. Using (2), the potential energy is then given by
| (3) |
The comparison in Tab. 1 shows that the smallest tile has the lowest energy and the largest tile the highest. However, a periodic tiling is of course not possible with the -tile alone. So why is e.g. the tile formed? To see this, we take a look at the energy of the decagonal phase and the approximant Xi, obtained from simulations. They are and , respectively. Both numbers are lower than the values for all tiles but the -tile. The integration of the -tiles into the tiling seems to reduce . Paradoxically, as we show later, the tiling with the highest density of -tiles is the one with the lowest potential energy. It will turn out that this is the approximant Xi.
| Tile | Coordination numbers | Eff. particle | Potential | |||
| type | number | energy | ||||
| P | 2.5 | 5 | 0 | 0 | 1.5 | -7.85 |
| H | 3 | 5 | 2 | 2 | 2 | -6.44 |
| N | 4.5 | 8 | 4 | 2 | 3.5 | -5.90 |
| U | 6 | 11 | 7 | 2 | 5 | -5.75 |
| D | 5 | 10 | 10 | 0 | 5 | -5.41 |
4 Potential energy of orthorhombic approximants
Each approximant of the decagonal quasicrystal corresponds to an average phason strain . To show that the phase Xi is the energy ground state, the potential energy as a function of the phason strains is determined. We follow [8] and generate a large number of approximants with different values of . In the linear theory of elasticity extended to quasicrystals it can be shown that the decagonal phase has only two independent phason strains and [9]. Since for every value of , an orthorhombic approximant with phason strains arbitrarily close can be found, we use and to parameterize the approximants. In total 2601 orthorhombic approximants with 500 to 40000 particles are generated for a sufficiently fine mesh in the --plane. Each of them is simulated with molecular dynamics and Monte Carlo alternately, while slowly reducing the temperature from down to . This allows to bring the approximant into an energy minimum within the restriction of the imposed external phason strain.
The use of periodic boundary conditions is necessary to prevent a rotation of the de Bruijn surface. By identifying opposing sides of the system, the de Bruijn surface is topologically equivalent to a torus. This means that can only change via topological defects, e.g. dislocations, which are found to not play a role in our simulations.
At the end of each simulation, the potential energy is determined. The plot of in Fig. 2 confirms that the approximant Xi is indeed the lowest energy state. Xi appears in two variants: a parallel arrangement of the supertile rhombs connecting the D-tiles (see [7]) at , and an alternating arrangement at , . Note that we do not distinguish between the variants; together they are called ‘Xi’. Because the flipping of a row of supertile rhombs does not cost energy, every tiling built from the rhombs has the same energy. This is a consequence of the ideal random tiling character of the decagonal quasicrystal: a rearrangement of the tiling does not cost energy, if it does not change the tile types.
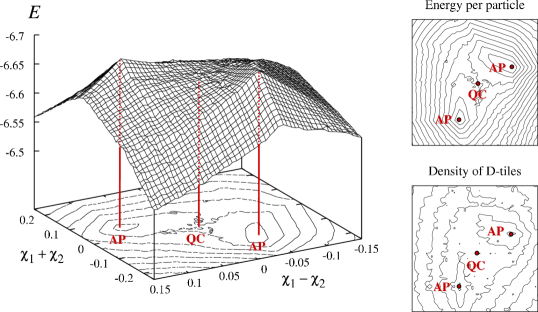
The random tiling corresponds to the saddle point at . Its phason elastic constants are obtained by a quadratic fit. One is positive and the other one negative: , . High accuracy is possible by using an adapted selection of approximants with small phason strains, which we have not done. For stability, both phason elastic constants have to be greater than zero. The negativity of demonstrates once more that the quasicrystal cannot be stable at . Fig. 2 shows that the density of -tiles and the potential energy are correlated: An increase of the number of -tiles lowers the energy as shown in the contour plots. This makes sense, since the approximant Xi is the densest possible packing of the -tiles.
We finish with two remarks: (i) For large phason strains the decagonal symmetry is lost and there are four independent phason strains (the most general case), which means that non-orthorhombic approximants will play a role. However, since it is not possible to increase the density of -tiles further, the approximant Xi is also the ground state including non-orthorhombic approximants. Of course, there are monoclinic variants of Xi. (ii) The potential energy in Fig. 2 is not everywhere a smooth function of the phason strains. Around the origin, is analytic because the quasiperiodic tiling can compensate an imposed external phason strain in a continuous manner. In contrast, the two extrema identified as the approximant Xi are cusps. For larger phason strains there are regions where is linear. Here, matching rules seem to play a dominant role. Furthermore, sharp bends are observed in-between. Simulations of larger systems are necessary to understand the phason strain relaxation in detail.
Finally, let us come back to the questions raised in the abstract. We have demonstrated, that the decagonal quasicrystal is an ideal random tiling without matching rules. It is stabilized by the entropy of phason fluctuations. At temperatures below , the approximant Xi is favored, because it has the lowest energy of all approximants. The transformation mechanism is a collective rearrangement of the tiling by discrete flips. Our results confirm that although a locking transition is not possible in two dimensions, a transition to an approximant can occur very well.
5 Acknowledgments
Financial support from the Deutsche Forschungsgemeinschaft under contract number TR 154/24-1 is gratefully acknowledged.
References
- [1] C. L. Henley, M. de Boissieu, and W. Steurer, Phil. Mag., 86, 1131–1151 (2006).
- [2] C. L. Henley, in D. P. DiVincenzo and P. J. Steinhardt (editors), Quasicrystals – The State of the Art, pp. 429–524 (World Scientific, 1991).
- [3] D. Levine, T. C. Lubensky, S. Ostlund, S. Ramaswamy, P. J. Steinhardt, J. Toner, Phys. Rev. Lett. 54, 1520–1523 (1985).
- [4] Y. Ishii, Phys. Rev. B, 39, 11862–11871 (1989).
- [5] L. H. Tang and M. V. Jarić, Phys. Rev. B, 41, 4524–4546 (1990).
- [6] W. Steurer, Acta Crystallogr. Sect. A, 61, 28–38 (2005).
- [7] M. Engel and H.-R. Trebin, Phys. Rev. Lett., 98, 225505 (2007).
- [8] U. Koschella, F. Gähler, J. Roth, and H.-R. Trebin, J. All. Comp., 342, 287–290 (2002).
- [9] P. Bak, Phys. Rev. B, 32, 5764–5772 (1985).