The SINFONI Mgii Program for Line Emitters (SIMPLE): discovering starbursts near QSO sightlines11affiliation: Based on observations made at the ESO telescopes under program ID 077.A-0576, 078.A-0600, 078.A-0718 and 079.A-0600.
Abstract
Low-ionization transitions such as the Mgii 2796/2803 doublet trace cold gas in the vicinity of galaxies. It is not clear whether this gas is part of the interstellar medium of large proto-disks, part of dwarfs, or part of entrained material in supernova-driven outflows. Studies based on Mgii statistics, e.g. stacked images and clustering analysis, have invoked starburst-driven outflows where Mgii absorbers are tracing the denser and colder gas of the outflow. A consequence of the outflow scenario is that the strongest absorbers ought to be associated with starbursts. We use the near-IR integral field spectrograph SINFONI to test whether starbursts are found around Mgii absorbers. For 67% (14 out of 21) of the absorbers with rest-frame equivalent width Å, we do detect H in emission within km s-1 of the predicted wavelength based on the Mgii redshift, and with impact parameter ranging from 0.2″ to 6.7″ from the QSO. The star formation rate (SFR) inferred from H is – yr-1, i.e. showing a level of star formation larger than in M82 by a factor of on average. Our flux limit (3-) is erg s-1 cm-2, corresponding to a SFR of 0.5 yr-1, much below past ground-based H surveys of absorption-selected galaxies. We find evidence (at %) for a correlation between SFR and equivalent width, indicating a physical connection between starburst phenomena and gas seen in absorption. In the cases where we can extract the velocity field, the host galaxies of Mgii absorbers with Å reside in halos with mean mass in good agreement with clustering measurements.
1 Introduction
In the era of large spectroscopic surveys such as SDSS (York et al., 2000), the Mgii 2796/2803 doublet seen in background QSO spectra is particularly useful for selecting thousands of absorbing galaxies (e.g. York et al., 2006). Galaxies selected via their Mgii 2796/2803 doublet have been used as proxies for studying Hi selected galaxies at (e.g. Rao et al., 2006).
It is not clear whether this cold gas is part of the interstellar medium of large spirals (Wolfe et al., 1986), part of the halos of galaxies (Bahcall & Spitzer, 1969) or part of dwarf galaxies (York et al., 1986) akin to the Magellanic Clouds. An alternative scenario for absorption-selected galaxies is that the gas seen in absorption is part of cold gas clumps in the host galaxy halos entrained in outflows produced by supernovae (SNe) (Nulsen et al., 1998; Schaye, 2001). Most likely all three scenarios play a role, but in what proportion for a given equivalent width or Hi column density?
Using cross-correlation techniques, Bouché et al. (2006) statistically constrained the halo mass of 2000 Mgii host galaxies, finding that the host halo mass () decreases with increasing Mgii rest-equivalent width (). Given that the equivalent width must be correlated with the line-of-sight velocity width, , as also verified observationally by Ellison (2006), these results imply that and are anti-correlated. This seems to show that the clouds responsible for the absorption are not virialized, otherwise, a – correlation would have been measured. A natural explanation for this is that the cold gas originates from SN-driven outflows, in which case the velocity width may be related to the outflow kinematics or may be a measure of the mass outflow rate. In a few cases, evidence for super-winds is seen from the absorption profile (Bond et al., 2001; Ellison et al., 2003). Others, e.g. Prochter et al. (2006) and Martin (2006) arrived at the same conclusion that super-winds play a significant role in Mgii absorbers from very different perspectives.
The most important implication from the starburst scenario is that the selection of galaxies via the Mgii absorption signature may be equivalent to selecting starburst-producing super-winds. Equivalently, non-detections of the H signature of a starburst would enable one to rule out the starburst scenario, while the presence of H emission is no un-ambiguous proof of starburst-driven winds.
In this letter, we report the first results of our “SINFONI Mgii Program for Line Emitters” (SIMPLE), which is aimed at detecting H from the starburst galaxy using the integral field unit (IFU) SINFONI (Eisenhauer et al., 2003) available at the Very Large Telescope (VLT). The advantages of IFUs include the possibility of detecting the Mgii host at impact parameters smaller than the seeing disk, and of measuring the two-dimensional kinematics of galaxies.
We present our sample selection in section 2, and results in section 3. Throughout, we use the , , cosmology.
2 Sample Selection
Our sample of Mgii-selected galaxies is selected from the SDSS/2QZ databases and from the compilation of Ryabinkov et al. (2003) with the only physical criterion Å. We then ensured that the corresponding H emission line would fall inside the SINFONI wavelength range and away from sky OH emission lines. The Å criterion was used for the following two reasons. First, in the super-wind scenario, the strongest absorbers (as measured by ) ought to have the largest star-formation rates, hence the largest H fluxes. Second, the Å criterion is known to select the hosts with the smallest impact parameters, kpc (e.g. Steidel, 1995; Bouché et al., 2006). At , this corresponds to ″, which means that the host galaxy will fall within the field of view of SINFONI (8″).
We have obtained SINFONI observations towards 21 Mgii absorbing galaxies all with absorption redshift , i.e. corresponding the -band filter. We focused on systems because (1) this redshift range is close to the range used in Bouché et al. (2006), and (2) our flux sensitivity is enhanced in the J-band compared to that in the K-band. The latter point is due to the gain in luminosity distance compared to the loss in raw instrument throughput. For each QSO field we took 4600s exposures, placing the QSO in the four quadrants of the field of view. The total exposure time for the host galaxy thus varies between 10 and 40 minutes, depending on its location with respect to the QSO. The observations were all taken in seeing-limited mode with ″ pixels, in moderate (optical) seeing conditions (1″–1.5″), yielding a point spread function (PSF) of 0.8″–1.2″ in the J-band.
The data reduction is based on pairwise subtraction of the frames as in Förster Schreiber et al. (2006) using the MPE SINFONI pipeline (SPRED, Abuter et al., 2006, and references therein) and the OH sky line removal scheme of Davies (2007). The wavelength solution is obtained using the Ar lamp frames, and the absolute wavelength is obtained directly from the OH sky emission lines. Flux calibration is performed using telluric standard stars.
3 Results
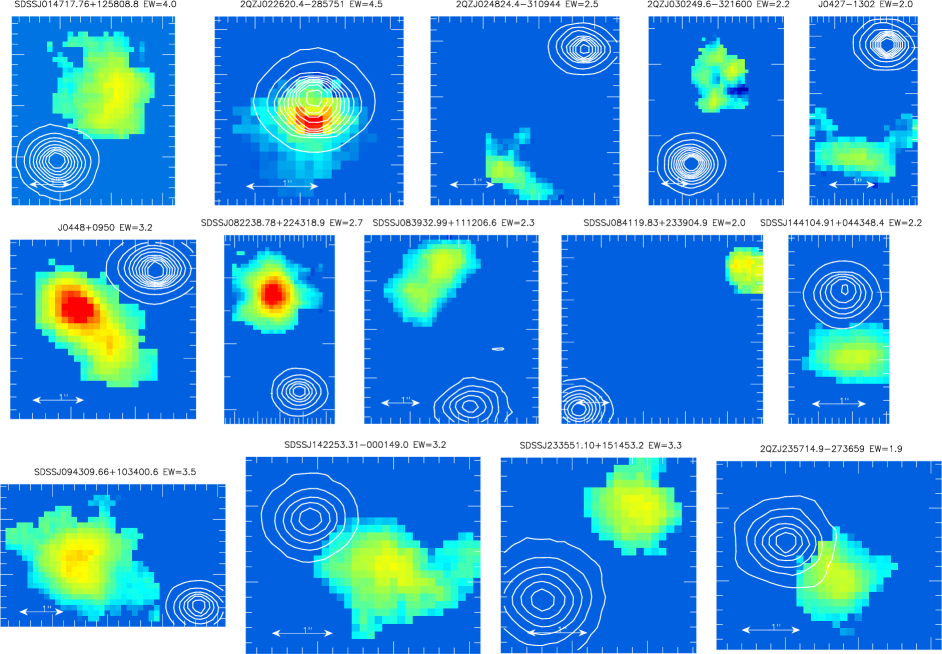
From the SINFONI data-cubes, we detect an H emitter within km s-1 of the predicted location from the Mgii redshift in 14 of the 21 fields down to a flux limit of 4 erg s-1 cm-2 (1-) (see Table 1). In other words, we have a 67% detection rate. The undetected hosts are either fainter than our flux limit or outside the field of view. Fig. 1 shows the H flux maps for all of the detected host galaxies. In all frames, the QSO PSF (typically 0.8-1.2″ FWHM) was subtracted from the H flux maps and is shown as contours.
As seen from Fig. 1, the impact parameters range from 0.2″ to 4″ (1 to 25 kpc) with one at ” (J0841+2339). The very strong absorber (=4.5Å) towards the QSO 2QZJ0226-28 is detected with an impact parameter of 0.2″, well within the seeing disk. We can rule out the possibility of this emission line being from the QSO. Indeed, the emission line at 1.327m corresponds to 4185Å in the rest-frame of the QSO and therefore does not correspond to any known atomic transition. Furthermore, the emission line is clearly spatially offset from the QSO centroid. This shows that it is possible to decouple the intervening galaxy and the QSO owing to the information contained in the IFU data cube.
It is extremely unlikely that all the 14 emission lines shown in Fig. 1 be something else in relation to other intervening systems along the line of sight. For the strongest emitters (J0448,J0302,J0822,J0943), we do also detect [NII] 6583 and [SII] 6717,6731, therefore lifting any ambiquity. In the cases where only one line is detected, we can reject the other possibilities (Oii, Oiii, H) for the following reasons. [Oiii] 5007 is a doublet easily identifiable at the SINFONI resolution . [Oii] 3727 would not be resolved, but that would put the galaxy at a redshift higher than the QSO emission redshift. In most cases, the same argument applies for H. When not, we have checked the QSO spectrum for possible corresponding absorbers (Mgii,Feii) and found nothing in the QSO spectrum at the corresponding location.
After more than two decades, only absorption-selected galaxies have been identified in emission, and mostly at (e.g. Kulkarni et al., 2006, and references therein) using broad band imaging (e.g. Le Brun et al., 1997; Chen & Lanzetta, 2003). Low-redshift () Mgii absorbers have been identified more easily (Bergeron & Boissé, 1991; Steidel et al., 1994; Le Brun et al., 1997) than low- and high- damped Ly absorbers (DLAs), which are all also Mgii absorbers (Rao et al., 2006). Our 67% detection rate of the host H emission is thus in contrast to most previous H studies of absorption-selected galaxies since our sample of strong Mgii absorbers ( Å) is dominated by DLA ‘candidates’ meeting the criterion of Rao et al. (2006) (see Table 1) and is due to several factors. If our careful avoidance of OH sky emission lines plays a significant role, it is the SINFONI throughput that enabled us to reach flux limits unavailable previously from the ground, reaching erg s-1 cm-2 or a SFR of 0.5 yr-1at in less than 1 hr. For comparison, previous H surveys for DLAs include the ground-based surveys of (e.g.) Mannucci et al. (1998) unveiling several candidates down to erg s-1 cm-2(), van der Werf et al. (2000) unveiling several candidates down to erg s-1 cm-2(), Bunker et al. (1999) showing no detection down to –erg s-1 cm-2(), the HST/NICMOS survey of the DLA (=1.5 Å) by Bouché et al. (2001) showing no detections down to erg s-1 cm-2(), and the NICMOS survey of a DLA by Kulkarni et al. (2001) showing no detection down to erg s-1 cm-2(3).
The large number of H detections in this survey shows the relatively high star formation rates of the host galaxy given our shallow exposures. The averaged integrated H luminosity for our sample is erg s-1 (median erg s-1), uncorrected for extinction. This is about times that of the starburst M82 whose raw is erg s-1 (Lehnert et al., 1999). If we adopt a statistical correction of mag as derived for local star-forming and starburst galaxies of similar H luminosities (Kennicutt, 1998; Buat et al., 2002), we infer an average (median) SFR of 12 (7) yr-1 using the Kennicutt (1998) flux conversion for a Salpeter IMF, and 7 (4) yr-1 using the Chabrier (2003) IMF (both from 0.1 to 100 ). Table 1 lists the derived properties of our sample.
Fig. 2 shows the SFR as a function of . It appears that there is a correlation between the SFR and , which is significant at more than -: the Pearson correlation coefficient is with a -value, and a Spearman rank test gives and . The corrrelation is very consistent with the analysis of Zibetti et al. (2007) who found that the hosts of the strongest Mgii absorbers are bluer. If stronger starbursts produce larger outflows (whose signature is more clouds over a larger ), such a correlation would naturally arise in the outflow scenario. We will attempt to model this in more detail in Bouché et al. (in preparation).
The inferred SFRs are moderate, but whether or not the H emitters seen in Fig. 1 are producing winds depends on the SFR per unit area, , not on the integrated SFR. For instance, the starbursts M82 (SFR yr-1, Lehnert et al., 1999) and NGC 1569 (SFR yr-1, Martin, Kobulnicky & Heckman, 2002) have greater than the 0.1 yr-1 kpc-2 threshold for harboring SN driven outflows (Heckman, 2003), and do show strong outflows. Already, the majority of our sample meet this criteria. Higher spatial resolution data and better size constraints will enable us to test whether strong Mgii selected galaxies always meet the outflow threshold and, in the cases where it does, to probe the outflow physical properties.
As stated in section 1, H ought to be present and detected in the starburst–outflow scenario. Had we not detected H, this would have ruled out the outflow scenario. The high detection fraction thus prevents us from ruling out the outflow scenario. The relatively high average SFR (compared to M82) is in fact very consistent with the prediction of the starburst–outflow scenario, and we view this result as supporting the outflow scenario, but other interpretations are possible. Note that our conclusion only applies for galaxies selected with the strongest Mgii absorption equivalent widths ( Å). Mgii absorption systems with Å are much more numerous and may select a more diverse class of galaxies (e.g. Bergeron & Boissé, 1991; Steidel et al., 1994).
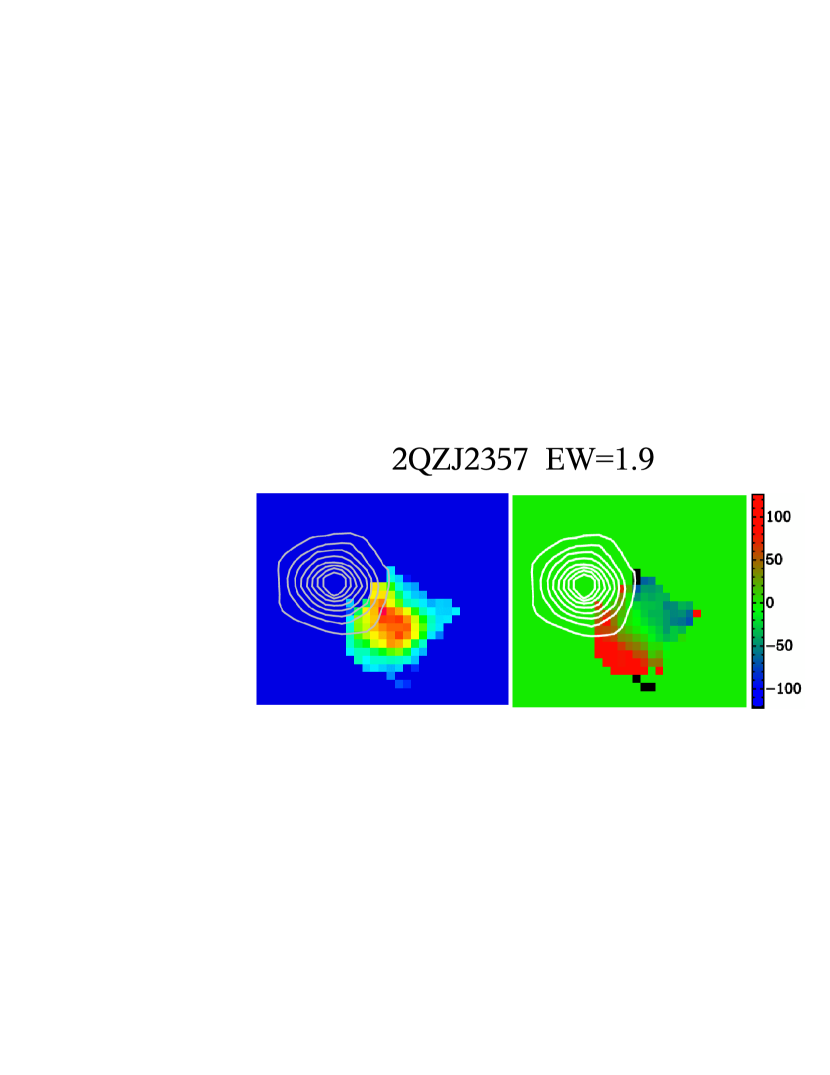
Fig. 3 shows an example of the two dimensional velocity field for one of the Mgii host galaxies. For the remainder of the sample, when we can extract the velocity field, we find that the host galaxy of Mgii absorbers with Å reside in halos with masses ranging from –11.9 with a logarithmic mean , once corrected for inclination. This is 10 times smaller than the Milky Way, and in good agreement with the halo masses predicted from the clustering analysis of Bouché Murphy Péroux (2004) and Bouché et al. (2006). Here we are using the maximum velocity as a proxy for the circular velocity. In N. Bouché et al. (in preparation), we will present the kinematic results in detail.
References
- Abuter et al. (2006) Abuter, R., Schreiber, J., Eisenhauer, F., Ott, T., Horrobin, M., & Gillesen, S. 2006, New Astronomy Review, 50, 398
- Bahcall & Spitzer (1969) Bahcall, J., & Spitzer, L. J. 1969, A&A, 156, L63
- Bergeron & Boissé (1991) Bergeron, J., & Boissé, P. 1991, A&A, 243, 344
- Bond et al. (2001) Bond, N. A., Churchill, C. W., Charlton, J. C., & Vogt, S. S. 2001, ApJ, 557, 761
- Bouché et al. (2001) Bouché, N., Lowenthal, J. D., Charlton, J. C., Bershady, M. A., Churchill, C. W., & Steidel, C. C. 2001, ApJ, 550, 585
- Bouché Murphy Péroux (2004) Bouché, N. Murphy, M. T., & Péroux, C. 2004, MNRAS, 354, 25L
- Bouché et al. (2006) Bouché, N., Murphy, M. T., Peroux, C., Csabai, I., & Wild, V. 2006, MNRAS, 371, 495
- Buat et al. (2002) Buat, V., Boselli, A., Gavazzi, G., & Bonfanti, C. 2002, A&A, 383, 801
- Bunker et al. (1999) Bunker, A., Warren, S. J., Clements, D. L., Williger, G. M., & Hewett, P.C . 1999, MNRAS, 309, 875
- Chabrier (2003) Chabrier, G. 2003, PASP, 115, 763
- Chen & Lanzetta (2003) Chen, H., & Lanzetta, K. M. 2003, ApJ, 597, 706
- Davies (2007) Davies, R. 2007, MNRAS, 375, 1099
- Eisenhauer et al. (2003) Eisenhauer, F. et al. 2003, in Instrument Design and Performance for Optical/Infrared Ground-based Telescopes. Edited by Iye, Masanori; Moorwood, Alan F. M. Proceedings of the SPIE, Volume 4841, pp. 1548-1561 (2003)., ed. M. Iye & A. F. M. Moorwood, 1548–1561
- Ellison (2006) Ellison, S. L. 2006, MNRAS, 368, 335
- Ellison et al. (2003) Ellison, S. L., Mallén-Ornelas, G., & Sawicki, M. 2003, ApJ, 589, 709
- Förster Schreiber et al. (2006) Forster Schreiber, N. M., et al.. 2006, ApJ, 645, 1062
- Heckman (2003) Heckman, T. 2003, RevMex, 17, 47
- Kennicutt (1998) Kennicutt, R. C. 1998, ARA&A, 36, 189
- Kulkarni et al. (2001) Kulkarni, V. P., et al. 2001, ApJ, 551, 37
- Kulkarni et al. (2006) Kulkarni, V. P., Woodgate, B. E., York, D. G., Thatte, D. G., Meiring, J., Palunas, P., & Wassell, E. 2006, ApJ, 636, 30
- Le Brun et al. (1997) Le Brun, V., Bergeron, J., Boisse, P., & Deharveng, J. M. 1997, A&A, 321, 733
- Lehnert et al. (1999) Lehnert, M. D., Heckman, T. M., & Weaver, K. A. 1999, ApJ, 523, 575
- Mannucci et al. (1998) Mannucci, F., Thompson, D., Beckwith, S. V. W., & Williger, G.M. 1998, ApJ, 501, 11L
- Martin, Kobulnicky & Heckman (2002) Martin C. L., Kobulnicky H. A., & Heckman T. M., 2002, ApJ, 574, 663
- Martin (2006) Martin, C. L. 2006, ApJ, 647, 222
- Nulsen et al. (1998) Nulsen, P. E. J., Barcons, X., & Fabian, A. C. 1998, MNRAS, 301, 168
- Prochter et al. (2006) Prochter, G. E., Prochaska, J. X., & Burles, S. 2006, ApJ, 639, 766
- Rao et al. (2006) Rao, S. M., Turnshek, D. A., & Nestor, D. B. 2006, ApJ, 636, 610
- Ryabinkov et al. (2003) Ryabinkov, A. I., Kaminker, A. D., & Varshalovish, D. A. 2003. A&A, 412, 707
- Schaye (2001) Schaye, J. 2001, ApJ, 559, L1
- Steidel (1995) Steidel, C. C. 1995, in QSO Absorption Lines, ed. G. Meylan, ESO Astrophysics Symposia (Berlin, Germany: Springer-Verlag), 139
- Steidel et al. (1994) Steidel, C. C., Dickinson, M., & Persson, S. E. 1994, ApJ, 437, L75
- van der Werf et al. (2000) van der Werf, P. P. and Moorwood, A. F. M. and Bremer, M. N. 2000, A&A, 362, 509-518
- Wolfe et al. (1986) Wolfe, A. M., Turnshek, D. A., Smith, H. E., & Cohen, R. D. 1986, ApJS, 61, 249
- York et al. (1986) York, D. G., Burks, G. S., & Gibney, T. B. 1986, AJ, 91, 354
- York et al. (2000) York, D. G., et al. 2000, AJ, 120, 1579
- York et al. (2006) York, D. G., et al. 2006, MNRAS, 367, 943
- Zibetti et al. (2007) Zibetti, S., Ménard, B., Nestor, D. B., Quider, A. M., Rao, S. M., & Turnshek, D. A. 2007, ApJ, 658, 161

| Sight Line | aaa ‘1’ indicates that the system meets the Rao et al. (2006) criteria for being a DLA. | PSF | bbthe 3- upper limits for the non-detections are computed for an unresolved source spread over pixels, spread over 32 spatial pixels and spectral FWHM=6 pix=9Å (i.e. ” kpc, and FWHM=250 km s-1). The same dust-correction was applied to the SFR limits. | SFR | |||||
| (Å) | (cm-2) | (arcsec) | (arcsec) | (kpc) | erg s-1 cm-2 | yr-1 | |||
| Sightlines with Detections | |||||||||
| SDSSJ014717.76+125808.8 | 1.5030 | 1.03906 | 4.025 | 1 | 0.9 | 1.9 | 15 | (1.7)E-16 | 10 |
| 2QZJ022620.4-285751 | 2.171 | 1.0208 | 4.515 | … | 0.7 | 0.25 | 2 | (1.5)E-16 | 8 |
| 2QZJ024824.4-310944 | 1.399 | 0.7906 | 2.455 | … | 0.7 | 3.0 | 24 | (4.7)E-17 | 1.3 |
| 2QZJ030249.6-321600 | 0.898 | 0.8217 | 2.27 | … | 0.9 | 3.5 | 27 | (1.6)E-16 | 5.0 |
| J042707.3-130253.5 | 2.168 | 1.03450 | 2.005 | 1 | 0.7 | 2.6 | 20 | (4.4)E-17 | 2.6 |
| J044821.8+095051.7 | 2.115 | 0.83920 | 3.169 | 1 | 0.8 | 1.8 | 14 | (3.8)E-16 | 16 |
| SDSSJ082238.78+224318.9 | 1.6200 | 0.81049 | 2.749 | 1 | 0.9 | 3.1 | 24 | (4.7)E-16 | 15 |
| SDSSJ083932.99+111206.6 | 2.696 | 0.78740 | 2.32 | 0 | 1.0 | 3.7 | 29 | (1.2)E-16 | 3.5 |
| SDSSJ084119.83+233904.9 | 1.5080 | 0.81193 | 1.974 | 1 | 0.8 | 6.7 | 54 | (1.0)E-16 | 2.8 |
| SDSSJ094309.66+103400.6 | 1.2390 | 0.99646 | 3.525 | 1 | 0.8 | 3.0 | 24 | (3.3)E-16 | 17 |
| SDSSJ142253.31-000149.0 | 1.0830 | 0.90969 | 3.185 | 1 | 0.8 | 1.5 | 12 | (1.2)E-16 | 5.0 |
| SDSSJ144104.91+044348.4 | 1.1120 | 1.03878 | 2.22 | 1 | 0.7 | 1.4 | 11 | (4.5)E-17 | 2.6 |
| SDSSJ233551.10+151453.2 | 0.8920 | 0.85568 | 3.308 | 1 | 1.0 | 2.1 | 17 | (6.5)E-17 | 2.3 |
| 2QZJ235714.9-273659 | 1.732 | 0.8149 | 1.940 | … | 0.8 | 1.0 | 8 | (8.6)E-17 | 2.5 |
| Sightlines with Non-detections | |||||||||
| 2QZJ014729.4-272915 | 1.697 | 0.811 | 2.17 | … | 0.7 | NA | NA | E-17 | |
| SDSSJ100715.52+004258.4 | 1.681 | 1.0373 | 2.98 | 21.15 | 1.2 | NA | NA | E-17 | |
| SDSSJ110744.61+095527.0 | 1.222 | 0.80229 | 3.87 | 1 | 1.2 | NA | NA | E-17 | |
| SDSSJ142650.9+005150.5 | 1.333 | 0.8424 | 2.61 | 19.65 | 0.7 | NA | NA | E-17 | |
| J215145.8+213013.5 | 1.538 | 1.0023 | 2.46 | 19.30 | 1.2 | NA | NA | E-17 | |
| SDSSJ211100.20-005218.3 | 1.6860 | 1.02094 | 3.608 | 1 | 1.1 | NA | NA | E-17 | |
| 2QZJ232330.4-292123 | 1.547 | 0.811 | 2.0430 | … | 1.0 | NA | NA | E-17 | |