Nuclear break-up of 11Be
Abstract
The break-up of 11Be was studied at 41 AMeV using a secondary beam of 11Be from the GANIL facility on a 48Ti target by measuring correlations between the 10Be core, the emitted neutrons and gamma rays. The nuclear break-up leading to the emission of a neutron at large angle in the laboratory frame is identified with the ”towing mode” through its characteristic n-fragment correlation. The experimental spectra are compared with a model where the time dependent Schrödinger equation (TDSE) is solved for the neutron initially in the 11Be. A good agreement is found between experiment and theory for the shapes of neutron experimental energies and angular distributions. The spectroscopic factor of the orbital is tentatively extracted to be . The neutron emission from the and orbitals is also studied.
keywords:
break-up , neutron-halo , spectroscopic factor , towing mode , 11BePACS:
21.10.Jx, 24.10.-I, 24.50.+g, 25.10.+s, 25.60.-t, 25.60.Dz, 25.60.Gc, , , , , , , , , , , , , , , ,
1 Introduction
The investigation of exotic nuclei has strongly developed during the last two decades thanks to the availability of radioactive beams produced by in-flight fragmentation tan85 ; han87 ; tan96 and structural properties of a large variety of nuclei far from stability can be accessed. Recent advances have demonstrated the importance of a detailed understanding of nuclear reactions in order to infer properties of nuclei such as nuclear shapes, spectroscopic factors or pairing correlations mar02 . Several reaction mechanisms are used : transfer reactions of one or two nucleons for99 ; dao04 , Coulomb or nuclear break-up reactions mar02 ; pal03 ; han03 ; sau04 , the latter being the focus of this paper.
With exotic nuclei, we have to deal with low intensity beams and we expect an increasing complexity in obtaining nuclear structure information due to the reduction of the binding energy. In addition, modification of two-body correlations like pairing is expected.
In this paper, we will demonstrate that the study of nuclear break-up around the Fermi energy, conjointly with the development of accurate nuclear reaction models lac99 ; esb01 ; kid94 ; typ01 , can provide an alternative path to get information on structural properties in stable and weakly bound exotic nuclei. In this respect, 11Be appears as a good case for study as it is a one-neutron halo nucleus and is abundantly produced. Its ground state is known to be a mixture of a cold 10Be core coupled to a halo neutron in a state with an excited 10Be in a 2+ state coupled to a 1d5/2 neutron leading to a 1/2 ground state with a positive parity.
= 0+2s1/2 + 2+1d5/2
The determination of the relative importance of these two states was addressed through several experimental and theoretical approaches and is related to the spectroscopic factors S2s=2 and S1d=2. 11Be was extensively studied during the last decade as one of the first observed halo nuclei tan85 . It has revealed many of its properties through several different types of reactions such as break-up experiments pal03 ; ann94 ; aum00 ; fuk04 or transfer reactions for99 . Coulomb dissociation has been shown to play an important role when 11Be interacts with a heavy target such as Au, as the halo neutron is bound by only 500 keV and easily separates from the core.
For lighter targets such as Be, the nuclear break-up is expected to take over fal02 . It has been shown in a time dependent non-perturbative calculation (TDSE) lac99 ; esb01 that nuclear break-up presents a typical emission pattern, where the neutron and the remnant 10Be core are expected to be emitted in opposite sides of the beam direction. This property has already been observed with stable nuclei and was called ”towing mode” jas98 . The pattern of this mechanism, leading to the emission of the particle at large angle, is expected to be sensitive to the initial wave function such as its angular momentum and could be used to shed some light on the structure of the nucleus.
In this paper, we will report on an experiment performed at the GANIL facility on the break-up of 11Be where a 10Be fragment was detected in coincidence with a neutron and gamma rays. After a description of the experimental apparatus in section 2 and of the theoretical framework in section 3, we will present the neutron angular distribution in paragraph 4.1 and demonstrate the characteristic anti-correlation between the neutron and the 10Be in paragraph 4.2. The gamma energy distribution will be presented in paragraph 4.3. Paragraphs 4.4 and 4.5 will be devoted to the neutron energy spectra in two-fold and three-fold events respectively. By comparing the experimental data with the time dependent Schrödinger calculation described in section 3, the possible extraction of spectroscopic factors of the ground state of 11Be will be discussed in section 5.
2 Experimental set-up
The reaction 48Ti(11Be,10Be+n) at 41 MeV per nucleon was studied. The 11Be beam was produced by fragmentation of a 10 A 13C6+ primary beam onto a 6128 m thick carbon target placed in the Superconducting Intense Source for Secondary Ions device (SISSI) of the GANIL facility. A 600 m thick aluminum degrader was set in the alpha spectrometer and a pure 11Be beam was transported to the SPEG vault with a small angular divergence of 0.2o. The resulting beam intensity of 80000 pps was monitored by a drift chamber placed before the target. The beam size on the target was 6.4 mm giving an emittance after the break-up of more than 400 .mm.mrad and a loss in detection efficiency of the SPEG bia89 spectrometer, which has a 70 .mm.mrad nominal acceptance, of about a factor of 5. However, with the small angular divergence, no beam tracking was needed to extract the scattering angle of 10Be and hence to perform angular correlations between the ejectile and the neutrons. After breaking up on a 113 mg/cm2 Ti target, the 10Be core was analyzed by the energy loss spectrometer SPEG positioned at 0 degree and covering 2o in both horizontal and vertical directions. 74 BaF2 scintillators covered 84% of the total solid angle around the target to detect the gamma rays and 23 neutron detectors were utilized and positioned as shown in the experimental set-up presented in Fig.1.
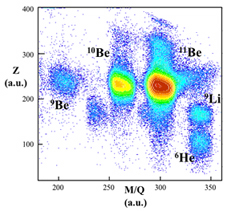
Two drift chambers, an ionization chamber and a plastic detector forming the standard detection in the focal plane of SPEG were used for identifying the fragments and infer their momenta and scattering angles. An identification plot of the fragments produced after the Ti target is constructed by plotting the energy loss in the ionization chamber versus the arrival time of the ion in the plastic detector (proportional to the M/Q of the particle since the B is fixed by the spectrometer) and shown on Fig.2. The spectrometer field was set to obtain the 10Be in the middle of the focal plane.

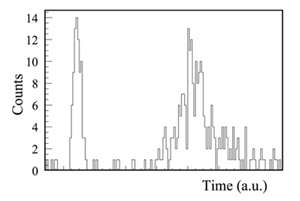
The neutrons were detected by 11 detectors of the NordBall array arn91 plus 8 cylindrical detectors of either 2 or 6 inches thick from the Uppsala group and 4, 30 cm long cylindrical detectors from Orsay. These neutron detectors of BC501 type were placed around the target at a distance varying from 1.4 meters to 3.5 meters (see Fig.1) and at angles running from 30o to 95o in the laboratory frame. The identification was given by pulse shape discrimination by integrating the signal in two 400 ns wide gates, the first starting at the beginning of the signal and the second shifted by 30 ns. Energies were obtained from the time of flight (ToF) measured between the RF of the beam and the neutron arrival time in the detector. A typical ToF spectrum is presented in Fig.3.
74 BaF2 detectors of the Château de Cristal ensemble were used to detect the gamma rays. Detector efficiency and energy calibrations where performed with 60Co and 137Cs radioactive sources. GEANT3 was used to simulate the full detector and gave an overestimation of the experimental efficiencies obtained at 661 keV (137Cs), 1173 and 1332 keV (60Co) by 23%, as already observed in ref.mar00 . The detection efficiency of gamma rays of higher energies was then obtained by the GEANT3 simulation code (release 3.21). Furthermore, as the cells were generally not directed toward the target and were overlapping in angle, GEANT3 was also used to infer the effective angle at which each detector measured the gamma rays coming from the target position. These angles, that were different from the average geometrical angle of each detector, were necessary for Doppler correction of the energy of the gamma rays emitted by the ejectile. As will be shown in paragraph 4.3, three peaks corresponding to gamma rays from 10Be were clearly observed. Whenever these peaks could be seen for a single detector in coincidence with a 10Be, their positions were used for the energy calibration at high gamma ray energies. The energy range of interest in our case is about 3.37 MeV in the 10Be frame as it corresponds to the decay of the 2+ state to the GS (see paragraph 4.3) which corresponds to 4.5 MeV in the laboratory frame at very forward angles.
3 TDSE Calculations
During the past decade several approaches have been developed to describe the Coulomb and nuclear breakup at and above the Fermi energy. Among them, the Eikonal approximation, which takes advantage of the high velocity of the projectile, has encountered a large success in particular to interpret recent knock-out reactions (see for instance the recent review han03 ). It is however worth mentioning that the ”towing-mode” which is part of the diffractive dissociation channel mechanism is very specific. Indeed, as noted in ref. esb01 , description and understanding of the ”towing mode” goes beyond calculations within the Eikonal approximation. On opposite, models based on the resolution of TDSE equations lac99 ; esb01 ; typ01 ; kid94 ; esb95 ; mel99 ; typ99 ; mel01 ; cap04 properly account for such a continuum emission. The great advantage of TDSE techniques is to treat non-perturbatively the nucleon emission to the continuum and the interferences between Coulomb and nuclear break-up. On the other hand, TDSE method often neglect interferences due to the mixing of different impact parameters that are generally treated properly in the Eikonal model. Only recently, methods have been developed that combines the advantages of both Eikonal and TDSE framework gol06 .
Here, we restrict ourselves to the simplified situation where a time dependent Schrödinger equation (TDSE) has been solved for a one-nucleon wave function initially in a 10Be core and a comparison with the experimental data will be presented in section 5 to extract spectroscopic factors. In the present section we will briefly describe the calculation and more details can be obtained from ref.lac99 ; fal02 .
The initial wave function of the halo neutron was deduced from the solution of the single-particle Hamiltonian that writes
| (1) |
where the 10Be potential was taken as a Wood-Saxon
| (2) |
where the diffuseness = 0.75 fm and the radius = 1.27.111/3 =2.82 fm. Numerically the initial wave-packet is obtained by diagonalizing the one-body Hamiltonian in spherical coordinates in a sphere of 30 fm radius with a space-step of r = 0.02 fm. The depth was taken to be -46.025 MeV to finally obtain a wave function bound by 0.503 MeV.
The wave function calculated in spherical coordinates for 11Be is then transformed in Cartesian coordinates for the dynamical evolution and an appropriate interpolation is made. Special attention has been given to the purity of the ground state 11Be neutron halo by performing an additional imaginary time evolution on the Cartesian network, after which the state was bound by -0.503 MeV.
The dynamical evolution of the system is given by the following single particle Schrödinger equation;
| (3) |
where and are the target and the projectile time-dependent potentials. The positions and correspond to the target and the projectile respectively.
The nuclear potential of the Ti target is taken to be a Wood-Saxon potential with a diffuseness equal to 0.75 fm, a radius fm (A being the mass number of Ti) and a depth of -41.2 MeV adjusted to obtain the experimental binding energy of the last neutron in a 1f state which is -11.6 MeV. The sensitivity to different parameters of the calculation will be discussed in the following.
In order to take into account the 10Be core displacement, the evolution is performed for each time step using the classical Coulomb trajectory for the center of mass motions from a distance of -400 fm along the initial velocity axis between the projectile and the target and equal to the impact parameter on the perpendicular axis. The Runge Kutta numerical method is applied for the trajectory calculation. The split operator method fei82 is used to solve the time dependent Schrödinger equation with a time step of 1.7 fm/c on a mesh of 64x64x64 (fm3) with a step size of 0.5 fm. This method precludes the inclusion of a spin-orbit term.
The calculation is then performed for several impact parameters with either a sharp cut-off or a weight that corresponds to a survival factor mimicking a probability that the core remains intact during the collision bon99 . This probability writes:
| (4) |
where and fm. For the considered reaction, we have fm. The maximum impact parameter, corresponding to the impact parameter where the fraction of the wave function emitted saturates, is 110 fm in the case of a Ti target. At this impact parameter the fraction of wave function emitted is around 0.04% and only the noise inherent to the numerical method remains. No larger impact parameter is included in the cross section estimate.
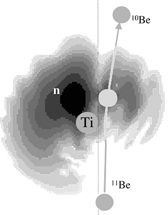
The result of the calculation is presented in Fig.4 as a probability density plot of the neutron for a collision with a Ti target at an impact parameter of 8 fm. We observe that a fraction of the wave function is emitted at large angle. This is what is called the ”towing mode”, already experimentally observed with stable beam jas98 .
Besides the particle emitted to the continuum, the rest of the wave-function either remains in the projectile potential or is transfered to the target. Since in that case, the particle is not emitted, these contributions are removed to compare with the break-up channel measured in the experiment. In practice, this is performed by adding an imaginary part to the target and projectile potentials at the end of the calculation.
4 Experimental results
4.1 Neutron angular distribution in coincidence with 10Be
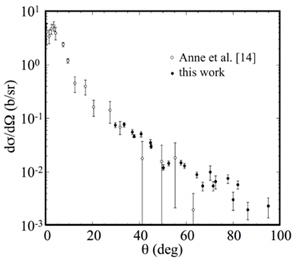
Fig.5 shows the neutron angular distribution in coincidence with 10Be ejectiles and compared to the experimental data of ref.ann94 with the same neutron energy threshold of 26 MeV. The data are corrected for the neutron and the spectrometer detection efficiencies. At neutron angles above 30o, due to the use of a spectrometer that allowed for the removal of the incident beam before the fragment was detected, much higher statistics was gathered allowing for a more precise analysis as will be shown in the following.
4.2 Angular correlation between the 10Be and the neutron
A previous analysis fal02 of the data of ref.ann94 has shown that the large angle neutron emission is mainly due to small impact parameters (b 15 fm) for which the halo wave function is diffracted by the nuclear potential of the target. In such a case, the TDSE calculation predicts that the 10Be and the neutron are preferentially emitted on opposite sides of the beam, giving rise to a specific angular correlation as shown in Fig.6. It shows that when the core is scattered on the right side of the target, most of the neutron wave function is present on the opposite side. In the experiment of ref. ann94 , the angle of 10Be were not measured, precluding the investigation of such correlations.
In this experiment, such a correlation could be extracted since the scattering angle of the ejectile was measured in the SPEG detection system. The experimental neutron angular distributions are shown after efficiency correction in Fig.6 for events where the ejectile and the neutron were detected on opposite sides of the beam axis (black circles, ) and for events where both the ejectile and the neutron were detected on the same side of the beam (empty circles, ). We observe an enhancement of about a factor 4 for the neutron cross section when detected in coincidence with a 10Be on the opposite side of the beam with respect to the same side of the beam. The solid curve results from the calculation for a neutron and a core on opposite sides of the initial 11Be direction arbitrarily normalized to the data points (black circles). The dashed line corresponds to a core and a neutron flying on the same side. Presented calculations were performed for a wave function but other angular momenta show no difference in neither the neutron angular distributions nor the relative asymmetry. The relative normalization of these two curves is given directly by the calculation. In the region between 30o and 50o, where the cross section is large, the calculation reproduces very well the experimental asymmetry. At larger angles the actual asymmetry is slightly smaller than the prediction. Overall the anti-correlation between 10Be and neutrons, which is a very detailed feature of the reaction mechanism, is remarkably well accounted for.
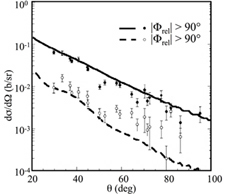
We thus conclude that the break-up mechanism is well understood and described by our dynamical calculation and that the emission of neutrons at large angles is driven by the nuclear interaction of the neutron with the target through the so-called ”towing mode” mechanism.
4.3 Gamma spectrum
In order to access the final states of the 10Be core after the break-up, coincidences were measured with the gamma rays emitted during the reaction. Figure 7 presents the gamma ray spectrum, to which a Doppler correction was applied to account for the velocity of the ejectile, recorded in coincidence with a 10Be. It shows three peaks located around 2.6, 2.9 and 3.4 MeV, which correspond to the known transitions of 10Be shown in the level scheme displayed in the right panel. To estimate the background, a run with a 18O beam was performed and the gamma spectrum extracted in coincidence with a 16N detected in the spectrometer. In this reaction, no gamma rays above 1 MeV are expected. The whole Château de Cristal configuration was described in the GEANT3 code to infer its response to these three observed peaks as well as the direct decay from the 1- state to the GS which gives rise to a gamma ray of 5.96 MeV energy lim04 . A fit was performed including these four components plus the background, with free normalizing factor for each, and reproduces well the experimental spectrum above 1.5 MeV.
The level scheme presented in Fig.7 shows that the gamma ray of the decay from the 2+ state to the GS is part of the cascade of two other decays from the 1- and the 2- states. Therefore, the observation of a 3.37 MeV gamma ray signifies that either we started from a 2+ state with a neutron hence in a 1d state, or we are measuring the decay from the 1- or the 2- states through the 2+ state and the emitted neutron stemmed from the 10Be core, hence from a 1p3/2 or a 1s1/2 state. Therefore, the number of 2+ to gamma rays should be equal to the number of cascades from the 2- and the 1- states plus the number of events feeding directly the 2+ state.
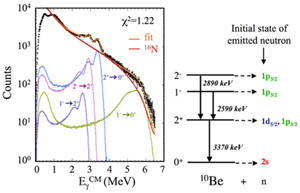
From the fit to the data presented in Fig.7 we extracted that 2/3 of the 3.37 MeV gamma ray were the result of a cascade from the 2- or the 1- state, whereas 1/3 of the total number of 3.37 gamma rays were due to a direct feeding of the 2+ state. This ratio will be used in paragraph 4.5 when analyzing three-fold events.
4.4 Neutron kinetic energy spectra - 2 fold events
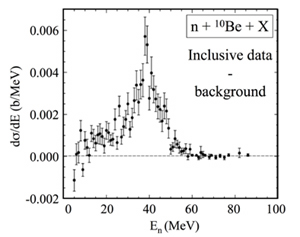
The neutron energy spectrum for two-fold events where a neutron was detected above 30o in the laboratory frame in coincidence with a 10Be (black dots) is presented in Fig.8. It shows a peak centered at about 40 MeV and a contribution at low energy.
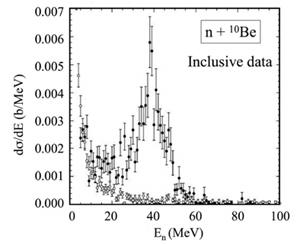
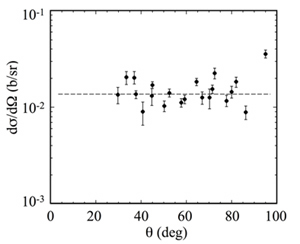
The angular distribution for neutrons above 26 MeV has already been shown in Fig.5 whereas the angular distribution for neutrons below 15 MeV is presented in Fig.9. The latter shows an isotropic behavior in the laboratory frame indicating that these neutrons are not coming from the moving projectile but rather from the target at rest. A way of estimating the shape of the energy spectrum of the neutrons emitted by the target is to extract the neutron spectrum in coincidence with a 11Be detected in the focal plane. Here, apart from a pick-up break-up component which should be very small, one ensures that the detected neutron arises from inelastic excitation followed by decay of the target. This spectrum is presented in Fig.8 (open circles) and exhibits only a low energy neutron component. We now subtract this component from the spectrum of Fig.8 (black dots) and the result is presented in Fig.10. The high energy peak now dominates the spectrum with a small tail extending to lower energies.
4.5 Three-fold events
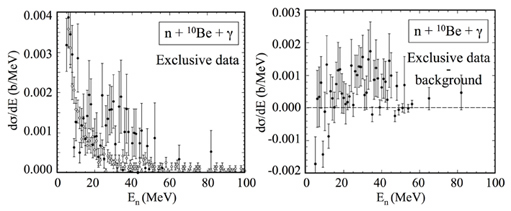
We present on Fig.13 the neutron energy spectrum in coincidence with gamma rays between 1 and 4 MeV. We estimate from the GEANT3 simulation that the efficiency for detecting the decay of the 2+ state is 50% in this energy range. Furthermore, according to paragraph 4.3, 1/3 of the 2+ to the gamma-rays come from direct feeding of the 2+ state. Besides the low energy component, a broad structure is observed, located around 30 MeV. In the same ways as in paragraph 4.4, the subtraction of the neutron component coming from the target (open circle) is then performed and leads to the right panel of Fig.11 where only the 30 MeV structure remains.
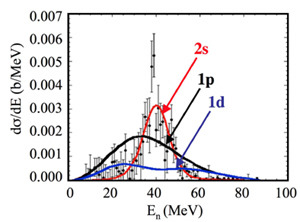
In order now to obtain a neutron energy spectrum for events where no gamma ray was emitted we subtract the three-fold spectrum (Fig.11 right) from the inclusive spectrum of Fig.10. The result is presented in Fig.12 as black dots. For this last subtraction, no normalization was performed as the detection probabilities were taken into account. A peak clearly shows centered about 40 MeV.
5 Comparison with the TDSE calculation and possible extraction of spectroscopic factors
The TDSE calculation was performed for several initial neutron wave functions and results are shown in Fig.12. For the 1d wave function, the 10Be potential is no longer spherical. Indeed, the 2+ state of 10Be corresponds to a deformed state and was found aut70 , through inelastic scattering of protons, to have a deformation parameter . To be able to treat the emission from a deformed core, the TDSE model has been adapted by slowly deforming the core potential during the imaginary time procedure. The iterations are stopped once the deformation corresponds to the value of the core and the imaginary time procedure has converged. The depth of the obtained deformed potential was adjusted to obtain a binding energy of 3.8 MeV, the sum of the 11Be binding energy and the 2+ energy of 10Be. We performed then the time dependent evolution of the calculation with three orientations of the main axis, along X, Y and Z to take into account the random orientation of the nucleus when the collision occurs. The sum of the calculations for the 1d state is shown in Fig.12. TDSE calculations were also performed for the a 1p initial wave functions with a binding energy of 6 MeV and the result is shown in Fig.12. The calculation also predicts that the contribution from a 1s initial wave function is negligible compared to the one of the 1p and is not included in the following analysis.
5.1 Contribution of the orbital
The experimental neutron energy spectrum for which no gamma ray has been emitted is fairly well reproduced by the TDSE calculation performed with the wave function. We clearly see in Fig.12, that the TDSE result is highly sensitive to the initial angular momentum of the wave-function. It is also worth mentioning that the binding energy of the emitting level influences the kinetic energy spectrum. For instance, if the wave-function would have been bound by MeV, the distribution would have been peaked around MeV instead of MeV.
Extraction of spectroscopic factors is performed by comparing experimental absolute cross-sections with calculated ones. Here, arbitrary normalizations were used for the calculations except for the state for which a best fit to the data was performed. The calculation, assuming that a 100% of the neutrons are coming from the state, provides, with the minimization method to best reproduce the data, directly the spectroscopic factor for this state. As we have mentionned in section 3, the choice of the minimal impact parameter can influence the result. If a sharp cut-off at fm is used, the deduced spectroscopic factor is while the prescription of ref. bon99 leading to a smooth cut-off gives a spectroscopic factor of .
5.2 Contribution of the and orbitals
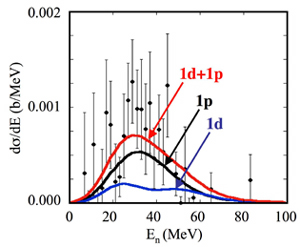
The same comparison was performed for the three-fold events where a gamma ray is emitted. Experimental data are shown in Fig.13. In that case it is clear that the data can not be reproduced by the calculated component which peaks at 40 MeV whereas the data are centered at about 30 MeV. This precludes the two-step process in which a neutron would be emitted together with an excitation of the core in a state as proposed in ref.sum06 . Both the 1p and 1d contributions present a shape similar to the data. However a constraint is that we expect to measure twice as many neutrons coming from the 1p state than from the 1d state. Therefore we fixed this ratio between the two calculations and normalized the weighted sum to best reproduce the data. This is presented in Fig.13 and the respective spectroscopic factors obtained are : and where the quoted errors are purely statistical. Here, for the 1d contribution, we have supposed a sharp cut-off between fm and fm depending on the relative orientation of the nuclei.
5.3 Sensitivity to input parameters on extracted spectroscopic factors for the orbital
While the shape of the distribution is rather insensitive to model parameters, the absolute cross sections appear to be rather sensitive to the inputs of the calculation. A preliminary study of the influence of the parameters can be found in ref. lim04 . Similarly to knock-out han03 or transfer lee06 reactions, parameters should be carefully optimized to be able to infer spectroscopic factors. In Fig.14, we further illustrate the sensitivity of the extracted spectroscopic factor by varying the impact parameter cut-off and target potential depth.
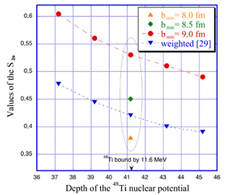
Depending on whether we assume a sharp cut-off in the impact parameter at , and fm or a weighted sum as described in section 3 the spectroscopic factor extracted from the calculation runs from 0.39 to 0.54 for the state when other parameters remain unchanged. We also display in Fig.14 the effect of a change in the target potential depth for the sharp cut-off fm and the weighted case. The deeper the potential, the lower is the extracted value of the spectroscopic factor. However, it should be noted that the prescribed value of MeV is optimal to properly describe the target binding energy and can not be considered as a free parameter.
The sensitivity of the calculation has been further tested with respect to the radius of the Wood-Saxon potential of the nucleus.We used =1.20 instead of 1.27 and reajusted the depth of the potential to obtain a state bound by 0.503 MeV. The extracted spectroscopic factor for bmin=8.5 fm turned out to be 0.47 instead of 0.46.
Finally, we took the nuclear potential used in ref.fal02 that has a surface term according to N.Vinh Mau’s prescription vin95 . In that case we obtained a lower value, 0.42, probably due to the fact that the wave function is on the average positionned more out-side the nucleus core and therefore a larger fraction of it is towed by the nuclear potential.
It is important to note that the present TDSE calculations are made with several approximations. First, a simple Coulomb trajectory for the target and projectile is supposed. Since we are considering here rather small impact parameters, a proper treatment of the nuclear plus Coulomb trajectory is a priori required. However, to see the influence of the trajectory on the result, a straight line trajectory was used and the extracted spectroscopic factor was then 0.48 instead of 0.46. It can then be infered that taking into account a more realistic trajectory, with the Coulomb and the nuclear potentials, would affect only slightly the spectroscopic factors. The second simple approximation made regards the fraction of the neutron wave-function initially in the projectile and transferred to the target. This transfer is actually poorly treated in the current TDSE calculation for two reasons. First, the effect of the Pauli principle is neglected. Second, a proper treatment of this mechanism would also require to add an imaginary potential to the Ti potential. In our model, such an imaginary potential is only added a posteriori to remove the fraction of the transferred wave-function when comparing with experimental data.
6 Discussion
The value of the spectroscopic factor obtained in this paper is plotted in Fig.15 (adapted from ref. pal03 ), and compared with different experimental data and shell model calculations. We see that our result is below the average value of other observations but it should be noted that our error bar is rather large. During the analysis we had to correct for the small acceptance of the spectrometer (see section 2). Due to the shape of the cut-off, this correction brings an error which we can roughly estimate to be between 10 and 20%. This is based on Fig.5 where a comparison is made between the present data and a previous measurement. A rough estimate of the errors on the spectroscopic factor accounting for the acceptance uncertainty, the experimental statistical error and the uncertainty on cut-off in impact parameters leads to a spectroscopic factor equal to .
As discussed in paragraph 5.3, TDSE calculations performed to extract spectroscopic factors are mostly sensitive to the cut-off at low impact parameters. In order to obtain a spectroscopic factor of 0.8 for the state we shall use a sharp cut-off of about 10 fm which seems quite high considering the two nuclei.

The values extracted in the transfer reaction by Fortier et al. for99 (0.84), Windfield et al.win01 with the same data (from 0.67 to 0.8 depending on the optical potential used) and from break-up reactions at relativistic energies of ref. pal03 (0.61(5) or 0.77(12) depending on whether Coulomb or nuclear break-up is selected), show the influence of the experimental method and of the model used to describe the collision. Furthermore a value as low as 0.35 has also been predicted for transfer reactions tim99 when including the recoil excitation and the breakup of 11Be and the variational shell model gives a value of 0.55 for the spectroscopic factor of the state ots93 (see dotted line of Fig.15).
As for the 1d state, the spectroscopic factor found of 0.500.2 is much higher than the value obtained in the transfer reaction of ref.for99 but again close to the value of 0.40 given by the variational shell model ots93 that insists on the indispensable coupling between the two components of the ground state of 11Be to describe correctly the parity inversion of the 1/2- and the 1/2+ states.
7 Conclusion
In this paper we have reported on an experiment studying the break-up of 11Be performed at the GANIL facility. The measurement of the 10Be remnant in coincidence with neutrons emitted at large angles () has allowed to select the nuclear break-up (”towing mode”), and has led, with a comparison to a TDSE calculation, to the extraction of spectroscopic factors for the ground state of 11Be.
A value of is extracted for which a large part of the uncertainty comes from the sensitivity to models parameters and experimental errors (statistics + systematics). We also obtained and where the error bars only come from the experimental statistics.
Cross sections for the nuclear break-up are of the order of several tens of millibarns in the case of weakly bound nuclei such as halo nuclei. If a good knowledge of the minimum impact parameter could be achieved and as clean as possible experimental data are obtained, we believe that this mechanism could be competitive for the study of nuclear spectroscopy of very rare isotopes.
A study of borromean nuclei such as 6He and 14Be through nuclear break-up is currently in progress. In these cases the measurement of both the neutrons of the halo is performed and compared to an appropriate description of the two-neutron wave function with a TDSE calculation, extended in such a way to include the correlation between the neutrons. Information on the two-neutron configuration could then be extracted.
8 Acknowledgments
We are grateful to the Swedish collaboration of the NordBall array and colleagues from Uppsala for providing their neutron detectors.
References
- (1) I.Tanihata et al, Phys. Rev. Lett. 55 (1985) 380.
- (2) P.G.Hansen and B.Jonson, Europhys. Lett. 4 (1987) 409.
- (3) I.Tanihata, J. Phys. G22 (1996) 157.
- (4) F.M.Marquès Moreno, ”École Joliot-Curie de Physique Nucléaire”, Maubuisson (France), sep. 8-14 2002.
- (5) S.Fortier et al., Phys. Lett. B 461(1999) 22.
- (6) Dao T. Khoa and W. von Oertzen, Phys. Lett. B595 (2004) 193.
- (7) R.Palit et al., Phys.Rev. C68, (2003) 034318.
- (8) P.G.Hansen and J.Tostevin, Annu. Rev. Nucl. Part. Sci. 53 (2003) 219.
- (9) E.Sauvan et al Phys. Rev. C 69 (2004) 44603.
- (10) D.Lacroix et al., Nucl. Phys. A 658 (1999) 273.
- (11) H.Esbensen, G.F.Bertsch, Phys. Rev. 64, (2001) 014608.
- (12) T.Kido, K.Yabana, and Y.Suzuki, Phys. Rev. C 50, (1994) R1276, ibid Phys. Rev. C 53, (1996) 2296.
- (13) S.Typel and R.Shyam, Phys. Rev. C 64, (2001) 024605.
- (14) R.Anne et al., Nucl. Phys. A575 (1994) 125.
- (15) T.Aumann et al., Phys. Rev. Lett. 84 (2000) 35.
- (16) N.Fukuda et al., Phys. Rev. C 70, (2004) 054606.
- (17) M.Fallot, J.A.Scarpaci, D.Lacroix, Ph.Chomaz and J.Margueron, Nucl. Phys. A700 (2002) 70.
- (18) J.A.Scarpaci et al., Phys. Lett. B (1998) 241.
- (19) L.Bianchi et al., Nucl. Instrum. Methods Phys. Res. A 276, (1989) 509.
- (20) S.E.Arnell, Nucl. Instr. and Meth. A300, (1991) 303.
- (21) M.J.López-Jiménez, Ph.D. thesis, University of Caen 2000.
- (22) H. Esbensen, G. F. Bertsch, and C. A. Bertulani, Nucl. Phys. A581, (1995) 107.
- (23) V.S. Melezhik and D. Baye, Phys. Rev. C 59, (1999) 3232.
- (24) S. Typel and H. H. Wolter, Z. Naturforsch., A: Phys. Sci. 54a, (1999) 63.
- (25) V. S. Melezhik and D. Baye, Phys. Rev. C 64, (2001) 054612.
- (26) P. Capel, G. Goldstein, and D. Baye, Phys. Rev. C 70, (2004) 064605.
- (27) G. Goldstein, P. Capel and D. Baye, Phys. Rev. C 73, (2006) 024602.
- (28) M.D.Feit, J.Fleck, Jr. and A.Steiger, J. Comput. Phys. (1982) 412.
- (29) A.Bonaccorso et al., Phys. Rev. C, 60 (1999) 54604.
- (30) V.Lima, Ph.D. thesis, university of Paris XI, IPNO-T-04-16 (2004), web address http://www.tel.ccsd.cnrs.fr/
- (31) D.L.Auton, Nucl. Phys. A157, (1970) 305.
- (32) N. C. Summers, F. M. Nunes, and I. J. Thompson, Phys. Rev. C 74, (2006) 014606.
- (33) J. Lee et al, Phys. Rev. C 73 (2006) 044608.
- (34) N.Vinh Mau, Nucl. Phys. A 592 (1995) 33.
- (35) B. Zwieglinski, W. Benenson, R.G.H. Robertson, and W.R. Coker, Nucl. Phys. A315 (1979) 124.
- (36) N.K.Timofeyuk and R.C. Johnson, Phys.Rev. C59 (1999) 1545.
- (37) J.S. Winfield et al, Nucl. Phys. A683 (2001) 48.
- (38) S.K. Charagi and S.K. Gupta, Phys. Rev. C 41 (1989) 1610.
- (39) T. Nakamura et al., Phys. Lett. B 331 (1994) 296.
- (40) A. Mengoni et al., in Proceedings of the International Symposium on Capture Gamma-ray and Related Topics, edited by G. L. Molnar, T. Belgya, and Zs. Revay, (Springer, Berlin, 1997), p. 416.
- (41) T.Otsuka, N.Fukunishi and H.Sagawa, Phys. Rev. Lett. 70 (1993) 1385.
- (42) A. Brown, Prog. Part. Nucl. Phys. 47 (2001) 517.