On the nature of the X-ray absorbers: II. The contrast between local and AGN host galaxy absorption
Abstract
We search for highly–ionized gas near three AGN host galaxies using the Chandra low–energy transmission grating spectrograph. Strong absorption lines from such gas are seen at , most likely from one or more of the following components: (1) a Galactic corona, (2) the Local Group medium, and (3) an extended warm–hot intergalactic medium (WHIM) filament passing through our local overdensity. Since AGNs reside within host galaxies that are also expected to sit within cosmically overdense regions, similar absorption resulting from these three components should appear at the AGN redshifts as well. However, no such absorption is seen. The lack of strong absorption lines is likely a result of the gas in these host galaxies and surrounding galaxy clusters being much hotter, and hence more highly ionized, than the gas in the Local GroupGalaxy system. We conclude that WHIM filaments produce no measurable absorption lines at the AGN redshifts, and therefore contribute at most a small fraction of the observed warm–hot gas.
Subject headings:
Galaxy: general — intergalactic medium — Local Group — X–rays: galaxies1. Introduction
The study of local warm–hot gas has been revolutionized by the advent of sensitive space–based observatories such as Chandra, XMM–Newton, and the Far Ultraviolet Spectroscopic Observer (FUSE). By taking spectra of bright background quasars, absorption lines from highly–ionized heavy elements at can be seen in nearly all directions in both the X–ray (Nicastro et al., 2002; Williams et al., 2005, 2006b, 2007) and far–UV (Wakker et al., 2003). These lines are thought to trace a variety of mass components; while strong, broad O VI absorption is associated with the Galactic thick disk (Savage et al., 2003), high–velocity O VI clouds more likely reside in the extended Galactic halo, with a subpopulation of these showing evidence of extragalactic (Local Group) kinematics (Sembach et al., 2003; Nicastro et al., 2003). More enigmatic still are the X–ray absorbers, which exhibit kinematics and column densities inconsistent with both the low– and high–velocity O VI absorbers (e.g., Williams et al., 2005). Whether these absorbers arise primarily from a Galactic or an extragalactic medium is still a matter of debate.
In the “extragalactic” picture, the local X–ray absorption arises primarily from the intragroup medium filling the Local Group (analogous to the extended X–ray emitting gas seen in massive galaxy clusters), or from the larger–scale IGM filament(s) connecting the overdensities traced by the Local Group and nearby structures such as the Virgo cluster (Kravtsov et al., 2002). Such structure, containing most of the baryonic mass at low redshifts, is now a generic prediction of cosmological simulations and has come to be known as the warm–hot intergalactic medium (WHIM; Cen & Ostriker, 1999; Davé et al., 2001). On the other hand, much of the local X–ray absorption may also be within a few tens of kpc, resulting from a hot Galactic corona or fountain driven by supernova winds (Sembach, 2003; Collins et al., 2005; Wang et al., 2005).
In a companion paper to this one (Mathur et al., 2007), we propose that the X–ray absorption lines seen at are likely to contain contributions from both Galactic and intra–Local Group media. Additional contributions could come from the local large–scale intergalactic filament, and perhaps a supernova remnant lying near the occasional line of sight (e.g., 3C 273; Savage et al., 1993). All of these components would apparently be blended into a single line within Chandra’s km s-1 resolution. While it appears that poor groups of galaxies similar to our own can produce the observed O VII column densities (Mathur et al., 2007), the relative contributions from Galactic and extragalactic phenomena in our own Local Group are as yet undetermined.
The intervening WHIM lines found by Nicastro et al. (2005) are quite weak relative to the local absorption; indeed, intervening absorption systems of comparable column density have yet to be discovered. Thus, the strength of the absorption is doubtless related to our peering out from a “special” vantage point centered on a dense region — in the disk of a spiral galaxy within a poor galaxy group. However, inherent to every quasar spectrum is one other such special location: the AGN host galaxy. As AGNs typically occur at the centers of massive galaxies, some within groups and clusters, large column densities of warm–hot gas should also be present at the quasar redshifts as at . These components could include intra– and intergalactic gas surrounding the host galaxy, plus gas directly related to the accretion process (such as a warm absorber or outflow). In other words, if the Galaxy is a typical (non–AGN) system, absorption column densities near AGN host galaxies should be at least as strong as those observed locally, and significant discrepancies (vis–à–vis differences between the host galaxies’ and the Milky Way’s systems) can provide clues to the nature of the local absorption. In this Letter we search for absorption lines at the redshifts of three AGNs observed with the Chandra grating spectrograph, and contrast these with the absorption lines seen at in the same spectra.
| Object | aaAll equivalent widths are quoted in mÅ with errors; upper limits are confidence. | aaAll equivalent widths are quoted in mÅ with errors; upper limits are confidence. | aaAll equivalent widths are quoted in mÅ with errors; upper limits are confidence. | aaAll equivalent widths are quoted in mÅ with errors; upper limits are confidence. | aaAll equivalent widths are quoted in mÅ with errors; upper limits are confidence. | aaAll equivalent widths are quoted in mÅ with errors; upper limits are confidence. | |
|---|---|---|---|---|---|---|---|
| Ne X | Ne IX | O VIII | O VII | C VI | C V | ||
| 12.13 Å | 13.45 Å | 18.97 Å | 21.60 Å | 33.74 Å | 40.27 Å | ||
| Local | |||||||
| Mrk 421 | 0 | ||||||
| PKS 2155–304 | 0 | ||||||
| 3C 273 | 0 | ||||||
| Mrk 279bbRedshifted absorption lines are not measured for this object, due to absorption from a strong AGN outflow. | 0 | ||||||
| Host galaxies | |||||||
| Mrk 421 | 0.030 | ||||||
| PKS 2155–304 | 0.116 | ||||||
| 3C 273 | 0.158 |
2. Data Reduction and Measurements
In this analysis we focus on data from the Chandra Low–Energy Transmission Grating (LETG) coupled with its two standard readout detectors, the High Resolution Camera and AXAF CCD Imaging Spectrometer spectroscopic arrays (HRC–S and ACIS–S respectively). While the XMM–Newton Reflection Grating Spectrometers (RGS1/RGS2) together have comparable sensitivity to the Chandra LETG, the RGS contains many narrow detector features and a more restricted wavelength range (Williams et al., 2006a). Furthermore, there is evidence for significant cross–calibration uncertainties between XMM/RGS and Chandra/LETG (Rasmussen et al., 2007); thus, for the sake of consistency we will focus solely on the Chandra data for this analysis.
Local () absorption has been confidently detected by Chandra in four local AGN sight lines: Mrk 421 (Williams et al., 2005), Mrk 279 (Williams et al., 2006b), PKS 2155–304 (Nicastro et al., 2002; Williams et al., 2007), and 3C 273 (Fang et al., 2003). The far–UV and X–ray spectra of Mrk 279 indicate the presence of strong intrinsic absorption from an AGN outflow (Fields et al., 2007); thus, only the absorption seen in this spectrum will be considered in this analysis All Chandra/LETG observations of these four sources employing the ACIS–S and HRC–S readout detectors were downloaded from the Chandra archive and fully re–reduced with CIAO 4.0b1111http://cxc.harvard.edu/ciao/. Zeroth–order source positions were checked by eye and corrected if necessary, and grating spectra and response files for all observations generated. The spectra from positive and negative grating orders were added for each observation, and all observations for the same object subsequently added. Response files for the positive and negative ACIS–S orders, and from orders through for HRC–S222This is necessary to properly account for contamination from unresolved higher spectral orders; see http://cxc.harvard.edu/ciao/threads/hrcsletg_orders/, were similarly combined to produce average ACIS and HRC instrumental response functions for each object.
Spectral continua and absorption lines were modeled with the fitting program Sherpa333http://cxc.harvard.edu/sherpa/. A single powerlaw plus Galactic absorption model was initially fit to each spectrum over the 10–50 Å range to properly determine the level of higher–order contamination in HRC–S. Individual lines were fitted with negative Gaussians in Å windows around each wavelength of interest, retaining the continuum shape found with the broadband fit but allowing the amplitude to vary. Any residual broad features in the spectra (much larger than the LETG line–spread function width, mÅ) were removed by including broad Gaussian components. The continua were allowed to vary independently for HRC–S and ACIS–S to allow for flux variations between the different observation epochs, while absorption line amplitudes were determined using a joint fit to both instrumental spectra. Upper limits (at the /95% confidence level) were determined by allowing the line wavelength to vary within Å of the expected central wavelength to take into account the systematic uncertainty in the LETG dispersion relation.444See http://cxc.harvard.edu/cal/
At the AGN redshifts, we measured six absorption lines that were detected in the Mrk 421 spectrum at , and are expected to peak in abundance over a range of temperatures spanning roughly a factor of ten under collisional ionization: K (O VIII, Ne X), K (O VII, C VI, Ne IX) and K (C V). Although this latter temperature is expected to occur in galactic interstellar media (e.g., as observed in the thick disk of the Galaxy through strong O VI absorbers with FUSE; Savage et al., 2003), it may provide a useful indicator of whether the AGN host galaxies contain similar warm–hot gas column densities as the Galaxy but at lower temperatures. To ensure that consistent reduction methods and calibrations are used throughout, we re–measured the strengths of the same absorption lines at using the same broadband continuum fits. Table 1 shows the strengths (or upper limits) for all measured local and redshifted absorption lines.
As the table shows, at the AGN redshifts none of these absorption lines are formally detected at a significance larger than ; indeed, visual inspection of the spectra confirms the absence of any apparent absorption at or near the AGN. Note that Rasmussen et al. (2007) find a weak ( mÅ), O VII line at significance with XMM; however, this is not seen in the Chandra spectrum and may be a O V line near the same wavelength. Figure 1 shows the continuum fit residuals for O VIII, O VII, and C V in the highest–quality spectrum (Mrk 421). Though absorption in all three atomic species is detected at , none is seen at . Furthermore, these three lines can be present at temperatures ranging from K; if the Mrk 421 host galaxy contained gas at a column density comparable to that observed at but with a somewhat higher or lower temperature, the strength of the O VIII or C V line should be boosted respectively. However, this is clearly not the case.
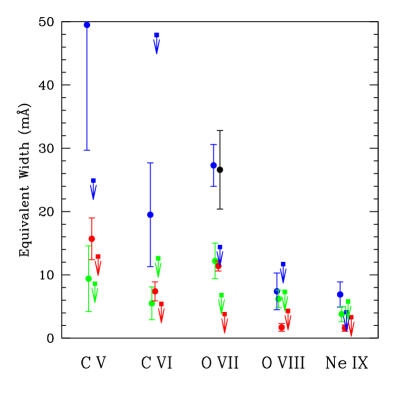
A visual representation of the data in Table 1 is shown in Figure 2. The discrepancy is most evident for O VII: most of the upper limits at the AGN redshifts are inconsistent with the typical local absorption strength. Even for the other four lines shown in this figure, the upper limits are nonetheless below or comparable to the measurements. It is thus apparent that the gaseous environments of the AGN host galaxies are in fact dramatically different from that around the Galaxy.
3. AGN host galaxy properties
Since strong O VII absorption ( mÅ in all cases) is seen toward AGNs anytime sufficient S/N is acquired, it is unlikely that the lack of observed host galaxy absorption is a result of a low O VII covering fraction. Instead, this discrepancy must be due to fundamental differences between the Milky Way and host galaxy systems themselves. A summary of the three host galaxy systems follows.
3.1. Mrk 421 and PKS 2155–304
As the two highest signal–to–noise spectra, the absence of absorption at the redshifts of Mrk 421 and PKS 2155–304 is particularly striking. Not only do both of these spectra exhibit strong similarities in their absorption properties (consistent column densities, Doppler parameters, and temperature constraints), but the AGN environments are also remarkably similar. Both are BL Lac objects contained within giant elliptical host galaxies (Ulrich et al., 1975; Kikuchi & Mikami, 1985; Falomo et al., 1991). Such galaxies are known to contain large quantities of hot gas from X–ray emission studies (e.g., Brighenti & Mathews, 1997), with the most massive ellipticals exhibiting gas temperatures of K. At this temperature oxygen is expected to be fully ionized. The nuclei of both these galaxies are powerful blazars; thus, intense X–ray flux from the central source may further contribute to the ionization of gas in the central regions of the galaxy, and jets or outflows from the AGN might evacuate galactic gas from the line of sight. Furthermore, these host galaxies reside at the centers of clusters (Ulrich, 1978; Falomo et al., 1993). Since the intracluster media within massive galaxy clusters typically exhibit similarly high temperatures ( K), this cluster environment is unlikely to produce strong absorption lines.
3.2. 3C 273
The host galaxy of 3C 273 was studied extensively with the HST Advanced Camera for Surveys (ACS) coronagraph by Martel et al. (2003). They find a morphology similar to an early–type galaxy (dominated by an extended stellar halo at large radii), but also evidence for spiral structure and a possible recent major merger in the central region. Although the existence of a spiral and/or merger morphology might increase the likelihood of seeing strong absorption (due to higher star formation rates than in giant ellipticals, and hence more supernova remnants and “galactic fountain” activity), it may be that the fully ionized hot gas in the outer regions dominates the total column density. Furthermore, 3C 273 is not known to be a member of a group or cluster, in which case we don’t expect to see a contribution from the surrounding intragroup medium like at .
In any case, the comparatively low sensitivity of this spectrum ( upper limit of mÅ on redshifted O VII) is the primary limitation to detecting absorption near the host galaxy. Only two of the four systems show O VII absorption stronger than the upper limit found for the host galaxy, so it is perhaps not surprising that no redshifted absorption is seen here.
4. Discussion and Conclusions
We searched for absorption near AGN host galaxies in the three highest–quality Chandra/LETG AGN spectra, but none could be seen within the sensitivity of our observations. This is in stark contrast to , where absorption of (O VII) mÅ is seen in all directions whenever enough signal is accumulated. Given this discrepancy, and by comparing the characteristics of the AGN host galaxy systems with the GalaxyLocal Group system, we propose three likely contributing factors:
-
1.
The host galaxies reside in high–mass, and thus very high–temperature systems. Mrk 421, PKS 2155–304, and possibly 3C 273 are hosted by massive ellipticals; the former two are also at the centers of rich galaxy groups or clusters. Although both massive ellipticals and clusters contain large amounts of hot gas, at K even the heavier elements analyzed herein are fully ionized. On the other hand, the Local Group is a relatively low–mass system and the measured gas temperatures at ( K) are in a range that maximizes the abundances of ions easily measured by Chandra.
-
2.
The IGM filaments surrounding the Local Group and host galaxies contribute negligibly to the total absorption. The extended intergalactic medium filaments surrounding the AGN host galaxies should in principle be similar to that around our own Local Group, and at sufficient distance to be essentially unaffected by the galaxy and/or AGN. Thus, given the ubiquity of absorption lines at , any “local filament” contribution to these lines should also be visible around most AGN as well. Since it is in fact not visible, we conclude that large–scale filamentary IGM structures are not an important contributor to the X–ray absorption. This is consistent with the weakness of the absorption seen in the intervening WHIM filaments reported by Nicastro et al. (2005). However, it stands in conflict with the marginal detection of X-ray absorption (also presumably from a surrounding WHIM filament) toward the Coma cluster in a shallower XMM spectrum by Takei et al. (2007).
-
3.
Lack of star–formation activity in the host galaxies. As supernovae are known to produce large “bubbles” of hot gas, it stands to reason that an occasional AGN sight line will pass near enough to one of these supernova remnants to exhibit strong X–ray absorption. This is likely the cause of the strong absorption seen locally toward 3C 273 (Savage et al., 1993). Not only is the sample size here relatively small, thereby lowering the chance probability of a sight line intercepting a SNR in one of these host galaxies (unless the average SNR covering fraction is very large), but the host galaxies of these AGN are early–type galaxies and hence contain very little star formation, further decreasing the likelihood of a sight line intersecting a SNR.
It thus appears that X–ray absorption line strengths are primarily sensitive to galactic and cluster/group properties, and that the systems that typically host bright AGNs (massive ellipticals in high–density environments) are not conducive to producing absorption like that seen at . In this case, the Milky Way and Local Group may present a nearly–ideal system for the production of strong absorption: a spiral galaxy with sufficient star formation to produce some ionized gas in the corona, and a low–mass galaxy group that contains a large column density of intra–group medium at K (but not so massive that this medium is fully ionized). Indeed, even slightly larger galaxy groups may already be too hot: the poor group of galaxies (containing four H I galaxies; Shull et al., 1998) at toward PKS 2155–304 appears to produce only weak O VIII absorption (Fang et al., 2002, 2007), indicating that the oxygen in this system is nearly fully–ionized.
Of course, at this point the above explanation for this discrepancy is mostly speculative; quantitative constraints can only be placed with many more high–S/N X–ray spectra. The sightlines analyzed herein were chosen solely on the basis of their being the highest–quality extragalactic Chandra grating spectra available. Naturally, a search for X–ray absorption in a massive spiral galaxy hosting a Seyfert–like AGN (or in a quasar sight line passing close to an intervening spiral) would provide a far more direct comparison to our local system, but strong AGN outflows from the brightest known Seyferts (e.g., NGC 3783; Kaspi et al., 2002) hinder the detectability of galactic and intergalactic gas. A similar analysis of the far–UV O VI line with FUSE is currently in progress, but this line is expected to trace cooler ( K) gas. To place stronger constraints on the origin of local warm–hot gas, soft X–ray spectrometers with both large effective areas and high velocity resolution ( km s-1) will be critical to distinguish between Galactic and extragalactic absorption at and in AGN hosts. Forthcoming missions such as Constellation–X and XEUS will be able to make great advances in this field.
References
- Brighenti & Mathews (1997) Brighenti, F. & Mathews, W. G. 1997, ApJ, 486, L83
- Cen & Ostriker (1999) Cen, R., & Ostriker, J. P. 1999, ApJ, 514, 1
- Collins et al. (2005) Collins, J. A., Shull, J. M., & Giroux, M. L. 2005, ApJ, 623, 196
- Davé et al. (2001) Davé, R., et al. 2001, ApJ, 552, 473
- Falomo et al. (1991) Falomo, R., Giraud, E., Melnick, J., Maraschi, L., Tanzi, E. G., & Treves, A. 1991, ApJ, 380, L67
- Falomo et al. (1993) Falomo, R., Pesce, J. E., & Treves, A. 1993, ApJ, 411, L63
- Fang et al. (2002) Fang, T.-T., Marshall, H. L., Lee, J. C., Davis, D. S., & Canizares, C. R. 2002, ApJ, 572, L127
- Fang et al. (2003) Fang, T.-T., Sembach, K. R., & Canizares, C. R. 2003, ApJ, 586, L49
- Fang et al. (2007) Fang, T.-T., Canizares, C. R., & Yao, Y. 2007, ApJ, in press (arXiv:0708.1800)
- Fields et al. (2007) Fields, D. L., Mathur, S., Krongold, Y., Williams, R., & Nicastro, F. 2007, ApJ, 666, 828
- Kaspi et al. (2002) Kaspi, S., et al. 2002, ApJ, 574, 643
- Kikuchi & Mikami (1985) Kikuchi, S. & Yoshitaka, M. 1985, PASJ, 39, 237
- Kravtsov et al. (2002) Kravtsov, A. V., Klypin, A., & Hoffman, Y. 2002, ApJ, 571, 563
- Martel et al. (2003) Martel, A. R., et al. 2003, AJ, 125, 2964
- Mathur et al. (2007) Mathur, S., et al. 2007, ApJL, Submitted (arXiv:0709.2870)
- Nicastro et al. (2002) Nicastro, F., et al. 2002, ApJ, 573, 157
- Nicastro et al. (2003) Nicastro, F., et al. 2003, Nature, 421, 719
- Nicastro et al. (2005) Nicastro, F., et al. 2005, ApJ, 629, 700
- Rasmussen et al. (2007) Rasmussen, A. P., Kahn, S. M., Paerels, F., den Herder, J. W., Kaastra, J., & de Vries, C. 2007, ApJ, 656, 129
- Savage et al. (1993) Savage, B. D., Lu, L., Weymann, R. J., Morris, S. L., & Gilliland, R. L. 1993, ApJ, 404, 124
- Savage et al. (2003) Savage, B. D., et al. 2003, ApJS, 146, 125
- Sembach et al. (2003) Sembach, K. R., et al. 2003, ApJS, 146, 165
- Sembach (2003) Sembach, K. R. 2003, preprint (arXiv:astro-ph/0311089)
- Shull et al. (1998) Shull, J. M., Penton, S. V., Stocke, J. T., Giroux, M. L., van Gorkom, J. H., Lee, Y. H., & Carilli, C. 1998, AJ, 116, 2094
- Takei et al. (2007) Takei, Y., Henry, J. P., Finuguenov, A., Mitsuda, K., Tamura, T., Fujimoto, R., & Briel, U. G. 2007, ApJ, 655, 831
- Ulrich et al. (1975) Ulrich, M.-H., Kinman, T. D., Lynds, C. R., Rieke, G. H., & Ekers, R. D. 1975, ApJ, 198, 261
- Ulrich (1978) Ulrich, M.-H. 1978, ApJ, 222, L3
- Wakker et al. (2003) Wakker, B. P., et al. 2003, ApJS, 146, 1
- Wang et al. (2005) Wang, Q. D., et al. 2005, ApJ, 635, 386
- Williams et al. (2005) Williams, R. J., et al. 2005, ApJ, 631, 856
- Williams et al. (2006a) Williams, R. J., Mathur, S., Nicastro, F., & Elvis, M. 2006a, ApJ, 642, L95
- Williams et al. (2006b) Williams, R. J., Mathur, S., & Nicastro, F. 2006b, ApJ, 645, 179
- Williams et al. (2007) Williams, R. J., Mathur, S., Nicastro, F., & Elvis, M. 2007, ApJ, 665, 247