The ACS Survey of Galactic Globular Clusters. III. The Double Subgiant Branch of NGC 1851††thanks: Based on observations with the NASA/ESA Hubble Space Telescope under the programs GO-10775 and GO-5696, obtained at the Space Telescope Science Institute, which is operated by AURA, Inc., under NASA contract NAS 5-26555.
Abstract
Photometry with HST’s ACS reveals that the subgiant branch (SGB) of the globular cluster NGC 1851 splits into two well-defined branches. If the split is due only to an age effect, the two SGBs would imply two star formation episodes separated by 1 Gyr. We discuss other anomalies in NGC 1851 which could be interpreted in terms of a double stellar population. Finally, we compare the case of NGC 1851 with the other two globulars known to host multiple stellar populations, and show that all three clusters differ in several important respects.
1 Introduction
For many decades, globular clusters (GC) have been considered the simplest possible stellar populations, made up of stars located at the same distance, formed at the same epoch and from the same material. Although anomalies had been noted from time to time in the abundances of a number of individual elements (see discussion in Gratton, Sneden, & Carretta 2004), the description of populations in terms of a helium abundance and an overall heavy-element abundance seemed firm. The “second-parameter problem” has continued to be a pain for many decades, and unusual HB morphologies were turning up more often, but the implications for the origin and evolution of GC stars remained ambiguous. Similarly, theoreticians had predicted that self-enrichment (Cotrell & Da Costa 1981, Ventura et al. 2001, Ventura & D’Antona 2005, Maeder & Meynet 2005) or mergers might generate multiple populations in clusters, but such predictions remained controversial (see, e.g., Fenner et al. 2004, Bekki & Norris 2006), and had little observational basis. Most important for our discussion here, the idea of one clear sequence in each part of the HR diagram of each cluster stood firm.
Now, however, the paradigm of GC hosting simple stellar populations has been seriously challenged by the discovery of multiple evolutionary sequences in Centauri (Bedin et al. 2004) and NGC 2808 (Piotto et al. 2007, P07). In both clusters the evidence that stars must have formed in distinct bursts is the presence of multiple main sequences (MSs). However, the two objects differ in at least two important aspects: The stars of Cen have a large spread in metal content, whereas in NGC 2808 only oxygen and sodium are observed to vary much. Omega Cen shows at least four distinct subgiant branches (SGBs), implying a range of ages, while the narrow turnoff in NGC 2808 implies that there is little or no difference in age among its populations. One more cluster, M54, shows a complex color-magnitude diagram (see, e.g., Layden & Sarajedini 2000), including a bifurcated SGB (see paper IV of this series, Siegel et al. 2007). This cluster has been shown, however, in too many papers to cite here, to be a part of the Sagittarius dwarf galaxy that is in process of merging into the Milky Way, and very possibly the actual nucleus of that galaxy. (Actually, it is still matter of debate which parts of the color-magnitude diagram of M54 represent the cluster population and which ones are due to the Sagittarius stars.) Even though Cen could very well represent a similar situation, we feel that M54 is very different from the clusters that we discuss here, and we will therefore not include it in the discussions of this paper.
The puzzling observational facts for Cen and NGC 2808 call for a more careful analysis of the MS, turnoff (TO), and subgiant branch of other GCs. In this respect, the color-magnitude diagram (CMD) database from the HST Treasury program GO-10755 (see Sarajedini et al. 2007) provides a unique opportunity to search for anomalies in the different evolutionary sequences of other Galactic GCs. Even though the narrow F606W F814W color baseline is far from ideal for identifying multiple main sequences, our observing strategy was devised to have a very high signal/noise ratio at the level of the TO, and therefore the CMDs are perfectly suitable for identifying multiple TO/SGBs, such as those as found in Cen. (New HST observations specifically devoted to the identification of multiple MSs are already planned for other massive GCs, in GO-10922 and GO-11233.)
Indeed, a first look at the entire Treasury database showed at least one other GC whose CMD clearly indicates the presence of multiple stellar populations: NGC 1851. Although NGC 1851 is a massive GC with a prototypical bimodal horizontal branch (HB), not much attention has been devoted to the study of its stellar population. The most complete photometric investigation of this cluster is by Saviane et al. (1998), and the most extended spectroscopic analysis was done over 25 years ago, by Hesser et al. (1982). Saviane et al. (1998) confirmed the bimodal nature of the HB of NGC 1851, but did not find any other anomaly in its CMD. Hesser et al. (1982) found that three out of eight bright red giant branch (RGB) stars have extremely strong CN bands.
The present paper is based on new photometry of NGC 1851, from HST/ACS imaging and from archival WFPC2 images. Section 2 describes the data sets, and § 3 presents the color-magnitude diagram from the ACS data, with a split in the subgiant branch clearly visible. In § 4 we use the WFPC2 data, both for proper-motion elimination of field stars and to construct a CMD with a broader wavelength baseline which we use to set a severe upper limit on any spread in the main sequence. Section 5 discusses the properties of the SGB and of the horizontal branch, and shows that the two parts of each have the same spatial distribution. Section 6 considers the ages of the two populations, and § 7 is a discussion and summary.
2 Observations and Measurements
The main database used in this paper comes from HST ACS/WFC images in the F606W and F814W bands, taken for GO-10775 (P.I. Sarajedini). In addition, we use HST WFPC2 archive data from GO-05696 (P.I. Bohlin) to extend the wavelength range to the blue, as well as to obtain proper motions. The data sets are summarized in Table 1.
| DATE | EXPOSURES | FILT | PROGRAM |
| WFPC2 | |||
| April 10, 1996 | 4900s | F336W | 5696 |
| ACS/WFC | |||
| July 1, 2006 | 20s5350s | F606W | 10775 |
| July 1, 2006 | 20s5350s | F814W | 10775 |
The photometric and astrometric measurements were made for both WFPC2 and ACS using the algorithms described by Anderson & King (2000, 2006). Each image was reduced independently, with the observations averaged to produce a single flux for each star in each filter. We put the WFC photometry into the Vega-mag system following the procedures in Bedin et al. (2005) and adopting the encircled energy and zero points as given by Sirianni et al. (2005). WFPC2 data were photometrically calibrated following Holtzman et al. (1995). The proper motions were derived as in Bedin et al. (2006).
Breathing can change the focus of the telescope, which can result in small spatial variations of the PSF relative to the library PSF, and consequently in small spatial variations of the photometric zero point. In order to deal with any residual PSF variation, we used a method similar to the one described in Sarajedini et al. (2007) to perform a spatial fit to the color residuals relative to the main-sequence ridge line, and remove them. In this case, however, the corrections were made only to colors, rather than along a reddening line, because, as noted in Section 3, the reddening of NGC 1851 is so small that what we are correcting is surely differences between the spatial variations of the PSF in the two filters, rather than differential reddening. The spatially dependent correction was at the level of 0.01 magnitude, and merely sharpens the sequences a little.
3 The ACS/WFC Color-Magnitude Diagram

In Figure 1 we show the color-magnitude diagram for the ACS/WFC photometry. The left panel shows the original CMD. The main result is already evident: the subgiant branch (SGB) is split into two distinct branches. The right panel shows the CMD after the correction for the spatial variation of the color zero point. The SGB split is still there, and there are clearly two sequences down to the cluster TO. No separation is evident in the main sequence. It must be immediately noted that because of the narrowness of MS below the TO, the SGB broadness can be due neither to any residual spatial variation of the zero point nor to any differential reddening, which is expected to be negligible because of the low reddening of NGC 1851 [, Harris 1996].
The two SGBs remain separated by mag in the magnitude interval , over the color interval . Hereafter we will refer to the two SGBs as bSGB and fSGB, where b stands for brighter and f stands for fainter.
Omega Cen and NGC 2808 also show evidence of multiple populations, but we note that the split in the SGB of NGC 1851 is quite different from what we found in the former two cases. In NGC 2808, the main sequence splits into three distinct sequences a couple of magnitudes below the turnoff, but the SGB shows no evidence of splitting. In Omega Cen, both the SGB and the MS show evidence of splitting. Here, it is only the SGB that is split. We will see that the main sequence of NGC1851 appears consistent with a single population.
4 The WFPC2 Data
4.1 Proper motions for field decontamination
We used the archival WFPC2 images as a first epoch to determine proper motions. WFPC2 has a field of view that is only 50% of the ACS field, and the crowding prevented us from measuring good WFPC2 positions for stars within 500 ACS/WFC pixels of the cluster center. This somewhat reduces the size of our sample.
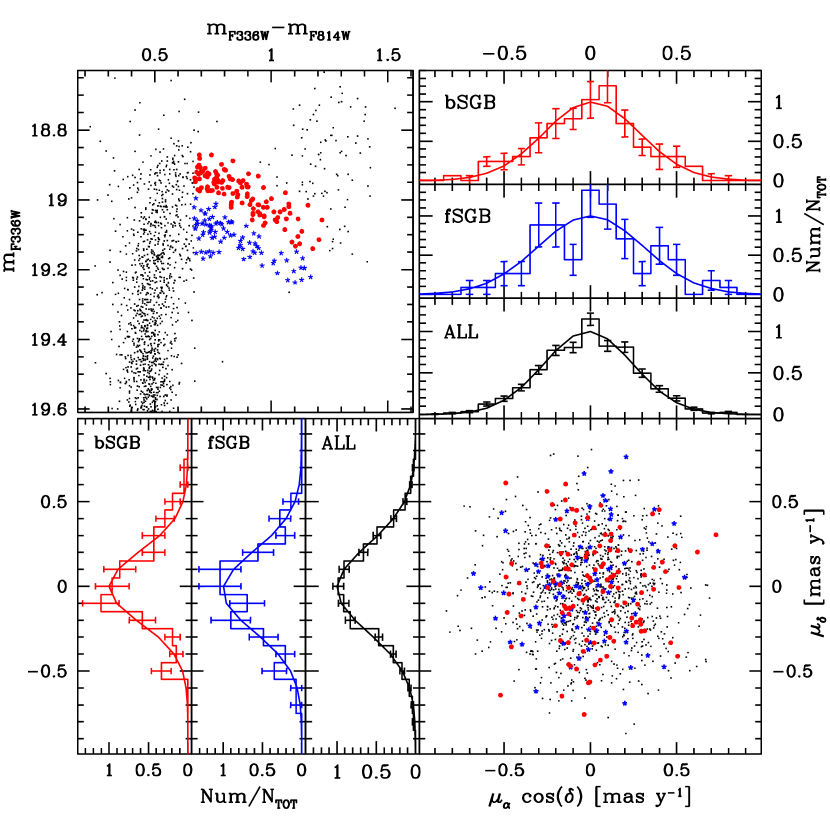
In the left panel of Fig. 2 we show the CMD, using the F336W magnitudes from the WFPC2 images and the F814W magnitudes from the ACS images. The second column of panels shows the proper-motion diagrams of the stars for four different magnitude intervals. It should be noted that we measure proper motions relative to a reference frame made up of only cluster members, so that the zero point of our motions is the mean motion of the cluster. In the third column the magnitudes of the proper motion vectors are plotted against stellar magnitude. The errors clearly increase toward fainter magnitudes. The line was drawn in order to isolate the stars that have member-like motions, and was derived as follows. First, we note that in our study of SGB stars it is more important to have a pure cluster sample than a complete one, so we make a conservative choice. Taking each interval of 1 magnitude in F336W, we begin by estimating the sigma of the member-like motions. To do this we find the size of proper motion that includes 70% of the stars; for a bivariate Gaussian this radius should lie at , where refers to each dimension. We then plot a point at , which is the size that should include 95% of the cluster stars. We use spline interpolation to draw a line through these points, and choose all the stars to the left of the line. By giving up 5% of the cluster stars we effectively exclude nearly all of the field stars. The rightmost panel shows the CMD of our chosen cluster stars.
In Fig. 3 we summarize the results. The top left panel shows a zoomed CMD around the SGB for the stars in our proper-motion-selected sample. Stars marked in red are are bSGB stars (119 objects), and the ones in blue are fSGB stars (88 objects). In the bottom right panel is the vector point diagram for the same stars. The two SGBs seem to have the same proper motion distribution. To show this more clearly, in the adjacent panels we plot normalized histograms of the separate components of the proper motions, for the stars of the three groups separately. Gaussian fits are also shown.

A side-benefit of proper-motion cleaning is that it also removes from the CMD stars that did not have well-measured positions. These stars tend to have poor photometry as well, so removing them naturally improves the quality of the CMD.
4.2 Wide color baseline
The second benefit of the WFPC2 data is that it provides a much better color baseline than the ACS data alone; our study of NGC 2808 (P07) showed that a wider color baseline yields a more significant splitting of the main sequence. The CMD in Figure 2 shows F336W vs. the F336W F814W color. The SGB split is even more clear in this figure than in the CMD of Figure 1 from the ACS data alone — but what is more important is that we now have a better opportunity to study any possible color spread in the main sequence. Any limits on the intrinsic width of the main sequence will translate directly into upper limits on spreads in the helium and heavy-element abundances, since age differences have little effect below the turnoff. (We note, however, the possibility that simultaneous changes in He and heavy elements could have effects that offset each other.)
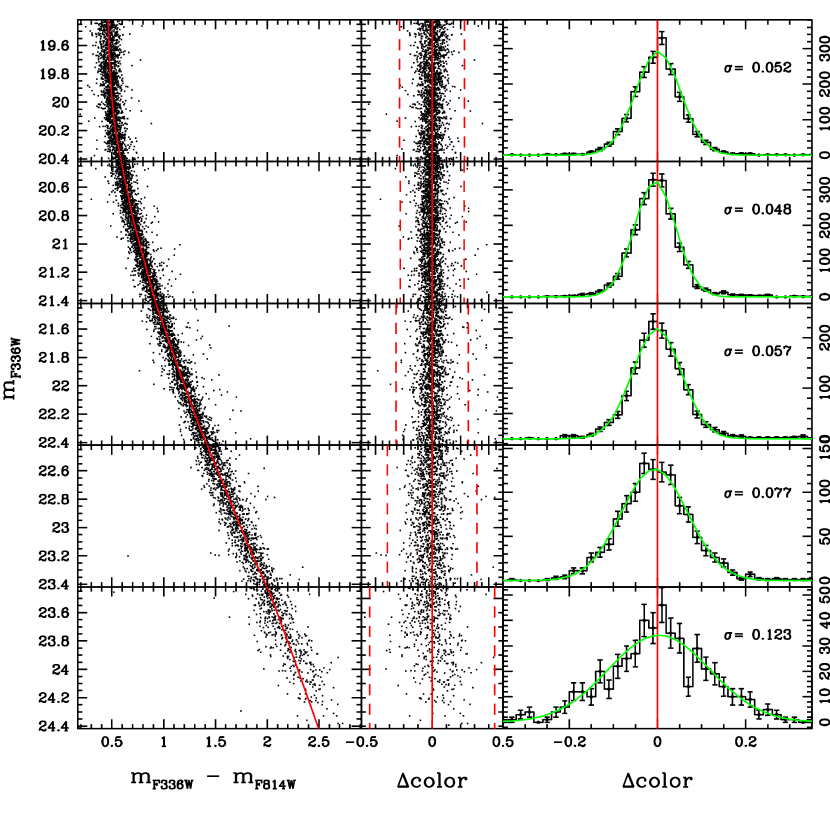
Fig. 4 shows the color distribution of the MS stars. The left panel repeats a part of the proper-motion-selected CMD that we showed in Fig. 2. In order to derive the main sequence ridge line (MSRL) we divided the CMD into intervals of 0.2 mag in the F336W band and computed the median color in each interval. By fitting these median points with a spline, we obtained a raw fiducial line. Then for each star we calculated the difference in color with respect to the fiducial, and took as the the location of the 68th percentile of the absolute values of the color differences. All stars with a color distance from the MSRL greater than were rejected, and the median points and the were redetermined. The middle panel of Fig. 4 shows the same CMD as the left panel, but after subtracting from each star the MSRL color appropriate for its F336W magnitude. Finally, the right panel shows the histograms of the color distributions in five different magnitude intervals.
The color distribution is fairly well reproduced by a Gaussian, and there is no evidence of a split of the MS, such as observed in Cen or NGC 2808. Since most of the error in color will come from the WFPC2 photometry, which will at best have an error of 0.02 mag (Anderson & King 2000), a 0.01 mag color error in the WFC (Anderson & King 2006) will give us an expected color error of 0.025 mags from measuring error alone. As Fig. 4 shows that the MS broadening can be represented with a Gaussian with , we obtain an upper limit for the intrinsic color dispersion of the MS of NGC 1851 of .
5 Two Stellar populations in NGC 1851
In this section we will derive the basic properties of the two SGBs, and consider whether other features in the CMD may indicate the presence of two stellar populations in NGC 1851.
5.1 SGB population ratios
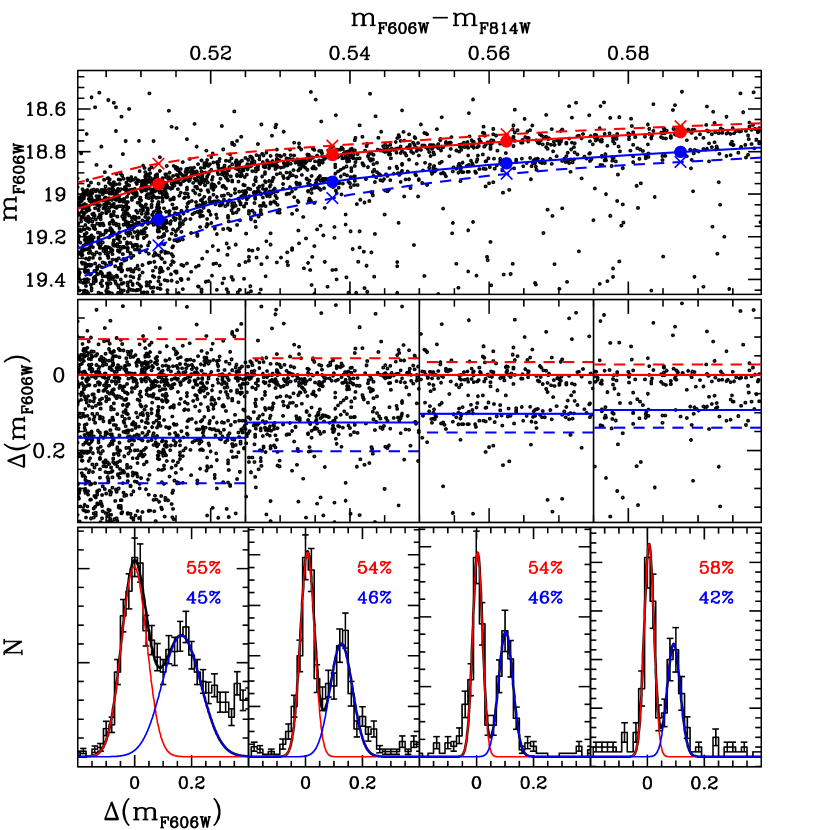
Figure 5 shows how we fitted Gaussians to the magnitude distributions of the bSGB and fSGB stars to estimate their number ratio. The top panel of the figure is a blow-up of the part of the SGB where the split occurs. The red line is a fiducial line through the bSGB. We drew it by marking the middle magnitude level of bSGB at four equally spaced points and drawing a line through them by means of a spline fit. In the middle panel the magnitude of each star has had subtracted from it the magnitude of this fiducial line at the color of the star. For the analysis that was to follow, we divided the color range into four sections, as shown.
In each color section we estimated the fraction of stars in each of the SGBs, as follows. Our aim was to fit the magnitude distributions in the two branches by a pair of overlapping Gaussians, but we felt the need to eliminate outliers, especially in the bluest color section. This we did by making a preliminary least-squares fit of the Gaussians, using all of the stars. We then repeated the solution, but omitting the stars that lay more than above the midpoint of the Gaussian for bSGB or more than below the midpoint of the Gaussian for fSGB (using in each case the sigma of the corresponding Gaussian). In the middle panel of Fig. 5 the horizontal lines show the midpoint of the final Gaussians. The red dashed line runs on the bright side of the bSGB, and the blue dashed line runs on the faint side of the fSGB (where the ’s are those of the best-fitting Gaussians in each color section, fitted to the distributions of the bSGB and fSGB stars, respectively). The stars rejected consist of field stars, objects with poor photometry, or binaries (brighter than the bSGB). We have also marked, in the top panel of Fig. 5, the values of the Gaussian centers of bSGB with large dots and the spline through them with continuous lines. The crosses are the Gaussian centers of fSGB lowered by , and the dashed lines are a spline fitted through the crosses.
The bottom section of Fig. 5 shows the histogram of the magnitude distribution in each color section of the middle panel, and the best-fitting Gaussians. The numbers reported in the figures give the percentage of total area under each of the two Gaussians, i.e., the percentage of bSGB (red) and fSGB (blue) in each interval.
When we added up, for each SGB, the areas under the four Gaussians fitted to the separate color sections, we found that 55% of the stars belong to the bSGB, and 45% to the fSGB. Although the expected sigma of samplings from a binomial distribution of more than 1000 stars, with a probability of 0.55, is less than 2%, we estimate that our observed 55/45 split really has an uncertainty that is more like 5%. This estimate is based on the differing results of several different ways of fitting the Gaussians (e.g., as simple a thing as changing the bin-width of the histograms).
As for the intrinsic width of each SGB, the dispersions in magnitude of the two Gaussians in the color sections where the two SGBs are well separated are of the order of 0.02 mag, consistent with the uncertainties in our corrections for spatial variation of the PSF. (Paradoxically, WFC colors are more accurate than WFC magnitudes, because these corrections are what limits the accuracy of high-S/N photometry, and in the case of colors the corrections are only for the difference in behavior of the PSF through two different filters.)
5.2 Spatial distribution of the SGB stars
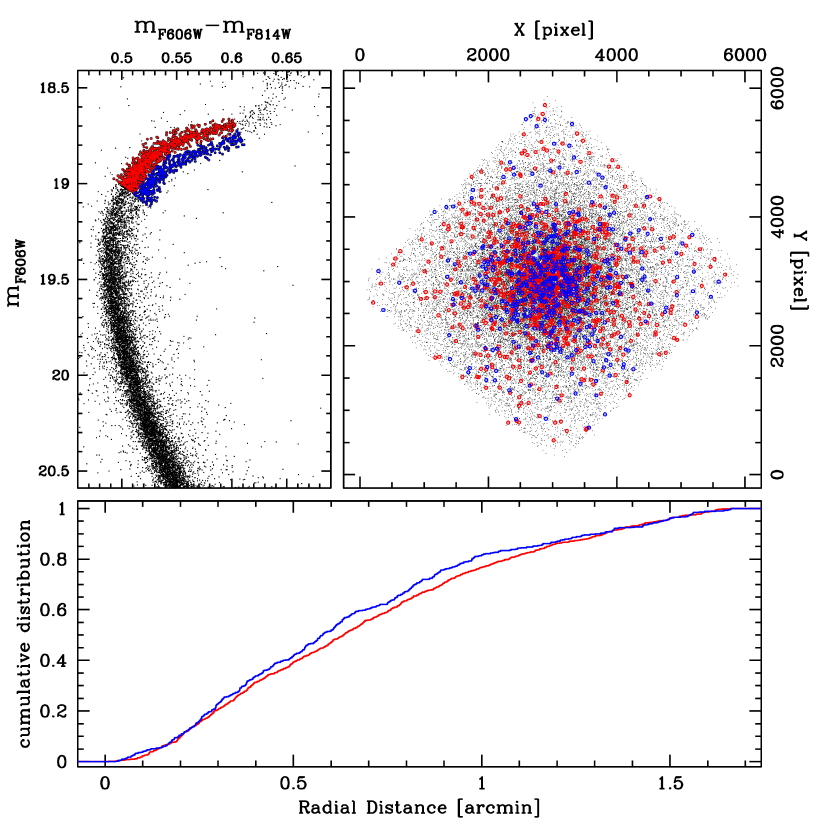
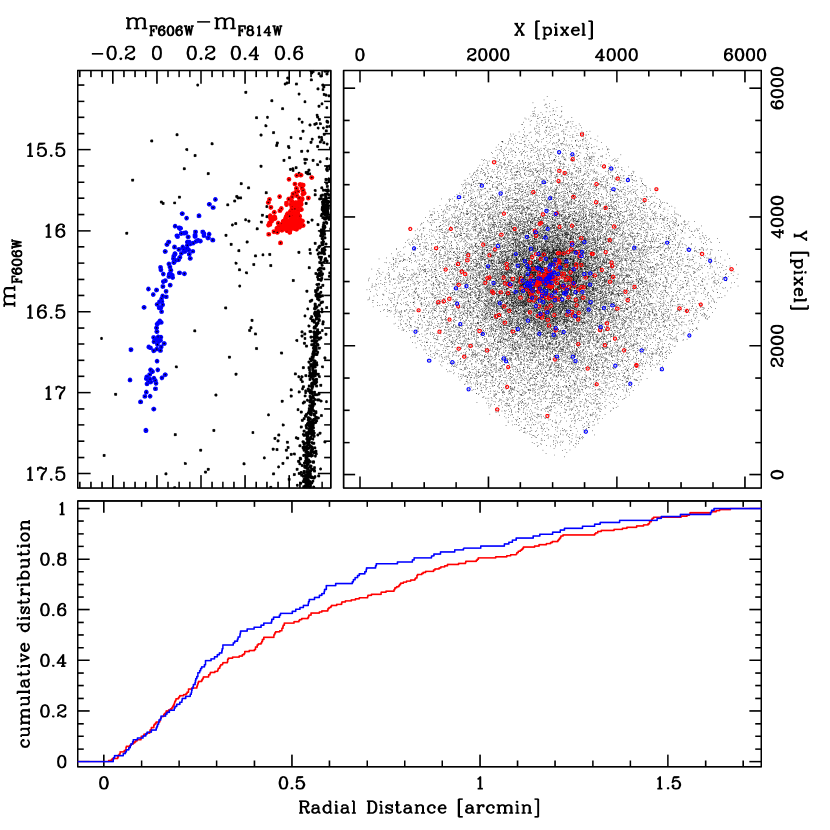
Figure 6 shows the spatial distributions of the two SGB components. We select the two SGB subsamples as shown in the bottom-right panel, and plot the spatial distributions in the bottom-left panel. Stars from both groups have similar spatial distributions. This is also confirmed by the cumulative radial distributions shown in the top panel. The Kolmogorov-Smirnov statistic shows that in random samplings from the same distribution a difference this large would occur 11% of the time, which is very reasonable for the hypothesis that the two SGBs have the same distribution.
5.3 The horizontal branch stars
Since the WFC data set included short exposures, we can also examine the horizontal branch (HB) population. Figure 7 shows the upper part of the F606W vs. F606W F814W CMD. The NGC 1851 HB is clearly bimodal. Interestingly enough, the red HB contains % of the total red + blue HB stars (242 stars), and the blue part contains % of the red + blue HB stars (143 stars). Note that some stars populate the RR Lyrae gap. It is difficult to extract RR Lyrae variables from the small number of exposures that went into Fig. 7, with each star caught at random phases in each color band. In any case, the contribution of the RR Lyraes to the total population of the HB stars is 10% (see Saviane et al. 1998 and Walker 1992). As in the case of the bSGB and fSGB, stars from the red and blue HB groups have similar spatial distributions (see top right panel of Fig. 7). This is also confirmed by the cumulative radial distributions shown in the bottom panel. The Kolmogorov-Smirnov statistic shows that in random samplings from the same distribution a difference this large would occur 17% of the time, so here too there is no significant indication of a difference in their radial distribution.
Neither for the SGB stars nor for the HB stars is the distribution of the two samples significantly different. It would obviously be desirable to strengthen the statistics by combining the two sets of counts, but unfortunately this is not possible, because the incompletenesses in star counts at the HB and at the SGB level are different.
On the basis of the relative numbers of red to blue HB stars and of bSGB to fSGB populations, it is very tempting to connect the bSGB (which includes 55% of the SGB stars) with the red HB, and the fSGB (45% of the SGB stars) with the blue HB stars.
6 The ages of the two populations
The dispersion in the MS in F336W F814W is less than 0.04 mag. Such a narrow main sequence implies that either the two SGB populations have the same metallicities and the same helium abundances or some fortuitous combination of abundances that results in no MS split. Comparison with the theoretical models of Dotter et al. (2007) provides an upper limit to a possible dispersion in [Fe/H] of 0.1 dex or in helium abundance of , if each of the two is assumed to act alone. We are not suggesting that such spreads exist; we merely state upper limits to what might be present.
We note that if we just increase the He abundance, there will be no appreciable effect on the SGB luminosity. Helium alone cannot explain the observed SGB split. On the other hand, a population 0.2 dex more metal rich would have an SGB that is fainter by magnitude, and therefore it would be able to explain the SGB split. However, such a high difference in [Fe/H] is ruled out by the narrowness of the MS. We have also looked at the color distribution of the red giant branch (RGB) and found no evidence of a split, and found an RGB color dispersion consistent with the photometric error, confirming that any dispersion in [Fe/H] alone must be much smaller than 0.2 dex.
Note, however, that increasing [Fe/H] makes the MS redder, while increasing helium makes the MS bluer. Thus if, as a mere working hypothesis, one increases [Fe/H] by 0.2 dex (enough to explain the SGB split), while changing from 0.247 to 0.30, then the two effects cancel each other out, and the MS would have the same color. The same would happen on the RGB: an [Fe/H] content 0.2 dex higher would move the RGB to the red, but the RGB would be moved to the original color in the presence of a He content . In this way we would be able to reconcile the SGB split with the low dispersions in the MS and RGB. (Clearly, this kind of conspiracy cannot be ruled out till we have high-resolution spectra to measure the metal content of the NGC 1851 stars.) However, there is additional observational evidence which seems to rule out such an unlikely coincidence. A change in [Fe/H] of +0.2 dex would imply an HB 0.03–0.04 magnitude fainter, while the suggested enhancement would end with a bluer HB that is magnitude brighter. The resulting sloping of the horizontal branch is not observed in Fig. 7.
The only remaining possibility of explaining the SGB split is therefore to assume that in NGC 1851 there are two stellar populations with similar metallicity and He content, but with different ages. Figure 5 shows that the two SGBs are separated vertically by magnitude in F606W. Comparison with the theoretical models of Dotter et al. (2007) shows that this separation corresponds to an age difference of Gyr, with the fSGB older than the bSGB.
7 Discussion
In this paper we have shown that the SGB of the Galactic GC NGC 1851 is split into two distinct branches. If the split is interpreted in terms of age, its width implies that the two populations were formed at epochs separated by Gyr. As discussed in the previous section, the age difference seems a possible explanation for the peculiar SGB.
The SGB split is not the only observational evidence of the presence of more than one population in NGC 1851, though it is probably the clearest one. We have already noted that NGC 1851 has a bimodal HB, and that there might be a connection between the two SGBs and the two HB sections. The relative frequency of stars in the different branches implies that the progeny of the bSGB are in the red part of the HB, while the progeny of the fSGB are on the blue side of the instability strip. This is what one would expect qualitatively from stellar evolution models, though an age difference of only 1 Gyr is not enough to move stars from the red to the blue side of the HB. Our models indicate that to move stars from the red to the blue side of the RR Lyrae gap would require an age difference of 2–3 Gyr. Some additional parameter, or combination of parameters, must be at work in order to explain the morphology of the HB of NGC 1851.
There is another relevant observational fact that must be mentioned. Hesser et al. (1982) found that three out of eight of their bright RGB stars show “extraordinarily strong” CN bands. These stars also show enhanced Sr II and Ba II lines, and lie systematically on the red side of the RGB. In other words, 40% of their sample of bright RGB stars contains CNO-processed material. This material could come from the interior of these stars through mixing processes, but after what we have learned from Cen and NGC 2808 we cannot exclude the possibility that this processed material comes from a first generation of stars that polluted the gas from which the CN-strong stars have formed. This hypothesis would be further supported if Sr and Ba are also confirmed to be enhanced (as the spectra of Hesser et al. [1982] seem to imply), as these elements cannot be produced in the low-mass stars presently on the RGB of NGC 1851.
Unfortunately, the results by Hesser et al. (1982) are based on a very limited sample of stars; a more extended spectroscopic investigation is clearly needed. Meanwhile, it is rather instructive to look at the CMD published by Grundahl et al. (1999), based on Strömgren photometry. Among the 15 CMDs in their Fig. 1, NGC 1851 shows by far the broadest RGB, with some hint of a bimodality. This bimodality is not visible in our narrow-color-baseline F606W vs. F606W 814W CMD, but the capability of Strömgren photometry to distinguish stellar populations with different metal content (in particular CN content) is well known, and the CMD of Grundahl et al. (1999) tends to confirm the results of Hesser et al. (1982). We have investigated the possibility that an enhancement of C or N, or of both elements, can be the cause of the observed SGB split. Hesser et al. (1982) found that model spectra with [C/A] = +0.2 and [N/A] = +0.5 (where they define [A/H] as the logarithmic relative abundance of all heavy elements in the theoretical models), or else model spectra with with [C/A] = 0 and [N/A] = +1.0 could fit the observed spectra equally well. A detailed analysis of the effect of C and N overabundances is beyond the scope of the present paper. Furthermore, before such an analysis is justified we will need better abundance constraints, which would require fitting a larger sample of stellar spectra with modern atmospheric models.
Here we note that one possible consequence for a second generation of stars is indeed an increased CNO abundance from mass lost after the third dredge-up in intermediate-mass AGB stars from an earlier generation (see discussion in Ventura & D’Antona 2005 and Karakas et al. 2006). The spectroscopic results of Hesser et al. (1982) suggest enhanced levels of C and N but do not include an analysis of the oxygen abundance, due to a lack of measurable features in the spectra. (This further underlines the need for a new study.) It is however possible that the C + N + O amount is enhanced to some extent, though at the moment we cannot quantify this enhancement. The CNO enhancement is an important observational input, as the level of enhancement would allow us to better identify the possible polluters from the first generation of stars.
The presence of CNO enhancement would affect the age difference between the two populations. A CNO enhancement of +0.3 dex would reduce the age difference between the two SGBs to 300–500 Myr. Under this hypothesis, we estimate a gap in the SGB of magnitude due to the composition alone, and an additional 0.03–0.05 mag displacement due to the age difference, fully accounting for the observed magnitude difference between the two SGBs.
Larger CNO enhancements would further reduce the age gap between the two generations of stars, down to a few hundred Myr, as expected in the intermediate-mass-AGB-star pollution scenario (Ventura et al. 2002). We note that if the CNO enhancement in second-generation stars of NGC 1851 is confirmed, NGC 1851 might differ from other globular clusters, in which the sum of CNO elements for normal and self-enriched stars seems to be constant (Cohen & Melendez 2005). New spectroscopy of stars in NGC 1851, along with the photometry presented in this paper and detailed modeling, can significantly improve our understanding of this intriguing situation.
NGC 1851 is the third globular cluster for which we have direct evidence of multiple stellar generations. All three clusters seem to differ in several important respects, however:
-
•
In Cen, the multiple populations manifest themselves both in a main-sequence split (interpreted as a bimodal He abundance; see Bedin et al. 2004, Norris 2004, and Piotto et al. 2005) and in a multiplicity of SGBs (interpreted in terms of large age variations, Gyr; see Villanova et al. 2007, and references therein), which implies at least four different stellar groups within the same cluster.
-
•
In NGC 2808, the multiple generation of stars is inferred from the presence of three MSs (interpreted in this case too in terms of three groups of stars characterized by different helium contents; see discussion in Piotto et al. 2007), and further confirmed by the presence of three groups of stars with different oxygen abundances. It is also consistent with the presence of a multiple HB (D’Antona & Caloi 2004). However, in NGC 2808 the TO-SGB regions are so narrow that any difference in age between the three stellar groups must be significantly smaller than 1 Gyr.
-
•
In the case of NGC 1851, we have evidence of two stellar groups from the SGB split, which apparently implies two stellar generations, formed with a time separation of Gyr. This hypothesis is further confirmed by the presence of a group of RGB stars with strong CN bands (distinct from the majority of CN-normal RGB stars), and enhanced Sr and Ba, and possibly the presence of a bimodal HB. In the case of NGC 1851 there is no evidence of MS splitting, which implies that any difference in helium or other heavier element content between the two populations should be small.
Apparently, not only are GCs not single-stellar-population objects, containing stars formed in a single star burst, but the evidence emerging from the new exciting HST observations presented in this paper — as well as from the HST observations of Cen and NGC 2808 — is that the star-formation history of a globular cluster can vary strongly from cluster to cluster. We are still far from understanding what governs the different star-formation histories, and this is an exciting and challenging question for future investigations. At the moment, we can only note that the three clusters in which multiple generations of stars have been clearly identified ( Cen, NGC 2808, and NGC 1851), and the two other clusters strongly suspected to contain more than one stellar generation (NGC 6388 and NGC 6441; see Caloi & D’Antona 2007, and Busso et al. 2007) are among the ten most massive clusters in our Galaxy. This evidence suggests that cluster mass might have a relevant role in the star-formation history of GCs.
We should note finally that the cases of Centauri and M54, both probably associated with mergers of other galaxies into the Milky Way, suggest the possibility that all globular clusters that have complexities in their CMDs are likewise merger remnants. This is an attractive speculation, but we think that it does not yet have enough observational support.
References
- Anderson (2000) Anderson, J., & King, I. R. 2000, PASP, 112, 1360
- Anderson (2006) Anderson, J., & King, I. R. 2006, ACS Instrument Science Report 2006-01 (Baltimore: STScI)
- Bedin (2004) Bedin, L. R., Piotto, G., Anderson, J., Cassisi, S., King, I. R., Momany, Y., & Carraro, G. 2004, ApJ, 605, L125
- Bedin (2005) Bedin, L. R., Cassisi, S., Castelli, F., Piotto, G., Anderson, J., Salaris, M., & Pietrinferni, A. 2005, MNRAS, 357, 1038
- Bedin (2006) Bedin, L. R., Piotto, G., Carraro, G., King, I. R., & Anderson, J. 2006, A&A, 460, L27
- Bekki (2006) Bekki, K., & Norris, J. E. 2006, ApJ, 637, L109
- Busso (2007) Busso et al. (2007), A&A, in press
- Caloi (2007) Caloi, V., & D’Antona, F. 2007, A&A, 463, 949
- Cohen (2005) Cohen, J. G., & Meléndez, J. 2005, AJ, 129, 303
- Cotrell (1981) Cotrell, P. L., & Da Costa, G. S. 1981, ApJ, 245, L79
- Dantona (2004) D’Antona, F., & Caloi, V. 2004, ApJ, 611, 871
- Dotter (2007) Dotter, A., Chaboyer, B., Jevremovic, D., Baron, E., Ferguson, J. W., Sarajedini, A., & Anderson, J. 2007, AJ, 134,376
- Fenner (2004) Fenner, Y., Campbell, S., Karakas, A. I., Lattanzio, J. C., & Gibson, B. K. 2004, MNRAS, 353, 789
- Gratton (2005) Gratton, R., Sneden, C., & Carretta, E. 2004, ARA&A, 42, 385
- Grundahl (1999) Grundahl, F., Catelan, M., Landsman, W. B., Stetson, P. B., & Andersen, M. I. 1999, ApJ, 524, 242
- Harris (1996) Harris, W. E. 1996, AJ, 112, 1487 (Feb. 2003 revision)
- Hesser (1982) Hesser, J. E., Bell, R. A., Harris, G. L. H., & Cannon, R. D. 1982, AJ, 87, 1470
- Holtzman (1995) Holtzman, J. A., Burrows, C. J., Casertano, S., Hester, J. J., Trauger, J. T., Watson, A. M., & Worthey, G. 1995, PASP, 107, 1065
- Karakas (2006) Karakas, A. I., Fenner, Y., Sills, A., Campbell, S. W., & Lattanzio, J. C. 2006, ApJ, 652, 1240
- Layden (2000) Layden, A. C., & Sarajedini, A. 2000, ApJ, 119, 1760
- Maeder (2006) Maeder, A., & Meynet, G. 2006, A&A, 448, L37
- Norris (1996) Norris, J. E., Freeman, K. C., & Mighell, K. J. 1996, ApJ, 462, 241
- Norris (2004) Norris, J. E. 2004, ApJ, 612, 25
- Piotto (2005) Piotto, G., et al. 2005, ApJ, 621, 777 (P05)
- Piotto (2007) Piotto, G., et al. 2007, ApJ, 661, L53 (P07)
- Sarajedini (2007) Sarajedini, A., et al. 2007, AJ, 133, 290
- Saviane (1998) Saviane, I., Piotto, G., Fagotto, F., Zaggia, S., Capaccioli, M., & Aparicio, A. 1998, A&A, 333, 479
- Sirianni (2005) Sirianni, M., et al. 2005, PASP. 117, 1049
- Sollima (2005) Sollima, A., Pancino, E., Ferraro, F. R., Bellazzini, M., Straniero, O., & Pasquini, L. 2005, ApJ, 634, 332
- Ventura (2001) Ventura, P., D’Antona, F., Mazzitelli, I., & Gratton, R. 2001, ApJ, 550, L65
- Ventura (2002) Ventura, P., D’Antona, F., & Mazzitelli, I. 2002, A&A, 393, 215
- Ventura (2005) Ventura. P., & D’Antona, F. 2005, ApJ, 635, L149
- Villanova (2007) Villanova, S., et al. 2007, ApJ, in press, astro-ph 0703208 (V07)
- Walker (1992) Walker, A. R. 1992, PASP, 104, 1063