Mott-Hubbard versus charge-transfer behavior in LaSrMnO4
studied via optical conductivity
Abstract
Using spectroscopic ellipsometry, we study the optical conductivity of insulating LaSrMnO4 in the energy range of 0.75-5.8 eV from 15 to 330 K. The layered structure gives rise to a pronounced anisotropy. A multipeak structure is observed in (, 3.5, 4.5, 4.9, and 5.5 eV), while only one peak is present at 5.6 eV in . We employ a local multiplet calculation and obtain (i) an excellent description of the optical data, (ii) a detailed peak assignment in terms of the multiplet splitting of Mott-Hubbard and charge-transfer absorption bands, and (iii) effective parameters of the electronic structure, e.g., the on-site Coulomb repulsion =2.2 eV, the in-plane charge-transfer energy =4.5 eV, and the crystal-field parameters for the configuration (=1.2 eV, =1.4 eV, and =0.2 eV). The spectral weight of the lowest absorption feature (at 1-2 eV) changes by a factor of 2 as a function of temperature, which can be attributed to the change of the nearest-neighbor spin-spin correlation function across the Neel temperature =133 K. Interpreting LaSrMnO4 effectively as a Mott-Hubbard insulator naturally explains this strong temperature dependence, the relative weight of the different absorption peaks, and the pronounced anisotropy. By means of transmittance measurements, we determine the onset of the optical gap = 0.4-0.45 eV at 15 K and 0.1-0.2 eV at 300 K. Our data show that the crystal-field splitting is too large to explain the anomalous temperature dependence of the -axis lattice parameter by thermal occupation of excited crystal-field levels. Alternatively, we propose that a thermal population of the upper Hubbard band gives rise to the shrinkage of the -axis lattice parameter.
pacs:
71.20.Be, 71.27.+a, 75.47.Lx, 78.20.-eI Introduction
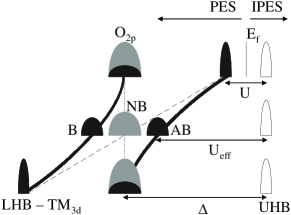
The insulating behavior of many transition-metal (TM) compounds with a partially filled shell is a clear manifestation of strong electronic correlations. In the Zaanen-Sawatzky-Allen scheme,Zaanen et al. (1985) these correlated insulators are categorized into Mott-Hubbard (MH) and charge-transfer (CT) types. In the former, the on-site Coulomb repulsion is larger than the band width ; thus, the conduction band splits into lower and upper Hubbard bands (LHB and UHB, see Fig. 1). At half filling, the lowest electronic excitation is from LHB to UHB, , where denotes a TM ion with electrons in the shell. In a CT insulator, is larger than the charge-transfer energy ; thus, the LHB is pushed below the highest occupied band of the ligands, e.g., O (see Fig. 1). Here, the lowest electronic excitation is from O to UHB, . Typically, early TM compounds are of MH type, whereas late ones such as the high- cuprates belong to the CT class.Arima et al. (1993)
For manganites with Mn3+ configuration, e.g., LaMnO3 or LaSrMnO4, the characterization is not as straightforward. The analysis of photoemission data indicates , i.e., a CT character.Mizokawa and Fujimori (1996) Yet, most theoretical approaches employ an effective Hubbard model (see below). Both MH and CT types have been proposed on the basis of optical data.Arima et al. (1993); Moritomo et al. (1995); Jung et al. (1997); Quijada et al. (2001); lee07a ; Tobe et al. (2001); Kovaleva et al. (2004); Ahn and Millis (2000) For or , there are different ways to disentangle MH and CT excitations in the optical conductivity. First, the spectral weight of CT excitations is larger, e.g., 500 cm for MH and 5000 cm for CT excitations in LaTiO3.Arima et al. (1993) This can be attributed to the TM3d-O2p hopping amplitude : for CT and for MH excitations (see below). Second, the polarization dependence may be very different, depending on the crystal structure. In layered LaSrMnO4, the interlayer Mn-Mn hopping is strongly suppressed; thus, the contribution of MH excitations should be negligible in . In contrast, CT excitations contribute to both and due to the octahedral O coordination of the Mn sites. Third, the spin and orbital selection rules are different, giving rise to a different behavior of the spectral weight as a function of temperature .Ahn and Millis (2000); Tobe et al. (2001); Kovaleva et al. (2004); Lee et al. (2005, 2002); Kim et al. (2004); Rauer et al. (2006); Miyasaka et al. (2002); Tsvetkov et al. (2004); Khaliullin et al. (2004); Oleś et al. (2005) As an example, we consider a MH insulator with a single band and one electron per TM site. In the case of ferromagnetic order, the spectral weight of MH excitations is zero due to the Pauli principle (neglecting spin-orbit coupling, the total spin is conserved in an optical excitation). Thus, one expects a drastic change of the spectral weight upon heating across the magnetic ordering temperature. In contrast, the O band is completely filled and the spectral weight of CT excitations is independent of the magnetic properties. For comparison with experimental data, the orbital multiplicity has to be taken into account and the optical spectra of MH excitations contain valuable information on orbital occupation and nearest-neighbor spin and orbital correlations. This kind of analysis has been applied to a number of different TM compounds (Mn, V, Ru, Mo).Ahn and Millis (2000); Tobe et al. (2001); Kovaleva et al. (2004); Lee et al. (2005, 2002); Kim et al. (2004); Rauer et al. (2006); Miyasaka et al. (2002); Tsvetkov et al. (2004); Khaliullin et al. (2004); Oleś et al. (2005) In LaMnO3, there is some disagreement on the experimental side: LaMnO3 has been interpreted as MH type due to a pronounced dependence observed by spectroscopic ellipsometryKovaleva et al. (2004) and as CT type due to the absence of a significant dependence across the Neel temperature in reflectivity measurements.Tobe et al. (2001) Note that it is still unclear in which compounds this kind of analysis can be applied. For instance, in YTiO3, the lowest MH excitation shows a strong dependence but only a weak dependence on the magnetic properties.Gössling et al. (2006) However, our analysis of LaSrMnO4 fully corroborates the intimate relation between spectral weight and magnetism reported by Kovaleva et al.Kovaleva et al. (2004) for LaMnO3.
Does this prove that LaMnO3 and LaSrMnO4 are of MH type? The configuration is particularly stable. Thus, the configuration has a strong contribution, where denotes a ligand hole and the O orbitals certainly play an important role. As stated above, with ,Mizokawa and Fujimori (1996) the manganites may be categorized as CT type. However, for the analysis of, e.g., optical data, it is important to consider the symmetry. Let us discuss the simplified case of a single, half-filled band and degenerate, full O bands. Due to hybridization, one has to distinguish bonding (B), antibonding (AB), and nonbonding (NB) bands below the Fermi level (see Fig. 1). The AB band is the highest occupied one. It has mainly TM character for and mainly O character for . For the intermediate situation , the character is strongly mixed. However, in the manganites with a less than half-filled shell, the symmetry of the AB band is determined by the symmetry of the band, i.e., it can be described in terms of a Wannier orbital with symmetry centered around a Mn site. In particular, the spin and orbital selection rules mentioned above for a MH insulator apply also to the AB band. These selection rules are most important for understanding the optical data. For instance, in LaSrMnO4, one expects that the AB band shows the pronounced anisotropy and the strong temperature dependence discussed above for the MH case. Thus, “MH or CT” is not the essential question for and strong hybridization. In this sense, we analyze our data in terms of an effective Hubbard model with a rather small value of =2.2 eV. Excitations from NB to UHB are treated as CT and from AB to UHB as MH. We find that these effective MH excitations are significantly lower than the CT excitations. The effective model does not contain the B band, which is important for optical or photoemission measurements at higher energies. However, we fully take into account the multiplet splitting of the MH and CT bands caused by the multiorbital structure of the shell.
Here, we focus on LaSrMnO4, which crystallizes in the layered K2NiF4 structure with tetragonal symmetry .Reutler et al. (2003) The lattice constants at room temperature are =3.786 Å and 13.163 Å. All Mn ions have a nominal valence of ( with spin =2). Antiferromagnetic order has been observed below =133 K.Larochelle et al. (2005); Senff et al. (2005); Kriener (2005) Neglecting hybridization, the four electrons occupy the , , , and - orbitals with parallel spins, while - is empty.wu04a Similar to LaMnO3, also the character of LaSrMnO4 – MH vs CT – has been discussed controversially.Moritomo et al. (1995); Park (2001); Kuepper et al. (2006a, b); Merz et al. (2006a, b); lee07a Previous optical studies reported for 300 K (Ref. Moritomo et al., 1995) and very recently for 10 K.lee07a By means of spectroscopic ellipsometry, we determine the optical conductivity tensor between 0.75 and 5.8 eV as a function of temperature. Using a local multiplet calculation, we interpret the observed absorption bands in terms of effective Mott-Hubbard and charge-transfer excitations. This assignment utilizes the points raised above, i.e., the pronounced anisotropy, the difference in spectral weight, and the strong temperature dependence of the spectral weight. Using transmittance measurements, we determine the optical gap =0.4-0.45 eV at 15 K and 0.1-0.2 eV at 300 K. Our data indicate that the anomalous shrinkage of the -axis lattice parameter with increasing temperature cannot be attributed to a thermal occupation of local crystal-field levelsSenff et al. (2005); Daghofer et al. (2006a, b) but rather to a thermal population of the UHB.
Section II describes the experimental details. Our optical data and a detailed analysis of the spectral weight are reported in Sec. III. The local multiplet calculation, the effective parameters of the electronic structure, and the calculation of based on the multiplet calculation are discussed in Sec. IV. Finally, in Sec. V, we discuss the peak assignment in terms of the multiplet splitting of MH and CT absorption bands, the relationship between the spectral weight and superexchange, and the anomalous thermal expansion.
II Experimental
Single crystals of LaSrMnO4 have been grown using the floating zone technique following Ref. Reutler et al., 2003. The sample quality and stoichiometry were checked using polarization microscopy, neutron diffraction, and x-ray diffraction. The two nonvanishing, complex entries and of the dielectric tensor for tetragonal symmetry were determined using a rotating-analyzer ellipsometer (Woollam VASE) equipped with a retarder between polarizer and sample. By measuring on a polished surface, we determined the normalized Müller matrix elements (=1-3, =1-4, =1-2),Azzam and Bashara (1987) where =1 (2) corresponds to measurements with the () axis perpendicular to the plane of incidence. The angle of incidence was 70∘. We obtained and by fitting the nonvanishing elements , , , and .Gössling (2007) We have checked that the results fulfill the Kramers-Kronig consistency. The ellipsometric measurements have been performed from 15 to 330 K in a UHV cryostat with mbar. The effect of the cryostat windows has been determined using a standard Si wafer. Our data are consistent with spectra of Refs. Moritomo et al., 1995 and lee07a, .
In order to determine the optical gap, we measured the transmittance from 5 to 300 K using a Fourier-transform spectrometer (Bruker IFS 66v). The sample was approximately 70 m thick and has been prepared in the same way as described above.
III Results
III.1 Ellipsometry and interband excitations
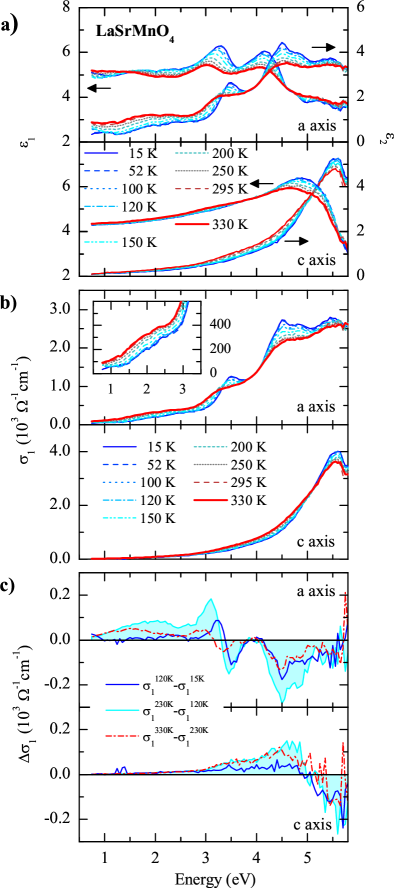
In Fig. 2(a), we plot (=,) from 0.75 to 5.8 eV. For convenience, the real part of the optical conductivity is displayed in Fig. 2(b). We find a striking anisotropy. In particular, there is only one strong peak at 5.6 eV in , while a multipeak structure is present in (peaks at 2, 3.5, 4.5, 4.9, and 5.5 eV). All peaks show a strong temperature dependence. With increasing , increases below 3 eV and decreases above 4 eV. In particular, spectral weight (SW) is transferred from to eV and from to eV [see Fig. 2(c)].
We analyze the dependence of the SW using the effective carrier concentration ,
| (1) |
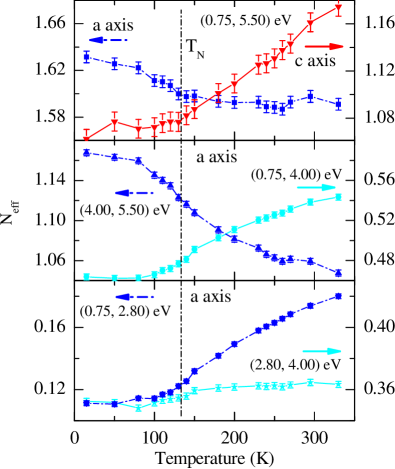
where denotes the electron mass, the unit cell volume, and the electron charge. Equation (1) translates into the -sum rule for and .Dressel and Grüner (2002) As shown in Fig. 3, the total spectral weight decreases (increases) with increasing for the () direction. In , we find an isosbestic point at eV. The corresponding transfer of SW is evident from the comparison of and (see middle panel of Fig. 3). The transfer of SW sets in roughly 30 K below =133 K, but the curves posses an inflection point approximately at .
The direct integration of in Eq. 1 has the advantage to be model independent. For a more detailed analysis of the dependence of the individual absorption bands, we fit and simultaneously using a sum of Drude-Lorentz oscillators,Dressel and Grüner (2002)
| (2) |
where , , and are the peak frequency, the plasma frequency, and the damping of the th oscillator, and denotes the dielectric constant at “infinite” frequency (i.e., above the measured region). The plasma frequency is related to the spectral weight of a single Lorentzian,Dressel and Grüner (2002) .
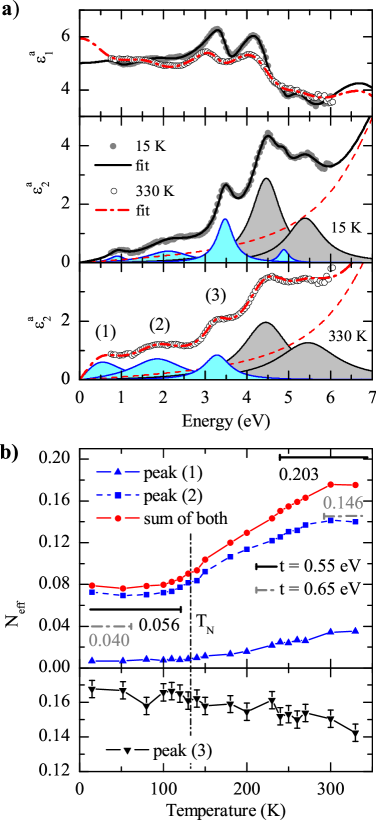
Using seven oscillators, we obtain an excellent description of both and , which clearly demonstrates the Kramers-Kronig consistency [see Fig. 4(a)]. The peak frequency of one of these seven oscillators is outside the measured region (dashed line). It corresponds to the strong feature observed at about 7 eV by Moritomo et al. at room temperature.Moritomo et al. (1995) The parameters and of this strong oscillator have been assumed to be independent of . Since ellipsometry determines both and independently, the contributions of higher-lying bands to the measured region can be fixed quite accurately. For the lowest three oscillators, the effective carrier concentration obtained from the fit is displayed in Fig. 4(b). With increasing , the SW of peak (3) at 3.5 eV decreases by 20%, while the SW of peaks (1) and (2) at 1-2 eV increases by a factor of 2. Comparing the dependence of below about 3 eV as obtained either from the Drude-Lorentz fit [Fig. 4(b)] or from the direct integration of (bottom panel of Fig. 3), the former is even stronger because it separates contributions from higher-lying bands. The precise determination of is important for the comparison with the kinetic energy (see Sec. V C below).
We find the same trend in the direction. The change of the SW of 10 obtained from direct integration of may be influenced by a broadening or shift of the peak (since it is close to the edge of the measured frequency range) or by a change in the background originating from higher-lying bands. In a fit based on Eq. (2), we found a larger change in SW of 20.
III.2 Transmittance and gap
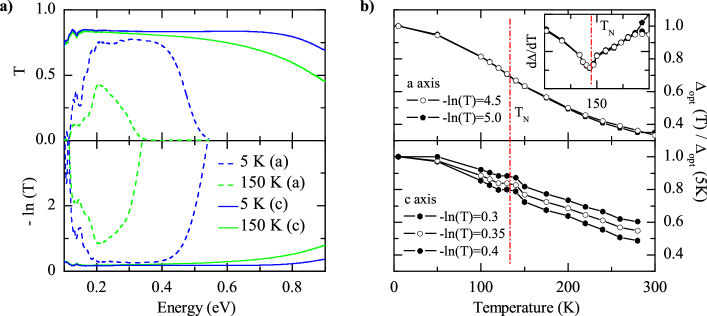
Figure 5(a) shows the transmittance and from 0.1 to 0.9 eV for both and polarizations. Here, denotes the absorption coefficient. The calculation of additionally requires the knowledge of the reflectivity in this frequency range. The transmittance is a very sensitive probe in order to determine the onset of the optical gap. For this purpose, and can be used equivalently. Assuming a reasonable value of , we find cm at 0.5 eV at 5 K, more than 2 orders of magnitude smaller than at 2 eV. Thus, the data in Fig. 5 only show the very onset of excitations across the gap. The absorption below about 0.2 eV can be attributed to weak (multi)phonon excitations.
From linear extrapolation of to zero, we find eV and eV at 5 K. In order to monitor the temperature dependence of the onset of the gap, we solve the equations and with =5.0 and 4.5 and =0.40, 0.35, and 0.30, respectively, where and denote the polarization direction. The results are shown in Fig. 5(b). At 300 K, we find = 0.1-0.2 eV. The redshift of the onset of the gap with increasing can be attributed to either a shift of the peak frequency or an increase of the bandwidth. According to the fit results, peak (1) shifts by about 0.3 eV from 5 to 300 K [see Fig. 4(a)]. This shift may originate from thermal expansion and electron-phonon coupling,Cardona (2005); Cardona and Thewalt (2005) giving rise to a change of the effective crystal field. The bandwidth may change due to either a change of the lattice parameters or of the spin-spin correlations ( is reduced in the antiferromagnetically ordered state). The plot of the derivative in the inset of Fig. 5(b) and the lower panel clearly show that changes its slope at =133 K (independent of the choice of and ), which reflects the behavior of the lattice constants.Senff et al. (2005)
IV Multiplet calculation
One may expect that a local multiplet calculation for a single 180∘ Mn-O-Mn bond yields a reasonable assignment of the CT () and MH excitations () of the undoped Mott insulator LaSrMnO4. For simplicity, we neglect hybridization; thus, the two-site states are a simple product of two single-site states. This affects the excitation energies and the matrix elements. Thus, we obtain renormalized parameters, e.g., an effective value of , which has to be kept in mind for comparison with results from other techniques. The selection rules are not affected by hybridization, as stated in the Introduction. We calculated and by evaluating the matrix elements between all multiplet states. For more details, we refer to the Appendix and Ref. Gössling, 2007.
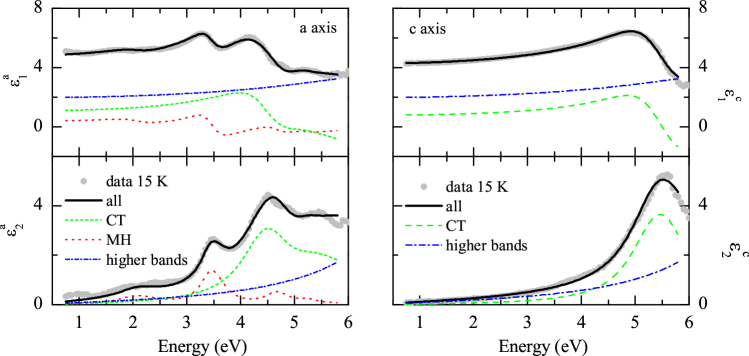
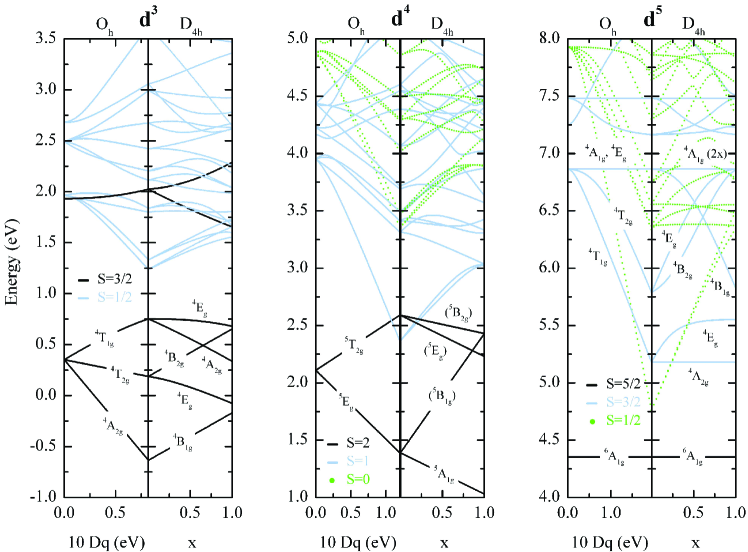
The multiplet calculation takes into account the Coulomb interaction and the crystal-field splitting. The former is described by the Slater integrals , , and .Sugano et al. (1970); haverkortPHD We use only two parameters, and the reduction factor in for =2 and 4, where denotes Hartree-Fock results for a free ion. For the states, the tetragonal crystal field is parametrized by , , and , representing the splitting between and levels and the splitting within these levels, respectively. The CT energy is given by for or , where is the lowest energy of the multiplets. The states are assumed to be degenerate. These seven electronic parameters (see Tab. 1) determine all peak frequencies and the relative weight of different peaks within one polarization. A constrained fit of the experimental data requires seven more parameters (for the width, the absolute value, and higher-lying bands, see the Appendix). Altogether, we use 14 parameters, i.e., much less than those in the Drude-Lorentz model (22 parameters only for the direction, see above). Moreover, the discussion of the peak assignment below will show that the pronounced structure of the experimental spectra provides severe constraints for the electronic parameters. The spectra with the lowest are plotted in Fig. 6. The overall agreement is excellent. We find =1.2 eV and =0.64, resulting in =2.2 eV and Hund’s coupling =0.6 eV (cf. Ref. UJH, ). The energy levels of the , , and multiplets are shown in Fig. 7 as a function of the crystal-field parameters.
| 1.20 | 0.64 | 1.20 | 0.2 | 1.4 | 4.51 | 4.13 |
V Discussion
Our first goal is to disentangle CT excitations and MH excitations . As discussed in the Introduction, the spectral weight of MH excitations is weaker. In layered LaSrMnO4, the interlayer Mn-Mn hopping is strongly suppressed and MH excitations can be neglected in the direction. This is the main reason for the pronounced anisotropy observed experimentally and suggests the following interpretation: the peak at 5.6 eV in is a CT excitation and the same holds true for the strong excitations in the same energy range in . The weaker features below 4 eV in are MH excitations. The detailed analysis discussed below will support this assignment.
V.1 Charge-transfer excitations
In the direction, we attribute the whole spectral weight to a CT peak at 5.6 eV and to the onset of higher-lying processes. To get an idea about the initial and final states of this CT excitation, we start from the strong crystal-field limit (i.e., neglect electron-electron interactions). In the ground state, the tetragonally distorted MnO6 octahedra indicate that three electrons occupy the , , and orbitals and the fourth electron occupies the orbital,wu04a ; Senff et al. (2005) whereas remains unoccupied (see Fig. 8). This is supported by our multiplet calculation. In the initial state , all O orbitals are occupied; thus, the excitation and its selection rules are dominated by the part of the final state . According to the spin selection rule, only states with =5/2 or 3/2 can be reached from the =2 ground state. Following Hund’s rule, the lowest state corresponds to a high-spin multiplet, in which the five orbitals are equally occupied. For the orbital selection rules, one thus has to consider the overlap between the O orbitals and the initially unoccupied orbital. This is only finite along the direction but zero along . Therefore, we cannot identify the peak at 5.6 eV in with the lowest CT transition. The second lowest CT excitation in the strong crystal-field limit corresponds to a transfer of one electron from O into the degenerate orbitals, i.e., to a final state with =3/2. The overlap is finite, both in the and directions. This assignment of the peak at 5.6 eV in is supported by our multiplet calculation (cf. Fig. 6). However, the calculation resolves the contributions of different multiplets to the peak at 5.6 eV, and it gives the relative weight of the different CT bands.
The calculated spectrum (see Fig. 6) shows only one strong CT band at 5.6 eV in , while in another strong CT band is observed at 4.5 eV. The latter results from an excitation into the lowest final state with =5/2 . The next states (, , and ) are found 0.9 - 1.5 eV above the multiplet (see Fig. 7). The calculation shows that the second lowest excitation actually corresponds roughly to a transfer from O to [see the sketch of in Fig. 9(b)], but excitations to and are forbidden along by the orbital selection rule, as discussed above in the strong crystal-field limit for the lowest CT absorption. Only the transitions to and are allowed in the direction [see sketch of the states in Figs. 9(a) and (c)]. These constitute the peak at 5.6 eV.
Along , the peak frequency is somewhat lower (5.5 eV), reflecting the excitation to the final state and a small anisotropy of the CT energy. From the fit of the entire spectrum, we find eV and eV. This is reasonable because the in-plane O(1) site and the apical O(2) site are crystallographically different.Senff et al. (2005); Merz et al. (2006b)
We emphasize that the assignment is unique. The lowest CT excitation (hopping from O to ) is the strongest one in =. Interpreting the peak at 3.5 eV or even the 2 eV band as the lowest CT excitation does not yield sufficient weight around 4.5 eV in . Moreover, the selection rules show unambiguously that the peak at 5.6 eV along corresponds to excitations to the and multiplets, which are 1.2 - 1.5 eV above the lowest state. Thus, we conclude that the lowest CT energy is 4 eV.
The increase of spectral weight in with increasing temperature (see top panel of Fig. 3) can partially be attributed to the decrease of 0.5% of the Mn-O(2) distance from 20 to 300 K.Senff et al. (2005) With (Ref. Harrison, 1999) and , the decrease of can only account for a change in SW of 3%, in contrast to the observed gain of 10%, see Fig. 3. This may reflect a change in the occupation of the - orbitals, see Sec. V C.
V.2 Mott-Hubbard excitations
The observed value of of a few 100 cm around 2 eV is typical for a Mott-Hubbard absorption band in transition-metal oxides, e.g., in RTiO3 or RVO3.Arima et al. (1993); Okimoto et al. (1995); Imada et al. (1998); Tsvetkov et al. (2004) The SW around 2 eV cannot be attributed to local excitations (crystal-field excitations), which are parity forbidden within a dipole approximation. A finite SW is obtained by the simultaneous excitation of a symmetry-breaking phonon, typically resulting in of only a few cm.rueckamp05a ; Ballhausen (1962)
First, we discuss the spin selection rule. The ground state is a (5A1g)(5A1g) state (see Fig. 7), i.e., =2 on both sites. If the spins are parallel (=2 on both sites =1, 2), only fully spin-polarized states with and can be reached by the transfer of one electron with =1/2. For antiparallel spins (=2, =-), we can reach final states with =3/2 and =3/2 or 5/2 (=3/2 in both cases).
We start the peak assignment again from the strong crystal-field limit. The highest occupied orbital on one site has overlap to both and on the other site. In contrast, hopping of an electron from , , or is only finite to the same type of orbital. In LaSrMnO4, this selection rule is strict because the O octahedra are neither tilted nor rotated. Thus, one expects only three different Mott-Hubbard peaks in the strong crystal-field limit: (i) the excitation from - to - with a high-spin =5/2 in the final state (see Fig. 8), this transition has the lowest energy according to Hund’s rule (as long as is not too large); (ii) the excitation from either - or or from the degenerate , orbitals to the same orbital on the other site [=3/2, see Fig. 9], these excitations have the same energy in the strong crystal-field limit because the orbital quantum number is preserved in the transition, and all the final states show the same spin quantum numbers; (iii) again an excitation from - to -, but this time with =3/2.
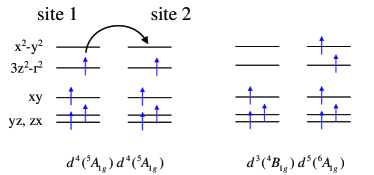
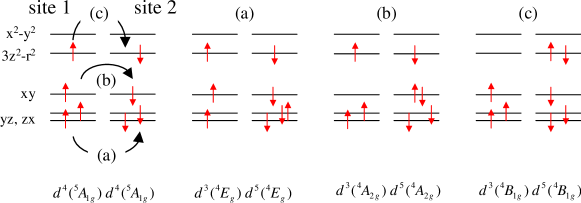
The Coulomb interaction gives rise to configuration mixingSugano et al. (1970) and lifts the degeneracy of the excitations collected in (ii). However, the overall features of the result of our multiplet calculation are reproduced rather well by the crude approximation of the strong crystal-field limit discussed above. As shown in Fig. 7, the lowest , , and states have , , and symmetries, respectively. Thus, the lowest MH excitation is from the ground state to a final state (Fig. 8). This statement is valid over a wide range of parameters. This transition is assigned to the broad feature observed around 2 eV in (see Fig. 6). The width is attributed to the large bandwidth of the band. In the Drude-Lorentz fit described in the previous section, this excitation corresponds to peaks (1) and (2) [see Fig. 4(a)]. The fact that this feature is not well described by a single Lorentzian can be attributed to band structure effects of the broad band. Note that a similar ”fine structure“ was observed for the very similar lowest optical excitation in LaMnO3.Kovaleva et al. (2004) Due to the high-spin character of the final state, the spectral weight is largest for parallel alignment of neighboring spins (see sketch in Fig. 8). As discussed above, a final state with =5/2 and =3/2 is also possible for antiparallel spins in the antiferromagnetic state below =133 K, but one expects a reduced SW. Figure 2 clearly shows an increase of the SW around 2 eV with increasing , in agreement with our assignment.
Both the and the configurations show several multiplets that are less than 1.5 eV above the lowest states. For the identification of the next higher-lying excitations, we thus have to consider the orbital selection rule. For the ground state, we find (see Fig. 7), where denotes an irreducible representation of the point group . The matrix elements are only finite for and . For excitations with , i.e., hopping within the same type of orbital (see sketch in Fig. 9), we find . According to Fig. 7 we can thus attribute the peak at 3.5 eV in to excitations with the final states , , and [the higher-lying transition has negligible weight], which roughly correspond to the hopping of an electron within the , , and orbitals, respectively. These excitations are degenerate within the strong crystal-field limit. According to the multiplet calculation, the splitting is only small, giving rise to one pronounced feature at 3.5 eV. Compared to the feature observed around 2 eV, the SW at low temperatures is larger at 3.5 eV because three different processes contribute and because of the spin selection rule. Since the final states have =3/2, the SW of these transitions is largest for the antiparallel alignment of neighboring spins. According to the Drude-Lorentz fit of the previous section, the feature at 3.5 eV indeed loses weight with increasing temperature [peak (3) in Fig. 4(b)]. The loss of 20% from 15 to 330 K is not as strong as the gain of the lowest transition. The direct integration of from 2.8 to 4 eV even yields a slight gain of 3% (see bottom panel of Fig. 3). As discussed above, this difference can be attributed to a change of the background which can be resolved by the Drude-Lorentz fit. However, a precise quantitative determination of the change of SW appears to be difficult in this frequency range, e.g., the background contribution of the CT transitions may have been underestimated in the Drude-Lorentz fit. The temperature dependence is discussed in more detail in the next section.
In comparison with the processes contributing to the peak at 3.5 eV, the excitation from - to - with =3/2 is lower in Coulomb energy, but it costs about . This can be identified with the SW above 4 eV in the MH contribution (see Fig. 6). Since , the orbital selection rule allows also for transitions to final states with ; thus, different multiplets contribute. However, these are difficult to separate from the CT excitations observed in the same energy range.
Our assignment is very well compatible with a number of different results. In LDA+ calculations,Park (2001); Wu (2007) the highest occupied band has mainly a Mn character (hybridized with O bands) and the lowest unoccupied band is a Mn band. Also, our interpretation of the peak at 3.5 eV is in agreement with the LDA+ results.Park (2001); Wu (2007) The x-ray data of Kuepper et al.Kuepper et al. (2006b) also suggest that the highest occupied states mainly have Mn character. Our results support the very similar interpretation of the lowest optical excitation in LaMnO3 in terms of a Mott-Hubbard peak.Jung et al. (1997); Quijada et al. (2001); Kovaleva et al. (2004); grenier05a
V.3 Temperature dependence and kinetic energy of the low-energy high-spin transition
The superexchange interaction between spins on neighboring Mn sites arises from the virtual hopping of electrons between the two sites. The intersite excitations probed in optical spectroscopy are the real-state counterpart of these virtual excitations. Therefore, the superexchange constant is related to the spectral weight of the optical excitations.
In total, superexchange in LaSrMnO4 favors antiparallel spins, but there is a ferromagnetic contribution , which corresponds to the lowest optical excitation to a high-spin final stateFeiner and Oleś (1999) [peaks (1) and (2) of the Drude-Lorentz fit, see Fig. 4(a)]. The relation between the spectral weight or of this excitation and has been derivedOleś et al. (2005); Khaliullin (2005) for the compound LaMnO3. The direction of LaMnO3 with ferro-orbital order of - is equivalent to the direction of LaSrMnO4 with - orbitals. Adopting the formalismKovaleva et al. (2004) for LaSrMnO4, the effective carrier concentration , the in-plane kinetic energy , and the ferromagnetic contribution to superexchange are related by
| (3) | |||||
| (4) | |||||
| (5) |
where =3.786 Å is the Mn-Mn distance,Senff et al. (2005), the free electron mass, and denote nearest-neighbor Mn sites, the effective Mn-Mn hopping amplitude, and represents the excitation energy of the virtual intermediate state. We determined from the weighted peak frequencies of peaks (1) and (2), = 2.10 eV at 15 K and 1.76 eV at 330 K. The nearest-neighbor spin-spin correlation is given by for and by for . Using =4.5 eV from our analysis, we find 0.6 eV. Using =0.55-0.65 eV, we derive (15 K)=(15 K) = 0.021-0.030 eV and (330 K)=(330 K) = 0.077-0.108 eV and finally (15 K)=0.040-0.056 and (330 K)=0.146-0.203 [see Fig. 4(b)]. Both at low and at high temperatures, the calculated values agree amazingly well with the experimental results. This strongly corroborates our interpretation of the feature around 2 eV with the lowest Mott-Hubbard excitation. Moreover, it suggests that the redistribution of weight with temperature can be attributed mainly to a change of the nearest-neighbor spin-spin correlation function. As discussed above for the direction, the change of the lattice constant may only account for a change of of a few percent.
A more detailed analysis requires the knowledge of the temperature dependence of . In the three-dimensional antiferromagnet LaMnO3, the change of right at is more pronounced.Kovaleva et al. (2004) The more gradual changes observed in LaSrMnO4 qualitatively agree with the expectations for a quasi two-dimensional compound, in which is still significant above .Fleury and Guggenheim (1970)
V.4 Crystal-field excitations and thermal expansion
Up to 600 K, the -axis lattice parameter shrinks with increasing temperature and the elongation of the octahedra is reduced. As a measure for the deviation from undistorted octahedra, we consider the difference between the apical Mn-O(2) and in-plane Mn-O(1) bond lengths, which amounts to 0.39 Å at 20 K and 0.37 Å at 300 K, i.e., it changes by more than 5%.Senff et al. (2005) The anisotropy of the thermal expansion has been interpreted as an indication for a change of the orbital occupation.Senff et al. (2005) The change of across may be rationalized in terms of the gain of magnetic energy with increasing (induced by an increase in ), but the change of suggests an orbital effect. On the basis of near-edge x-ray-absorption fine structure data, Merz et al. claimed a 15% occupation of - orbitals at room temperatureMerz et al. (2006a) as well as a transfer from - to - with decreasing temperature.Merz et al. (2006b)
Daghofer et al.Daghofer et al. (2006a, b) studied the competition of various exchange contributions. For =0, they find that - is occupied on each site for the case of antiferromagnetic order. The fact that - is favored instead is due to . Using eV 1160 K, Daghofer et al.Daghofer et al. (2006b) find a significant redistribution of electrons from - to - with increasing temperature. However, electrons in general are strongly coupled to the lattice; thus, one expects much larger values, e.g., 1 eV in LaMnO3.rueckamp05a The transmittance is a very sensitive probe for low-lying crystal-field excitations,rueckamp05a but in LaSrMnO4, we do not find any evidence for crystal-field excitations below the optical gap (see Fig. 5). Moreover, our multiplet calculation yields =1.4 eV (see Table 1), in agreement with the strongly elongated O octahedra. More recently, Rosciszewski and OlesRościszewski and Oleś (2007) pointed out that the - orbitals are occupied for eV.
According to the Franck-Condon principle, optical excitations are very fast and probe the static crystal-field splitting, i.e., for a frozen lattice. For the thermal activation, one has to consider the minimal crystal-field splitting after relaxation of the lattice. In optics, the peak frequency of a crystal-field absorption band corresponds to the static value (neglecting the phonon shift of 50-80 meV required for breaking the parity selection rule), whereas the onset of the absorption band can be identified with . Our transmittance data for =5 K clearly show that 0.4 eV 4600 K. Thus, we conclude that the thermal population of excited crystal-field levels, i.e., a local transfer of electrons from - to -, is not sufficient to explain the anomalous thermal expansion.
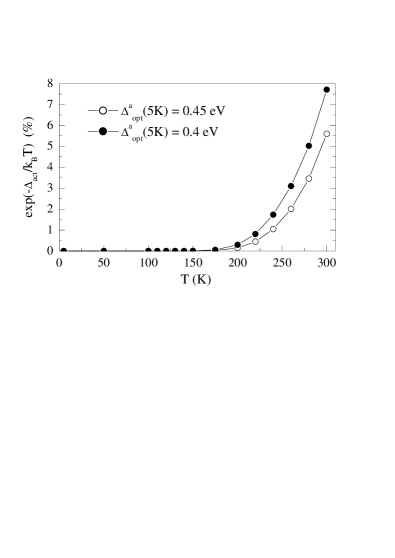
The lowest electronic excitation corresponds to the optical gap 0.4 eV. The optical absorption process corresponds to the creation of two particles: an electron and a hole in a conventional semiconductor or an “empty” site (here ) and a “double occupancy” (here ) in a Mott-Hubbard insulator. With the Fermi energy lying in the middle of the gap, the thermal activation energy for a single particle is only 0.2 eV. In contrast, a crystal-field excitation corresponds to a bound electron-hole pair, i.e., an exciton, for which . As discussed above, the lowest Mott-Hubbard excitation with a final state corresponds to the transfer of an electron from a - orbital to the - band, similar to the local crystal-field excitations in the scenario proposed by Daghofer et al.Daghofer et al. (2006a, b) However, the gain in kinetic energy of the delocalized final state is essential to obtain a small activation energy. A rough estimate of the thermally activated population of the - UHB is obtained from , using =0.4-0.45 eV at 5 K, the temperature dependence of depicted in Fig. 5(b) and . The result is shown in Fig. 10. With a population of more than 5% at 300 K, the thermal activation into the UHB is a reasonable candidate for the explanation of the anomalous thermal expansion, at least above 150 K. Note, however, that the shrinkage of the axis is already pronounced at lower temperatures.
Irrespective of the mechanism, we may ask to which extent our data support such a transfer. A change of the orbital occupation will slightly affect the orbital selection rule. One may speculate that the 10% increase of the SW of the CT excitations observed in the direction (see top panel of Fig. 3) and the simultaneous 10% decrease of SW in above 4 eV partially are due to a reduced occupation of - and a slightly enhanced occupation of -, respectively. This may explain the very similar dependence of the -axis lattice constantSenff et al. (2005) and above 4 eV. We emphasize that such a change of the orbital occupation of a few percent cannot explain the much more dramatic change of the SW of the lowest MH excitation around 2 eV.
Merz et al. reported a finite occupation of - at 80 K.Merz et al. (2006b) This cannot be attributed to a thermal population but may reflect the important role played by hybridization. Another possibility for deviations from the regular orbital occupation is the disorder on the La/Sr sublattice. Each Mn ion has eight La/Sr neighbors, but due to La/Sr disorder, one may have to consider sites with a local surplus of Sr (or La) ions. In Sr2MnO4, one finds Mn4+ ions. For a random La/Sr distribution, one expects that, e.g., about 1% of the Mn ions have seven or eight Sr neighbors. It is plausible that the configuration is not very stable at these sites, and one may speculate whether in this case - is preferable over - so that the electron can spread out further to neighboring sites. Typically, one expects that more loosely bound electrons will give rise to absorption features below the optical gap. Lee et al.lee07a reported a peak at about 0.6 eV in LaSrMnO4 at 10 K based on a Kramers-Kronig analysis of reflectivity data. They attributed this peak to impurities or O nonstoichiometry. Note that this peak at 0.6 eV has a maximum value of cm, whereas the maximum of peak (1) at 1 eV is only about 60 cm at 15 K [see inset of Fig. 2(b)]. This difference may point at a certain sample dependence of the data, supporting an interpretation in terms of impurities or disorder, but it may also reflect the problems of the Kramers-Kronig analysis. The room-temperature data of Moritomo et al.Moritomo et al. (1995) are in good agreement with our results. Above, we attributed both peaks (1) and (2) to the lowest MH excitation of the regular compound. The presence of two distinct peaks can be explained as a band structure effect. A very similar splitting has been observedKovaleva et al. (2004) in LaMnO3. We emphasize that the spectral weight of peak (1) is only small, its interpretation does not affect the assignment of all other peaks discussed above.
VI Conclusion
Using a local multiplet calculation, we analyze and of LaSrMnO4 from 0.75 to 5.8 eV. We arrive at a detailed peak assignment in terms of the multiplet splitting of charge-transfer and Mott-Hubbard excitations. We obtain an excellent description of the pronounced anisotropy and of the relative spectral weights of the different absorption bands. Applying the selection rules of an effective Mott-Hubbard model, the behavior of the lowest electronic excitations is described very well. In particular, the strong change of the spectral weight of the lowest excitation as a function of temperature can be attributed to the change of the nearest-neighbor spin-spin correlations in the Mott-Hubbard case. We thus conclude that LaSrMnO4 can effectively be discussed as a Mott-Hubbard insulator. In this sense, the lowest optical excitation is from a ground state to a final state.
The clear advantage of the multiplet calculation over, e.g., a much simpler discussion of the strong crystal-field limit is that it yields a description of the entire spectrum as well as a full set of effective parameters. We find =2.2 eV and =0.6 eV for the Coulomb interaction, =4.5 eV and =4.1 eV for the charge-transfer energy, and =1.2 eV, =0.2 eV, and =1.4 eV for the crystal-field splitting of the configuration. The rather small value of is the result of our effective model, which does not consider hybridization explicitly. Neglecting the hybridization most probably gives rise to the main shortcoming of our approach: it fails to describe quantitatively the anisotropy of the spectral weight, while the relative spectral weight of different peaks within is well described.
In transmittance measurements, we find =0.4-0.45 eV at 15 K for the onset of excitations across the optical gap and 0.1-0.2 eV at 300 K. Due to this small value, the thermal population of the UHB may explain the anomalous shrinkage of the -axis lattice parameter, at least above 150 K.
Acknowledgments
We acknowledge the support by the DFG via SFB 608 and thank J. Baier for the specific heat measurements.
Appendix: Optical-conductivity calculation
In the considered frequency range (0.75 - 5.8 eV), shows MH and CT excitations as well as the onset of higher-lying bands such as La(), Sr(), Mn(), and Mn().Jung et al. (1997) The latter correspond to the oscillator above the measured frequency range in the free fit (see Sec. III). The optical conductivity is calculated in arbitrary units by the Kubo formula.Dagotto (2003); Cuoco et al. (1999); Dressel and Grüner (2002); van der Marel (2004) For layered LaSrMnO4, we assume because two Mn sites in different layers are far apart and the interlayer hopping is only small. The Mott-Hubbard contribution reads
| (6) |
Here, denotes the in-plane Mn-O(1) bond length, =2 the two different spin orientations in the antiferromagnetic ground state (, ), and the indices , , , and label the many-particle eigenfunctions, i.e., refers to the th eigenfunction of the configuration with eigenenergy , , () creates (annihilates) an electron in the orbital , where and label the complex Mn orbitals, and the hopping matrix indicates the overlap between two orbitals via a bridging O ion. This matrix governs the orbital selection rules, it has been obtained from the Slater-Koster tabular.Slater and Koster (1954) The charge-transfer contribution for = or has been calculated analogously.Gössling (2007)
For each excitation, the multiplet calculation gives the peak frequency and the spectral weight, e.g.,
| (8) |
For the line shape, we assume a Lorentz oscillator [see Eq. (2)]. The peak width cannot be derived from our local model. As fit parameters, we employ for all CT excitations and for the MH peaks ( for the peaks below 2.6 eV to account for the larger width of the - band). For =15 K, we find =1.10 eV and =0.44 eV. The onset of higher-lying bands is described by one oscillator with eV, eV, and eV at =15 K, where only has been varied in the fit. The contribution to arising from all excitations lying at still higher energies is taken into account by =1.37 and =1.51. Since Eq. (6) is measured in arbitrary units, we use a global scaling factor for (with =24.83 from the fit). The anisotropy of is governed by the matrix elements. The hopping strength depends sensitively on the distance, (Ref. Harrison, 1999). For Mn-O distancesSenff et al. (2005) of =1.88 Å and =2.28 Å one expects . Using this value, we underestimate the spectral weight of the single peak observed at 5.6 eV in . Therefore, we scale and with the common factor . This failure of describing the anisotropy of the spectral weight quantitatively most probably reflects that we have neglected hybridization (see Ref. Gössling, 2007 for more details).
References
- Zaanen et al. (1985) J. Zaanen, G. A. Sawatzky, and J. W. Allen, Phys. Rev. Lett. 55, 418 (1985).
- Arima et al. (1993) T. Arima, Y. Tokura, and J. B. Torrance, Phys. Rev. B 48, 17006 (1993).
- Mizokawa and Fujimori (1996) T. Mizokawa and A. Fujimori, Phys. Rev. B 54, 5368 (1996).
- Moritomo et al. (1995) Y. Moritomo, T. Arima, and Y. Tokura, J. Phys. Soc. Jpn. 11, 4117 (1995).
- Jung et al. (1997) J. H. Jung, K. H. Kim, D. J. Eom, T. W. Noh, E. J. Choi, J. Yu, Y. S. Kwon, and Y. Chung, Phys. Rev. B 55, 15489 (1997).
- Quijada et al. (2001) M. A. Quijada, J. R. Simpson, L. Vasiliu-Doloc, J. W. Lynn, H. D. Drew, Y. M. Mukovskii, and S. G. Karabashev, Phys. Rev. B 64, 224426 (2001).
- (7) Y. S. Lee, T. Arima, S. Onoda, Y. Okimoto, Y. Tokunaga, R. Mathieu, X. Z. Yu, J. P. He, Y. Kaneko, Y. Matsui, N. Nagaosa, and Y. Tokura, Phys. Rev. B 75, 144407 (2007).
- Tobe et al. (2001) K. Tobe, T. Kimura, Y. Okimoto, and Y. Tokura, Phys. Rev. B 64, 184421 (2001).
- Kovaleva et al. (2004) N. N. Kovaleva, A. V. Boris, C. Bernhard, A. Kulakov, A. Pimenov, A. M. Balbashov, G. Khaliullin, and B. Keimer, Phys. Rev. Lett. 93, 147204 (2004).
- Ahn and Millis (2000) K. H. Ahn and A. J. Millis, Phys. Rev. B 61, 13545 (2000).
- Lee et al. (2005) J. S. Lee, M. W. Kim, and T. W. Noh, New J. Phys. 7, 147 (2005).
- Lee et al. (2002) J. S. Lee, Y. S. Lee, T. W. Noh, S.-J. Oh, J. Yu, S. Nakatsuji, H. Fukazawa, and Y. Maeno, Phys. Rev. Lett. 89, 257402 (2002).
- Kim et al. (2004) M. W. Kim, Y. S. Lee, T. W. Noh, J. Yu, and Y. Moritomo, Phys. Rev. Lett. 92, 027202 (2004).
- Rauer et al. (2006) R. Rauer, M. Rübhausen, and K. Dörr, Phys. Rev. B 73, 092402 (2006).
- Miyasaka et al. (2002) S. Miyasaka, Y. Okimoto, and Y. Tokura, J. Phys. Soc. Jpn. 71, 2086 (2002).
- Tsvetkov et al. (2004) A. A. Tsvetkov, F. P. Mena, P. H. M. van Loosdrecht, D. van der Marel, Y. Ren, A. A. Nugroho, A. A. Menovsky, I. S. Elfimov, and G. A. Sawatzky, Phys. Rev. B 69, 075110 (2004).
- Khaliullin et al. (2004) G. Khaliullin, P. Horsch, and A. M. Oleś, Phys. Rev. B 70, 195103 (2004).
- Oleś et al. (2005) A. M. Oleś, G. Khaliullin, P. Horsch, and L. F. Feiner, Phys. Rev. B 72, 214431 (2005).
- Gössling et al. (2006) A. Gössling, R. Schmitz, H. Roth, M. W. Haverkort, T. Lorenz, J. A. Mydosh, E. Müller-Hartmann, and M. Grüninger, arXiv:cond-mat/0608531 (unpublished).
- Reutler et al. (2003) P. Reutler, O. Friedt, B. Büchner, M. Braden, and A. Revcolevschi, J. Cryst. Growth 249, 222 (2003).
- Larochelle et al. (2005) S. Larochelle, A. Mehta, L. Lu, P. K. Mang, O. P. Vajk, N. Kaneko, J. W. Lynn, L. Zhou, and M. Greven, Phys. Rev. B 71, 024435 (2005).
- Senff et al. (2005) D. Senff, P. Reutler, M. Braden, O. Friedt, D. Bruns, A. Cousson, F. Bourée, M. Merz, B. Büchner, and A. Revcolevschi, Phys. Rev. B 71, 024425 (2005).
- Kriener (2005) M. Kriener, Ph.D. thesis, University of Cologne (2005).
- (24) W. B. Wu, D. J. Huang, G. Y. Guo, H. J. Lin, T. Y. Hou, C. F. Chang, C. T. Chen, A. Fujimori, T. Kimura, H. B. Huang, A. Tanaka, and T. Jo, J. Electron. Spectrosc. Relat. Phenom. 137-140, 641 (2004).
- Park (2001) K. T. Park, J. Phys.: Condens. Matter 13, 9231 (2001).
- Kuepper et al. (2006a) K. Kuepper, R. Klingeler, P. Reutler, B. Büchner, and M. Neumann, J. Appl. Phys. 99, 08Q308 (2006a).
- Kuepper et al. (2006b) K. Kuepper, R. Klingeler, P. Reutler, B. Büchner, and M. Neumann, Phys. Rev. B 74, 115103 (2006b).
- Merz et al. (2006a) M. Merz, P. Reutler, B. Büchner, D. Arena, J. Dvorak, Y. U. Idzerda, S. Tokumitsu, and S. Schuppler, Eur. Phys. J. B 51, 315 (2006a).
- Merz et al. (2006b) M. Merz, G. Roth, P. Reutler, B. Büchner, D. Arena, J. Dvorak, Y. U. Idzerda, S. Tokumitsu, and S. Schuppler, Phys. Rev. B 74, 184414 (2006b).
- Daghofer et al. (2006a) M. Daghofer, A. M. Oleś, D. R. Neuber, and W. von der Linden, Phys. Rev. B 73, 104451 (2006a).
- Daghofer et al. (2006b) M. Daghofer, D. R. Neuber, A. M. Oleś, and W. von der Linden, Phys. Status Solidi B 243, 277 (2006b).
- Azzam and Bashara (1987) R. M. A. Azzam and N. M. Bashara, Ellipsometry and Polarized Light (Elsevier, New York, 1987).
- Gössling (2007) A. Gössling, Ph.D. thesis, University of Cologne, 2007; http://nbn-resolving.de/urn:nbn:de:hbz:38-21379
- Dressel and Grüner (2002) M. Dressel and G. Grüner, Electrodynamics of Solids: Optical Properties of Electrons in Matter (Cambridge University Press, Cambridge, 2002).
- Cardona (2005) M. Cardona, Solid State Commun. 133, 3 (2005).
- Cardona and Thewalt (2005) M. Cardona and M. Thewalt, Rev. Mod. Phys. 77, 1173 (2005).
- Sugano et al. (1970) S. Sugano, Y. Tanabe, and H. Kaminura, Multiplets of Transition-Metal Ions in Crystals, Pure and Applied Physics, Vol. 33 (Academic, New York, 1970).
- (38) M. W. Haverkort, PhD thesis, University of Cologne, 2005; http://nbn-resolving.de/urn:nbn:de:hbz:38-14558, arXiv:condmat/0505214.
- (39) Within the Kanamori scheme, and . With =11.42 eV and =7.42 eV, this corresponds to eV and eV. In contrast, the simple scheme uses eV and eV.
- Harrison (1999) W. A. Harrison, Elementary Electronic Structure (World Scientific, Singapore, 1999).
- Okimoto et al. (1995) Y. Okimoto, T. Katsufuji, Y. Okada, T. Arima, and Y. Tokura, Phys. Rev. B 51, 9581 (1995).
- Imada et al. (1998) M. Imada, A. Fujimori, and Y. Tokura, Rev. Mod. Phys. 70, 1039 (1998).
- (43) R. Rückamp, E. Benckiser, M. W. Haverkort, H. Roth, T. Lorenz, A. Freimuth, L. Jongen, A. Möller, G. Meyer, P. Reutler, B. Büchner, A. Revcolevschi, S.-W. Cheong, C. Sekar, G. Krabbes, and M. Grüninger, New J. Phys. 7, 144 (2005).
- Ballhausen (1962) C. J. Ballhausen, Introduction to Ligand Field Theory (McGraw-Hill, New York, 1962).
- Wu (2007) Hua Wu (unpublished).
- (46) S. Grenier, J. P. Hill, V. Kiryukhin, W. Ku, Y.-J. Kim, K. J. Thomas, S.-W. Cheong, Y. Tokura, Y. Tomioka, D. Casa, and T. Gog, Phys. Rev. Lett. 94, 047203 (2005).
- Feiner and Oleś (1999) L. F. Feiner and A. M. Oleś, Phys. Rev. B 59, 3295 (1999).
- Khaliullin (2005) G. Khaliullin, Prog. Theor. Phys. Suppl. 160, 155 (2005).
- Fleury and Guggenheim (1970) P. A. Fleury and H. J. Guggenheim, Phys. Rev. Lett. 24, 1346 (1970).
- Rościszewski and Oleś (2007) K. Rościszewski and A. M. Oleś, J. Phys.: Condens. Matter 19, 186223 (2007).
- Dagotto (2003) E. Dagotto, Nanoscale Phase Separation and Colossal Magnetoresistance (Springer, New York, 2003).
- Cuoco et al. (1999) M. Cuoco, P. Horsch, and F. Mack, Phys. Rev. B 60, R8438 (1999).
- van der Marel (2004) D. van der Marel, Strong Interactions in Low Dimensions, Physics and Chemistry of Materials with Low-Dimensional Structures, Vol. 25 (Kluwer, Dordrecht, 2004), Chap. 8, p. 237.
- Slater and Koster (1954) J. C. Slater and G. F. Koster, Phys. Rev. 94, 1498 (1954).