Radio Source Heating in the ICM: The Example of Cygnus A
Abstract
One of the most promising solutions for the cooling flow problem involves energy injection from the central AGN. However it is still not clear how collimated jets can heat the ICM at large scale, and very little is known concerning the effect of radio lobe expansion as they enter into pressure equilibrium with the surrounding cluster gas. Cygnus A is one of the best examples of a nearby powerful radio galaxy for which the synchrotron emitting plasma and thermal emitting intracluster medium can be mapped in fine detail, and previous observations have inferred possible shock structure at the location of the cocoon. We use new XMM-Newton observations of Cygnus A, in combination with deep Chandra observations, to measure the temperature of the intracluster medium around the expanding radio cavities. We investigate how inflation of the cavities may relate to shock heating of the intracluster gas, and whether such a mechanism is sufficient to provide enough energy to offset cooling to the extent observed.
1 Introduction
Cygnus A (3C 405) is the most radio-luminous Active Galactic Nucleus (AGN) to a redshift of , and is the third-brightest source in the radio sky. Its power ( W Hz sr-1) and its proximity () have made it one of the most studied extra-galactic sources.
In X-rays Cygnus A was first observed with the Uhuru satellite. Later Einstein Observatory arnaud84 and ROSAT observations hcp94 ; rf96 have shown that the X-ray emission is dominated by the thermal radiation from intra-cluster medium (ICM) and found that the gas in the inner 50 kpc is significantly cooler than the ICM at larger scale, with an inferred cooling flow rate of M⊙ yr-1.
The large scale temperature distribution of the ICM was mapped with ASCA msv99 , and suggests a merging event between two similar clusters, the one hosting Cyg A and a secondary cluster detected to the north-west (NW), at a projected distance of 11.5 arcmin ( kpc) . The merger scenario is in agreement with the galaxy distribution (owenetal97 ; lom05 ).
More recently, Cygnus A has been studied with Chandra. The jet and hotspots are clearly detected and coincide with the radio. The magnetic field properties of the hotspots of the radio galaxy were studied by wys00 , while youngetal02 focused on the X-ray emission from the nucleus. The large scale structure and the interaction between the radio source and the ICM was discussed by smithetal02 and wsy06 . The central 2.5 arcmin ( kpc) are characterised by a filamentary structure of spiral-like shape with the nucleus at its centre (named “belts” by smithetal02 ). Chandra also detects, with a finer resolution than ROSAT HRI, the edge-brightened emission around the cavity coincident with the radio lobes (carillietal94 ). This elliptically shaped structure encompassing the whole radio source has a major axis of arcmin ( kpc) coincident with the direction of the radio jet, and has been interpreted as the cocoon of shocked gas due to the expansion of the radio galaxy (wsy06 ).
In this paper we present new XMM-Newton data of Cygnus A. The larger field of view (FoV) and sensitivity of XMM-Newton allow us to reveal new features in the X-ray emission from the cluster environment of this object. We discuss the effect of the radio galaxy on heating and cooling of the ICM.
2 X-ray observations
Cygnus A was observed with XMM-Newton in October 2005 in two separate exposures of 22 ks (ObsIDs 0302800101) and 19 ks (ObsIDs 0302800201) respectively. In this preliminary work we use local background for the analysis of the central 5 arcminutes, while the X-ray background is modelled for the large scale structure analysis using blank-sky background.
In this paper we also present a new analysis of the Chandra data. Chandra observed Cyg A in different exposures ranging from 0.8 to 59 ks, for a total combined exposure of 213 ks. Only one of the observations was obtained with the ACIS-S as primary instrument (Obs ID 360). Here we only use 120 ks, by excluding the shorter exposures and the ACIS-S observation for simplicity.
3 Heating
smithetal02 and wsy06 used 20 and 50 ks Chandra observations to measure variations of temperature across the edge-brightened structure suggesting the detection of the shock of Mach number 1.3 associated with the cocoon as expected in models of radio bubble expansion (e.g. bc89 ). This implies that the simple model in which the expansion of the radio lobes is able to heat the surrounding gas, with the effect of a shock at the edge of the cocoon, is reasonably verified for Cygnus A. The analysis of wsy06 measures a temperature of 6 keV within the cocoon and a temperature of 4.6() keV outside it (see Figure 3 of wsy06 ).
3.1 Results
We used the higher sensitivity of XMM-Newton to try to verify the Chandra results. In both Chandra and XMM-Newton observations there is a rather sharp surface brightness edge at the location of the possible cocoon, which is more clear in the Chandra image thanks to the 1 arcsec Point Spread Function (PSF).
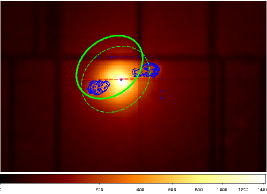
We generated a temperature map of Cygus A using the wavelength algorithm described in bourdin04 . (The new version of this method includes a model of the X-ray background in addition to the particle background). Figure 1 shows the temperature map of the Cygnus A cluster in the whole field of view of XMM-Newton. The large scale structure is clearly complex and shows regions of high temperature gas, mostly associated with the merging of the main cluster with the object detected to the NW. We will discuss the merging event in detail in Belsole et al. (in prep.). In Figure 1, right, we show the temperature distribution of the central 5 arcmin. The contours are the radio emission at 1.4 GHz. The core and hotspots were masked while generating the temperature map and thus appear as holes in the figure.
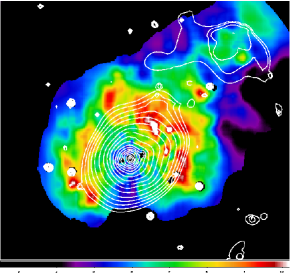
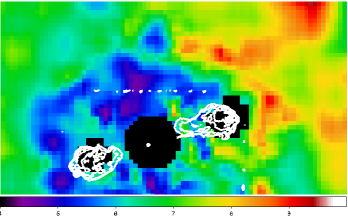
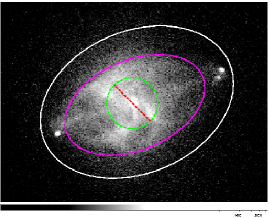
Figure 2 left, shows a combined Chandra image in the energy band 0.5-7.0 keV. The superimposed elliptical regions were used to evaluate the temperature inside and outside the cocoon with XMM-Newton. We measure a temperature inside the cocoon (inner ellipse) of keV and a temperature in the elliptical annulus just outside the cocoon of keV. The temperature of the ICM further out is found to be around 7 keV.
We observe that there is an arc-shaped region at the termination of the NW lobe (Fig. 1, right). This region is found to be at k keV, which is significantly higher than the temperature of the surrounding areas both closer to the centre (at the location of the hotspot and within the cocoon) and further out.
3.2 Discussion
The higher sensitivity of XMM-Newton allows a more precise measurement of the temperature, but some features may be washed out because of the PSF. The surface brightness edge observed neatly with Chandra is not as sharp with XMM-Newton and the radial profile does not show any obvious discontinuity. At a distance of arcmin from the centre, we detect a hot, k=[9-11] keV, horse-shoe-shape area that we associate with the merging event. This may partially explain why we measure a higher temperature far from the cocoon. However, the temperature of the belts (Fig. 2) is significantly cooler than the immediate surrounding, in agreement with wsy06 . With the XMM-Newton data we show that the temperature inside and outside the cocoon are in fact in agreement. This is not in disagreement with the results of wsy06 , as once statistical errors in their analysis are taken into account, the two temperatures they measure (inside and outside the cocoon) are in fact consistent.
The arc-shaped hot region may be associated with the bow shock due to the expansion of the radio lobes in the NW direction. Assuming Rankine-Hugoniot jump conditions, the shock (12.8 keV) and pre-shock (8.6 keV) temperature yield a Mach number of 1.62, or gas moving at a velocity of 2450 km s-1. However, we are not able to explain why we observe a shock in the NW direction while the SE lobe shows a cooled region in front of it.
4 Cooling
In this section we discuss a possible detection of cool gas in the centre of the Cygnus A cluster.
The predicted mass of cool gas in “cooling core” clusters is inconsistent with the observed mass contained in stars and molecular gas (see e.g., McNamara and Crawford, these proceedings). The hypothesis which is mostly supported today is that the gas is prevented from cooling by some heating mechanisms that appear to be related to the AGN activity (e.g., Birzan04 , pf05 for a review). However, there is the possibility that cold material is present, but is not easy to detect or may be detected under special conditions only. Clouds of cold material can be observed by their fluorescent line at 6.4 keV, but their detection may depend on the optical depths, the shape of the emitting region and the covering fraction (e.g., White1991 ; Churazov98 ).
4.1 Results
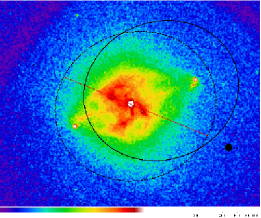
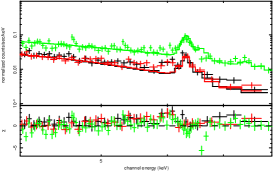
We extracted spectra of the central region of Cygnus A cluster at increasing distance from the centre and in different directions: taking as the axis of symmetry the jet line, spectra were extracted in 3 elliptical annular sectors (crescent-shape regions) in the direction orthogonal to the jet and at a mean distance of 25, 50, and 65 arcsec, to the NE and the SW. Two more spectra were extracted in the cavities occupied by the radio lobes. Figure 3 shows the most distant annular sector to the NE. The spectrum of this region is fitted with a thermal model of temperature k) keV. The fit is not excellent and the reduced of 1.4 is due to a significant residual at the position of the neutral Fe line at 6.4 keV (Figure 3, top left). The addition of a power law and a neutral 6.4 keV line (of equivalent width 210 eV) to the model significantly improves the fit and accounts for the residual at the Fe line position (Figure 3, bottom right).
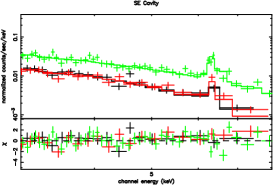
The spectrum obtained in the SE lobe cavity (Figure 3), which is at a slightly closer distance of 40 arcsec to the nucleus, does not show the emission line at 6.4 and is adequately fitted with a thermal model at k keV (we also account for a possible inverse-Compton component associated with the radio lobes).
4.2 Discussion
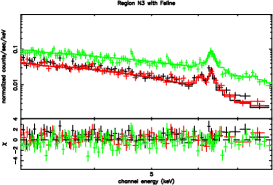
The results described above suggest the presence of cold gas observed through its fluorescent line at 6.4 keV Churazov98 . The XMM-Newton PSF is a major concern here as the nucleus spectrum also has a strong neutral Fe line emission. We will discuss in detail the core spectrum in a separate paper. However, the XMM-Newton PSF is rather circular (with the MOS 2 camera showing a more triangular shape), and it would be difficult to explain why we detect Fe 6.4 keV line emission from a region at 65 arcsec to the NE of the nucleus but not from a closer region in the jet direction, corresponding to the cavity of the SE radio lobe. Inspection of Chandra data is a natural choice to confirm our detection. Using the ACIS-I observations, we generated a merged image in the energy bands 5335-5665 eV (A), 5820-6150 (B, or the Fr 6.4 keV line), 6180-6410 eV (C, or the Fe 6.7 keV line), and 6835-7165 eV (D). We then interpolated the continuum under the lines using images A and D, and by subtracting the continuum to the line image, we generated the images of the neutral (fluorescent) Fe line and the ionised (ICM) Fe K line in order to localise the regions with significant Fe line emission. We find that there are several, patchy regions where the neutral line emission is detected at sigma above the background and some of these regions correspond to a lack of emission at 6.7 keV. However, a precise spectral analysis is not possible with the low photon statistics (we will discuss these results in a forthcoming paper). The areas which shows the patchy 6.4 keV emission are at a distance from the nucleus which is still affected by the XMM-Newton PSF, so no conclusive answer can yet be drawn from this analysis. However, we find that the luminosity of the neutral emission line in region N3 is consistent with the expected ratio between the fluorecent line and the K-edge kk87 for reflecting clouds illuminated by the AGN (assuming a covering fraction of at their distance from the core). We notice that the global spectrum described in smithetal02 , which excludes the nuclear area, also shows excess emission at the position of the 6.4 emission line (see Figure 7 of smithetal02 ). However, the authors do not discuss their residuals. A deeper investigation of this detection is needed using both XMM-Newton and Chandra.
5 Summary and preliminary conclusions
We have presented new XMM-Newton data of Cygnus A and we have re-analysed 120 ks Chandra observations. We find that the ICM temperature distribution of the cluster hosting the radio galaxy Cygnus A is complex and at least some of this complexity is due to the merging event with a secondary cluster detected to the NW. With both XMM-Newton and Chandra we detect an elliptically-shaped sharp edge in the gas surface brightness, with a major axis similar to the distance between the two hotspots. This is interpreted as the predicted cocoon of shocked gas due to the expansion of the radio lobes. However no significantly different temperature is detected inside and outside the cocoon.
We may have detected a shock associated with the expansion of the lobes along the major axis at the location of the NW lobe, with a bow shock of Mach number 1.6, which may be a lower limit due to the projected hot gas at large scale. However we are unable to explain the apparent cold gas associated with the edge of the SE lobe.
Using XMM-Newton we may have spectrally detected excess emission at 6.4 keV in the preferred axis orthogonal to the jet direction. This may be due to fluorescent line from geometrically small, optically thin cold clouds reflecting photons from the core and the hot gas in the cocoon. Although contamination of the Cygnus A core due to the XMM-Newton PSF is likely, this cannot explain the axis-asymmetry we observe, since in the direction of the jet no 6.4 keV emission line is detected.
6 Acknowledgements
We are very grateful to the local committee for this very well organised conference with plenty of interesting results. We also thank Giovanni Miniutti and Gabriel W. Pratt for useful discussion, Hervé Bourdin for providing a user-friendly version of the temperature map algorithm and Roderick Johnstone for technical support.
References
- (1) Arnaud, K.A., Fabian, A.C., Eales, S.A., Jones, C., Forman, W., 1984, MNRAS, 211, 981
- (2) Begelman, Mitchell C., Cioffi, Denis F., 1989, ApJ, 345, 21
- (3) Birẑan L., Rafferty, D.A., McNamara, B.R., Wise, M.W., Nulsen, P.E.J., 2004, ApJ, 607, 800
- (4) Bourdin, H., Sauvageot, J.-L., Slezak, E., Bijaoui, A.; Teyssier, R., 2004, A&A, 414, 429
- (5) Carilli, C. L., Perley, R. A., Harris, D. E., 1994, MNRAS, 270. 173
- (6) Churazov, E., Sunyaev, R., Gilfanov, M., Forman, W., Jones, C., 1998, MNRAS, 297, 127
- (7) Harris, D.E., Carilli, C.L., Perely, R.A., 1994, Nat., 367, 713
- (8) Krolik, J.H., Kallman, T. R., 1987, 320, L5
- (9) Ledlow, M.J., Owen, N.O., Millar, N.A., 2005, AJ, 130, 47
- (10) Markevitch, M., Sarazin, C.L., Vikhlinin, A., 1999, ApJ, 521, 526
- (11) Owen, F.N., Ledlow, M.J., Morrison, G.E., Hill, J.M., 1997, ApJ, 488, L15
- (12) Peterson, J.R., Fabian, A.C., 2005,
- (13) Reynolds, C.S, Fabian, A.C., 1996, MNRAS, 278, 479
- (14) Smith, D.A., Wilson, A.S., Arnaud, K.A., Terashima, Y., Young, A.J., 2002, ApJ, 565, 195
- (15) Wilson, A.S., Young, A.J., Shopbell, P.L., 2000, ApJ, 544, L27
- (16) Wilson, A.S.,Smith, D.A., Young, A.J., 2006, ApJ, 644, L9
- (17) Young, A.J., Wilson, A.S., Terashima, Y., Arnaud, K.A. Smith, D.A., 2002, ApJ, 564, 176
- (18) White, D. A., Fabian, A. C., Johnstone, R. M., Mushotzky, R. F., Arnaud, K. A., 1991, MNRAS, 252, 72