Search for Pulsar Wind Nebula Association with Unidentified TeV Ray Sources
Abstract
Many of the recently discovered TeV ray sources are associated with pulsar wind nebulae (PWNe). In fact, they represent the most populous class of Galactic sources at TeV energies. In addition, HESS has also discovered, in a survey of the Galactic plane, a population of TeV ray sources that are still without definitive counterparts at longer wavelengths. For a number of these sources, a pulsar is an evident association, which is often located within an extended region of the TeV ray emission. These particular HESS sources are promising candidates for yet not resolved pulsar wind nebulae. Here we have undertaken a systematic search for X-ray counterparts of the sources, using the archival Chandra data, within the spatial bounds of the unidentified HESS sources. A number of X-ray sources have been detected in the Chandra fields. Two of them, CXOU J161729.3-505512 and CXOU J170252.4-412848, are of a special interest because of their excellent positional coincidence with the pulsars PSR J1617-5055 and PSR J1702-4128, respectively. The first source is extended, with a bright core of (FWHM) in radius but the emission can be seen up to roughly . The second one is much fainter and detected only with marginal significance (). It might also be slightly extended, although the situation is quite uncertain due to very limited statistics. The analysis of the archival Chandra data for a middle-aged pulsar (PSR J1913+1011) does not reveal any statistically significant excess at and around the position of the pulsar or the center of gravity of its plausible TeV ray counterpart (HESS J1912+101). We discuss the implications of the results.
1 Introduction
The charged particles accelerated in the vicinity of a pulsar flow out into the supernova (SN) ejecta and form a shock. The shock may further accelerate particles to relativistic speeds. These particles interact with the surrounding medium to produce a pulsar wind nebula (PWN), which is often observable at radio and X-ray wavelengths. Around the youngest, most energetic pulsars, the radio emitting parts of these nebulae are rather amorphous, whereas the X-ray emitting regions can be highly structured (Gaensler & Slane, 2006). The unprecedented spatial resolution of Chandra has made it possible to resolve these structures. The spatial extent and morphology of X-ray nebulae can vary from a toroidal (or arc-like) nebulae with perpendicular jets to the prominent tails behind the moving pulsars, indicative of bow shocks. The review of recent Chandra observational results on PWNe was given in Kargaltsev & Pavlov (2008).
It was widely believed that PWNe could be sources of very high-energy (VHE) ray emission. The emission may arise from inverse Compton scattering of low-energy photons by the relativistic electrons, while the X-ray emission may be associated with the synchrotron radiation from the same electrons. The best example is the Crab Nebula, which was established as a source of pulsed GeV rays by EGRET (Nolan et al., 1993) and of steady TeV rays by ground-based Čerenkov detectors (Aharonian et al., 2006a). The TeV emission is thought to originate in its PWN (de Jager & Harding, 1992). Recently, the HESS array of four imaging Čerenkov telescopes have detected many TeV sources, a number of which are evidently associated with PWNe. Such associations usually rest on positional and morphological match of VHE ray sources with known PWNe. It is worth noting that in many cases the pulsar and associated PWN are significantly offset from the center of the TeV source. The offset could be attributed to the interaction between the PWN and the SNR (Blondin et al., 2001).
A survey of the inner part of the Galactic Plane was performed with HESS between 30∘ in longitude and 3∘ in latitude relative to the Galactic Center. Fourteen previously unknown, extended sources were detected with high significance (Aharonian et al., 2005, 2006b). Recently, the survey region has been extended to cover the longitude range out to +60∘ (Aharonian et al., 2008a), leading to the discovery of five new TeV sources. The HESS sources are likely Galactic in origin, given their concentration around the Galactic plane. The ray flux of these sources varies from about 3% to 25% of that of the Crab Nebula. Most of them show rather hard energy spectra and are spatially extended, with the angular size of a few tenths of a degree. Some of the sources have fairly well-established counterparts at longer wavelengths, based exclusively on positional coincidence, but others have none at all. A number of proposals have been made on the nature of these unidentified TeV sources. At present, PWNe and shell-type SNRs are considered to be most probable, although other possibilities also exist.
Observationally, a PWN often manifests itself as extended X-ray emission around a pulsar. The positional coincidence of such an object with an unidentified TeV source would strongly support the scenario that X-rays and TeV rays are both powered by the PWN. For example, HESS J1804-21, one of the brightest and most extended sources discovered in the HESS Galactic plane survey, contains the Vela-like pulsar PSR J1803-2137 at distance of about (Aharonian et al., 2005). The pulsar has a spin-down age of about and a spin-down power of about , which makes it among the top 20 pulsars as ranked by spin-down flux and thus a candidate to produce an X-ray emitting PWN (Manchester et al., 2005). Recently, using an archival 30-ks Chandra observation of PSR J1803-2137, Cui & Konopelko (2006,2007) discovered significantly extended X-ray emission around the pulsar (see also Kargaltsev et al. (2007)), indicating the presence of a PWN. The emission has a very hard spectrum, which is well described by a power law with photon index of about 1.2. The spatially-averaged flux is in the 0.3–10 keV band. The PWN is offset from the center-of-gravity of HESS J1804-21 by about 10′. It is elongated, perpendicular to the pulsar’s proper motion, suggesting that its X-ray emission probably emerges from a torus associated with the termination shock in the equatorial pulsar wind. Another example is HESS J1809-193 and its plausible association with the pulsar PSR J1809-1917. Kargaltsev & Pavlov (2007) has detected extended X-ray emission around the pulsar with Chandra, which is attributed to a PWN. As in the case of HESS J1804-21, the PWN is also significantly offset from the center-of-gravity of HESS J1809-193 (by about 8′).
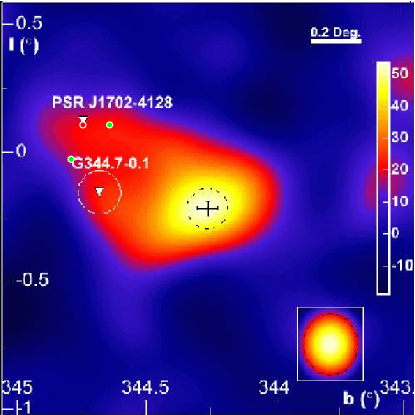
There are several more HESS sources that also seem to be associated with pulsars but no corresponding PWNe have been seen yet. HESS J1912+101 contains PSR J1913+1011 (Aharonian et al., 2008b), which is a rather old pulsar with a spin period of 36 ms and a spin-down age of yrs, at a distance of 4.5 kpc. A radio pulsar was also detected in the Parkes Pulsar Survey, PSR J1702-4128, near the tip of a tail-like extension of HESS J1702-420 (Kramer et al., 2003). It is a younger pulsar with a spin period of 182 ms and a spin-down age of about 55000 yrs and is located at a distance of about 5.2 kpc. Finally, PSR J1617-5055 is located near the edge of HESS J1616-508. It is an X-ray emitting, young pulsar with a spin period of 69 ms and a spin-down age of about 8000 yrs and is at a distance of about 6.5 kpc (Torii et al., 1998). In this work, we have undertaken a systematic search for extended X-ray emission associated with PSR J1702-4128, PSR J1913+1011, and PSR J1617-5055, using data from the archival Chandra observations, to take advantage of the superior spatial resolution of Chandra. We have analyzed all Chandra fields that contain the pulsars. The results from imaging and spectral analyses are reported here.
2 Data Analysis and Results
The Chandra data were extracted from the archival observations of RCW 103 (ObsID #970), PSR J1617-5055 (ObsID #6684), PSR J1702-4128 (ObsID #4603), and PSR J1913+1011 (ObdID #3854) with total exposure times of about 19 ks, 57 ks, 10.5 ks, and 19 ks, respectively. The data were all taken with the ACIS detector. Table 1 summarizes some of the key characteristics of these observations.
The data were reduced and analyzed with the standard CIAO analysis package (version 3.4), along with CALDB 3.4.0. For ObsID #907, we followed the CIAO Science Threads111See http://asc.harvard.edu/ciao/threads/index.html to prepare, filter, and reprocess the Level 1 data to produce Level 2 data for subsequent analyses. For all other observations, we simply started with the Level 2 data that were derived from the archive, because they already incorporated the updated calibrations.
2.1 Imaging Analysis
We carried out a search for discrete sources in the 0.5–10 keV energy band with celldetect. This tool utilizes a sliding detection cell algorithm. The detection cell size was chosen to match the width of the local point spread function (PSF). Here we adopted default values for all key parameters. For example, the size of the detection cell corresponds to the 80% encircled energy area of the PSF and the signal-to-noise ratio threshold was set to 3. We excluded spurious detections in the vicinity of significant exposure variations, such as the detector edges or chip gaps etc. We estimated the statistical significance of each detection using the statistical method of Li & Ma (1983). For that we used the output of celldetect, which includes the sizes of the source and background regions, as well as the total number of counts extracted from the regions. Table 2 summarizes the sources detected with a statistical significance greater than 4.
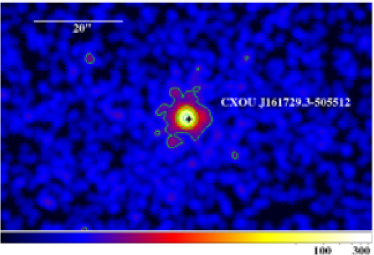
For ObsID #970, a total of ten sources were detected, including two sources on each of the I2, I3, and S4 chips and four sources on the S2 chip, respectively. CXOU J161729.3-505512 coincides spatially with PSR J1617-15055, which makes it a plausible counterpart of HESS J1616-508. The source shows no apparent extension in this data set. However, a subsequent observation of longer exposure (ObsID #6684) enabled us to resolve it as an extended X-ray source. To better identify the diffuse emission we ran wavdetect on this data set, and found that the effective of the derived count distribution is about 2.36 times that of the PSF at the location of the source, indicating that the emission is significantly extended. Figure 1 shows an expanded view of the vicinity of CXOU J161729.3-505512. From the raw count images, we constructed the radial profile of the source. Fitting the profile with a Gaussian function (plus a constant background) that is convolved with the local PSF resulted in a source extension of about 5.280.05 pixels (FWHM), which corresponds to about . However, the image also seems to show a more extended component of the emission. To minimize the effects of asymmetry, we made a linear profile of the emission along right ascension, as shown in Figure 2, with the PSF overlaid for comparison. We can clearly see that the emission extends up to roughly in both directions.
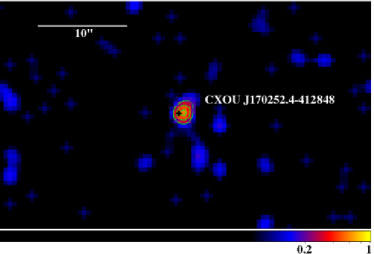
In ObsID #4603, we detected one source on each of the I2 and S3 chips but observed no apparent X-ray emission around the position of PSR J1702-4128. Only after we lowered the signal-to-noise threshold used by celldetect down to 1.5, an X-ray source (CXOU J170252.4-412848) emerged. To evaluate the statistical significance of the detection, we extracted source counts from a circular region of 7 pixels in radius and background counts from another circular region of 20 pixels in radius. Based on the Li & Ma method, we derived a significance of about 4.6. We also ran wavdetect on this Chandra field and found that the effective of the count distribution is about 1.46 times that of the PSF at the location of the source, suggesting that CXOU J170252.4-412848 might also be a slightly extended source. There are too few counts to meaningfully quantify the extension. The image is also shown in Figure 1. The source is located almost exactly at the position of the pulsar, which makes it a plausible X-ray counterpart of the latter.
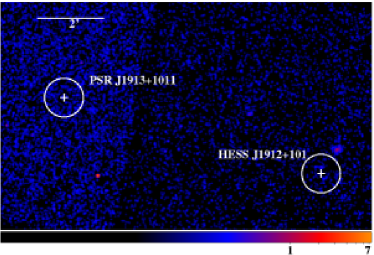
For ObsID #3854, a few sources have been detected one of them on the I2 chip, three others on each of the S2 and S3 chips, and two more on the S4 chip. No apparent X-ray emission can be seen around the position of PSR J1913+1011 nor near the center-of-gravity of HESS J1912+101. We also carried out more sensitive searches, with wavdetect, for faint extended emission at both locations but failed to detect any. To derive flux upper limits, we used a circular source region of a 35 radius around each of the positions and a similar circular background region nearby. The measured count rates were converted into the corresponding fluxes by adopting the line-of-sight hydrogen column densities (Dickey & Lockman, 1990) and assuming a power-law spectrum of photon index 2. The results are summarized in Table 3.
We searched through the SIMBAD and NED databases for the counterparts of all detected sources within an angular offset of less than from each source. Besides the pulsars of interest, two of the sources, CXOU J161723.7-505150 and CXOU J191316.1+100902, appear to be associated with the stars, HD 146184 and HD 179712, respectively. In addition, two other sources, CXOU J161727.9-505549 and CXOU J191338.4+101200, are about and away from IRAS 16137-5048 and IRAS 19112+1007, respectively.
2.2 Spectral Analysis
The CIAO tool specextract was used to extract the X-ray spectrum of CXOU J161729.3-505512, which is possibly a PWN associated with the pulsar PSR J1617-5055. We used a circular region of a 50 pixel radius (25) centered on the best-fit position of the source to extract source counts and a concentric annulus with an inner radius of 60 pixels and an outer radius of 100 pixels to extract background counts. This tool enabled to generate both the overall (source+background) and background spectra, as well as the corresponding response matrix files and auxiliary response files for subsequent spectral modeling.
We modeled the spectra with XSPEC (Arnaud, 1996). The data points below 0.3 keV or above 10 keV were excluded an the remaining data rebinned to achieve at least 15 counts in each energy bin. The obtained spectrum can be fitted very well with an absorbed power-law model, as shown in Figure 3, with a reduced about 0.94 for 660 degrees of freedom. The best-fit parameters are shown in Table 3. We should note that the pile-up effects are quite small (3%), thanks to the 1/4–subarray readout mode adopted.
We attempted the same analyses for CXOU J170252.4-412848 (but with the source and background regions used in the imaging analysis). Only about 11 net source counts were obtained, which is too few to warrant any reliable spectral modeling. Purely for the purpose of estimating the flux of the source, we fitted the data to an absorbed power-law spectrum with the photon index fixed at . The flux is erg cm-2 s-1 in 0.3 – 10 keV energy band. These results are also shown in Table 3.
3 Discussion
One of the most significant recent developments in high energy astrophysics is the detection of a wide variety of ray sources at the very high-energy energies (above 100 GeV; see, e.g., Cui (2006), for a review). Identifying counterparts of these sources at other longer wavelengths can help unveiling the physical mechanism responsible for the VHE ray emission. Among the Galactic VHE ray sources PWNe represent the most populous class. In many cases the association of a VHE ray source with a PWN is established by combining the positional and morphological similarities observed in various wavelength ranges. Further support comes from the successful modeling of their broadband multi-wavelength energy spectra. In some cases the evidence for an association is less compelling or non-existent and thus requires further observations. A strong argument in favor of plausible association of a PWN with the a VHE ray source is the relatively low integral efficiency needed to convert some of the pulsar’s spin-down luminosity to VHE rays (e.g., see, Gallant (2006)). If one defines the efficiency as , where is the integral VHE ray flux above 300 GeV measured with the HESS instrument, it ranges from roughly 1% to 10% for most of the known TeV sources that are associated with PWNe. Two caveats should be pointed out. First of all, the pulsar distance is often poorly determined. Secondly, this approach largely elides any substantial change in pulsar’s spin-down luminosity during early evolution of the pulsar and its PWN.
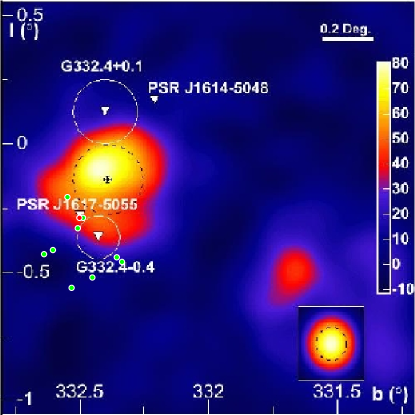
In this work, we used archival Chandra data to search for X-ray counterparts of three unidentified TeV ray sources that appear to be associated with known radio pulsars. We have likely detected an X-ray emitting PWN associated with PSR J1617-5055, which could also be the underlying engine of HESS J1616-508. Figure 3 shows all the X-ray sources detected in the vicinity of HESS J1616-508. Among them only one, CXOU J161729.3-505512, is spatially extended. This, coupled with its spatial coincidence with PSR J1617-5055, is strongly in favor of a PWN origin of the X-ray emission, which also makes it a promising candidate for the X-ray counterpart of HESS J1616-508. Gallant (2006) has estimated the integrated ray flux in the 0.3–30 TeV band, about or about 1.3% of the spin-down flux of the pulsar, which is quite achievable. We should note that the X-ray emission associated with PSR J1617-5055 has been seen before, most clearly with the XMM-Newton data (Becker & Aschenbach, 2002; Landi et al., 2007). However, for the first time, we have spatially resolved the emission, thanks to the superior resolution of Chandra. Combining data from XMM-Newton, INTEGRAL, and BeppoSAX, Landi et al. (2007) derived the following spectral parameters from a simple power-law fit: , , and the unabsorbed 2-10 keV flux . Their spectrum thus seems a bit softer than the one that we derived here from the Chandra observation, although the hydrogen column density and flux are in general agreement (the unabsorbed 2-10 keV flux is about in our case). A possible explanation for the discrepancy is that they might have included more diffuse emission in the surrounding region, given the lower spatial resolution of the instruments used (especially INTEGRAL and BeppoSAX). Becker & Aschenbach (2002) found that about 53% of the X-ray flux is pulsed and thus associated with the pulsar. Therefore, the PWN contribution is no more than 47% of the measured flux (or in the 0.3–10 keV band). A lower limit on the PWN contribution can be obtained from the fraction of the X-ray emission outside the PSF. From Fig. 2, we estimated that at least 10% of the observed flux can be attributed to the PWN.
We also see evidence for X-ray emission associated with PSR J1702-4128. The emission might be slightly extended. There are also other sources detected in the vicinity of HESS J1702-420, as shown in Fig. 4, but the pulsar/PWN connection makes CXOU J170252.4-412848 a more likely counterpart of the X-ray source. If HESS J1702-420 is powered by the pulsar, its measured VHE ray flux () would correspond to about 11% of the spin-down flux of the pulsar (Gallant, 2006), which is rather high but not implausible. We failed to detect any X-ray emission at either the position of PSR J1913+1011 or the center-of-gravity (CoG) of HESS J1912+101 (although CXOU J191247.0+100948 is only about 52″ from the CoG), down to a flux level of roughly or lower (see Table 3). If HESS J1912+101 is powered by the pulsar, the measured VHE ray flux accounts for only about 1% of the spin-down flux of the pulsar (Aharonian et al., 2008b). The non-detection of X-ray emission associated with the pulsar does not necesarily contradict a possible association between the TeV -ray source and the pulsar. For instance, different populations of relativistic electrons could be responsible for the synchrotron X-ray emission and the TeV rays seen from this source (see, e.g. Funk (2007)).
Acknowledgments
We thank the anonymous referee for bringing to our attention the long observation of PSR J1617-5055 (ObsID #6684) and for many detailed and constructive comments, which have helped improve the manuscript significantly. This research has made use of the NASA/IPAC Extragalactic Database (NED), which is operated by the Jet Propulsion Laboratory, California Institute of Technology, under contract with the National Aeronautics and Space Administration (NASA), and of the SIMBAD Database. We gratefully acknowledge financial support from the Department of Energy and NASA.
References
- Aharonian et al. (2005) Aharonian, F., et al. 2005, Science, 307, 1938
- Aharonian et al. (2006a) Aharonian, F., et al. 2006a, A&A, 457, 899
- Aharonian et al. (2006b) Aharonian, F., et al. 2006b, ApJ, 636, 777
- Aharonian et al. (2008a) Aharonian, F., et al. 2008a, A&A, 477, 481
- Aharonian et al. (2008b) Aharonian, F., et al. 2008b, A&A, in Press
- Arnaud (1996) Arnaud, K. A., 1996, Astronomical Data Analysis Software and System V, eds Jacoby G and Barnes J., ASP Conf. Series, vol. 101, p.17
- Becker & Aschenbach (2002) Becker, W., & Aschenbach, B., 2002, Proc. 270 WE-Heraeus Seminar, Bad Honnef, Germany, eds. W. Becker, H. Lesch, & J. Trumper, MPE Report 278, p. 64
- Blondin et al. (2001) Blondin, J. M., et al. 2001, ApJ, 563, 806
- Cui (2006) Cui, W. 2006, in Frontier Objects in Astrophysics and Particle Physics, eds. F. Giovannelli & G. Mannocchi (Bologna: Editrice Compositori, Bologna), p.207 (astro-ph/0608042)
- Cui & Konopelko (2006,2007) Cui, W., & Konopelko, A., 2006, ApJ, 652, L109; Cui, W., & Konopelko, A., 2007, ApJ, 665, L83
- de Jager & Harding (1992) De Jager, O.C., & Harding, A.K., 1992, ApJ, 396, 161
- Dickey & Lockman (1990) Dickey, J. M., & Lockman, F. J., 1990, ARA&A, 28, 215
- Funk (2007) Funk, S., 2007, Ap&SS, 309, 11
- Gaensler & Slane (2006) Gaensler, B., & Slane, P., 2006, ARA&A, 44, 17
- Gallant (2006) Gallant, Y. A., 2006, Ap&SS, 309, 197
- Kargaltsev et al. (2007) Kargaltsev, O., et al. 2007, ApJ, 660, 1413
- Kargaltsev & Pavlov (2007) Kargaltsev, O., & Pavlov, G. G., 2007, ApJ, 670, 655
- Kargaltsev & Pavlov (2008) Kargaltsev, O., & Pavlov, G. G., 2008, astro-ph/0801.2602
- Kramer et al. (2003) Kramer, M., et al. 2003, MNRAS, 342, 1299
- Landi et al. (2007) Landi, R., et al. 2007, MNRAS, 380, 926
- Li & Ma (1983) Li, T. P., & Ma, Y. Q., 1983, ApJ, 272, 317
- Manchester et al. (2005) Manchester, R. N., Hobbs, G. B., Teoh, A., & Hobbs, M. 2005, AJ, 129, 1993
- Nolan et al. (1993) Nolan, P. L., et al. 1993, ApJ, 409, 697
- Torii et al. (1998) Torii, K., et al. 1998, ApJ, 494, L207
| ObsID | Pulsar | Exposure | OffsetaaFrom the aim point. | ACIS Chips |
|---|---|---|---|---|
| Time(ks) | () | |||
| #970 | PSR J1617-5055 | 19 | 6.36 | I2, I3, S2, S3, S4 |
| #6684 | PSR J1617-5055 | 57 | 0.80 | I3 |
| #4603 | PSR J1702-4128 | 10.5 | 0.67 | I0, I1, I2, I3, S2, S3 |
| #3854 | PSR J1913+1011 | 19 | 0.60 | I2, I3, S1, S2, S3, S4 |
| ObsID | Source | Right ascension | Declination | Count rate |
| J2000 | J2000 | 10-3 cts s-1 | ||
| CXOU J161723.7-505150 | 16:17:23.73(4) | -50:51:50.3(4) | 4.50.6 | |
| CXOU J161727.9-505549 | 16:17:27.970(3) | -50:55:49.7(4) | 1.50.1 | |
| CXOU J161729.3-505512 | 16:17:29.353(1) | -50:55:12.77(1) | 691 | |
| CXOU J161734.3-511227 | 16:17:34.3(1) | -51:12:27.8(8) | 1.60.4 | |
| CXOU J161741.9-511006 | 16:17:41.90(4) | -51:10:06.3(4) | 2.60.4 | |
| 970/6648 | CXOU J161747.2-505709 | 16:17:47.28(2) | -50:57:09.1(2) | 0.90.2 |
| CXOU J161820.7-510737 | 16:18:20.79(3) | -51:07:37.1(2) | 7.40.6 | |
| CXOU J161844.0-505728 | 16:18:44.1(1) | -50:57:29(1) | 1.20.3 | |
| CXOU J161849.2-510424 | 16:18:49.29(8) | -51:04:24.2(7) | 2.40.5 | |
| CXOU J161908.4-505507 | 16:19:08.5(1) | -50:55:08(1) | 1.90.4 | |
| CXOU J170238.5-413311 | 17:02:38.52(2) | -41:33:11.6(2) | 4.50.6 | |
| 4603 | CXOU J170252.4-412848 | 17:02:52.48(1) | -41:28:48.2(1) | 1.10.2 |
| CXOU J170333.5-413055 | 17:03:33.55(5) | -41:30:55.2(6) | 1.70.4 | |
| CXOU J191238.0+101043 | 19:12:38.01(2) | +10:10:43.4(3) | 8.90.8 | |
| CXOU J191240.6+101755 | 19:12:40.63(4) | +10:17:55.2(7) | 2.20.4 | |
| CXOU J191245.2+100656 | 19:12:45.28(6) | +10:06:56.9(7) | 1.30.3 | |
| CXOU J191247.0+100948 | 19:12:47.00(3) | +10:09:48.4(4) | 1.90.4 | |
| 3854 | CXOU J191316.1+100902 | 19:13:16.192(4) | +10:09:02.06(4) | 4.60.5 |
| CXOU J191331.9+101231 | 19:13:31.93(1) | +10:12:31.5(2) | 1.20.2 | |
| CXOU J191338.4+101200 | 19:13:38.41(2) | +10:12:00.2(3) | 1.20.3 | |
| CXOU J191351.1+101152 | 19:13:51.16(3) | +10:11:52.1(5) | 1.90.4 | |
| CXOU J191400.8+101403 | 19:14:00.88(7) | +10:14:03.5(9) | 1.50.3 |
† The numbers in parentheses indicate uncertainty in the last digit. Note that only
statistical uncertainties are shown.
| Name | NH | Flux (0.3–10 keV) | |
|---|---|---|---|
| (1022 cm | ) | ||
| PSR J1617-5055 | 3.30.3 | 1.10.1 | 34 |
| PSR J1702-4128 | 1.8 | 2.0 (fixed) | 0.2 |
| PSR J1913+1011 | 1.79c | 2.0 (fixed) | 0.74b |
| HESS CoGa | 1.81c | 2.0 (fixed) | 0.7b |