XMM-Newton observation of the cluster ZW 1305.4+2941 in the field SA 57
Abstract
We report the details of an XMM observation of the cluster of galaxies Zw 1305.4+2941 at the intermediate redshift of =0.241, increasing the small number of interesting X-ray constraints on properties of keV systems above =0.1. Based on the ks XMM observation, we find that within a radius of 228 kpc the cluster has an unabsorbed X-ray flux of ergs cm-2 s-1, a temperature of keV, in good agreement with the previous ROSAT determination, and an abundance of . Within kpc the rest-frame bolometric X-ray luminosity is ergs s-1. The cluster obeys the scaling relations for , and the velocity dispersion derived at intermediate redshift for 4 keV, for which we provide new fits for all literature objects. The mass derived from an isothermal NFW model fit is, , with a concentration parameter, .
Subject headings:
galaxies: clusters: general — X-rays: general1. Introduction
The current generation of X-ray observatories, Chandra and XMM, is considerably extending the maximum redshift to which X-ray clusters can be identified and analyzed. In fact the number of massive clusters detected at is rapidly growing thanks to the unprecedented XMM sensitivity (e.g, Mullis et al., 2005; Stanford et al., 2006; Bremer et al., 2006). On the other hand they are also extending the minimum luminosity, i.e. the least massive structures, to which X-ray clusters can be detected and analyzed at intermediate redshifts. Galaxy groups and clusters with 4 keV are starting to be routinely detected and analyzed in detail at (Willis et al., 2005; Gaga et al., 2005; Jeltema et al., 2006; Puccetti et al., 2006), where few examples were known. They represent the population which Chandra and in particular XMM surveys (like the XMM-LSS, Pierre et al., 2004) are sampling using typical exposures (10-20 ks), as expected (Jones et al., 2002).
These objects are more likely to display the effects of non-gravitational energy into the intra-cluster medium (ICM) than hotter more massive clusters (e.g., Ponman et al., 2003). The study of X-ray extended objects over an extended temperature range at will provide an important insight into the evolution of their X-ray emitting gas and the deviation of X-ray scaling relations from simple, self-similar expectations. Studies of objects in the redshift range and with 2 keV 2.6 keV are already suggesting that at these redshift these objects are less dynamically evolved that their counterparts at (Mulchaey et al., 2006). Furthermore, clusters with masses in the range (3 keV 4 keV) will constitute the bulk of the cosmological constraining power of future SZ surveys, because this is the range well-above the nearly redshift independent detection limit of these surveys (Haiman et al., 2001), therefore constituting the largest population in number count studies.
Here we present details of the XMM observation of the cluster Zw 1305.4+2941, also known as MS 1305+29 with keV at the redshift of , observed during an exposure of the field SA57. All distance-dependent quantities have been computed assuming = 70 km s-1 Mpc-1, = 0.3 and = 0.7. At the redshift of 1′ corresponds to 228 kpc. All the errors quoted are at the 68% confidence limit.
2. X-ray Analysis
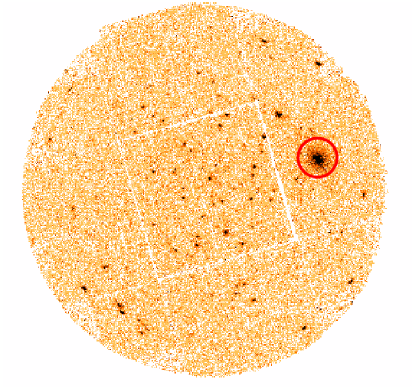
The object Zw 1305.4+2941 has been observed during an XMM pointing of the field SA 57 (Trevese et al., 2007) and it is located at 9.3′ off-axis (see Fig.1)111The center of the pointing has been calculated as an effective-area-weighted average of the optical axis of the three telescopes taken form the exposure map headers keywords XCEN and YCEN, as in Pacaud et al. (2006). The data were reduced with SAS v7.0.0 using the tasks emchain and epchain. We considered only event patterns 0-12 for MOS and 0 for pn and the data were cleaned using the standard procedures for bright pixels and hot columns removal (by applying the expression FLAG == 0) and pn out-of-time correction. Periods of high backgrounds due to soft protons were filtered as in Gastaldello et al. (2007a); the observation was affected by flares at the end of the exposure and ks were lost, resulting in a net exposure time of 47, 48 and 40 ks respectively for MOS1, MOS2 and pn.
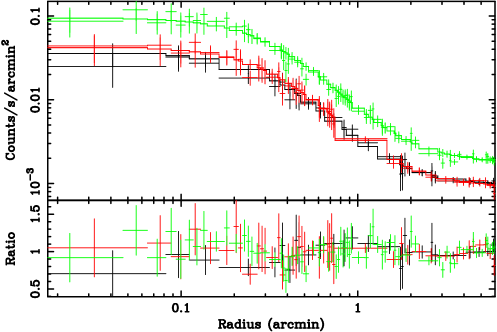
For each detector we created images in the 0.5-2 keV band with point sources, detected using the task ewavelet, masked using circular regions of 25′′ radius centered at the source position. The images have been exposure corrected and a radial surface brightness profile was extracted from a circular region of 6′ of radius centered on the cluster centroid. We account for the X-ray background by including a constant-background component. The data were grouped to have at least 20 counts per bin in order to apply the statistic. The fitted model is convolved with the XMM PSF. The joint best-fit -model (Cavaliere & Fusco-Femiano, 1976) has a core radius of kpc (′′′′) and for a /d.o.f. = 202/130 (see Fig.2). Fits to the profiles of the individual detectors give consistent results within 1 of the combined-fit result and in the case of the MOS detectors are formally acceptable (20/24 MOS 1 and 41/39 MOS 2). The main contribution to the comes mainly from the pn and its origin is instrumental, hence there is no need for more complicated models.
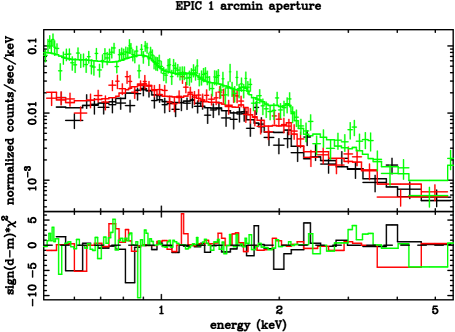
For spectral fitting, we extracted spectra for each detector from a 1′ region centered on the centroid of the emission, to maximize the S/N over the background. Redistribution matrix files (RMFs) and ancillary response files (ARFs) were generated using the SAS tasks rmfgen and arfgen in extended source mode. Appropriate flux-weighting was performed for RMFs and for ARFs, using exposure-corrected images of the source as detector maps (with pixel size of 1′, the minimum scale modeled by arfgen) to sample the variation in emission, following the prescription of Saxton & Siddiqui (2002). The background was estimated locally using spectra extracted from a 2′-3′ annular region centered on the centroid of the emission. The spectra from the three detectors were re-binned to ensure a signal-to-noise ratio of at least 3 and a minimum 20 counts per bin and they were jointly fitted with with an APEC thermal plasma modified by Galactic absorption (Dickey & Lockman, 1990). The spectral fitting was performed with Xspec (ver11.3.1, Arnaud, 1996) in the 0.5-6 keV band and quoted metallicities are relative to the abundances of Grevesse & Sauval (1998). The spectra are shown in Fig.3: the best fit parameters are keV and for a /d.o.f. = 241/222.
Using the best-fit model, the unabsorbed flux within the aperture of radius 1′ (228 kpc) is ergs cm-2 s-1 in the 0.5-2 keV band. This corresponds to an unabsorbed luminosity of ergs s-1 in the 0.5-2 keV and to a bolometric (0.01-100 keV) of ergs s-1. The quoted errors on flux and luminosity are the mean and standard deviation of the distributions evaluated repeating the measurements after 10000 random selection of temperature, metallicity and normalization, drawn from Gaussian distributions with mean and standard deviation in accordance to the best fit results.
To investigate possible spatial variation in the spectral parameters of the cluster, we extracted two annular regions of radii 0′-0.5′ and 0.5′-1.5′. The derived spectral parameters are: keV and with /d.o.f. = 140/121 for the inner annulus; keV and with /d.o.f. = 153/159 for the outer annulus. The width of the bins have been chosen in order to avoid bias in the temperature measurement caused by scattered flux by the PSF (80% encircled energy fraction radius is 31′′ for the pn at 1.5 keV and at the off-axis angle of the source). The cluster is therefore consistent with being isothermal over the explored radial range.
The cluster has regular X-ray isophotes and is centered on a dominant early type galaxy (see §3). These characteristics suggest the cluster is relaxed and that hydrostatic equilibrium is a good approximation. The isothermal profile is not exceptional in a relaxed cluster, as Zw 1305.4+2941 seems to have properties very similar to the low redshift cluster A 2589 (Zappacosta et al., 2006). We calculated the total mass profile using two different models. First, we used the best-fit -model for which the gas density and total mass profiles can be expressed by simple analytical formula (e.g., Ettori, 2000). We evaluated as the radius at which the density is 500 times the the critical density and the virial radius as the radius at which the density corresponds to , as obtained by Bryan & Norman (1998) 222 where , and for the concordance cosmological model used in this paper. To evaluate the errors on the estimated quantities, we repeat the measurements after 10000 random selections of a temperature and parameters of the surface brightness profile, which were drawn from Gaussian distributions with mean and variance in accordance with the best-fit results. For we obtained, within kpc; the virial mass is, , within the virial radius kpc. Secondly, we fit the surface brightness profile with an isothermal NFW (Navarro et al., 1997) model (Suto et al., 1998). We obtain a concentration parameter, , virial radius kpc, and virial mass , with /d.o.f. = 197/130. The mass determinations using the two different models agree well within the errors. We calculate the gas mass using the procedure described in Ettori et al. (2004), using the -model parametrization and deriving the central electron density from a combination of the surface brightness fit and the normalization of the spectral model (equation (2) of Ettori et al., 2004). We obtained . We calculate the entropy of the cluster using the standard definition and measure this quantity at 0.1 and as done by Ponman et al. (2003). We find keV cm2 and keV cm2, being kpc using the best-fit -model.
Finally, we have studied the sensitivity of our spectral results to various sources of systematic errors which we summarize below.
Galactic Column Density and Bandwidth: If is allowed to vary the fit in the 1′ aperture does not improve and the best fit column density is consistent at 1 with the Galactic value; the other parameters are unchanged. Restricting the energy band to the 0.5-5 keV band returned practically unchanged values, and , whereas using a 0.4-5 keV band has the effect of slightly increase the values, and , but still with systematic errors less than the statistical ones.
Background: For comparison with the results obtained with the local background we used the standard blank background fields (Read & Ponman, 2003), finding good agreement between the two methods in the 1′ aperture, and . In the 0.5′-1.5′outer annulus the results obtained with the background template are in agreement within with the local background method, and .
Plasma Code: We investigated the sensitivity of our results to the plasma code using the MEKAL model. The quality of the fit and the temperature and abundance values were found to be very consistent within the errors, and .
3. Optical analysis
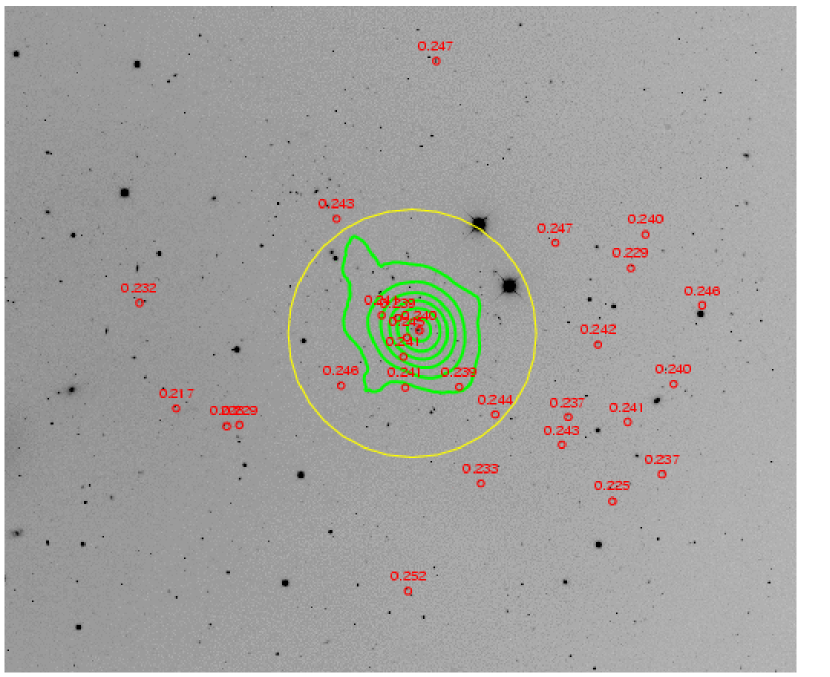
Zw 1305.4+2941 is a Bautz-Morgan type I cluster at z=0.24. The optical map with over-plotted X-ray contours from XMM 0.5-10 keV data is shown in Fig.4. Optical photometry of the field SA 57 was obtained from U,,F,N plates taken at KPNO 4 m Mayall telescope (Koo et al., 1986). A foreground cluster was recognized in the two-colour diagram calibrated with the spectroscopic redshifts available in the field (Koo et al., 1988). The cluster is elongated, with a major axis position angle . The central cD galaxy has a position angle and an axial-ratio , both measured at 3.5 magnitudes fainter than the central surface brightness and with a error. In Koo et al. (1988) the galaxy number density profiles, as deduced respectively in circular or elliptical annuli and statistically corrected for background, were fitted with both a projected Emden isothermal profile and projected King profile following the procedure of Sarazin (1980). The parameters are the core radius , the central surface density and the surface density of the background; is the dispersion of the radial velocities, the central value of the volume density of galaxies and m is the average galaxy mass. The results of the fit are reported in Table 2B of Koo et al. (1986).
Mahdavi & Geller (2001) report a velocity dispersion value of citing the paper of Wu et al. (1999), but this value is not attributed in unequivocal way to the cluster MS 1305.4+2941. Mushotzky & Scharf (1997) used velocity dispersion data from Fadda et al. (1996), Carlberg et al. (1996) and Fabricant et al. (1991), none of which contains for MS 1305.4+2941. On the basis of the redshifts found using the Nasa Extragalactic Database (NED), mostly derived by the spectroscopic survey of the field by Munn et al. (1997), we have determined the velocity dispersion of the cluster considering circular areas of increasing radius, centered on the cD galaxy. The results are shown in Fig.5, where the redshifts as a function of the angular distance from the cluster center are also reported. The velocity dispersion is roughly constant between 1 and 3.5′ and progressively rises beyond 4′. This may be due to the inclusion of galaxies not belonging to the cluster or to incomplete virialization. The X-ray surface brightness falls below 3% of the central value at a radius of 3.3′ (see Fig.2), which corresponds to about , and becomes practically undetectable. Therefore we adopt km s-1 (based on 10 members) which corresponds to for kT = 3.17 keV and = 0.6. This value of is not much different from the value of derived from the X-ray brightness distribution (). Moreover, is also consistent with the X-ray image that in the central region seems to show a quite relaxed cluster. A value of lower than 1 may be due to the transfer from orbital to internal energy occurring in galaxy merging, thus cooling the galaxy velocity distribution despite the counteracting effect of the cluster gravitational potential (Fusco-Femiano & Menci, 1995). Finally, the fraction of blue galaxies derived within ′ from Koo et al. (1988, see their Fig.8) for this cluster is consistent with the relationship between cluster velocity dispersion and blue fraction within /4 obtained by Andreon et al. (2006), although not definitely conclusive.

4. Discussion
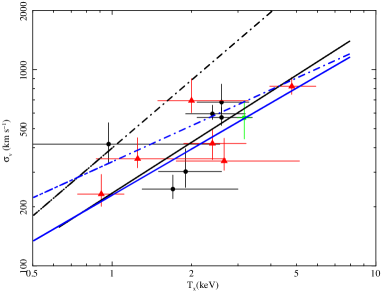
Central panel: relation with the best fit (black solid line). Also shown are the best fits to the cluster sample of Horner (2001) (solid blue line) and Girardi et al. (1996) (dot-dashed blue line). The dot-dashed black line shows the best fit to the GEMS group sample.
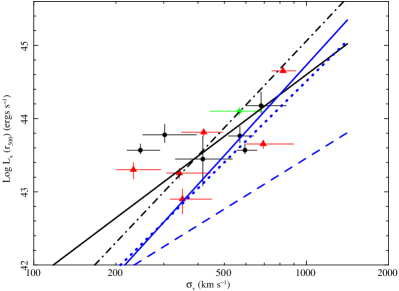
Lower panel: relation with the best fit (black solid line). Also shown are the best fits to the cluster sample of Horner (2001) (dash-dotted black line), the REFLEX subsample of Ortiz-Gil et al. (2004) (solid blue line) and the RASS-SDSS sample of Popesso et al. (2005) (dotted blue line). The dashed blue line shows the best fit to the GEMS group sample.
In this section we discuss the properties of Zw 1305.4+2941 in relation to the ones of objects with 4 keV at the intermediate redshift .
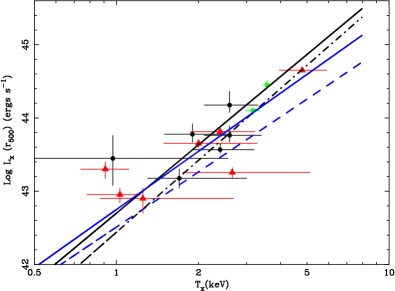
In particular we investigate the scaling relations between , and velocity dispersion for the six objects at intermediate redshift () in the XMM LSS survey (Willis et al., 2005), the six objects () in the sample of Jeltema et al. (2006) and Zw 1305.4+2941 together with the recently discovered cluster XMMUJ 131359.7-162735, with , presented in Gastaldello et al. (2007b). We made a first attempt at investigating quantitatively these relations (in a simple power-law representation) in its normalization and slope by performing a linear regression between two sets of measured quantities and . We employ the bisector modification of the BCES method (i.e., bivariate correlated errors with intrinsic scatter) described by Akritas & Bershady (1996) that takes into account both any intrinsic scatter and errors on the two variables considered as symmetric. We performed the BCES fitting using software kindly provided by M. Bershady333http://www.astro.wisc.edu/mab/archive/stats/stats.html. The uncertainties on the best fit results are obtained from bootstrap re-sampling. The results on the best-fit normalization and slope for the scaling laws here investigated are quoted in Table 1, together with total and intrinsic scatter (measured using equation (2) of Buote et al., 2007) and they are shown as black solid lines in Fig.6.
We first investigate the relation. For Zw 1305.4+2941, the aperture of 228 kpc used for spectroscopy encloses 70% of the flux within , assuming the cluster emission profile follows the -model of Fig.2. The derived bolometric luminosity within is ergs s-1; errors in the luminosity were determined including both the spectral errors and the uncertainties in the -model parameters. The temperature derived with XMM is in good agreement with the previous ROSAT determination ( keV, 2 errors, Mushotzky & Scharf, 1997). In the first panel of Fig.6 we plot the results for the intermediate redshift groups/poor clusters compared to the best fit regression lines for the low redshift groups of the GEMS sample (Osmond & Ponman, 2004), for the clusters of Horner (2001) as quoted in Osmond & Ponman (2004), removing cool ( keV) low luminosity ( ergs s-1) objects and for the cluster sample of objects with keV of Markevitch (1998). With the caveat of the large error bars in the measured slope due to the still rather large errors in both luminosity and temperature and the small size of the sample, the relation is consistent with what found for local clusters. Given the angular resolution of the data it has not been possible to correct for the effect of central cool cores, which tend to reduce the scatter and produce flatter slopes (Allen & Fabian, 1998; Markevitch, 1998).
We then investigate the relationship between the velocity dispersion of the group member galaxies and the X-ray temperature, excluding from the sample of Willis et al. (2005) XLSSC 013 for which no velocity dispersion was quoted and XMMUJ 131359.7-162735 for which we do not have optical spectroscopy. For the sample of Jeltema et al. (2006) we used the updated velocity dispersions presented in Jeltema et al. (2007). In the second panel of Fig.6 we show the relation compared to the best fit of the GEMS groups (Osmond & Ponman, 2004), the cluster data of Horner (2001) as quoted in Osmond & Ponman (2004) and the cluster sample of Girardi et al. (1996). As discussed in Jeltema et al. (2006) there is a large scatter with few groups which appears to have significantly low velocity dispersions for their temperature, similar to what found in the GEMS sample at lower X-ray luminosities and temperatures. A well known observational effect could be a possible explanation, due to the fact that velocity dispersions may be artificially low when based on relatively small numbers (e.g., Zabludoff & Mulchaey, 1998; Girardi & Mezzetti, 2001). Or velocity dispersions could be really reduced: Helsdon et al. (2005) propose several possible mechanisms for this effect, including dynamical friction, tidal heating and orientation effect (see also discussion in §3). The former explanation holds for many of the objects in the sample of Jeltema et al. (2006): for example RX J1334.9+3750 increased its velocity dispersion from km s-1 based on 6 members (Mulchaey et al., 2006) to km s-1 based on 17 members (Jeltema et al., 2007); RX J1648.7+6019 increased its velocity dispersion from km s-1 based on 8 members to km s-1 based on 22 members. Deeper spectroscopy to increase the robustness of the determination of the velocity dispersion and deeper X-ray observations are therefore crucial to clarify the nature of these systems. In the cluster regime there seems to be a consensus for a slight departure from a pure gravitational collapse, (e.g., Lubin & Bahcall, 1993; Bird et al., 1995; Girardi et al., 1996; Xue & Wu, 2000), whereas the evidence for groups is more controversial, with authors (e.g., Mulchaey, 2000; Xue & Wu, 2000) finding that groups fall on the cluster trend and others (Helsdon & Ponman, 2000b, a) finding that the relation steepens. As discussed in Osmond & Ponman (2004) the large non-statistical scatter mentioned above contributes to the controversy. Again with the caveat of large error bars, the objects in the intermediate-redshift sample seem to indicate an intermediate slope between clusters and low-temperature groups (but see Ortiz-Gil et al., 2004, for an even steeper slope, , for a large REFLEX cluster sample). It is interesting to quote the results we would obtain had we used the velocity dispersions based on fewer members for the sample of Jeltema et al. (2006) reported in Mulchaey et al. (2006): a slope of and intercept .
Finally we investigate the relation for the same objects considered above, shown in the third panel of Fig.6. The cluster relation slope is consistently found by many investigations close to the purely gravitational expectation of 4 (e.g. Girardi & Mezzetti, 2001; Popesso et al., 2005; Ortiz-Gil et al., 2004, see the latter reference for a thorough comparison with previous determinations). There is disagreement at the group scale between studies which find that groups are consistent with the cluster relation (e.g., Helsdon & Ponman, 2000b; Mahdavi & Geller, 2001) and those which find significantly flatter relations (e.g., Xue & Wu, 2000; Osmond & Ponman, 2004). The results from the intermediate redshift sample point to a flatter trend compared to the cluster results. But we can see that this is mainly due to the same low velocity dispersion objects which have not only but also higher compared to the expectations. Clearly these are not the X-ray under-luminous optically selected objects found both at the cluster (e.g., Popesso et al., 2007) and group scale (e.g., Rasmussen et al., 2006) believed to be systems which are collapsing for the first time and it is therefore likely that a better determination of in these X-ray selected objects will bring these objects in closer agreement to the cluster scaling relations (modulo the effects described for example in Helsdon et al., 2005). In fact, for example, had we used the velocity dispersions based on fewer members reported in Mulchaey et al. (2006), we would have obtained a flatter slope of and intercept .
We checked that the values for slope and intercept of the regression lines do not depend on the choice of the pivot point: we fitted the relation with ergs s-1, keV and km/s, at the center of the data point cloud, in the three relations obtaining identical results to the ones in Table1.
| Relation () | ||||
|---|---|---|---|---|
| 0.39 | 0.37 | |||
| 0.14 | 0.12 | |||
| 0.36 | 0.33 |

The entropy for Zw 1305.4+2941, measured at the two different over-density of 0.1 and is consistent with the excess entropy observed in low redshift groups: scaling our results as with to account for the variation of the mean density within a given over-density radius with redshift, we find keV cm2 and keV cm2 which can be compared with the plots in Fig.12 and Fig.13 of Jeltema et al. (2006) showing good agreement with the local relation
The high iron abundance for this cluster is consistent with the trend of increasing metallicity with decreasing temperature found at intermediate and high redshift by Balestra et al. (2007) with Chandra and XMM data and with the sample of Baumgartner et al. (2005) with ASCA data. Particularly relevant is the comparison with objects like Zw 0024.0+1652 and V1416+4446 in the sample of Balestra et al. (2007) which at z=0.395 and z=0.400 have , and , respectively, having converted their abundances from Asplund et al. (2005) to Grevesse & Sauval (1998) by scaling for 0.89. Also these objects, observed with Chandra and for which an analysis in two annuli is performed, do not show a clear enhancement of the iron abundance in the inner regions (Balestra et al., 2007), displaying the same behavior as Zw 1305.4+2941. These data seem to suggest therefore that the higher abundance is not due to the presence of a particularly iron-rich cool core. Zw 1305.4+2941 is present in the sample of Baumgartner et al. (2005) based on the results of Horner (2001): the ASCA abundance determination is high (, 90% errors, having converted their abundances from Anders & Grevesse (1989) to Grevesse & Sauval (1998) by scaling for 1.48) and in good agreement with the XMM measurement. This trend between metallicity and temperature, still poorly understood, needs to be investigated with better data (it should be remarked that the constraints on the metallicity of Zw 1305.4+2941 are interesting but not tight: it is consistent with at the level).
The measured concentration parameter , multiplied by the expected dependence (Bullock et al., 2001) is consistent with a relaxed, early forming object in a CDM model with and with the observational results of relaxed, low- objects (Buote et al., 2007). In Fig.7 we show the data points corresponding to Zw 1305.4+2941 and XMMUJ 131359.7-162735 over-plotted to the data points and best-fit relation discussed in Buote et al. (2007). It should be kept in mind that these two data points have been derived under a very simple and restrictive isothermal assumption, whereas all the low- data points have been derived with a detailed investigation of the density, temperature and abundance profiles.
5. Conclusions
We present results for an XMM observation of the cluster Zw 1305.4+2941, for which we derive keV, an abundance of for an unabsorbed bolometric luminosity of ergs s-1 within an aperture of 1′ (228 kpc at ). Under the assumption of isothermality and that the cluster follows the best-fit model to the surface brightness profile, we derive luminosity, entropy and mass at various over-densities. We measure a velocity dispersion of km s-1 within 3.3′. These interesting constraints increase the small number of well studied keV objects above =0.1.
We provide new fits of scaling relations for all literature 4 keV objects in the intermediate- range. The cluster obeys the scaling relations thus derived. Concentration and mass for this object agree with the local relation.
The prospects for increasing the sample size and improving the description presented here are promising. XMM and Chandra are dramatically expanding our previous little knowledge of X-ray emitting low-temperature clusters and groups of galaxies beyond the present epoch. Surveys like XMM-LSS (Pierre et al., 2004) and COSMOS (Finoguenov et al., 2007) will provide large samples of X-ray selected groups and poor clusters out to redshift of or higher. Together with very large redshift surveys, optically selected groups in large quantities at moderate redshifts (e.g., Wilman et al., 2005b, a) will be obtained, characterizing in great detail this population and investigating some initial suggestion of group downsizing. More massive groups could be still in the process of virializing at intermediate redshift, while this process is restricted to much less luminous (and thus less massive) systems at present day (Mulchaey et al., 2006). X-ray follow-up with Chandra could allow to go beyond the simple isothermal beta model used so far in these studies.
References
- Akritas & Bershady (1996) Akritas, M. G. & Bershady, M. A. 1996, ApJ, 470, 706
- Allen & Fabian (1998) Allen, S. W. & Fabian, A. C. 1998, MNRAS, 297, L57
- Anders & Grevesse (1989) Anders, E. & Grevesse, N. 1989, Geochim. Cosmochim. Acta, 53, 197
- Andreon et al. (2006) Andreon, S., Quintana, H., Tajer, M., Galaz, G., & Surdej, J. 2006, MNRAS, 365, 915
- Arnaud (1996) Arnaud, K. A. 1996, in ASP Conf. Ser. 101: Astronomical Data Analysis Software and Systems V, Vol. 5, 17
- Asplund et al. (2005) Asplund, M., Grevesse, N., & Sauval, A. J. 2005, in Astronomical Society of the Pacific Conference Series, Vol. 336, Cosmic Abundances as Records of Stellar Evolution and Nucleosynthesis, ed. T. G. Barnes, III & F. N. Bash, 25–+
- Balestra et al. (2007) Balestra, I., Tozzi, P., Ettori, S., Rosati, P., Borgani, S., Mainieri, V., Norman, C., & Viola, M. 2007, A&A, 462, 429
- Baumgartner et al. (2005) Baumgartner, W. H., Loewenstein, M., Horner, D. J., & Mushotzky, R. F. 2005, ApJ, 620, 680
- Bird et al. (1995) Bird, C. M., Mushotzky, R. F., & Metzler, C. A. 1995, ApJ, 453, 40
- Bremer et al. (2006) Bremer, M. N., Valtchanov, I., Willis, J., Altieri, B., Andreon, S., Duc, P. A., Fang, F., Jean, C., Lonsdale, C., Pacaud, F., Pierre, M., Shupe, D. L., Surace, J. A., & Waddington, I. 2006, MNRAS, 371, 1427
- Bryan & Norman (1998) Bryan, G. L. & Norman, M. L. 1998, ApJ, 495, 80
- Bullock et al. (2001) Bullock, J. S., Kolatt, T. S., Sigad, Y., Somerville, R. S., Kravtsov, A. V., Klypin, A. A., Primack, J. R., & Dekel, A. 2001, MNRAS, 321, 559
- Buote et al. (2007) Buote, D. A., Gastaldello, F., Humphrey, P. J., Zappacosta, L., Bullock, J. S., Brighenti, F., & Mathews, W. G. 2007, ApJ, 664, 123
- Carlberg et al. (1996) Carlberg, R. G., Yee, H. K. C., Ellingson, E., Abraham, R., Gravel, P., Morris, S., & Pritchet, C. J. 1996, ApJ, 462, 32
- Cavaliere & Fusco-Femiano (1976) Cavaliere, A. & Fusco-Femiano, R. 1976, A&A, 49, 137
- Dickey & Lockman (1990) Dickey, J. M. & Lockman, F. J. 1990, ARA&A, 28, 215
- Ettori (2000) Ettori, S. 2000, MNRAS, 311, 313
- Ettori et al. (2004) Ettori, S., Tozzi, P., Borgani, S., & Rosati, P. 2004, A&A, 417, 13
- Fabricant et al. (1991) Fabricant, D. G., McClintock, J. E., & Bautz, M. W. 1991, ApJ, 381, 33
- Fadda et al. (1996) Fadda, D., Girardi, M., Giuricin, G., Mardirossian, F., & Mezzetti, M. 1996, ApJ, 473, 670
- Finoguenov et al. (2007) Finoguenov, A., Guzzo, L., Hasinger, G., Scoville, N. Z., Aussel, H., Böhringer, H., Brusa, M., Capak, P., Cappelluti, N., Comastri, A., Giodini, S., Griffiths, R. E., Impey, C., Koekemoer, A. M., Kneib, J.-P., Leauthaud, A., Le Fèvre, O., Lilly, S., Mainieri, V., Massey, R., McCracken, H. J., Mobasher, B., Murayama, T., Peacock, J. A., Sakelliou, I., Schinnerer, E., Silverman, J. D., Smolčić, V., Taniguchi, Y., Tasca, L., Taylor, J. E., Trump, J. R., & Zamorani, G. 2007, ApJS, 172, 182
- Fusco-Femiano & Menci (1995) Fusco-Femiano, R. & Menci, N. 1995, ApJ, 449, 431
- Gaga et al. (2005) Gaga, T., Plionis, M., Basilakos, S., Georgantopoulos, I., & Georgakakis, A. 2005, MNRAS, 363, 811
- Gastaldello et al. (2007a) Gastaldello, F., Buote, D. A., Humphrey, P. J., Zappacosta, L., Bullock, J. S., Brighenti, F., & Mathews, W. G. 2007a, ApJ, 669, 158
- Gastaldello et al. (2007b) Gastaldello, F., Buote, D. A., Humphrey, P. J., Zappacosta, L., Seigar, M. S., Barth, A. J., Brighenti, F., & Mathews, W. G. 2007b, ApJ, 662, 923
- Girardi et al. (1996) Girardi, M., Fadda, D., Giuricin, G., Mardirossian, F., Mezzetti, M., & Biviano, A. 1996, ApJ, 457, 61
- Girardi & Mezzetti (2001) Girardi, M. & Mezzetti, M. 2001, ApJ, 548, 79
- Grevesse & Sauval (1998) Grevesse, N. & Sauval, A. J. 1998, Space Science Reviews, 85, 161
- Haiman et al. (2001) Haiman, Z., Mohr, J. J., & Holder, G. P. 2001, ApJ, 553, 545
- Helsdon & Ponman (2000a) Helsdon, S. F. & Ponman, T. J. 2000a, MNRAS, 319, 933
- Helsdon & Ponman (2000b) —. 2000b, MNRAS, 315, 356
- Helsdon et al. (2005) Helsdon, S. F., Ponman, T. J., & Mulchaey, J. S. 2005, ApJ, 618, 679
- Horner (2001) Horner, D. J. 2001, PhD thesis, University of Maryland
- Jeltema et al. (2007) Jeltema, T. E., Mulchaey, J. S., Lubin, L. M., & Fassnacht, C. D. 2007, ApJ, 658, 865
- Jeltema et al. (2006) Jeltema, T. E., Mulchaey, J. S., Lubin, L. M., Rosati, P., & Böhringer, H. 2006, ApJ, 649, 649
- Jones et al. (2002) Jones, L. R., McHardy, I., Newsam, A., & Mason, K. 2002, MNRAS, 334, 219
- Koo et al. (1986) Koo, D. C., Kron, R. G., Nanni, D., Trevese, D., & Vignato, A. 1986, AJ, 91, 478
- Koo et al. (1988) Koo, D. C., Kron, R. G., Nanni, D., Vignato, A., & Trevese, D. 1988, ApJ, 333, 586
- Lubin & Bahcall (1993) Lubin, L. M. & Bahcall, N. A. 1993, ApJ, 415, L17
- Mahdavi & Geller (2001) Mahdavi, A. & Geller, M. J. 2001, ApJ, 554, L129
- Markevitch (1998) Markevitch, M. 1998, ApJ, 504, 27
- Mulchaey (2000) Mulchaey, J. S. 2000, ARA&A, 38, 289
- Mulchaey et al. (2006) Mulchaey, J. S., Lubin, L. M., Fassnacht, C., Rosati, P., & Jeltema, T. E. 2006, ApJ, 646, 133
- Mullis et al. (2005) Mullis, C. R., Rosati, P., Lamer, G., Böhringer , H., Schwope, A., Schuecker, P., & Fassbender, R. 2005, ApJ, 623, L85
- Munn et al. (1997) Munn, J. A., Koo, D. C., Kron, R. G., Majewski, S. R., Bershady, M. A., & Smetanka, J. J. 1997, ApJS, 109, 45
- Mushotzky & Scharf (1997) Mushotzky, R. F. & Scharf, C. A. 1997, ApJ, 482, L13+
- Navarro et al. (1997) Navarro, J. F., Frenk, C. S., & White, S. D. M. 1997, ApJ, 490, 493
- Ortiz-Gil et al. (2004) Ortiz-Gil, A., Guzzo, L., Schuecker, P., Böhringer, H., & Collins, C. A. 2004, MNRAS, 348, 325
- Osmond & Ponman (2004) Osmond, J. P. F. & Ponman, T. J. 2004, MNRAS, 350, 1511
- Pacaud et al. (2006) Pacaud, F., Pierre, M., Refregier, A., Gueguen, A., Starck, J.-L., Valtchanov, I., Read, A. M., Altieri, B., Chiappetti, L., Gandhi, P., Garcet, O., Gosset, E., Ponman, T. J., & Surdej, J. 2006, MNRAS, 372, 578
- Pierre et al. (2004) Pierre, M., Valtchanov, I., Altieri, B., Andreon, S., Bolzonella, M., B remer, M., Disseau, L., Dos Santos, S., Gandhi, P., Jean, C., Pacaud, F., Read, A., Refregier, A., Willis, J., Adami, C., Alloin, D., Birkinshaw, M., Chiappetti, L., Cohen, A., Detal, A. an d Duc, P.-A., Gosset, E., Hjorth, J., Jones, L., LeFevre, O., Lonsdale, C., Maccagni, D., Mazure, A., McBreen, B., McCracken, H., Mellier, Y., Ponman, T., Quintana, H., Rottgering, H., Smette, A., Surdej, J. an d Starck, J.-L., Vigroux, L., & White, S. 2004, Journal of Cosmology and Astro-Particle Physics, 9, 11
- Ponman et al. (2003) Ponman, T. J., Sanderson, A. J. R., & Finoguenov, A. 2003, MNRAS, 343, 331
- Popesso et al. (2007) Popesso, P., Biviano, A., Böhringer, H., & Romaniello, M. 2007, A&A, 461, 397
- Popesso et al. (2005) Popesso, P., Biviano, A., Böhringer, H., Romaniello, M., & Voges, W. 2005, A&A, 433, 431
- Puccetti et al. (2006) Puccetti, S., Fiore, F., D’Elia, V., Pillitteri, I., Feruglio, C., Grazian, A., Brusa, M., Ciliegi, P., Comastri, A., Gruppioni, C., Mignoli, M., Vignali, C., Zamorani, G., La Franca, F., Sacchi, N., Franceschini, A., Berta, S., Buttery, H., & Dias, J. E. 2006, A&A, 457, 501
- Rasmussen et al. (2006) Rasmussen, J., Ponman, T. J., Mulchaey, J. S., Miles, T. A., & Raychaudhury, S. 2006, MNRAS, 373, 653
- Read & Ponman (2003) Read, A. M. & Ponman, T. J. 2003, A&A, 409, 395
- Sarazin (1980) Sarazin, C. L. 1980, ApJ, 236, 75
- Saxton & Siddiqui (2002) Saxton, R. D. & Siddiqui, H. 2002, XMM-SOC-PS-TN-43
- Stanford et al. (2006) Stanford, S. A., Romer, A. K., Sabirli, K., Davidso n, M., Hilton, M., Viana, P. T. P., Collins, C. A., Kay, S. T., Liddle, A. R., Mann, R. G., Miller, C. J. a nd Nichol, R. C., West, M. J., Conselice, C. J., Spinrad, H., Stern, D., & Bundy, K. 2006, ApJ, 646, L13
- Suto et al. (1998) Suto, Y., Sasaki, S., & Makino, N. 1998, ApJ, 509, 544
- Trevese et al. (2007) Trevese, D., Vagnetti, F., Puccetti, S., Fiore, F., Tomei, M., & Bershady, M. A. 2007, A&A, 469, 1211
- Willis et al. (2005) Willis, J. P., Pacaud, F., Valtchanov, I., Pierre, M., Ponman, T., Read, A., Andreon, S., Altieri, B., Quintana, H., Dos Santos, S., Birkinshaw, M., Bremer, M., Duc, P.-A., Galaz, G., Gosset, E., Jones, L., & Surdej, J. 2005, MNRAS, 363, 675
- Wilman et al. (2005a) Wilman, D. J., Balogh, M. L., Bower, R. G., Mulchaey, J. S., Oemler, A., Carlberg, R. G., Eke, V. R., Lewis, I., Morris, S. L., & Whitaker, R. J. 2005a, MNRAS, 358, 88
- Wilman et al. (2005b) Wilman, D. J., Balogh, M. L., Bower, R. G., Mulchaey, J. S., Oemler, A., Carlberg, R. G., Morris, S. L., & Whitaker, R. J. 2005b, MNRAS, 358, 71
- Wu et al. (1999) Wu, X.-P., Xue, Y.-J., & Fang, L.-Z. 1999, ApJ, 524, 22
- Xue & Wu (2000) Xue, Y.-J. & Wu, X.-P. 2000, ApJ, 538, 65
- Zabludoff & Mulchaey (1998) Zabludoff, A. I. & Mulchaey, J. S. 1998, ApJ, 496, 39
- Zappacosta et al. (2006) Zappacosta, L., Buote, D. A., Gastaldello, F., Humphrey, P. J., Bullock, J., Brighenti, F., & Mathews, W. 2006, ApJ, 650, 777