Spitzer/IRS Observations of Seyfert 1.8s and 1.9s:
A Comparison with Seyfert 1s and Seyfert 2s
Abstract
We present Spitzer Space Telescope mid-infrared spectra of 12 Seyfert 1.8 and 1.9 galaxies over the region. We compare the spectral characteristics of this sample to those of Seyfert 1 and Seyfert 2 galaxies from the Spitzer archives. An analysis of the spectral shapes, the silicate feature and the emission line fluxes have enabled us to characterize the mid-IR properties of Seyfert 1.8/1.9s. We find that the equivalent widths of the silicate feature are generally weak in all Seyfert galaxies, as previously reported by several studies. The few Seyfert galaxies in this sample that show deep silicate absorption features are highly inclined and/or merging galaxies. It is likely that these absorption features originate primarily in the dusty interstellar medium of the host galaxy rather than in a dusty torus on parsec scales close to the central engine. We find that the equivalent width of the polycyclic aromatic hydrocarbon (PAH) band at correlates strongly with the spectral index. Either of these quantities are good indicators of the amount of starburst contribution to the mid-IR spectra. The spectra of Seyfert 1.8 and 1.9s are dominated by these starburst features, similar to most Seyfert 2s. They show strong PAH bands and a strong red continuum toward . The strengths of the high-ionization forbidden narrow emission lines [O IV] , [Ne III] and [Ne V] relative to [Ne II] are weaker in Seyfert 1.8/1.9s and Seyfert 2s as compared to Seyfert 1s. The weakness of high-ionization lines in Seyfert 1.8-1.9s is suggestive of intrinsically weak active galactic nuclei (AGN) continua, and/or stronger star formation activity leading to enhanced [Ne II]. We discuss the implications of these observational results in the context of the Unified Model of AGN.
1 Introduction
The study of optical spectra of Seyfert galaxies (Khachikian & Weedman, 1974) lead to their classification into type 1 and type 2 Seyfert galaxies. Seyfert 1 galaxies have permitted broad () and narrow () emission lines as well as forbidden narrow emission lines, whereas in Seyfert 2 galaxies the broad emission line component is absent. Study of optical spectra of type 2 Seyferts using polarized light (Miller & Antonucci, 1983; Antonucci & Miller, 1985) showed that the broad emission lines can be detected in some objects. These observations implied that the structure and physical nature of the central source is similar in all AGN. The differences between physical properties of type 1 and type 2 Seyfert nuclei are caused by significant amount of optical obscuration that hides the broad-line region (BLR) from the line of sight to the observer in type 2 sources. These observations lead to the formation of the Unified Model of AGN (see reviews by Antonucci, 1993; Urry & Padovani, 1995), where a dusty structure with a torus-like geometry prevents the direct view of the BLR when seen at angles close to the equatorial plane of the AGN. The obscuration within the torus is expected to be composed of dusty molecular clouds (Krolik and Begelman 1988). However, the exact nature of this obscuration has been a subject of debate for the last decade (e.g., Malkan et al., 1998). In this paper, we report on the mid-infrared Spitzer Space Telescope (Werner et al., 2004) spectra of an intermediate class of Seyfert galaxies, Seyfert 1.8s and 1.9s. We compare the mid-IR spectra of this intermediate class of Seyfert galaxies with Seyfert 1s and Seyfert 2s, and derive spectral diagnostics to understand the behavior of the dust obscuration between the subclasses of Seyfert galaxies.
Osterbrock (1981) classified the Seyfert 1 class from 1 to 1.9 with numerically larger types having weaker broad line components as compared to the superposed narrow permitted lines. As one goes from a Seyfert 1 to 1.5 class, the superposed permitted narrow emission lines become more distinguishable from the broad component. The Seyfert 1.8s possess weak broad wings on H and H, while the 1.9s only show wings on H. Thus, as we go from a type 1 source to a type 2 source, the waning of broad emission lines in the intermediate types and the presence of broad lines in the spectropolarimetry of a few type 2 objects implies that the intermediate types (1.8/1.9s) may be viewed at intermediate inclination angles to the central source, possibly through the “atmosphere” of the dusty torus.
Further, Seyfert 1.8s and 1.9s show variations in their broad-line Balmer decrements (HH) over timescales of a few years (Goodrich, 1995). Goodrich showed that these variations were consistent with changes in reddening implying a moving dust screen between our line of sight and the central source. More specifically, the dust screen must be present between the BLR and the narrow-line region (NLR) as the narrow line fluxes did not vary over the observed intervals. This is the postulated location of the dusty torus in AGN. Mid-IR observations of Seyfert 1.8s and 1.9s are thus crucial to constrain the properties of the torus. Further, in the mid-IR the extinction due to dust should be much lower than in the optical. Thus we expect the mid-IR spectra of Seyfert 1.8-1.9 to be more like those of Seyfert 1s than like Seyfert 2s.
Seyfert 1.8s and 1.9s also possess relatively weak high-ionization (e.g., [Fe VII] ) narrow lines as compared to Seyfert 1s, suggesting that the dust screen may also be obscuring an inner NLR where these lines are thought to arise (Murayama & Taniguchi, 1998; Nagao et al., 2000). The mid-IR range includes several narrow forbidden emission lines that arise in the NLR. These lines are useful to test the above hypothesis, since the extinction of the mid-IR lines is expected to be small.
In the last decade, with the advent of ISO, several local Seyfert galaxies have been studied extensively (see, Verma et al., 2005). Their mid-IR spectral characteristics are well studied (Clavel et al., 2000; Sturm et al., 2000, 2002; Lutz et al., 2004). Recent studies with the Spitzer Space Telescope (Hao et al., 2007; Spoon et al., 2007; Buchanan et al., 2006; Weedman et al., 2005) have focused on obtaining and analyzing the spectra of local Seyfert galaxies. These observations indicate that most Seyfert 2 galaxies show weak silicate absorption, while most Seyfert 1 galaxies show this same feature weakly in emission. Strong silicate absorption features are clearly seen in local Ultra-Luminous InfraRed Galaxies (ULIRGs) (Spoon et al., 2007). Most quasars (e.g., PG quasars observed by Hao et al., 2005) tend to show strong and silicate emission bands.
Buchanan et al. (2006) present an IRAS -selected sample of 87 Seyfert 1s and 2s. They present principal component analysis (PCA) of nuclear spectra extracted from this sample. Using ISO data, Clavel et al. (2000) reported a factor of difference between Seyfert 1s and 2s for the continuum at . However, Lutz et al. (2004) using ISO data again, showed that the starburst-corrected continuum luminosities at were correlated with absorption-corrected hard X-ray luminosities, implying no significant difference between Seyfert 1s and Seyfert 2s. With the Spitzer InfraRed Spectrograph (IRS, Houck et al., 2004) observations, Buchanan et al. (2006) find a factor of difference at between Seyfert 1s and Seyfert 2s. The results of Buchanan et al. (2006) and Clavel et al. (2000) suggest that the continuum shortward of is suppressed in Seyfert 2s as compared to Seyfert 1s. This is in agreement with the expected orientation effect in the unification models. Contemporaneous multiwavelength observations are needed to settle the issue.
Thus, the current body of evidence from IRS spectra suggests that the silicate strengths are weak and probably are representative of those expected from clumpy torus models (Nenkova et al., 2002). Yet, the behavior of the spectral slope appears to correlate with optical Seyfert type: Seyfert 1s have stronger short wavelength mid-IR emission than Seyfert 2s. If, Seyfert 1.8/1.9s are indeed viewed at intermediate angle between Seyfert 1s and Seyfert 2s, the nature of their mid-IR spectra should reveal insights into the dust distribution responsible for these trends. In §2 we describe our sample and the data analysis. In §3 we present the main observational results. Finally in §4, we summarize the results and discuss their implications.
2 Observations and Data Analysis
We have obtained IRS staring mode observations (Spitzer general observer proposal #3374, PI: S. Kraemer) of 12 Seyfert 1.8-1.9 galaxies. Dusty structures are common in the disks of Seyfert host galaxies (Malkan et al., 1998; Martini et al., 2003) and hence it is important to minimize the effects of the host galaxy environment on the nuclear mid-IR spectra. Thus, we chose face-on () Seyfert 1.8 and 1.9 systems for this study. We obtained low resolution (), short low (SL, ) and long low (LL, ) spectra. The spectra from all the modules of the IRS (SL and LL) were obtained in two slit (“nod”) positions, with varying number of exposure cycles per observation, commensurate with the mid-IR brightness of the target as estimated from the IRAS fluxes. The IRS slits have different slit widths for each module. The SL2 slit111Spitzer Observer’s Manual, http://ssc.spitzer.caltech.edu/documents/SOM/ is , while SL1 is . The LL2 slit is , while LL1 is . At a of , corresponds to about for . Thus, for a full aperture extraction, the SL slit will sample about in the dispersion direction at of .
The 12 galaxies in our sample are listed in Table 1 with their respective Seyfert type, the ratio of host galaxy minor to major axis () and their redshifts. The values for the Seyfert type, and redshift were taken from the NASA Extragalactic Database (NED). Based on the nature of mid-IR spectra of NGC 7603 and NGC 2622 as compared to mid-IR spectra of Seyfert 1s (Buchanan et al., 2006), we suggest that these objects are really Seyfert 1s at the time of observations. These sources are known to have variable Seyfert type (Tohline & Osterbrock, 1976; Goodrich, 1995) and have transitioned back and forth between Seyfert 1 and Seyfert 1.8 states several times in past. Mrk 622 was considered to be a Seyfert 1.9 (Goodrich, 1995), but its Seyfert type is listed in NED as Seyfert 2, and its mid-IR continuum is similar to those of Seyfert 2s like Mrk 3. Thus, this reclassification leads our sample of 12 galaxies to have 9 Seyfert 1.8/1.9s, 2 Seyfert 1s, and 1 Seyfert 2.
To compare our Seyfert 1.8 and 1.9 spectra with the spectra of Seyfert 1s and Seyfert 2s, we obtained the available Spitzer archival datasets originally presented in Buchanan et al. (2006) and Weedman et al. (2005). The observations by Buchanan et al. (2006) are IRS spectral maps; hence we have extracted spectra only from the central slit with the nuclear point source. These comprise a total of 58 Seyfert galaxies with 19 Seyfert 1s, 4 Seyfert 1.8/1.9s (NGC 4579, NGC 4602, NGC 7314, and UGC 7064), and 35 Seyfert 2 galaxies. NGC 7603 and UGC 7064 are common between their sample and our dataset. To this sample, we add observations of NGC 4151 (Seyfert 1.5) and Mrk 3 (Seyfert 2) from Weedman et al. (2005). The sample from Buchanan et al. (2006) includes NGC 4151 and we note that both the spectra match well with each other. Thus, from the archival sample, we have 19 Seyfert 1s (with NGC 7603 considered to be a Seyfert 1), 36 Seyfert 2s (including Mrk 3) and 3 Seyfert 1.8/1.9s, a total of 58 Seyferts with low resolution spectra. For this archival sample, we extracted the , the Seyfert type and the redshift from NED.
Combining with our sample with the archival sample, we have 20 Seyfert 1s (considering NGC 2622 from our sample to be a Seyfert 1), 37 Seyfert 2s (with Mrk 622 from our sample), 12 Seyfert 1.8/1.9s (3 archival, 9 from our sample), making a total of 69 Seyferts with low resolution spectra. We also have high resolution datasets for targets from our sample, but in this paper we restrict ourselves to only low resolution datasets.
We started with the basic calibrated data (BCD) as processed with the S13.2 pipeline. We used the SMART data analysis system (Higdon et al., 2004) for the reductions. For low resolution spectra, individual exposures per “nod” position were median combined at the image level. The median combined detector images from one of the orders were then differenced with the ones from the opposite order (e.g., SL2 minus SL1 for first nod position) and vice-versa to subtract the sky background and to correct rogue pixels. The spectra were extracted with the “automatic tapered column point source” option in SMART with no sky subtraction (since this was done at the image level). The spectrum for each “nod” position was then clipped at the end of the spectrum where the spectral response function dies off. We cleaned the data of obviously deviant data points and those data points that were flagged as bad data from the Spitzer pipeline. The spectra from each nod position for a given order (e.g., two nod positions for second order SL spectrum) were then averaged to form the final spectrum for that order. The final spectra for each order where then scaled with respect to the adjacent order so that the LL2 spectrum matched the flux level of the LL1 spectrum, SL1 was matched to the scaled LL2 and SL2 was scaled to match the scaled SL1 spectrum. These scale factors typically ranged from to with most of the scale factors less than . The few large scale factors are likely due to the presence of extended mid-IR emission. The objects most affected are: NGC 5929, UGC 11680, NGC 1667, MCG-3-34-63, NGC 2639 and MRK 471. The archival observations from Buchanan et al. (2006) are IRS mapping mode observations, and hence they have a single “center nod” position. The sky subtraction was done using off-order detector images, in a similar way to the staring mode observations where we differenced off-order images with same nod position. The off-order subtraction avoids the problem of differencing nod positions, where it is possible to subtract the source from itself. The final spectra were then resampled to a common wavelength grid. An exact match between spectra extracted from different observing programs for NGC 7603, UGC 7064 and NGC 4151 showed that our spectral extraction process is consistent.
The reduced low resolution IRS spectra of 12 target Seyfert galaxies from our sample are displayed in Figure 1. We plot the spectra as instead of the customary as it allows us to study the spectral features in the range in better contrast to the range. We do not reproduce the spectra from Buchanan et al. (2006), but an overview of the continuum shapes as seen in units is given in Figure 2.
We performed further analysis with generic spectrum analysis programs available in IDL. We have measured three quantities: the emission line fluxes, the equivalent widths of the silicate absorption or emission feature and the PAH features, and the continuum fluxes at 6, 15, 20 and on the complete spectra. The continuum fluxes were measured by weighted averaging of the flux values in a bin centered at 6, 15, 20 and . Table 2 lists the continuum fluxes measured directly from the spectra. Table 3 lists the equivalent width of the PAH and the equivalent width of the silicate feature. Table 4 lists the various narrow emission line fluxes measured for each object from the low resolution data.
For emission line fluxes, we measured the feature with continuum points selected on the two sides of the peak of the feature. If the feature was blended with other features, we have selected the continuum points along the spectrum such that only the visible contribution of the feature is measured. We did not attempt deblending of the features which is planned for a future paper. The flux in the feature was obtained by integrating the area under the curve above the interpolated local continuum. The features were measured three times with slightly different continuum points to obtain continuum placement errors. The 1- uncertainty of these separate measurements were then added in quadrature to the uncertainty in the flux measurement as estimated from 1- uncertainties on the individual flux points. This value represents the final uncertainty on the flux measurements. We also measured the flux of the 6.2 PAH feature.
A related issue here is that the [Ne II] emission line is blended with the PAH and the measurement of its flux may be affected due to this. We have high resolution spectra for 12 (11 from our sample and Mrk 3) galaxies in our sample. After examining the high resolution spectra, we note that the [Ne II] line typically lies between 12.70 to 12.90. We used these same limits on the low dispersion spectra and measured the line fluxes. The [Ne II] line is distinguishable from the PAH feature in the low resolution spectra. The median value of the absolute difference between the high and low dispersion measurements for the 12 galaxies is 0.08. However, the median value of the relative error () between the high dispersion and the low dispersion measurement is as high as 47% for these 12 galaxies. Assuming that our high-dispersion measurements are correct, this indicates a significant mismatch between the high resolution and low resolution line flux measurements. The cause of this mismatch is unclear. The continuum of both high and low resolution spectra have similar shapes but they do not necessarily match each other in the scaling; this could be due to different exposure times, slit widths and the fact that we can not perform sky subtraction for high resolution data. Also, the region of galaxy sampled by the high and low dispersion slits are different due to the different orientations of the slits. A combination of these different observing conditions may lead to this mismatch. Nevertheless, we find a correlation coefficient of 0.87 for the high and low resolution flux measurements for the [Ne II] line and of 0.91 for the [Ne III] line. Thus, overall we estimate that it is possible for [Ne II] measurements to be affected by blending with the PAH for low dispersion measurements. This mismatch between high dispersion and low dispersion fluxes does not appear to affect the measurements of other lines such as [O IV] , [Ne III] , and [Ne V] as they are not blended with a strong PAH feature.
The equivalent widths were measured using a similar approach to the flux measurements except that the spectrum was divided by a continuum and the measurements were done on the continuum-divided spectrum. The continuum was fitted using continuum flux points at 5.5, 14.5, 20, and and a cubic-spline interpolation. The uncertainty due to the subjective choice of the continuum contributes to the uncertainty in the measurement of the equivalent width. We performed a few tests by varying the continuum fit by small amounts and checking the effects of this on the equivalent widths. Based on these tests we estimate that the uncertainty due to subjective choice of the global continuum is 10%. When measuring the equivalent width of the silicate absorption/emission feature, we have not removed the relatively minor contribution from various emission features in the range, the most prominent of which are the emission line and the [S IV] line.
3 Results
Past studies of the mid-IR spectra of active galaxies from ISO have lead to the development of a few spectral diagnostic methods (Sturm et al., 2002; Laurent et al., 2000). Here we present diagnostic diagrams to characterize the properties of Seyfert 1.8s and 1.9s as compared to Seyfert 1s and Seyfert 2s using our Spitzer sample.
3.1 The Nature of the Mid-IR Spectra of Seyferts
The Seyfert 1.8/1.9 spectra in Figure 1 show that there are strong variations in the continuum shapes of Seyferts in the mid-IR. For example, note the spectrum of Mrk 622, NGC 7603 and UGC 12138. The continuum of UGC 12138 rises toward shorter wavelengths, but much less steeply than in the case of NGC 7603. In the case of Mrk 622, the continuum diminishes toward shorter wavelengths. The spectrum of Mrk 334 or of UGC 12138 also show strong PAH bands, as seen in the spectra of starburst galaxies. In fact, most Seyfert 1.8/1.9 spectra are dominated by these PAH features, in striking similarity to those of Seyfert 2s with strong starburst contribution (Buchanan et al., 2006). However, forbidden narrow emission lines such as [Ne V] and [O IV] expected to arise in the NLRs of AGN indicate presence of an active nucleus in these systems.
The mid-IR spectrum of a Seyfert nucleus is the result of re-emission from the dust heated by the strong AGN continuum. Thus, these spectra are mainly dominated by thermal emission due to dust; hot dust () contributes strongly at shorter wavelengths (), warm dust () peaking at , while cold dust () contributes strongly to the continuum at . This is strongly evident in the spectra of Seyfert 1s and Seyfert 2s. Comparing NGC 7603 with the Seyfert 1 spectra from the archival sample, we note that hot dust contributes more in Seyfert 1s, while Seyfert 2s like Mrk 3 and Mrk 622 are dominated by a lack of contribution from hot dust. This lack of contribution from hot dust can plausibly be attributed to the presence of a torus that is optically thick at these mid-IR wavelengths. Circumnuclear or extended star formation contributes independently to both classes as an additional component in the form of PAH features, low-ionization emission lines, and the cold thermal component. There are several forbidden low-ionization lines like [Ne II] , [S III] , [S III] and [Si II] that trace the starburst component (Sturm et al., 2002). Apart from these, there are high-ionization lines like [O IV] , [Ne V] and [Ne V] , that are all indicators of strongly photoionized NLR, revealing the strength of the incident UV/X-ray AGN radiation field in these systems. Due to the relatively low ionization potential of for the [Ne III] , it is possible that this line has a contribution from both AGN and star forming regions. The strengths of the high-ionization lines like [O IV] that arise in the NLR appear to be directly related to the strength of the incident X-ray AGN continuum (Melendez, M.B. et al., in preparation).
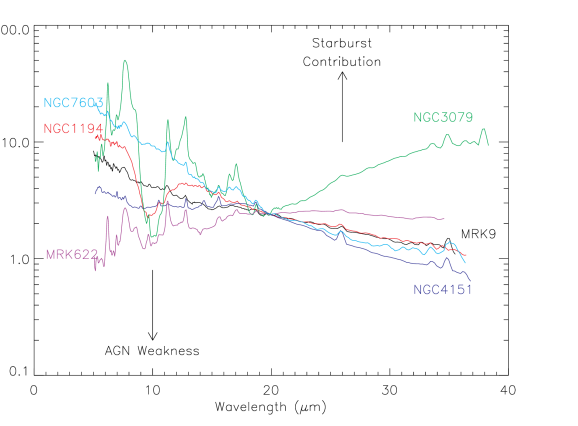
In Figure 2, we show the variety in continuum shapes of the Seyfert sample discussed in this paper by plotting a few representative spectra from the sample. The spectra are scaled to have the same flux at as that of Mrk 9. Further, all the spectra are smoothed by a factor of 10 for clarity on the graph. As can be seen in Figure 2, there are Seyfert galaxies like NGC 7603 or Mrk 9 that show steeping spectra in the range. The spectra that are similar in shape to NGC 4151 show a break around . Such a “break” or “hump” is even more pronounced in spectra like Mrk 622, where the continuum emission decreases in the range. There are also spectra like those of NGC 1194 which show strong absorption while showing strong continua in the range. Apart from these variations, there are spectra that show enhanced contribution from star forming features like PAHs (Mrk 622 and NGC 3079). In such starburst-dominated sources, there is significant contribution at longer wavelengths () giving rise to the red continuum behavior mentioned by Buchanan et al. (2006).
3.2 Spectral Diagnostics
In Figures 3–6 we show the trends in spectral characteristics and their behavior with Seyfert type. In these graphs, Seyfert 1s are represented with plus symbols, Seyfert 2s are square symbols and Seyfert 1.8/1.9s are filled triangles. All systems with are circled. Fluxes are measured in units () and equivalent widths are in microns.
Figure 3 is a comparison of and continuum spectral indices. We define the spectral index as . The continuum fluxes used in this figure are measured directly from the spectrum and not from the fitted continuum. A positive spectral index implies a positive slope on a plot. In this graph, the dashed line shows a single power law (see NGC 7603 and Mrk 9 in Figure 2). A more positive and negative (along the arrow labeled BP) results in a broken power law behavior (NGC 4151 and Mrk 622 in Figure 2). Note that there are a number of Seyfert 2s (e.g., Mrk 3) with positive slopes that have more extreme spectral indices than a Seyfert 1 like NGC 4151. A positive and a negative , along the arrow labeled RC, leads towards a starburst type spectrum with strong long wavelength continuum and well defined PAH bands. Most Seyfert 1.8s and 1.9s are mid-way (in comparison of spectral shapes) between Seyfert 1 types (broken power law, NGC 4151 and NGC 2622) and starburst type spectra like NGC 3079.
Overall, Figure 3 shows that Seyferts have a wide range of continuum shapes in the mid-IR. One possible interpretation is that the Seyfert 2 galaxies in the upper left corner are dominated by components of warm () dust from the nuclear region (e.g., the torus or the inner NLR) that peaks around . These objects have a rather simple thermal continuum, as shown by Mrk 622 in Figure 1. As one moves down and to the right in Figure 3, the increasing contribution from starburst-heated dust (cooler than ) becomes stronger. As one moves from the upper left to middle left in this diagram, we see a larger contribution from the hotter dust in the region, possibly due to heating by the AGN. This is expected for Seyfert 1s, but several Seyfert 2s occupy this region as well. The majority of Seyfert 1.8/1.9s fall in the region occupied by Seyfert 2s with significant star formation.
Figure 4 shows the silicate equivalent width (EW) compared against the spectral index. Negative EWs imply emission features. The silicate EWs are small for most of the Seyferts in the sample. The mean emission EW in our sample is with a median of . The mean absorption EW in our sample is with a median of . Hao et al. (2007) report silicate strengths () for a large sample of quasars, Seyferts and ULIRG galaxies. The quasar and ULIRG silicate strengths bracket the range of for Seyfert galaxies. For quasars, the mean silicate emission strength reported by Hao et al. (2007) is . For ULIRGS, it is . For comparison, we measured the apparent silicate optical depth () at the peak of the feature for our Seyfert sample. The corresponding mean values of silicate strengths () are for Seyfert 1s and for Seyfert 2s. The median values are and , respectively. The mean silicate strength reported by Hao et al. (2007) for Seyfert 1s and Seyfert 2s, from their sample, is -0.18 and -0.61. There are several Seyfert 2s and a Seyfert 1 (NGC 1194) in the upper right region of Figure 4. All of these objects are significantly inclined () and/or are merging with companion objects. NGC 5256 has a fairly high silicate equivalent width and is a face-on host galaxy, but is classified in NED as interacting. Thus, their high equivalent widths are probably a result of absorption in the host galaxy disk rather than being intrinsic to the AGN. The most important result from this graph is that Seyferts with inclined or merging host galaxies should be excluded from studies of the circumnuclear regions and once this is done, the nuclear regions show only weak silicate emission or absorption features.
Figure 5 shows the PAH equivalent width compared to the spectral index. The equivalent widths are negative for emission features and absolute values are plotted on the graph in logarithmic scale. As can be seen, there is a strong correlation between the spectral index and the PAH equivalent width. Increasing spectral index leads to galaxies with increasing contribution from starbursts. Thus, the PAH contribution is strongly correlated with the spectral index, which supports our use of this index as a starburst indicator in Figure 3.
Hao et al. (2007) find that the silicate strengths correlates with the ratio of fluxes at and for a large sample of Seyfert, ULIRG, starburst and QSO sources. The ratio will trace the continuum contribution of cooler () dust from the star forming regions, similar to the ratio as seen in Figure 5. This result in combination with results from Figure 4 and Figure 5, suggests that inclined host galaxy disks will show the effects of a geometrically thick, and cool dust distribution. This effect should be taken into consideration first before invoking other explanations.
Further, Spoon et al. (2007) find that the equivalent width is anti-correlated with silicate absorption strength for ULIRG and starburst galaxies. This result hints that deep silicate absorption that is expected to arise in geometrically and optically thick dust distributions (Levenson et al., 2007) may be connected to highly obscured star forming regions which tend to show weak/absent PAH features. The absence of strong silicate absorptions in PAH-dominated starburst spectra, and their presence in highly inclined and/or merging systems (Figure 4), suggests that the observed deep silicate absorptions may originate primarily in cool dusty regions on scales of hundreds of parsecs.
Figure 6 shows the [O IV] to [Ne II] ratio compared to the [Ne III] to [Ne II] ratio. There is a strong correlation, with Seyfert 2s and Seyfert 1.8/1.9s showing mostly low [O IV]/[Ne II] ratios and low [Ne III]/[Ne II] ratios. We see a similar correlation with [Ne V]/[Ne II], although there are fewer data points. Most Seyfert 1s have high [O IV]/[Ne II], [Ne V]/[Ne II] and [Ne III]/[Ne II]. This correlation for Seyfert 1.8-1.9s and Seyfert 2s indicates that their NLRs may be subject to similar amounts of ionization, whereas at least a component of the NLR in Seyfert 1s may experience higher ionization states, in general. Another alternative that can lead to the correlation in Figure 6 is that Seyfert 1.8, 1.9 and 2s have more star formation than Seyfert 1s on a absolute scale, and hence stronger [Ne II]. There could be two measurement errors that can affect this correlation as pointed out by the referee: (1) the [Ne II] line fluxes have a contribution from adjacent PAH in the low resolution measurements, and (2) the [O IV] line is blended with [Fe II] , and hence starburst dominated systems will have a contribution from the [Fe II] line as in the case of NGC 3079 (Weedman et al., 2005). We discussed the possibility of contamination of [Ne II] at the end of the last section, and came to the conclusion that by carefully measuring the line, without deblending the lines, our fluxes appear to be consistent with high resolution measurements. We examined the high and low resolution spectra around the [O IV] line and estimated that out of 12 Seyfert galaxies in our sample, only 3 show comparable contribution from the [Fe II] line. Without additional high resolution datasets, we can not rule out that other starburst dominated systems will show this effect, but it appears to be unlikely if the [O IV] line is seen along with [Ne V] line in the same spectrum. In the case of Mrk 3, we estimate that [Fe II] contributes less than 10% of the flux as compared to [O IV].
4 Conclusions
We have compared the mid-IR spectral properties of 12 Seyfert 1.8/1.9s with those of 57 Seyfert 1/1.5s and Seyfert 2s from Buchanan et al. (2006) and Weedman et al. (2005). The main results are as below.
The Seyfert mid-IR spectra appear to be dominated by differing contributions of three main thermal components: (1) the hot dust () heated by the nucleus at the inner radius of the dust torus contributing strongly to the continuum in ; (2) the warm dust () heated by the nucleus that is expected to be at distances of tens of parsec from the center; (3) cooler dust () from surrounding circumnuclear star-forming regions on scales of hundreds of parsec giving rise to the continuum in the range. This intrinsic form of the continuum is further modified by: (1) the contribution from PAH emission of unobscured circum-nuclear star forming regions, and (2) extinction from cold dust in the host galaxy plane for merging and/or highly inclined host galaxies. Thus, before we can study extinction due to the dust torus, it is necessary to exclude AGN with inclined host disks or mergers from such a study.
The optical classifications of Seyferts do not always carry over to corresponding spectral shapes in the mid-IR, but there seems to be a general agreement for Seyfert 1s to show mostly single or broken “power-law” type behavior. Seyfert 2s tend to show a variety of spectral shapes from single and broken “power-laws” to PAH-and-red-continuum dominated spectra. (see Figure 2), in agreement with trends noted by Buchanan et al. (2006). The simplest mid-IR spectra appear to be those of Seyfert 2 galaxies with little star formation (e.g., Mrk 3), which are dominated by a prominent thermal component that peaks at , leading to the expected temperature of this component. We suggest that this component is present in many Seyfert spectra and becomes evident as the “break”. Seyfert 1s tend to have emission from a hotter component () in the band and, in many cases, weak silicate emission, in general agreement with the Unified Model prediction that we are looking down the hot throat of the dusty torus in type 1 objects.
The equivalent width of the silicate feature in Seyfert galaxies is much weaker than expected from uniform density compact torus models (see Figure 4), confirming previous Spitzer results by Shi et al. (2006), Spoon et al. (2007) and Hao et al. (2007). From the analysis we presented earlier, we note that the Seyfert galaxies that are highly inclined or interacting with companions in our sample show strong silicate absorptions. Hao et al. (2007) find that the silicate strengths correlate with the ratio of fluxes at and for a large sample of Seyfert, ULIRG, starburst and QSO sources. This hints that at least in some Seyfert galaxies, the strength of the silicate feature is significantly affected by contamination from dust in the host galaxy. We note that this component has been ignored by a number of recent studies.
We find a strong correlation between the PAH equivalent width and the spectral index (Figure 5). The mid-IR starburst contribution can thus be characterized using either diagnostic. It appears that very strong PAHs go together with very red continua toward . On average, Seyfert 1s tend to show weaker PAH equivalent widths than Seyfert2s and Seyfert 1.8/1.9s. We note however, that measuring absolute starburst contribution between Seyfert types will need more work.
In general, the mid-IR spectra of Seyfert 1.8 and 1.9 galaxies are similar in shape and PAH strengths (Figure 5) with spectra of Seyfert 2 galaxies with starbursts. This is surprising, since the optical spectra of Seyfert 1.8-1.9s indicate only a modest amount of reddening of the BLR, typically (Goodrich, 1995). This leads to a relatively small extinction in the mid-IR, and therefore one would expect that the Spitzer IRS spectra of Seyfert 1.8-1.9s should look more like Seyfert 1s. We speculate that the enhanced starburst contribution seen in Seyfert 1.8/1.9 spectra may be a combined result of presence of intrinsically stronger star formation in the Spitzer aperture and/or weaker intrinsic AGN continuum in some Seyfert 1.8/1.9s. Further work on this is being done and results will be reported in an upcoming paper.
In Figure 6 we showed a strong correlation for Seyfert 2s and Seyfert 1.8-1.9s, which tend to show low [O IV]/[Ne II] and [Ne III]/[Ne II]. There could be three possible scenarios that could give rise to the observed low [O IV]/[Ne II]: (1) the ionization state of the NLR is low in Seyfert 1.8/1.9s and Seyfert 2s as compared to Seyfert 1s in the sample, (2) the starburst component as traced by [Ne II] and PAH fluxes is stronger in Seyfert 1.8, 1.9 and 2s than in Seyfert 1s, and, (3) these Seyfert 1.8/1.9s have hidden inner NLRs and are subject to significant obscuration of high-ionization NLR lines. We can rule out the last scenario for Seyfert 1.8-1.9s. The modest amount of extinction observed in the optical for Seyfert 1.8-1.9s suggests that the extinction should be negligible in the mid-IR; thus Seyfert 1.8-1.9s should have similar [O IV]/[Ne II] ratio as Seyfert 1s, which is not observed in Figure 6. If the starburst contribution is similar between Seyfert 1s and Seyfert 1.8-1.9s, but the intrinsic AGN continuum is weaker in Seyfert 1.8-1.9s, then that hints at intrinsically low ionization state of the NLRs of Seyfert 1.8-1.9s. On the other hand, the observed correlation between Seyfert 1.8/1.9s and Seyfert 2s, and the possibility of starburst contribution to [Ne III] suggests that similar circum-nuclear starburst contribution between Seyfert 2s and Seyfert 1.8/1.9s can give rise to this correlation. However, this does not explain why the Seyfert 1.8/1.9s do not show stronger short wavelength (hot dust) contribution like Seyfert 1s, in spite of their low in the optical. An ability to separate absolute contribution of the active nucleus from the absolute contribution of the starburst is essential for further progress and we are pursuing this actively.
The AGN type variability and misclassification of Seyfert galaxies may be a plausible reason for mismatch between the optical Seyfert classification and the expected mid-IR spectral shapes. Some Seyfert 1.8/1.9 galaxies are known to transition back-and-forth between a type 1 and a type 2 class object. The first such detection was for NGC 7603 (one of our targets in this study) by Tohline & Osterbrock (1976). Goodrich (1995, 1989) noted that NGC 7603 and NGC 2622 (also one of our targets), transitioned from a Seyfert 1.8 to a Seyfert 1.5 class possibly as a result of changes in the intrinsic line of sight reddening. In the mid-IR, they show steepening spectra towards short wavelengths (see Figure 1) as compared to the rest of our sample, indicative of Seyfert 1.5 spectra. The mid-IR spectrum of NGC 2622 is similar in it’s continuum shape to the mid-IR spectrum of NGC 4151 (see, Weedman et al., 2005, and Figure 2), except that NGC 2622 shows strong PAH bands. The mid-IR spectrum of NGC 7603 is, however, markedly different than the rest and has characteristics of a type 1 quasar spectrum with strong emission bands at and and very little cool dust emission at longer wavelengths. NGC 7603 does however have some starburst contribution in the form of PAH bands (See Figure 5). Thus, it is important to compare contemporaneous optical and mid-IR spectra when possible to eliminate the possibility of type variability in the spectra. For the specific case of Seyfert 1.8/1.9s discussed in this paper, comparison with contemporaneous optical spectra and X-ray observations is being done and results will be reported in a follow-up paper.
References
- Antonucci (1993) Antonucci, R. 1993, ARA&A, 31, 473
- Antonucci & Miller (1985) Antonucci, R. R. J., & Miller, J. S. 1985, ApJ, 297, 621
- Buchanan et al. (2006) Buchanan, C. L., Gallimore, J. F., O’Dea, C. P., Baum, S. A., Axon, D. J., Robinson, A., Elitzur, M., & Elvis, M. 2006, AJ, 132, 401
- Clavel et al. (2000) Clavel, J., Schulz, B., Altieri, B., Barr, P., Claes, P., Heras, A., Leech, K., Metcalfe, L., & Salama, A. 2000, A&A, 357, 839
- Efstathiou & Rowan-Robinson (1995) Efstathiou, A., & Rowan-Robinson, M. 1995, MNRAS, 273, 649
- Genzel & Cesarsky (2000) Genzel, R., & Cesarsky, C. J. 2000, ARA&A, 38, 761
- Goodrich (1989) Goodrich, R. W. 1989, ApJ, 340, 190
- Goodrich (1995) —. 1995, ApJ, 440, 141
- Granato & Danese (1994) Granato, G. L., & Danese, L. 1994, MNRAS, 268, 235
- Hao et al. (2005) Hao, L., Spoon, H. W. W., Sloan, G. C., Marshall, J. A., Armus, L., Tielens, A. G. G. M., Sargent, B., van Bemmel, I. M., Charmandaris, V., Weedman, D. W., & Houck, J. R. 2005, ApJ, 625, L75
- Hao et al. (2007) Hao, L., Weedman, D. W., Spoon, H. W. W., Marshall, J. A., Levenson, N. A., Elitzur, M., & Houck, J. R. 2007, ApJ, 655, L77
- Higdon et al. (2004) Higdon, S. J. U., Devost, D., Higdon, J. L., Brandl, B. R., Houck, J. R., Hall, P., Barry, D., Charmandaris, V., Smith, J. D. T., Sloan, G. C., & Green, J. 2004, PASP, 116, 975
- Houck et al. (2004) Houck, J. R., Roellig, T. L., van Cleve, J., Forrest, W. J., Herter, T., Lawrence, C. R., Matthews, K., Reitsema, H. J., Soifer, B. T., Watson, D. M., Weedman, D., Huisjen, M., Troeltzsch, J., Barry, D. J., Bernard-Salas, J., Blacken, C. E., Brandl, B. R., Charmandaris, V., Devost, D., Gull, G. E., Hall, P., Henderson, C. P., Higdon, S. J. U., Pirger, B. E., Schoenwald, J., Sloan, G. C., Uchida, K. I., Appleton, P. N., Armus, L., Burgdorf, M. J., Fajardo-Acosta, S. B., Grillmair, C. J., Ingalls, J. G., Morris, P. W., & Teplitz, H. I. 2004, ApJS, 154, 18
- Khachikian & Weedman (1974) Khachikian, E. Y., & Weedman, D. W. 1974, ApJ, 192, 581
- Laurent et al. (2000) Laurent, O., Mirabel, I. F., Charmandaris, V., Gallais, P., Madden, S. C., Sauvage, M., Vigroux, L., & Cesarsky, C. 2000, A&A, 359, 887
- Levenson et al. (2007) Levenson, N. A., Sirocky, M. M., Hao, L., Spoon, H. W. W., Marshall, J. A., Elitzur, M., & Houck, J. R. 2007, ApJ, 654, L45
- Lutz et al. (2004) Lutz, D., Maiolino, R., Spoon, H. W. W., & Moorwood, A. F. M. 2004, A&A, 418, 465
- Malkan et al. (1998) Malkan, M. A., Gorjian, V., & Tam, R. 1998, ApJS, 117, 25
- Martini et al. (2003) Martini, P., Regan, M. W., Mulchaey, J. S., & Pogge, R. W. 2003, ApJ, 589, 774
- Miller & Antonucci (1983) Miller, J. S., & Antonucci, R. R. J. 1983, ApJ, 271, L7
- Murayama & Taniguchi (1998) Murayama, T., & Taniguchi, Y. 1998, ApJ, 497, L9+
- Nagao et al. (2000) Nagao, T., Taniguchi, Y., & Murayama, T. 2000, AJ, 119, 2605
- Nenkova et al. (2002) Nenkova, M., Ivezić, Ž., & Elitzur, M. 2002, ApJ, 570, L9
- Osterbrock (1981) Osterbrock, D. E. 1981, ApJ, 249, 462
- Pier & Krolik (1992) Pier, E. A., & Krolik, J. H. 1992, ApJ, 401, 99
- Pier & Krolik (1993) —. 1993, ApJ, 418, 673
- Shi et al. (2006) Shi, Y., Rieke, G. H., Hines, D. C., Gorjian, V., Werner, M. W., Cleary, K., Low, F. J., Smith, P. S., & Bouwman, J. 2006, ApJ, 653, 127
- Spoon et al. (2004) Spoon, H. W. W., Armus, L., Cami, J., Tielens, A. G. G. M., Chiar, J. E., Peeters, E., Keane, J. V., Charmandaris, V., Appleton, P. N., Teplitz, H. I., & Burgdorf, M. J. 2004, ApJS, 154, 184
- Spoon et al. (2007) Spoon, H. W. W., Marshall, J. A., Houck, J. R., Elitzur, M., Hao, L., Armus, L., Brandl, B. R., & Charmandaris, V. 2007, ApJ, 654, L49
- Sturm et al. (2000) Sturm, E., Lutz, D., Tran, D., Feuchtgruber, H., Genzel, R., Kunze, D., Moorwood, A. F. M., & Thornley, M. D. 2000, A&A, 358, 481
- Sturm et al. (2002) Sturm, E., Lutz, D., Verma, A., Netzer, H., Sternberg, A., Moorwood, A. F. M., Oliva, E., & Genzel, R. 2002, A&A, 393, 821
- Tohline & Osterbrock (1976) Tohline, J. E., & Osterbrock, D. E. 1976, ApJ, 210, L117
- Urry & Padovani (1995) Urry, C. M., & Padovani, P. 1995, PASP, 107, 803
- Verma et al. (2005) Verma, A., Charmandaris, V., Klaas, U., Lutz, D., & Haas, M. 2005, Space Science Reviews, 119, 355
- Weedman et al. (2005) Weedman, D. W., Hao, L., Higdon, S. J. U., Devost, D., Wu, Y., Charmandaris, V., Brandl, B., Bass, E., & Houck, J. R. 2005, ApJ, 633, 706
- Werner et al. (2004) Werner, M. W., Roellig, T. L., Low, F. J., Rieke, G. H., Rieke, M., Hoffmann, W. F., Young, E., Houck, J. R., Brandl, B., Fazio, G. G., Hora, J. L., Gehrz, R. D., Helou, G., Soifer, B. T., Stauffer, J., Keene, J., Eisenhardt, P., Gallagher, D., Gautier, T. N., Irace, W., Lawrence, C. R., Simmons, L., Van Cleve, J. E., Jura, M., Wright, E. L., & Cruikshank, D. P. 2004, ApJS, 154, 1
Spitzer/IRS Spectra of Seyfert 1.8s and 1.9s in units (rest frame). PAH emission features and narrow emission lines are identified above the spectra, and the possible locations of and silicate emission or absorption are noted below the spectra.
Variations in AGN continuum: Mrk 9 (Seyfert 1.5, single power law — SP), NGC 1194 (Seyfert 1, single power law with silicate absorption), NGC 4151 (Seyfert 1.5, broken power law — BP), Mrk 622 (Seyfert 1.9, broken power law — BP), NGC 3079 (Seyfert 2, strong PAH, strong red continuum — RC), and NGC 7603 (Seyfert 1.5, unusual quasar like spectrum, strong silicate emission feature at ). The spectra have been normalized to the flux at and smoothed by a factor of 2. The right arrow indicates that as the spectral index becomes positive, the mid-IR spectrum is more and more dominated by starburst features like PAH bands. The left arrow shows the amount of variations in the spectral index, as we go down from NGC 7603 to Mrk 622 the contribution of the hottest dust decreases. Optical Seyfert classifications do not always agree with the shape of the mid-IR spectrum.
spectral index vs. spectral index. BP — Broken Power law, SP — Single Power law and RC — Red Continuum. See Figure 2 for example spectra.
Silicate equivalent width () vs. spectral index. The circled symbols have host galaxies with . NGC 5256 has a fairly high equivalent width and is a face-on host galaxy, but is classified as interacting (source: NED).
The PAH equivalent width vs. the spectral index. Equivalent widths are negative for emission features and absolute values are plotted here on logarithmic scale. Going from left to right on the x-axis, starburst contribution to the spectrum increases.
/[Ne II] ratio vs. . [Ne III] /[Ne II] ratio. Correlation between Seyfert 1.8-1.9s and Seyfert 2s indicates that both subclasses of Seyfert galaxies have similar amounts of NLR ionization or they have intrinsically stronger starburst contribution as compared to Seyfert 1s.
| Galaxy Name | Seyfert Type | ||
|---|---|---|---|
| Mrk 471 | 0.034 | 0.67 | Sey 1.8 |
| Mrk 622 | 0.023 | 0.95 | Sey |
| Mrk 883 | 0.038 | 1.00 | Sey 1.8 |
| NGC 2622 | 0.029 | 0.50 | Sey |
| Mrk 334 | 0.022 | 0.70 | Sey 1.8 |
| UGC 7064 | 0.025 | 1.00 | Sey 1.8 |
| Mrk 609 | 0.034 | 0.90 | Sey 1.8 |
| NGC 7603 | 0.030 | 0.67 | Sey |
| UM 146 | 0.017 | 0.77 | Sey 1.9 |
| UGC 12138 | 0.025 | 0.88 | Sey 1.8 |
| NGC 2639 | 0.011 | 0.61 | Sey 1.9 |
| NGC 3786 | 0.009 | 0.59 | Sey 1.8 |
Note. — The redshift of galaxies (), the and the Seyfert type are taken from the NASA Extragalactic Database (NED).
| Continuum flux () at | |||||
|---|---|---|---|---|---|
| Galaxy | Seyfert Typea | ||||
| CGCG381-051 | Sey 2 | 1.66 0.86 | 1.80 0.06 | 2.57 0.05 | 1.92 0.03 |
| E33-G2 | Sey 2 | 6.36 0.49 | 3.67 0.06 | 2.66 0.10 | 1.23 0.04 |
| F01475-0740 | Sey 2 | 2.94 0.59 | 3.43 0.11 | 3.55 0.13 | 2.15 0.05 |
| F04385-0828 | Sey 2 | 15.55 0.61 | 9.01 0.29 | 7.92 0.22 | 6.33 0.10 |
| F15480-0344 | Sey 2 | 2.95 0.28 | 3.40 0.09 | 3.48 0.08 | 2.23 0.04 |
| IC4329A | Sey 1.2 | 35.31 1.83 | 18.49 0.46 | 14.30 0.42 | 6.11 0.13 |
| Mrk 334 | Sey 1.8 | 6.56 2.38 | 3.49 0.13 | 4.31 0.11 | 4.56 0.06 |
| Mrk 335 | Sey 1.2 | 8.03 0.52 | 2.52 0.08 | 2.00 0.10 | 1.01 0.03 |
| Mrk 348 | Sey 2 | 8.06 0.33 | 5.12 0.12 | 4.14 0.18 | 1.90 0.07 |
| Mrk 471 | Sey 1.8 | 0.96 0.35 | 0.37 0.02 | 0.32 0.02 | 0.30 0.01 |
| Mrk 6 | Sey 1.5 | 8.69 0.72 | 4.13 0.27 | 3.88 0.12 | 2.06 0.05 |
| Mrk 609 | Sey 1.8 | 2.97 1.44 | 1.33 0.09 | 1.38 0.03 | 1.45 0.01 |
| Mrk 622 | Sey 2 | 1.03 0.40 | 1.51 0.09 | 1.93 0.03 | 1.84 0.02 |
| Mrk 79 | Sey 1.2 | 11.24 0.64 | 5.20 0.14 | 4.26 0.09 | 2.56 0.06 |
| Mrk 817 | Sey 1.5 | 7.66 0.46 | 5.11 0.14 | 5.37 0.16 | 3.89 0.07 |
| Mrk 883 | Sey 1.8 | 0.76 0.27 | 0.64 0.06 | 0.89 0.03 | 1.01 0.01 |
| Mrk 9 | Sey 1.5 | 6.78 0.51 | 2.68 0.06 | 2.38 0.06 | 1.45 0.04 |
| Mrk 938 | Sey 2 | 10.41 5.42 | 5.80 0.16 | 7.68 0.37 | 14.52 0.16 |
| M-2-33-34 | Sey 1 | 1.84 0.45 | 1.61 0.27 | 1.56 0.07 | 1.17 0.01 |
| M-2-40-4 | Sey 2 | 13.95 0.62 | 6.03 0.13 | 4.93 0.10 | 3.58 0.05 |
| M-2-8-39 | Sey 2 | 2.03 0.30 | 3.10 0.07 | 2.39 0.08 | 0.98 0.04 |
| M-3-34-63 | Sey 2 | 1.09 0.60 | 0.28 0.04 | 0.28 0.05 | 0.37 0.01 |
| M-3-58-7 | Sey 2 | 11.74 0.75 | 4.93 0.08 | 4.78 0.08 | 3.33 0.07 |
| M-5-13-17 | Sey 1.5 | 3.20 0.44 | 2.79 0.09 | 2.67 0.06 | 1.87 0.03 |
| M-6-30-15 | Sey 1.2 | 12.17 0.55 | 5.85 0.10 | 4.84 0.12 | 2.50 0.06 |
| NGC 1056 | Sey 2 | 3.75 2.51 | 1.34 0.15 | 1.48 0.11 | 1.79 0.04 |
| NGC 1125 | Sey 2 | 3.23 0.85 | 3.12 0.23 | 3.28 0.08 | 3.84 0.03 |
| NGC 1143-4 | Sey 2 | 2.0 0.43 | |||
| NGC 1194 | Sey 1 | 13.99 0.80 | 4.90 0.16 | 3.20 0.08 | 2.00 0.03 |
| NGC 1241 | Sey 2 | 2.15 0.76 | 1.27 0.12 | 1.12 0.12 | 1.12 0.03 |
| NGC 1320 | Sey 2 | 9.45 0.39 | 6.36 0.15 | 5.55 0.17 | 3.58 0.07 |
| NGC 1667 | Sey 2 | 3.31 1.85 | 1.16 0.11 | 1.08 0.04 | 1.12 0.03 |
| NGC 2622 | Sey 1 | 0.84 0.07 | 0.74 0.04 | 0.62 0.02 | 0.34 0.01 |
| NGC 2639 | Sey 1.9 | 1.44 0.18 | 0.41 0.05 | 0.38 0.02 | 0.44 0.01 |
| NGC 3079 | Sey 2 | 21.20 11.51 | 5.54 0.38 | 3.81 0.23 | 10.47 0.32 |
| NGC 3227 | Sey 1.5 | 8.61 0.78 | 8.71 0.20 | 6.30 0.12 | |
| NGC 3516 | Sey 1.5 | 11.10 0.66 | 5.12 0.14 | 4.58 0.10 | 2.78 0.05 |
| NGC 3786 | Sey 1.8 | 3.05 0.68 | 1.23 0.10 | 1.09 0.02 | 0.99 0.01 |
| NGC 3982 | Sey 2 | 1.59 0.60 | 1.28 0.11 | 1.43 0.06 | 1.42 0.03 |
| NGC 4051 | Sey 1.5 | 14.37 0.98 | 8.77 0.22 | 7.39 0.32 | 4.42 0.05 |
| NGC 4151 | Sey 1.5 | 47.16 2.18 | 35.85 1.88 | 30.08 0.97 | 12.99 0.20 |
| NGC 424 | Sey 2 | 35.01 1.79 | 14.44 0.25 | 10.36 0.32 | 4.42 0.13 |
| NGC 4579 | Sey 1.9 | 3.42 0.37 | |||
| NGC 4602 | Sey 1.9 | 1.34 0.63 | 0.64 0.04 | 0.74 0.11 | 0.78 0.03 |
| NGC 4941 | Sey 2 | 1.54 0.15 | 1.64 0.08 | 1.24 0.03 | |
| NGC 4968 | Sey 2 | 6.13 0.94 | 6.26 0.22 | 5.75 0.18 | 3.37 0.05 |
| NGC 5005 | LINER | 7.91 1.68 | 2.02 0.16 | 1.83 0.12 | 3.40 0.09 |
| NGC 513 | Sey 2 | 1.97 0.41 | 1.29 0.10 | 1.24 0.09 | 1.05 0.03 |
| NGC 5256 | Sey 2 | 4.75 2.79 | 2.35 0.26 | 2.75 0.09 | 3.87 0.01 |
| NGC 526A | Sey 1.5 | 3.60 0.07 | 2.67 0.12 | 0.83 0.02 | |
| NGC 5347 | Sey 2 | 4.38 0.43 | 5.45 0.13 | 5.04 0.13 | 2.87 0.07 |
| NGC 5548 | Sey 1.5 | 4.17 0.09 | 3.68 0.07 | 1.95 0.06 | |
| NGC 5929 | Sey 2 | 2.73 0.87 | 0.37 0.10 | 0.40 0.05 | 0.48 0.01 |
| NGC 5953 | Sey 2 | 5.23 2.94 | 2.77 0.22 | 2.87 0.09 | 3.42 0.07 |
| NGC 7130 | Sey 2 | 6.26 2.22 | 6.08 0.27 | 7.69 0.21 | 9.36 0.06 |
| NGC 7172 | Sey 2 | 3.94 0.25 | 2.34 0.07 | 2.86 0.04 | |
| NGC 7314 | Sey 1.9 | 2.30 0.15 | 1.72 0.07 | 1.33 0.01 | |
| NGC 7469 | Sey 1.2 | 26.83 8.20 | 19.37 0.47 | 23.65 0.17 | 23.83 0.29 |
| NGC 7496 | Sey 2 | 4.38 2.27 | 4.26 0.12 | 6.03 0.21 | 7.31 0.07 |
| NGC 7603 | Sey 1 | 14.11 0.73 | 3.16 0.08 | 1.86 0.09 | 0.97 0.01 |
| NGC 7674 | Sey 2 | 13.19 0.74 | 9.18 0.33 | 8.46 0.18 | 5.78 0.14 |
| NGC 931 | Sey 1.5 | 14.54 1.11 | 7.11 0.20 | 5.70 0.15 | 3.24 0.07 |
| TOL 1238-364 | Sey 2 | 6.53 1.02 | 9.56 0.29 | 10.98 0.27 | 7.91 0.08 |
| UGC 11680 | Sey 2 | 5.18 0.66 | 2.45 0.27 | 2.68 0.42 | 1.60 0.65 |
| UGC 12138 | Sey 1.8 | 2.49 0.32 | 1.55 0.09 | 1.34 0.04 | 1.00 0.01 |
| UGC 7064 | Sey 1.8 | 2.57 0.40 | 1.79 0.11 | 1.65 0.06 | 1.29 0.01 |
| UM 146 | Sey 1.9 | 0.66 0.05 | 0.44 0.04 | 0.39 0.02 | 0.32 0.01 |
Note. — For galaxies NGC 1143-4 and NGC 4579, we could only extract the SL spectrum, hence only the measurement of continuum point is given. For galaxy, NGC 4922, we could not extract the complete spectrum, hence it is not included in this table.
| Equivalent Width (in units of ) | ||
|---|---|---|
| Galaxy | PAH | Silicate |
| CGCG381-051 | -3.73 0.15 | -2.43 0.02 |
| E33-G2 | -0.31 0.01 | -0.35 0.01 |
| F01475-0740 | -1.73 0.10 | -1.19 0.86 |
| F04385-0828 | -0.37 0.03 | 12.27 0.04 |
| F15480-0344 | -0.91 0.02 | 1.13 0.15 |
| IC 4329A | -0.08 0.01 | -3.71 0.14 |
| Mrk 334 | -3.13 0.01 | 3.01 0.04 |
| Mrk 348 | -0.12 0.01 | 3.21 0.05 |
| Mrk 471 | -3.69 0.36 | 0.71 0.43 |
| Mrk 6 | -0.22 0.03 | -0.27 0.04 |
| Mrk 609 | -4.27 0.03 | 3.90 0.03 |
| Mrk 622 | -3.66 0.13 | -0.75 0.10 |
| Mrk 79 | -0.21 0.01 | -0.20 0.07 |
| Mrk 817 | -0.52 0.01 | -0.28 0.03 |
| Mrk 883 | -5.01 0.18 | 0.55 0.04 |
| Mrk 9 | -0.18 0.02 | -0.30 0.06 |
| Mrk 938 | -5.07 0.12 | 9.43 0.53 |
| M-2-33-34 | -2.83 0.29 | -0.00 0.11 |
| M-2-40-4 | -0.54 0.02 | 2.54 0.11 |
| M-2-8-39 | -0.38 0.02 | -0.82 0.19 |
| M-3-34-63 | -19.48 1.26 | -15.22 1.39 |
| M-3-58-7 | -0.54 0.02 | -0.21 0.08 |
| M-5-13-17 | -1.45 0.05 | -0.43 0.20 |
| M-6-30-15 | -0.09 0.01 | -0.41 0.14 |
| NGC 1056 | -10.01 0.26 | -4.02 1.01 |
| NGC 1125 | -2.95 0.04 | 12.75 0.20 |
| NGC 1143-4 | -2.12 0.03 | 9.38 0.45 |
| NGC 1194 | -0.33 0.07 | 16.97 0.06 |
| NGC 1241 | -5.65 0.13 | 4.52 0.23 |
| NGC 1320 | -0.44 0.02 | 1.43 0.04 |
| NGC 1667 | -8.06 0.04 | 3.92 0.09 |
| NGC 2622 | -1.14 0.01 | -0.39 0.06 |
| NGC 2639 | -0.83 0.01 | -0.45 0.01 |
| NGC 3079 | -5.35 0.07 | 10.27 0.45 |
| NGC 3516 | -0.34 0.02 | -0.39 0.08 |
| NGC 3786 | -1.94 0.02 | 0.06 0.13 |
| NGC 3982 | -0.75 0.04 | 0.92 0.22 |
| NGC 4051 | -0.69 0.01 | -0.84 0.15 |
| NGC 4151 | -0.09 0.02 | 0.75 0.12 |
| NGC 424 | -0.17 0.01 | 1.39 0.05 |
| NGC 4579 | -0.70 0.02 | -1.29 0.10 |
| NGC 4602 | -0.58 0.03 | 1.50 0.08 |
| NGC 4968 | -1.10 0.04 | 2.65 0.11 |
| NGC 5005 | -2.27 0.06 | 3.57 0.38 |
| NGC 513 | -1.69 0.04 | -0.87 0.20 |
| NGC 5256 | -7.24 0.05 | 9.32 0.08 |
| NGC 5347 | -0.74 0.02 | 1.38 0.14 |
| NGC 5548 | -1.13 0.07 | |
| NGC 5929 | -0.22 0.02 | 0.21 0.32 |
| NGC 5953 | -5.11 0.09 | 1.50 0.78 |
| NGC 7130 | -3.93 0.18 | 4.87 0.17 |
| NGC 7469 | -2.80 0.05 | 2.65 0.21 |
| NGC 7496 | -5.15 0.07 | 1.94 0.05 |
| NGC 7603 | -0.74 0.01 | -1.42 0.06 |
| NGC 7674 | -0.44 0.02 | 2.70 0.21 |
| NGC 931 | -0.24 0.01 | 0.48 0.04 |
| TOL 1238-364 | -0.89 0.06 | 3.49 0.12 |
| UGC 11680 | -1.12 0.03 | -1.39 0.04 |
| UGC 12138 | -1.08 0.02 | 1.68 0.03 |
| UGC 7064 | -1.10 0.11 | 1.68 0.01 |
| UM 146 | -1.34 0.11 | 0.13 0.02 |
Note. — Emission features have negative equivalent widths. The errors quoted here are 1- measurement errors as propagated from error vectors returned by SMART during spectral reductions. There will be an additional error due to subjective placement of the continuum.
| Integrated line fluxes () at | |||||||||||
|---|---|---|---|---|---|---|---|---|---|---|---|
| Galaxy | PAH | [Ar II] | [Ar III] | [S IV] | [Ne II] | [Ne V] | [Ne III] | [S III] | [Ne V] | [O IV] | [S III] |
| CGCG381-051 | 0.52 0.04 | 0.05 0.01 | 0.17 0.01 | 0.03 0.01 | 0.09 0.01 | 0.01 0.01 | 0.13 0.02 | ||||
| E33-G2 | 0.14 0.04 | 0.07 0.01 | 0.05 0.01 | 0.08 0.01 | 0.12 0.01 | 0.07 0.01 | 0.06 0.01 | 0.15 0.01 | 0.03 0.01 | ||
| F01475-0740 | 0.44 0.04 | 0.04 0.01 | 0.05 0.02 | 0.03 0.01 | 0.16 0.01 | 0.12 0.01 | 0.09 0.01 | 0.03 0.01 | 0.07 0.01 | 0.06 0.02 | |
| F04385-0828 | 0.25 0.02 | 0.09 0.03 | 0.24 0.02 | 0.18 0.02 | 0.10 0.01 | 0.12 0.02 | |||||
| F15480-0344 | 0.08 0.01 | 0.07 0.01 | 0.07 0.01 | 0.10 0.01 | 0.15 0.01 | 0.09 0.01 | 0.09 0.01 | 0.34 0.01 | |||
| IC4329A | 0.27 0.04 | 0.07 0.02 | 0.08 0.01 | 0.46 0.02 | 0.26 0.01 | 0.43 0.02 | 0.70 0.03 | 0.19 0.02 | 0.37 0.02 | 1.08 0.04 | 0.18 0.02 |
| Mrk 3 | 0.30 0.07 | 0.51 0.08 | 0.86 0.12 | 1.09 0.12 | 2.07 0.29 | 0.59 0.11 | 0.59 0.07 | 2.10 0.26 | 0.82 0.20 | ||
| Mrk 334 | 1.55 0.06 | 0.17 0.02 | 0.11 0.02 | 0.30 0.08 | 0.13 0.02 | 0.26 0.03 | 0.23 0.05 | 0.11 0.02 | 0.15 0.03 | 0.90 0.08 | |
| Mrk 335 | 0.11 0.03 | 0.03 0.02 | 0.07 0.01 | 0.05 0.02 | 0.09 0.01 | ||||||
| Mrk 348 | 0.16 0.01 | 0.06 0.01 | 0.13 0.01 | 0.25 0.01 | 0.04 0.01 | 0.02 0.01 | 0.24 0.01 | 0.05 0.01 | |||
| Mrk 471 | 0.25 0.02 | 0.03 0.01 | 0.03 0.01 | 0.02 0.01 | 0.03 0.01 | 0.06 0.01 | 0.01 0.01 | 0.04 0.01 | 0.07 0.01 | ||
| Mrk 6 | 0.20 0.02 | 0.08 0.02 | 0.22 0.01 | 0.24 0.01 | 0.12 0.01 | 0.47 0.01 | 0.21 0.01 | 0.50 0.01 | 0.07 0.02 | ||
| Mrk 609 | 0.93 0.04 | 0.05 0.01 | 0.12 0.02 | 0.09 0.01 | 0.09 0.02 | 0.13 0.02 | 0.08 0.01 | 0.17 0.04 | |||
| Mrk 622 | 0.27 0.02 | 0.06 0.02 | 0.08 0.02 | 0.05 0.01 | 0.10 0.01 | ||||||
| Mrk 79 | 0.22 0.01 | 0.07 0.01 | 0.11 0.01 | 0.10 0.01 | 0.20 0.01 | 0.04 0.01 | 0.05 0.01 | 0.51 0.01 | |||
| Mrk 817 | 0.36 0.01 | 0.09 0.01 | 0.05 0.01 | 0.08 0.01 | 0.04 0.01 | 0.03 0.01 | 0.06 0.01 | ||||
| Mrk 883 | 0.22 0.02 | 0.01 0.01 | 0.03 0.01 | 0.11 0.01 | 0.08 0.01 | 0.08 0.02 | 0.10 0.01 | 0.07 0.02 | |||
| Mrk 9 | 0.04 0.01 | 0.05 0.01 | 0.07 0.01 | 0.02 0.01 | 0.01 0.01 | 0.05 0.01 | 0.07 0.01 | 0.03 0.01 | |||
| Mrk 938 | 3.53 0.05 | 0.18 0.03 | 0.64 0.02 | 0.20 0.02 | 0.37 0.03 | ||||||
| M-2-33-34 | 0.42 0.04 | 0.08 0.02 | 0.04 0.02 | 0.26 0.02 | 0.14 0.01 | 0.15 0.01 | 0.40 0.01 | 0.06 0.02 | 0.06 0.01 | 0.60 0.01 | 0.15 0.03 |
| M-2-40-4 | 0.73 0.04 | 0.02 0.02 | 0.04 0.01 | 0.14 0.01 | 0.12 0.01 | 0.18 0.02 | 0.04 0.01 | 0.18 0.01 | |||
| M-2-8-39 | 0.05 0.01 | 0.07 0.01 | 0.10 0.01 | 0.10 0.01 | 0.04 0.01 | 0.15 0.01 | |||||
| M-3-34-63 | 0.38 0.10 | 0.02 0.02 | 0.19 0.05 | ||||||||
| M-3-58-7 | 0.55 0.04 | 0.02 0.01 | 0.03 0.02 | 0.05 0.04 | 0.10 0.01 | 0.06 0.01 | 0.10 0.01 | 0.12 0.01 | |||
| M-5-13-17 | 0.36 0.18 | 0.08 0.01 | 0.11 0.01 | 0.13 0.01 | 0.01 0.01 | 0.12 0.01 | 0.15 0.01 | ||||
| M-6-30-15 | 0.05 0.02 | 0.04 0.02 | 0.08 0.02 | 0.09 0.01 | 0.04 0.01 | 0.01 0.01 | 0.20 0.02 | 0.11 0.02 | |||
| NGC 1056 | 2.06 0.05 | 0.04 0.01 | 0.04 0.01 | 0.23 0.01 | 0.25 0.01 | 0.28 0.03 | 0.14 0.01 | ||||
| NGC 1125 | 0.70 0.06 | 0.04 0.02 | 0.12 0.05 | 0.27 0.08 | 0.31 0.01 | 0.18 0.01 | 0.03 0.01 | 0.29 0.01 | 0.07 0.06 | ||
| NGC 1143-4 | 0.30 0.03 | 0.03 0.03 | 0.07 0.01 | 0.15 0.01 | |||||||
| NGC 1194 | 0.18 0.03 | 0.03 0.03 | 0.19 0.03 | 0.05 0.02 | 0.12 0.02 | 0.09 0.01 | 0.06 0.01 | 0.14 0.01 | |||
| NGC 1241 | 0.71 0.05 | 0.03 0.01 | 0.13 0.02 | 0.09 0.01 | 0.02 0.01 | 0.18 0.04 | |||||
| NGC 1320 | 0.48 0.01 | 0.04 0.01 | 0.13 0.01 | 0.09 0.01 | 0.08 0.01 | 0.09 0.01 | 0.13 0.01 | 0.10 0.01 | 0.32 0.01 | ||
| NGC 1667 | 1.05 0.01 | 0.21 0.01 | 0.13 0.01 | 0.26 0.01 | 0.19 0.01 | 0.20 0.01 | 0.12 0.01 | 0.10 0.01 | |||
| NGC 2622 | 0.03 0.01 | 0.02 0.01 | 0.03 0.01 | 0.06 0.01 | 0.02 0.01 | 0.02 0.01 | 0.08 0.02 | 0.02 0.02 | |||
| NGC 2639 | 0.10 0.02 | 0.11 0.02 | 0.06 0.01 | 0.05 0.01 | 0.03 0.01 | 0.11 0.02 | |||||
| NGC 3079 | 7.79 0.12 | 0.13 0.03 | 0.16 0.05 | 1.48 0.09 | 0.28 0.01 | 0.38 0.02 | 0.36 0.02 | 0.65 0.07 | |||
| NGC 3227 | 0.91 0.03 | 0.41 0.02 | 0.18 0.02 | 0.73 0.01 | 0.19 0.02 | ||||||
| NGC 3516 | 0.26 0.01 | 0.06 0.01 | 0.03 0.01 | 0.17 0.01 | 0.08 0.01 | 0.11 0.01 | 0.26 0.01 | 0.11 0.01 | 0.09 0.01 | 0.38 0.01 | 0.24 0.01 |
| NGC 3786 | 0.65 0.03 | 0.04 0.01 | 0.08 0.01 | 0.11 0.01 | 0.12 0.03 | 0.11 0.01 | 0.03 0.02 | 0.19 0.02 | 0.15 0.04 | ||
| NGC 3982 | 0.21 0.01 | 0.06 0.01 | 0.02 0.01 | 0.06 0.01 | 0.16 0.01 | 0.05 0.01 | 0.04 0.01 | 0.02 0.01 | 0.12 0.01 | ||
| NGC 4051 | 0.90 0.03 | 0.09 0.02 | 0.01 0.01 | 0.03 0.01 | 0.17 0.02 | 0.18 0.02 | 0.23 0.02 | 0.11 0.02 | 0.17 0.02 | 0.32 0.01 | 0.17 0.02 |
| NGC 4151 | 0.69 0.04 | 0.44 0.03 | 0.37 0.03 | 0.86 0.02 | 1.35 0.03 | 1.08 0.06 | 2.50 0.11 | 1.14 0.05 | 0.52 0.12 | 2.45 0.07 | 0.46 0.04 |
| NGC 424 | 1.16 0.05 | 0.12 0.01 | 0.08 0.01 | 0.26 0.01 | 0.15 0.01 | 0.11 0.01 | 0.21 0.01 | 0.06 0.01 | 0.09 0.01 | 0.18 0.01 | 0.32 0.01 |
| NGC 4579 | 0.26 0.03 | 0.05 0.02 | 0.01 0.01 | 0.11 0.01 | |||||||
| NGC 4602 | 0.14 0.02 | 0.11 0.04 | 0.07 0.02 | 0.16 0.02 | 0.04 0.01 | 0.09 0.01 | 0.05 0.01 | 0.23 0.02 | |||
| NGC 4941 | 0.09 0.01 | 0.20 0.01 | 0.15 0.01 | 0.07 0.01 | 0.19 0.04 | 0.15 0.10 | |||||
| NGC 4968 | 0.65 0.03 | 0.04 0.02 | 0.05 0.01 | 0.24 0.01 | 0.17 0.02 | 0.24 0.05 | 0.19 0.02 | 0.10 0.02 | 0.30 0.01 | 0.32 0.02 | |
| NGC 5005 | 1.63 0.06 | 0.04 0.01 | 0.60 0.01 | 0.16 0.01 | 0.08 0.01 | 0.18 0.01 | 0.20 0.02 | ||||
| NGC 513 | 0.26 0.03 | 0.07 0.01 | 0.01 0.01 | 0.11 0.01 | 0.08 0.01 | 0.09 0.01 | 0.09 0.01 | 0.18 0.02 | |||
| NGC 5256 | 2.02 0.08 | 0.13 0.02 | 0.09 0.01 | 0.76 0.02 | 0.37 0.01 | 0.26 0.01 | 0.17 0.02 | 0.61 0.01 | 0.29 0.03 | ||
| NGC 526A | 0.05 0.01 | 0.13 0.01 | 0.10 0.01 | 0.21 0.01 | 0.07 0.02 | ||||||
| NGC 5347 | 0.21 0.03 | 0.03 0.01 | 0.03 0.01 | 0.03 0.01 | 0.04 0.01 | 0.07 0.01 | |||||
| NGC 5548 | 0.02 0.02 | 0.04 0.02 | 0.05 0.02 | 0.14 0.01 | 0.04 0.01 | 0.04 0.01 | 0.15 0.01 | 0.04 0.01 | |||
| NGC 5929 | 0.55 0.17 | 0.07 0.03 | 0.05 0.02 | 0.21 0.02 | 0.04 0.01 | 0.09 0.01 | 0.07 0.01 | 0.11 0.01 | |||
| NGC 5953 | 1.88 0.05 | 0.06 0.02 | 1.05 0.02 | 0.21 0.01 | 0.61 0.02 | 0.22 0.01 | 0.69 0.02 | ||||
| NGC 7130 | 1.77 0.08 | 0.22 0.03 | 0.04 0.01 | 0.07 0.01 | 0.71 0.05 | 0.11 0.02 | 0.37 0.02 | 0.37 0.10 | 0.43 0.03 | 0.64 0.03 | |
| NGC 7172 | 0.19 0.01 | 0.14 0.02 | 0.10 0.01 | 0.50 0.02 | 0.41 0.02 | ||||||
| NGC 7314 | 0.23 0.01 | 0.24 0.01 | 0.15 0.01 | 0.19 0.01 | 0.53 0.01 | 0.19 0.02 | |||||
| NGC 7469 | 5.36 0.15 | 0.78 0.04 | 0.15 0.02 | 1.68 0.04 | 0.45 0.02 | 1.24 0.03 | 1.03 0.16 | 2.05 0.08 | |||
| NGC 7496 | 1.41 0.03 | 0.02 0.01 | 0.01 0.01 | 0.34 0.01 | 0.05 0.01 | 0.03 0.01 | 0.34 0.02 | 0.32 0.02 | |||
| NGC 7603 | 1.10 0.04 | 0.03 0.01 | 0.07 0.01 | 0.11 0.01 | 0.07 0.01 | 0.13 0.01 | 0.06 0.01 | 0.07 0.01 | 0.10 0.03 | ||
| NGC 7674 | 0.50 0.04 | 0.22 0.01 | 0.18 0.01 | 0.31 0.02 | 0.46 0.02 | 0.22 0.02 | 0.24 0.02 | 0.46 0.02 | 0.07 0.01 | ||
| NGC 931 | 0.44 0.10 | 0.21 0.02 | 0.08 0.01 | 0.18 0.02 | 0.22 0.02 | 0.09 0.02 | 0.26 0.02 | 0.43 0.02 | 0.10 0.01 | ||
| TOL 1238-364 | 0.63 0.09 | 0.05 0.01 | 0.04 0.01 | 0.05 0.01 | 0.39 0.02 | 0.09 0.03 | 0.34 0.03 | 0.23 0.02 | 0.12 0.01 | 0.53 0.03 | |
| UGC 11680 | 0.53 0.09 | 0.20 0.04 | 0.15 0.04 | ||||||||
| UGC 12138 | 0.26 0.02 | 0.03 0.01 | 0.06 0.01 | 0.03 0.01 | 0.06 0.01 | 0.08 0.01 | 0.04 0.01 | 0.11 0.02 | 0.04 0.01 | ||
| UGC 7064 | 0.09 0.02 | 0.03 0.01 | 0.07 0.01 | 0.10 0.01 | 0.07 0.01 | 0.07 0.01 | 0.17 0.01 | 0.06 0.01 | |||
| UM 146 | 0.02 0.01 | 0.02 0.01 | 0.03 0.01 | 0.02 0.01 | 0.04 0.01 | 0.02 0.01 | 0.02 0.01 | 0.05 0.01 | |||