Blistering of viscoelastic filaments
Abstract
When a dilute polymer solution experiences capillary thinning, it forms an almost uniformly cylindrical thread, which we study experimentally. In the last stages of thinning, when polymers have become fully stretched, the filament becomes prone to instabilities, of which we describe two: A novel “breathing” instability, originating from the edge of the filament, and a sinusoidal instability in the interior, which ultimately gives rise to a “blistering” pattern of beads on the filament. We describe the linear instability with a spatial resolution of 80 nm in the disturbance amplitude. For sufficiently high polymer concentrations, the filament eventually separates out into a “solid” phase of entangled polymers, connected by fluid beads. A solid polymer fiber of about nanometer thickness remains, which is essentially permanent.
pacs:
47.20.Dr, 47.20.Gv, 47.57.NgWhen a drop falls from a faucet, surface tension drives the fluid motion toward breakup in finite time, and a drop separates. This pinch-off occurs in a localized fashion CCFF04 , and the neighborhood of the point of breakup is described by a similarity solution E93 . If however very small amounts of high molecular weight polymer are added, an almost perfectly cylindrical thread is formed instead Bazilevskii1981 ; Amarouchene2001 ; Wagner2005 ; Clasen2006 . The reason is that wherever there is a local decrease in radius, fluid elements are stretched, and the polymers along with it. This will increase the extensional viscosity of the fluid-polymer mixture Bird87 , and further flow is inhibited, thus forming a uniform and stable filament.
For most of this paper, we produce a filament by placing a drop of liquid between two solid plates, which are rapidly drawn apart Anna2001 . (In a simple and educational version of this experiment, a drop of saliva is placed between thumb and index finger). A single filament forms between the plates, which thins as surface tension drains fluid from the filament, and into two roughly hemispherical reservoirs at the endplates.
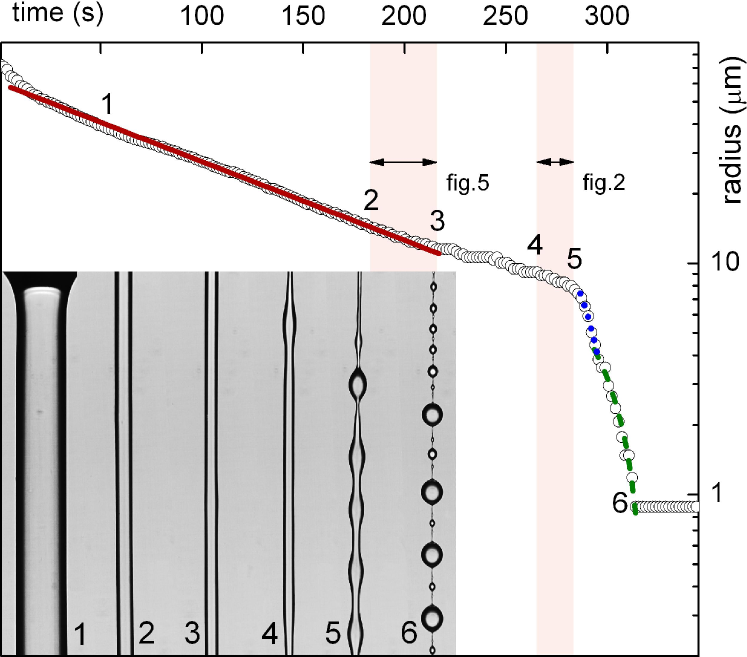
The present paper addresses the later stages of the thinning of the polymeric filament, when polymers have come close to their full extension. Thus the mechanism that formerly used to stabilize the thread is no longer effective, and tiny beads begin to appear on the filament, (see Fig. 1, images 5 and 6) movie . We will refer to this process central to the present study as “blistering”. This instability occurs when the filament is only in radius, requiring extreme spatial resolution. If the concentration of polymer is above 1000 ppm, the filament can become very long-lived compared to the timescale of a dissolved polymer.
Theoretically, the period of exponential thinning has recently been described within a long-wavelength description Clasen2006 . Nonetheless, the full three-dimensional, axisymmetric problem remains unsolved. The effect of finite polymer extensibility has been studied numerically in Li2003 , once more using a long-wavelength model. The filament is found to fail near its end via a localized similarity solution, in contrast to the much more complex scenario found here. The first clear experimental description of blistering is found in Oliveira2005 , which focuses on the later stages of the instability, in the course of which droplets with a hierarchy of sizes are found. We first focus on the onset of the blistering instability, for which widely diverging theoretical explanations have been expressed in the past Chang1999 ; Li2003 ; Oliveira2005 ; Clasen2006 .
Our experiments were performed with aqueous solutions of polyethylene oxide (PEO) of molecular weights and concentrations weight percent. While the formation of a filament and its subsequent instability could be observed well below the overlap concentration Bird87 of polymers, we focused on higher concentrations, as the process is slower and easier to observe. Our reference system has and weight percent, with weight percent the overlap concentration. The samples were characterized with a Thermo Haake MARS rheometer using cone plate geometries. The zero shear viscosity was and in the range of shear rates shear thinning was present down to a value of . The surface tension was determined by the pendant drop method to Oliveira2006 ; rheo .
We used a capillary breakup device similar to the one described in Oliveira2005 ; Rodd2005 . This setup is also commercially available to measure the extensional rheology of suspensions (CaBER, Thermo Fisher Scientific, Karlsruhe, Germany). To ensure maximum reproducibility, we used the following protocol: plates of diameter were held at a distance of for the purpose of relaxation for several seconds. Then the plates are drawn to within 40ms, only slightly exceeding the limit at which a capillary bridge of the solvent experiences a Rayleigh-Plateau instability and breakup. The thinning process is observed with an IDT X-Vision X3 digital high-speed video camera with Nikon Microscope objectives of up to magnification. At the highest magnification, the diffraction limited resolution is , and depth of field is . A Halogen back-light allows frame rates up to 6000 frames per second and exposition times down to .
Figure 1 shows a typical recording of the thread radius in the cylindric region in a semi-logarithmic plot. For plug flow in a cylindrical filament, the elongation rate is determined from , thus is constant for most of the filament thinning, which follows an exponential law (the regime between 1 and 2 in Fig. 1) Amarouchene2001 . The axial stress supported by the polymers balances the increasing capillary pressure , which means that the extensional viscosity also increases exponentially. At 3 (see Fig. 1) the thread radius first has a plateau, and then thinning accelerates again. The reason for the acceleration is that the polymers have almost reached their maximum extension, so their extensional viscosity can no longer increase. But this means that has to increase rapidly, implying a steep increase in the slope of , as seen in Fig. 1. Once has reached a plateau, which we estimate at to be , the filament behaves essentially like a Newtonian fluid Li2003 , and is thus subject to a capillary instability E97 , as confirmed below. Note that this value of the extensional viscosity corresponds to an increase by 5 orders of magnitude over of the solvent.
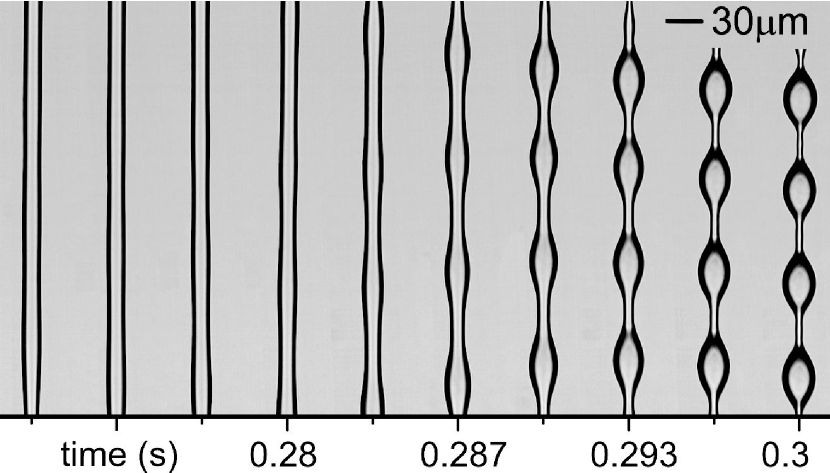
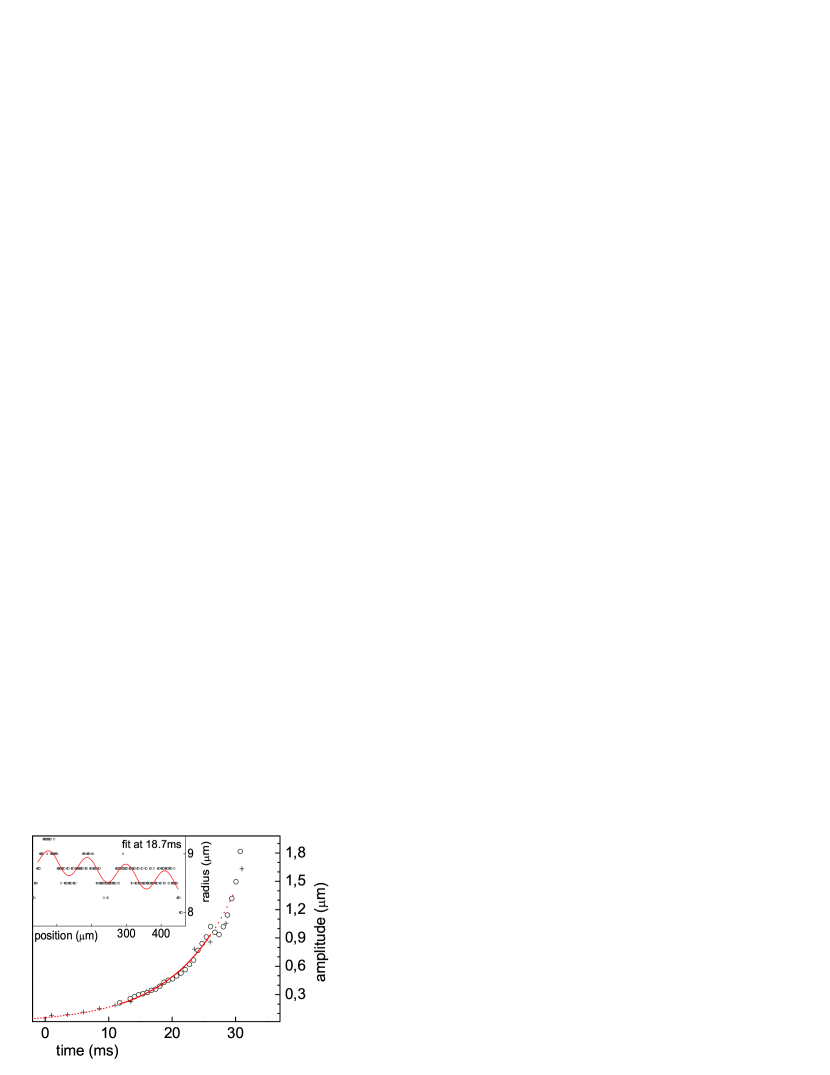
Before we describe the novel instability that occurs between 2 and 3 in Fig. 1), which is localized near the endplates, we concentrate on the subsequent spatially uniform, linear instability which is shown in Fig. 2 (between 4 and 5 in Fig. 1). At first, no oscillations are visible on the images of Fig. 2; however, as seen in Fig. 3, we are able to resolve perturbations down to an amplitude of , corresponding to significant super-resolution H95 . This is done by fitting the profile with a sine function with wavenumber, phase and amplitude as free parameters over many wavelengths (see inset). The algorithm converged down to the stated maximum resolution. The last four pictures of Fig. 2 show the beginning of the non-linear stages of the instability, finally leading to the formation of smaller secondary droplets Oliveira2005 ; Oliveira2006 . In the main panel of Fig.3 we plot the growth of the sinusoidal approximation over time, an example of which is shown in the inset. Over more than a decade, the growth is very well described by an exponential, providing a clear signature of a linear instability, which develops uniformly in space.
¿From a fit to the exponential, we find an inverse growth rate of . Linear stability of a viscous fluid thread E97 predicts , which gives an estimated extensional viscosity of , more than one order of magnitude smaller than the extensional viscosity estimated above. At the same time, we are able to fit - as expected E97 - a linear law in the range . Comparing to the law for viscous pinching Rothert2003 , this gives , which agrees nicely. We do not have a ready explanation for the discrepancy between and . Among possible explanations are non-uniformities in the polymer concentration (see below), and transient relaxation of polymer stresses during the plateau between 3 and 4 in Fig. 1, when there is no flow. A kink in the linear shrinking behavior at toward a less steep slope of could either be seen as a first indication for the onset of a draining process discussed below, or as as a transition from the viscous to the inertial-viscous pinch-off regimeRothert2003 .

The formation of successive generations of beads has already been studied extensively Oliveira2005 ; Oliveira2006 ; we focus on the very final stages of the thinning process, when the formation of new beads has come to rest (6 in Fig. 1). If the polymer concentration was greater than 1000 ppm, the filament connecting two beads never breaks, and a pattern as shown in Fig.4a) is formed. What is remarkable is that most beads are off-center with respect to the filament. Comparison with the problem of fluid drops on a fiber Carroll86 shows that there must be a finite contact angle between the drops and the filament for such a symmetry breaking to occur. In other words, the thin filament must have formed a (solid) phase different from that of the drops.
To confirm this idea, we produced the Scanning-Electron-Microscopy (SEM) images shown in Fig. 4. Object slides were pulled quickly through the liquid bridge, before the accumulated elastic stress would lead it to retract into a single droplet. Panel b) shows two remnants of two droplets being connected by a persistent thin thread. Increased magnification (panels c) and d)) allowed us to estimate the diameter of the fiber as . Assuming a constant polymer concentration of the solution, and taking for the fiber the density of PEO, the amount of polymer in such a fiber equals a fluid diameter of , thereby representing a lower bound for the onset of the concentration process that leads to this solid fiber, but which is likely to start earlier. Our physical picture is that polymers become entangled, while solvent drains from the filament, leading to even higher polymer concentration and increased entanglement. Further evidence for this concentration process was already found in Sattler2007 , where birefringence measurements were performed to examine molecular conformations in the break-up process. We can exclude evaporation to be a factor in the formation of solid fibers, based on our estimates of evaporation rates, as well as preliminary experiments in a two-fluid system.
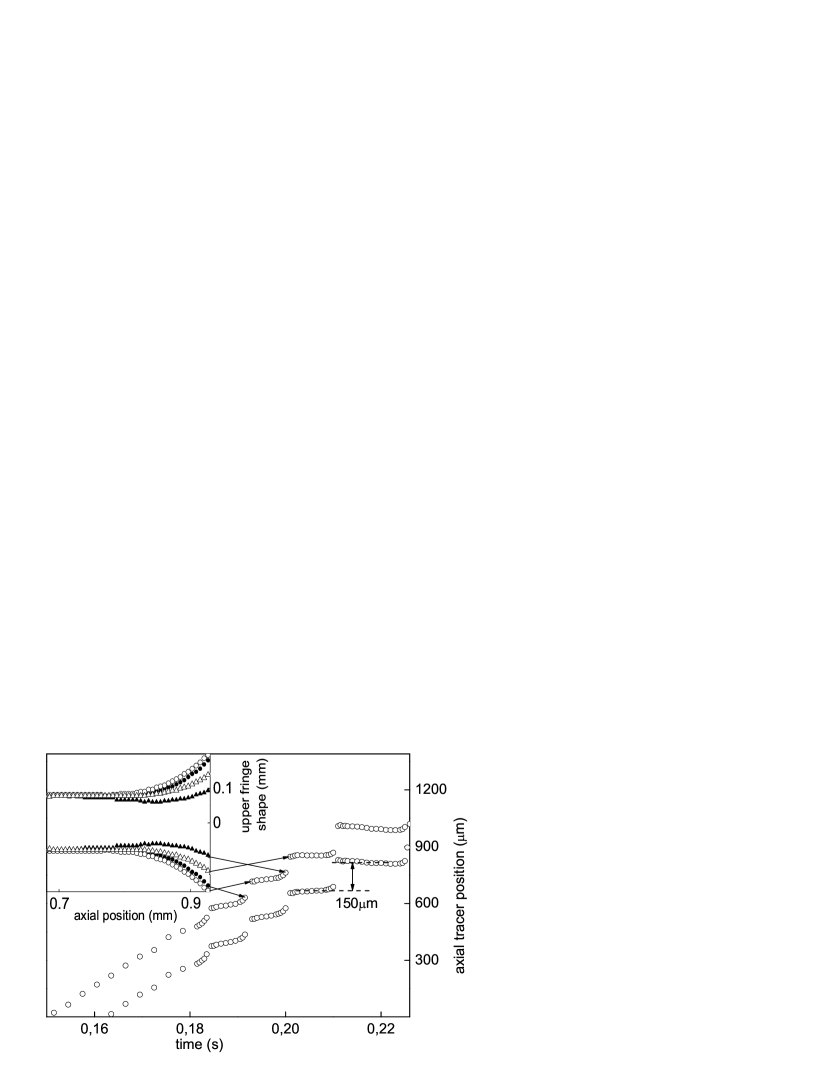
Finally we would like to describe the transition regime (between 2 and 3 in Fig. 1) where an instability of the homogenous elongational flow originates from the boundary, and is reminiscent of phenomena reported in Chang1999 . The transition region at the edge of the filament was described in detail in Clasen2006 for the case that polymers are far from stretched. At full stretch, the transition region constricts (as seen in the last shape in the inset of Fig. 5 (full triangles)), thus inhibiting the flow out of the filament. The most sensitive probe for the flow are tiny bubbles inside the filament, whose trajectories are shown in Fig. 5. During the constriction phase, the flow stops, and the tracer positions form a plateau. In the absence of flow, polymers relax inside the filament, and elastic stresses are eventually no longer able to sustain the capillary pressure. Fluid from the filament empties into the end cap, causing a sudden flow, which appears as a jump in bubble position in Fig. 5. The process repeats itself periodically, on a timescale that increases from step to step, but which is of the same order of magnitude as the polymer relaxation time.
The height of the final jump gives a characteristic length scale of , which is comparable to the wavelengths of periodic disturbances on the filament (Fig.2). In principle, each of the plateaus shown in Fig. 5 should result in a corresponding plateau in . However, the plateaus are too small to be resolved, apart from the last two between 3 and 4 in Fig. 1. At the end of the plateaus the filament shrinks again by draining liquid into the reservoir at the endplates or into a large bead that typically forms in the middle of the filament, see movie .
In conclusion, we have demonstrated three key phenomena:
(i) Between 2 and 3 in Fig. 1, the trumpet-shaped
transition region connecting the filament to the reservoirs
constricts periodically, interrupting the flow.
(ii) The blistering instability of the
filament, which leads to beads, is a linear capillary instability
(between 4 and 5 in Fig. 1). As the polymers reach full
stretch, their contribution is once more Newtonian, but with a
viscosity that is many times that of the unstretched state.
(iii) Using electron microscopy, we provide evidence that
the filament remains intact in its latest stages, because polymer
strands become sufficiently concentrated to become solid-like. The
most compelling evidence for this fact is that the contact angle
between the thread and the beads sitting on it becomes finite.
Existing theoretical models are clearly inadequate in addressing
this polymer behavior at full stretch.
Acknowledgments: We thank Jörg Schmauch for the SEM images. This work was supported by the DFG-Project WA 1336, the Royal Society and Thermo Haake.
References
- (1) A. Cordoba, D. Cordoba, C.L. Fefferman, ad M.A. Fontelos, Adv. Math. 187, 228 (2004).
- (2) J. Eggers, Phys. Rev. Lett. 71, 3458 (1993).
- (3) A.V. Bazilevskii, V.M. Entov, and A.N. Rozhkov, Sov. Phys. Dokl. 26, 333 (1981).
- (4) Y. Amarouchene, D. Bonn, J. Meunier, and H. Kellay, Phys. Rev. Lett. 86, 3558 (2001).
- (5) C. Wagner, Y. Amarouchene, D. Bonn, J. Eggers, Phys. Rev. Lett. 95, 164504 (2005).
- (6) C. Clasen, J. Eggers, M.A. Fontelos, J. Li, and G.H. McKinley, J. Fluid Mech. 556, 283 (2006).
- (7) R.B. Bird, R.C. Armstrong, and O. Hassager, Dynamics of polymeric liquids, Vol. 1: Fluid Mechanics, Vol. 2: Kinetic Theory. Wiley, New York (1987).
- (8) S.L. Anna, G.H. McKinley, Journal of Rheology 45(1), 115 (2001).
- (9) A movie is available online. Recorded at 3000fps it plays at 6fps, the field of view is 130x750 . First one sees the periodic constrictions at the end (between 2 and 3 in Fig.1), later the growth of a large bead in the middle of the filament, followed by the growth of the linear instability (c.f. Fig. 2). Once this instability has become nonlinear, it leads to different generations of beads Oliveira2006 .
- (10) J. Li and M.A. Fontelos, Phys. Fluids 15, 922 (2003).
- (11) M.S.N. Oliveira and G.H. McKinley, Phys. Fluids 17, 071704 (2005).
- (12) H.C. Chang and E.A. Demekhin, J. Fluid Mech. 380, 233 (1999).
- (13) M.S.N. Oliveira, R. Yeh, and G.H. McKinley, J. Non-Newtonian Fluid Mech. 137, 137 (2006).
- (14) The solution is similar to the one described in ref. Oliveira2006 where a more extensive rheological description can be found.
- (15) L.E. Rodd, T.P. Scott, J.J. Cooper-White, and G.H. McKinley, Appl. Rheol. 15, 12 (2005).
- (16) J. Eggers, Rev. Mod. Phys. 69, 865 (1997).
- (17) B.R. Hunt, Int. J. Imag. Syst. Tech. 6, 297 (1995).
- (18) A. Rothert, R. Richter, and I. Rehberg, New Journal of Physics 5, 59.1 (2003).
- (19) B. J. Carroll, Langmuir 2, 248 (1986).
- (20) R. Sattler, A. Kityk, and C. Wagner, Phys. Rev. E 75, 051805 (2007).