Radio and -ray emissions from pulsars: possible observational tests
Abstract
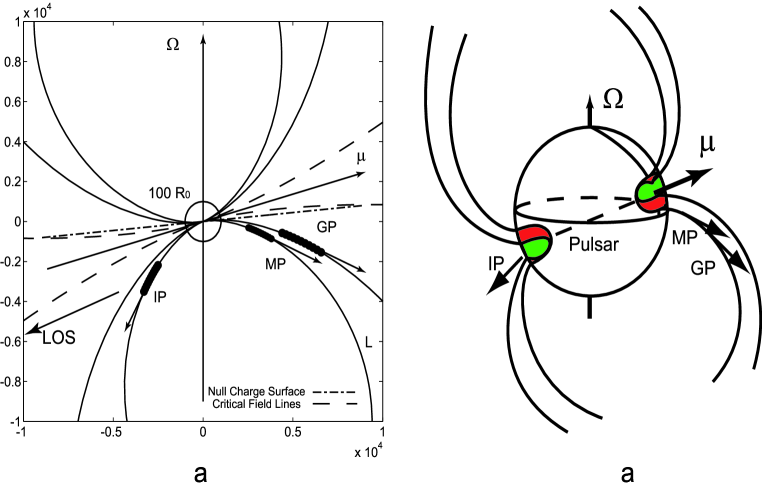
Many models for the pulsar radio and -ray emissions have been developed. The tests for these models using observational data are very important. Tests for the pulsar radio emission models using frequency-altitude relation are presented in this paper. In the radio band, the mean pulse profiles evolve with observing frequencies. There are various styles of pulsar profile - frequency evolutions (which we call as ”beam evolution” figure), e.g. some pulsars show that mean pulse profiles are wider and core emission is higher at higher frequencies than that at lower frequencies, but some other pulsars show completely the contrary results. We show that all these ”beam evolution” figures can be understood by the Inverse Compton Scattering(ICS) model (see Qiao at al.2001 also). An important observing test is that, for a certain observing frequency different emission components are radiated from the different heights. For the -ray pulsars, the geometrical method (Wang et al. 2006) can be used to diagnose the radiation location for the -ray radiation. As an example, Wang et al. (2006) constrain the -ray radiation location of PSR B1055-52 to be the place near the null charge surface. Here we show that Wang’s result matches the proposed radiation locations by the annular gap model as well as the outer gap models.
1 INTRODUCTION
Rotation-powered pulsars are excellent laboratories for studying particle acceleration as well as fundamental physics (Harding,2007). There are several kinds of pulsar radio and -ray radiation models have been published. For radio emission of pulsars, most of them are based on the vacuum inner gap assumptions suggested by Rudermen & Sutherland(1975). Qiao & Lin(1998) proposed that the inner gap sparking would produce low frequency wave and these low energy photons are inverse Compton scattered by the secondary particles produced in the pair cascades, and the up-scattered radio photons provide the observed radio emission from the pulsar. Gil & Sendyk(2000) emphasized that spark discharges do not occur at random positions, instead, sparks should tend to operate in well determined preferred regions. For the -ray emission form pulsars, both polar cap and outer gap models have been suggested (e.g. Harding 1981; Harding 2007; Zhao et al. 1989; Lu & Shi 1990; Cheng et al. 1986, 2000; Romani 1996, 2002; Hirotani 2000).
Observations are the bases for any theory. How can we take a check for so many theories? Here we present two tests for the radiation models basing on the observations. The first test use the well known mean pulsar profile - frequency relation, while the second test use the time delay between radio and high energy radiation. For the -ray pulsars, the geometrical method (Wang et al. 2006) can be used to diagnose the radiation location for the -ray radiation.
2 Check the radio emission models using ”beam evolution” effects
The typical pulsar classification are established by Rankin (1983, 1993), Manchester & Johnston (1995), Kramer et al. (1998) and Xilouris et al. (1998). Gil & Sendyk (2000) interpret different types of pulsars in the - diagram as having different numbers of sparks. Qiao et al.(2001) suggest a different pulsar classification scheme using the pulse profile evolution versus observed frequencies relation, where the following three points are considered. First, how the number of components in the integrated pulsar profile changes with different observed frequencies. Second, how the phase (in fact the radiation altitude) of there components change with different observed frequencies. Third, how the intensity of the components change with observing frequencies.
There are very different evolution types. For example, the PSR B1933+16 shows the “single”-to-triple profile evolution with increasing frequency (Figure 1); furthermore, the separation between the two ”shoulders” of the triple profile gets wider at higher frequencies (Qiao et al. 2001). But pulse profiles of PPSR B1237+25 are much wider than that in high frequencies. In other words, the pulse profiles become wider at high frequencies for PSR B1933+16; but the story for PSR B1237+25 are completely different. These various evolution styles need to be understand theoretically.
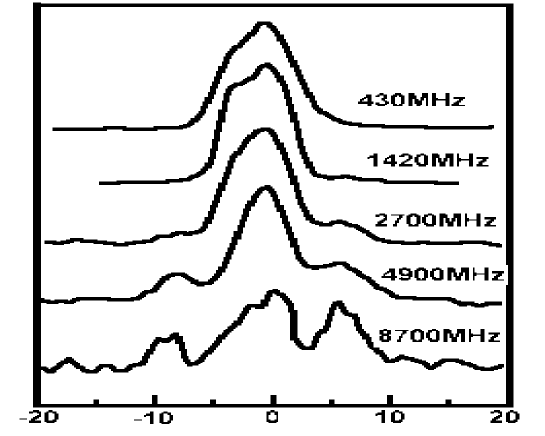
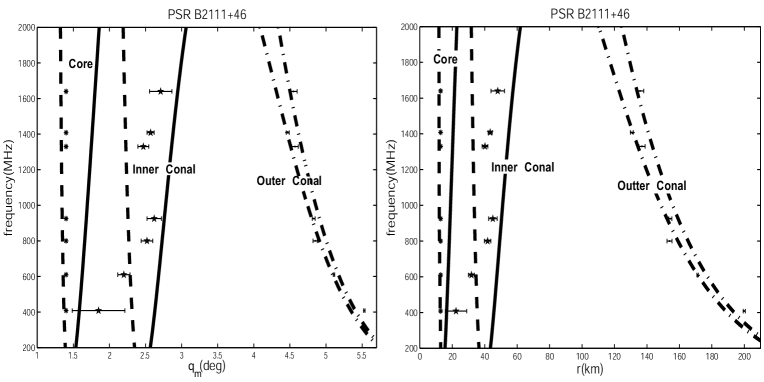
It should be noted that these various pulsar profile - observing frequency evolution relation (”Beam evolution”) can be well reproduced by the inverse Compton scattering(ICS) model(Qiao et al. 2001). Here we take PSR B2111+46 as an example (Figure 2), of which the ”Beam evolution” are very complex. For the two inner conal components, the phase separation increase, when observing frequency gets higher. For the two outer conal components, the phase separation decrease, when observing frequency gets higher. This is an obvious challenge for any pulsar radio radiation models.
Recently Zhang et al. (2007) analyzed the pulse profile evolution for PSR B2111+46 using data at seven frequency band, the radiation heights for emission components are also calculated. It shows that different emission components, even if at the same observing frequency, come from different heights. This is probably a common phenomena and challenge for any emission models. Zhang et al. (2007) also shows that the ICS model for pulsar radio emission can explain these results well (See Figure 2 for details).
In the next section we will review the recent result of constraining (Wang et al. 2006 ) the -ray radiation models pulsars. It is found that only the inner annular gap model and outer gap model match the observation.
3 To check radio & -ray emission models: the multi-band determined locations
Observational constraints on the radio and -ray emission regions of PSR B1055-52 using both radio and -ray data are given by Wang et al.(2006), we call it “the multi- beam constrains”, which gives allowable radio and -ray radiation locations from observational point of view. Using these results one can check related pulsar radiation theories.
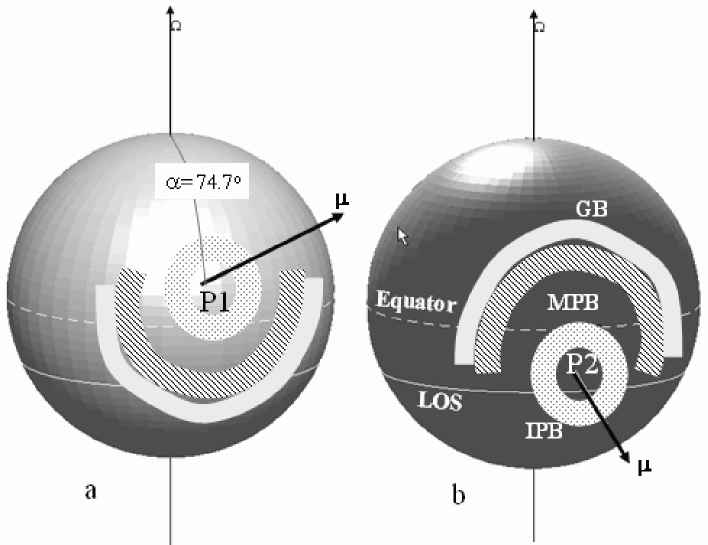
In this method, the geometrical parameters, such as view angle as well as inclination angle are obtained from high quality radio linear polarization data. For PSR B1055-52 the best-fitting value are and the view angle (Lyne & Manchester 1988 and van Ommen et al. 1997). Given these parameters, the radio and -ray emission radiation locations can be constrained by fitting the observed pulse widths of radio and -ray pulses profile and the phase delay between radio and -ray pulse. It is clearly that this method determines radiation location in pure geometrical ways and do not involve any assumption about radiation models. The detailed calculations can be found in the paper of Wang et al.(2006).
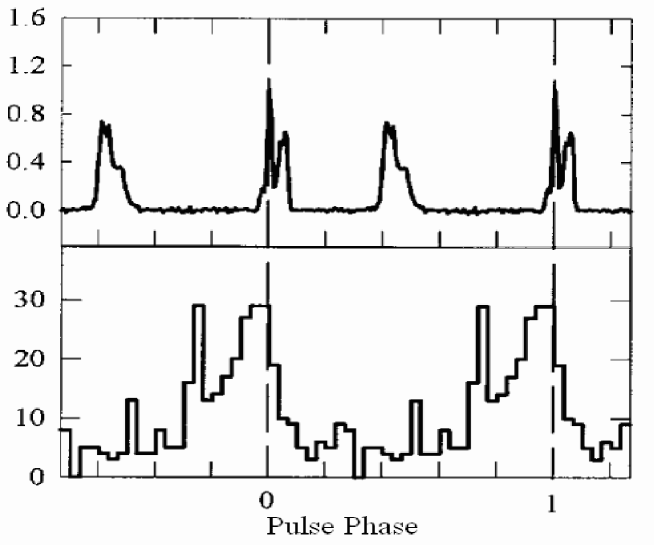
The phase-aligned radio profile and -ray light curve of B1055-52 (Thompson et al. 1999) are shown in Figure 3. The result of Wang et al. are present graphically in Figure 4 and 5. Radio data suggests that the view angle of PSR B1055-52 are greater than . Compared with this, the polar cap model, which suggests that the -ray emission altitudes are about several times of the stellar radius, can not explain such view angle greater than . So the polar cap model is not a favorable model for PSR B1055-52. The only radiation region that allow a view angle greater than are at places beyond the null charge surface (NCS). In this way only the outer gap model(Zhang & Cheng, 1997) or the annular model (Qiao et al.2004a,b; 2007) can be the candidate model of explaining the -radiation form PSR B1055-52.
4 Discussions and conclusions
How can we test pulsar radiation theories? Available data on the mean pulse profiles of pulsars and their polarization had been analyzed to determine the two-dimension morphology for pulsar radio beams (Rankin,1983,1993; Lyne & Manchester,1998). The morphology of radiation beams presents very important observational test to any pulsar radiation theories. Some important results are as follows:
1. Although whether the pulsar radiation beam is structured or not is still under debate (Ranking 1983, Lyne & Manchester 1988), the existence of core beam was confirmed. Thus the existence of core radiation beam is an important test to radiation model. (e.g. RS model can not have a core beam, while ICS model have a core beam, if the impact angle is not large.)
Rankin suggest that beside core emission beam, there are two cones (inner cone and outer cone) for some pulsars. But Lyne & Manchester emphasized that the observations are best described by gradual change in emission characteristics from the core to the outer edge of the emission beam. Using all available multi-component radio pulse profiles for pulsars with medium to long periods and good polarization data, Han & Manchester(2001) have constructed a two-dimensional image of the mean radio beam shape. They suggest that there is core in the beam center, but in the conical region there are some patchy beams. Qiao et al.(2001) suggest that for some short period pulsar, there are core and one conal beam; but for longer period pulsars, beside the core emission beam, there are two conal beams(inner cone and outer cone). Gil & Sendyk(2000) put some kinds of pulsars in the diagram, it can be seen that different kind of pulsars (Multiple, Conal Double, Conal Single Core single,Triple) thoroughly located at different region.
2. It is well known that the pulse profiles change with observing frequencies. Thus the relation of pulse profile-observing frequency evolution (“Beam evolution” figure is important test to any emission theory on pulsar radio emission (See Qiao et al.2000 and Zhang at al. 2007).
3. The “multi-beam constraining” method (Wang et al. 2006) is a useful approach to constrain the high-energy emission regions. High quality polarization observation are needed to derive the two key input parameters of this method, i.e. the inclination angle and the view angle . Since more -ray pulsars are expected to be discovered after the launch of the Gamma-Ray Large Area Space Telescope (GLAST), it will offer a large sample of pulsars for which “multi-beam constraining” method can be used to test the pulsar high-energy emission theories.
Acknowledgments
We are very grateful to Professors. R. N. Manchester, D. Lai and J. L. Han for their valuable discussions. This work is supported by NSF of China (10373002, 10403001, 10273001)
References
- CHR (68) Cheng,K.S., C. Ho and M.A. Ruderman, 1986, ApJ, 300,500
- CRZ (00) Cheng,K.S., M.A. Ruderman and L.Zhang, 2000, ApJ, 537,964
- GS (00) Gil,J.A, and M. Sendyk, 2000, ApJ.,541,351-366
- H (81) Harding, A.K., 1981, ApJ, 245, 267
- H (07) Harding, A.K., 2007, astro-ph/0706.1542
- HI (00) Hirotani, K., 2000, PASJ, 52,645
- K (98) Kramer,M. et al. 1998, ApJ, 501,270
- LS (90) Lu, T.and T. Shi, 1990, AA, 231, L7
- LM (88) Lyne,A.G. and R.N. Manchester, 1998, MNRAS, 234, 477
- MJ (95) Manchester, R.N., and S. Johnston, 1995, ApJ,441, L65
- OA (97) van Ommen,T. D., F. D. Alessandro, P. A.Hamilton and P. M. McCulloch, 1997,MNRAS, 287, 307
- Q (01) Qiao, G.J., J. F. Liu, B. Zhang and J. L. Han, 2001, AA, 377,964
- Q (04) Qiao, G.J., K.J. Lee, H.G.Wang, R.X.Xu and J.L.Han, 2004a,ApJ., 606,L49
- Q (04) Qiao, G.J., K.J. Lee, B.Zhang, R.X.Xu and H.G.Wang, 2004b, ApJ., 616,L127
- Q (07) Qiao, G.J., K.J. Lee, B.Zhang, H.G.Wang, R.X.Xu, 2007, ChJAA, 7, 496-502, (astro-ph/0704.3801)
- R (83) Rankin, J.M., 1983, ApJ, 274,333
- R (93) Rankin,J.M., 1993, ApJ, 405,285
- R (96) Romani, R.W., 1996, ApJ, 470, 469
- R (02) Romani, R.W., astro-ph/0211064
- RS (75) Ruderman, M.A. and P. G. Sutherland, 1975, ApJ, 196, 51 (RS75)
- SRW (75) Sieber, W., R. Reinecke, and R. Wielebiski, 1975, AA, 38, 169
- T (99) Thompson, D.J.et al., 1999, ApJ, 516, 297
- X (98) Xilouris, K.M. M. Kramer, A. Jessner, et al., 1998, ApJ, 501,286
- ZC (97) Zhang, L., and K.S. Cheng, 1997, ApJ, 487, 370
- ZQ (97) Zhang,H., G.J. Qiao, J.L. Han, K.J. Lee, and H.G. Wang, 2007, AA, 465, 525 C531
- ZLH (89) Zhao,Y.H., T. Lu, T., K.L.Huang, J.L. Lu, & Q.H.Peng,1989, AA, 223,147