The Hottest Horizontal-Branch Stars in Centauri – Late Hot Flasher vs. Helium Enrichment††thanks: Based on observations with the ESO Very Large Telescope at Paranal Observatory, Chile (proposal IDs 075.D-0280(A) and 077.D-0021(A))
Abstract
Context. UV observations of some massive globular clusters uncovered a significant population of very hot stars below the hot end of the horizontal branch (HB), the so-called blue hook stars. This feature might be explained either as results of the late hot flasher scenario where stars experience the helium flash while on the white dwarf cooling curve or by the progeny of the helium-enriched sub-population recently postulated to exist in some clusters. Previous spectroscopic analyses of blue hook stars in Cen and NGC 2808 support the late hot flasher scenario, but the stars contain much less helium than expected and the predicted C, N enrichment could not be verified.
Aims. We want to compare effective temperatures, surface gravities, and abundances of He, C, and N of blue hook and canonical extreme horizontal branch (EHB) star candidates to the predictions of the two scenarios.
Methods. Moderately high resolution spectra of stars at the hot end of the blue HB in the globular cluster Cen were analysed for atmospheric parameters and abundances using LTE and Non-LTE model atmospheres.
Results. In the temperature range 30,000 K to 50,000 K we find that 35% of our stars are helium-poor (), 51% have solar helium abundance within a factor of 3 ( ) and 14% are helium-rich (). We also find carbon enrichment in step with helium enrichment, with a maximum carbon enrichment of 3% by mass.
Conclusions. At least 14% of the hottest HB stars in Cen show helium abundances well above the highest predictions from the helium enrichment scenario ( = 0.42 corresponding to ). In addition, the most helium-rich stars show strong carbon enrichment as predicted by the late hot flasher scenario. We conclude that the helium-rich HB stars in Cen cannot be explained solely by the helium-enrichment scenario invoked to explain the blue main sequence.
Key Words.:
Stars: horizontal branch – Stars: evolution – Techniques: spectroscopic – globular clusters: individual: NGC 51391 Introduction
UV-Visual colour-magnitude diagrams of the two very massive globular clusters, Cen and NGC 2808, show a rather puzzling “hook-like” feature at the hot end of their extended horizontal branches with stars lying below the canonical horizontal branch (Whitney et al. whro98 (1998); D’Cruz et al. dcoc00 (2000); Brown et al. brsw01 (2001)). These stars cannot be explained within the framework of canonical stellar evolution. Brown et al. (brsw01 (2001)) have proposed a “flash-mixing” scenario to explain the blue hook stars. According to this scenario stars which lose an unusually large amount of mass will leave the red giant branch (RGB) before the helium flash and will move quickly to the (helium-core) white dwarf cooling curve before igniting helium (Castellani & Castellani caca93 (1993); D’Cruz et al. dcdo96 (1996); Brown et al. brsw01 (2001)). However, the evolution of these “late hot helium flashers” differs dramatically from the evolution of stars which undergo the helium flash on the RGB. Ordinarily when a star flashes at the tip of the RGB or shortly thereafter, the large entropy barrier of its strong hydrogen-burning shell prevents the products of helium burning from being mixed to the surface. Such canonical stars will evolve to the zero-age horizontal branch (ZAHB) without any change in their hydrogen-rich envelope composition. In contrast, stars that ignite helium on the white dwarf cooling curve, where the hydrogen-burning shell is much weaker, will undergo extensive mixing between the helium- and carbon-rich core and the hydrogen envelope (Sweigart swei97 (1997); Brown et al. brsw01 (2001); Cassisi et al. cas03 (2003)). Depending on where the helium flash occurs along the white dwarf cooling curve, the envelope hydrogen will be mixed either deeply into the core (“deep mixing”) or only with a convective shell in the outer part of the core (“shallow mixing”). In the case of deep mixing virtually all of the envelope hydrogen is burned while in shallow mixing some of the envelope hydrogen remains after the mixing phase (Lanz et al. labr04 (2004)). One of the most robust predictions of the flash-mixing scenario is an increase in the surface abundance of carbon to 3% - 5% (deep mixing) or 1% (shallow mixing) by mass. This increase is set by the carbon production during the helium flash and is nearly independent of the stellar parameters. Nitrogen may also be enhanced due to the burning of hydrogen on triple- carbon during the flash-mixing phase. For both deep and shallow mixing, the blue hook stars should be helium-rich compared to the canonical EHB stars.
Alternatively, the recently observed split among the main sequence stars of Cen and NGC 2808 (Piotto et al. pivi05 (2005, 2007)) has been attributed to a sub-population of stars with helium abundances as large as 0.4 (Norris norr04 (2004); D’Antona et al. dabe05 (2005); D’Antona & Ventura dave07 (2007); see Newsham & Terndrup nete07 (2007) for cautionary remarks). Lee et al. (lejo05 (2005)) have suggested that the blue hook stars are the progeny of these proposed helium-rich main sequence stars. If the blue hook stars were to be explained by the helium-enrichment scenario, their helium abundance should not exceed 0.4 and carbon should not be enriched at all. Spectroscopic observations of the blue (and supposedly helium-rich) main sequence stars in Cen yield a carbon abundance of [C/M] = 0.0 (Piotto et al. pivi05 (2005)). This carbon abundance will decrease further as the stars ascend the red giant branch, due to the extra-mixing process that occurs in metal-poor red giants (Gratton et al. grsn00 (2000); Kraft kraf94 (1994)). Origlia et al. (orfe03 (2003)) have confirmed that the RGB stars in Cen have the low 12C/13C ratios (4) and low average carbon abundances ([C/Fe] = 0.2) expected from this extra-mixing. Thus the helium-enrichment scenario predicts a carbon abundance by mass in the blue hook stars of less than 0.1%, i.e., at least a factor of 10 smaller than the carbon abundance predicted by the flash-mixing scenario.
Previous spectra of the blue hook stars in Cen (Moehler et al. mosw02 (2002)) and NGC 2808 (Moehler et al. mosw04 (2004)) showed that these stars are indeed both hotter and more helium-rich than the canonical EHB stars. However, the blue hook stars still show considerable amounts of hydrogen. Unfortunately due to limited resolution and signal-to-noise (S/N) we could not derive good abundances for C and N. Instead we could only state that the most helium-rich stars appear to show some evidence for C/N enrichment. Therefore we started a project to obtain higher resolution spectra of EHB and blue hook stars in Cen.
2 Observations, Data Reduction, and Analysis
We selected stars along the blue HB in Cen from the multi-band () photometry of Castellani et al. (cast07 (2007)). These data were collected with the mosaic CCD camera Wide Field Imager available at the 2.2m ESO/MPI telescope. The field of view covered by the entire mosaic is across the center of the cluster. These data together with multiband data from the Advanced Camera for Surveys on board the Hubble Space Telescope provided the largest sample of HB stars (3,200) ever collected in a globular cluster. Among them we concentrated on the stars at the faint end of the HB, which are the most likely “blue hook” candidates as shown by Moehler et al. (mosw02 (2002), mosw04 (2004)). In order to avoid crowding problems, we only selected isolated EHB stars. The astrometry was performed using the UCAC2 catalog (Zacharias et al. zacharias2004 (2004)), which does not cover the central crowded regions. However, thanks to the large field covered by current dataset the astrometric solution is based on 3,000 objects with an rms error of 006.
The spectroscopic data were obtained in 2005 (4 observations) and in 2006 (5 observations) in Service Mode using the MEDUSA mode of the multi-object fibre spectrograph FLAMESGIRAFFE on the UT2 Telescope of the VLT. We used the low spectroscopic resolution mode with the spectral range 3964Å – 4567Å (LR2, R = 6400) and observed spectra for a total of 101 blue hook and canonical blue HB/EHB star candidates and 17 empty positions for sky background.
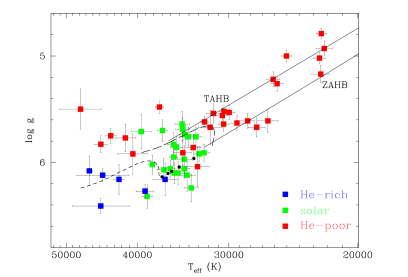
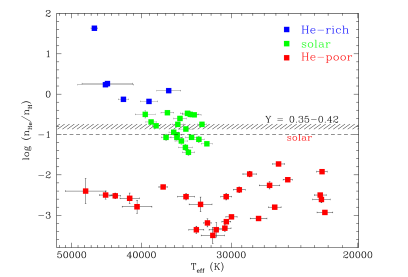
For our analysis we used the pipeline reduced data. For each exposure we subtracted the median of the spectra from the sky fibres from the extracted spectra. We corrected all spectra for barycentric motions. The individual spectra of each target star have been cross-correlated with appropriate template spectra, in order to search for radial velocity variations. Since the few spectra per object did not permit a sophisticated period search, we determined the standard deviation of the radial velocity measurements for each star and compared it with the S/N ratio of the spectra. As expected, the standard deviation of the radial velocity measurements decreases with increasing S/N ratio. None of our target stars deviates significantly from this correlation, which would be the case for close binaries. Therefore none of our target stars appears to be in a close binary system. After verifying that there were no radial velocity variations we co-added all spectra for each star. The co-added and velocity-corrected spectra were fitted with various model atmospheres: metal-free helium-rich non-LTE (Werner & Dreizler wedr99 (1999)), metal-free helium-poor non-LTE (Napiwotzki napi97 (1997)), and metal-rich helium-poor LTE (Moehler et al. mosw00 (2000)) as described in Moehler et al. (mosw04 (2004)). This procedure yielded the effective temperatures, surface gravities, and helium abundances shown in Figs. 1 and 2. In this paper we concentrate only on the hottest HB stars with 20,000 K.
3 Results and Discussion
The helium-poor stars in Fig. 1 basically agree with the predictions of canonical evolutionary theory in that they populate the HB up to its hot end and then also contribute some evolved stars at higher effective temperatures and lower surface gravities. As we move to hotter stars (30,000 K), we find a clump of stars populating the range in effective temperature and surface gravity between a fully mixed late hot flasher and the hot edge of the canonical HB. These stars show roughly solar helium abundance (cf. Fig. 2). The hottest stars lying along the evolutionary track of a fully mixed late hot flasher show the highest helium abundances, albeit with still some hydrogen in their atmospheres. In the temperature range 30,000 K to 50,000 K we find that 35% (15) of our stars are helium-poor (), 51% (22) have solar helium abundance within a factor of 3 ( ) and 14% (6) are helium-rich ().
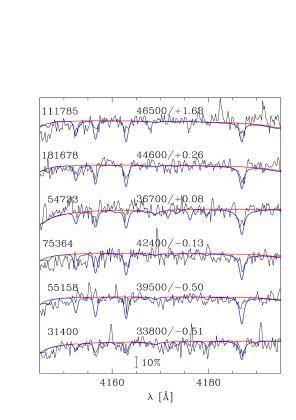
The helium-rich stars also show evidence for carbon enrichment as shown in Fig. 3, unlike the hot ( 30,000 K) helium-poor stars where no C ii and C iii lines were detected despite the higher S/N in their spectra. We have constructed additional TLUSTY NLTE line-blanketed model atmospheres (Hubeny & Lanz hula95 (1995); Lanz & Hubeny lahu03 (2003, 2007)) for the atmospheric parameters of the helium-rich stars, assuming either scaled-solar abundances appropriate for the dominant Cen metallicity ([M/H]1.5) or the carbon- and nitrogen-rich abundances predicted by the flash mixing scenario (mass fractions of 3% and 1%, respectively). The comparison between observed and predicted C ii and C iii lines indicates that the helium-rich stars have a photospheric C mass fraction of at least 1% and up to 2–3% for the stars with the strongest lines. The typical line detection limit provides an upper limit of about 1% by mass for the N abundance. These C abundances represent a significant enhancement relative to the expected C abundance in Cen stars (0.1% at most for the most metal-rich stars).
Any discussion of the surface abundances in hot HB stars must consider the effects of diffusion. Fortunately the diffusion of H, He and the CNO elements in the envelopes of stars following deep flash mixing has been investigated by Unglaub (ungl05 (2005)). Not surprisingly, the results depend on the assumed mass loss rate and on the residual hydrogen abundance remaining after the flash mixing. For the low residual hydrogen abundance = 0.0004 predicted by the Cassisi et al. (cas03 (2003)) models, Unglaub (ungl05 (2005)) found that a star will remain helium-rich with 0…2 during most of the HB phase, in rough agreement with the helium-rich stars in Fig. 2. However, the residual hydrogen abundance following flash mixing is quite uncertain, since it depends on the mixing efficiency (Cassisi et al. cas03 (2003)) and possibly on where the helium flash occurs along the white dwarf cooling curve. For a larger, but still low, residual hydrogen abundance of = 0.004, Unglaub (ungl05 (2005)) found that diffusion can produce either a star with near solar helium abundance or a star that is helium-poor by the end of the HB phase. The stars with roughly solar helium abundances in Fig. 2 might be a consequence of such diffusion. The ZAHB models with a hydrogen-rich layer in Fig. 1 show that the effective temperature will decrease as the amount of surface hydrogen increases in qualitative agreement with the trend towards lower effective temperatures between the helium-rich and solar helium abundance stars in Fig. 2. Unglaub (ungl05 (2005)) also noted that the diffusion efficiency increases substantially once the helium abundance approaches the solar value, leading to a rapid decrease in and perhaps accounting for the gap between the solar helium and helium-poor stars in Fig. 2. Diffusion in flash-mixed stars also leads to a decrease in the carbon and nitrogen abundances, which becomes more pronounced when the atmosphere is hydrogen-rich. Thus the carbon abundances derived here for the helium-rich stars may underestimate the initial carbon abundances in these stars.
The referee asked us to discuss the possibility that diffusion may not be active in all stars above 30,000 K. Let us consider the extreme case that only the helium-poor stars in this temperature range are affected by diffusion. In this case the most helium-rich stars could still be reconciled with the late hot flasher scenario, but the same does not apply to the solar-helium stars. For the latter to be considered as the progeny of the helium-enriched main sequence stars, however, one would expect to see in Fig. 2 stars highly concentrated at = (i.e. =0.38…0.42, Lee et al. lejo05 (2005)). Instead we see a rather large scatter, esp. towards lower helium abundances. In addition, the progeny of the helium-enriched main sequence should not show strong carbon enhancements.
A puzzling effect becomes evident if one plots the spatial distribution of our target stars: Dividing the sample along a line running at 55∘ counter-clockwise from east-west, the helium-poor stars are evenly distributed (28:30 for all, 8:7 for those above 30,000 K), while the stars with roughly solar or super-solar helium abundance show a noticeable preference for the north-west section of the globular cluster (17:5 and 5:1, respectively). This peculiar spatial distribution appears similar to the reddening distribution observed by Calamida et al. (cast05 (2005)), who found a clumpy extinction variation with less reddened HB stars concentrated on the east side of the cluster (see their Fig. 5).
4 Conclusions
All of these results taken together offer strong support for the late hot flasher scenario as the explanation for the blue hook stars while posing a significant problem for the helium-enrichment scenario. This scenario predicts helium enrichment of up to , i.e. = 0.87 …0.74. However, 40% – 30% of the stars above 30,000 K show helium abundances in excess of these values, respectively. This result together with the observed carbon enhancement does not rule out the helium enhancement scenario, but it implies that additional processes are required to produce the hottest HB stars in Cen.
Acknowledgements.
We thank the staff at the Paranal observatory and at ESO Garching for their excellent work, which made this paper possible. We also acknowledge that without the request from the ESO OPC to look into the data we have before applying again, these results would not have been found so soon. We thank the anonymous referee for his/her suggestions.References
- (1) Brown, T. M., Sweigart, A. V., Lanz, T., Landsman, W. B., & Hubeny, I. 2001, ApJ, 562, 368
- (2) Cassisi, S., Schlattl, H., Salaris, M., & Weiss, A. 2003, ApJ, 582, L43
- (3) Calamida, A., Stetson, P. B., Bono, G., et al. 2005, ApJ, 634, L69
- (4) Castellani, M., & Castellani, V. 1993, ApJ, 407, 649
- (5) Castellani, V., Calamida, A., Bono, G., et al. 2007, ApJ, 663, 1021
- (6) D’Antona, F., Bellazzini, M., Fusi Pecci, F., Galleti, S., Caloi, V., & Rood, R. T. 2005, ApJ, 631, 868
- (7) D’Antona, F., Ventura, P. 2007, MNRAS, 379, 1431
- (8) D’Cruz, N. L., Dorman, B., & Rood, R. T. 1996, ApJ, 466, 359
- (9) D’Cruz, N. L., O’Connell, R. W., Rood, R. T., et al. 2000, ApJ, 530, 352
- (10) Gratton, R. G., Sneden, C., Carretta, E., & Bragaglia, A. 2000, A&A, 354, 169
- (11) Hubeny, I., & Lanz, T. 1995, ApJ, 439, 875
- (12) Kraft, R. P. 1994, PASP, 106, 553
- (13) Lanz, T., Brown, T. M., Sweigart, A. V., Hubeny, I., & Landsman, W. B. 2004, ApJ, 602, 342
- (14) Lanz, T., & Hubeny, I. 2003, ApJS, 146, 417
- (15) Lanz, T., & Hubeny, I. 2007, ApJS, 169, 83
- (16) Lee, Y.-W., Joo, S.-J., Han, S.-I., et al. 2005, ApJ, 621, L57
- (17) Moehler, S., Sweigart, A. V., Landsman, W. B., & Heber, U. 2000, A&A, 360, 120
- (18) Moehler, S., Sweigart, A. V., Landsman, W. B., & Dreizler, S. 2002, A&A 395, 37
- (19) Moehler S., Landsman W. B., Sweigart A. V., & Grundahl, F. 2003, A&A, 405, 135
- (20) Moehler, S., Sweigart, A. V., Landsman, W. B., Hammer, N. J., & Dreizler, S. 2004, A&A 415, 313
- (21) Napiwotzki, R. 1997, A&A, 322, 256
- (22) Newsham, G., Terndrup, D. M. 2007, ApJ, 664, 332
- (23) Norris, J. E. 2004, ApJ, 612, L25
- (24) Origlia, L., Ferraro, F. R., Bellazzini, M., & Pancino, E. 2003, ApJ, 591, 916
- (25) Piotto, G., Villanova, S., Bedin, L. G., et al. 2005, ApJ, 621, 777
- (26) Piotto, G., Bedin L. R., Anderson, J., et al. 2007, ApJ, 661, L53
- (27) Sweigart, A. V. 1997, The Third Conference on Faint Blue Stars, ed. A. G. D. Philip, J. Liebert & R. A. Saffer (Schenectady: L. Davis Press), 3
- (28) Unglaub, K. 2005, The 14th European Workshop on White Dwarfs, ASP Conf. Ser. Vol. 334, eds. D. Koester & S. Moehler (ASP: San Francisco), p. 297
- (29) Werner, K., & Dreizler, S. 1999, The Journal of Computational and Applied Mathematics, Vol. 109, eds. H. Riffert & K. Werner, Elsevier Press, Amsterdam, p. 65
- (30) Whitney, J. H., Rood, R. T., O’Connell, R. W., et al. 1998, ApJ, 495, 284
- (31) Zacharias, N., Urban, S. E., Zacharias, M. I., Wycoff, G. L., Hall, D. M., Monet, D. G., Rafferty, T. J. 2004, AJ, 127, 3043