Coronae in the Coronet:
A very deep X-ray look into a stellar nursery
Abstract
Aims. To study the X-ray properties of young stellar objects (YSOs), we analyze an exceptionally sensitive Chandra dataset of the Coronet cluster in the CrA star-forming region, achieving a limiting luminosity of erg/sec for lightly absorbed sources. This dataset represents one of the most sensitive X-ray observations ever obtained of a star-forming region.
Methods. The X-ray data are used to investigate the membership status of tentative members of the region, to derive plasma temperatures and X-ray luminosities of the YSOs, and to investigate variability on the timescale of several years.
Results. 46 of the 92 X-ray sources in the merged Chandra image can be identified with optical or near/mid-infrared counterparts. X-ray emission is detected from all of the previously known optically visible late-type (spectral types G to M) stellar cluster members, from five of the eight brown dwarf candidates, and from nine embedded objects (“protostars”) with class 0, class I, or flat-spectrum SEDs in the field of view. While the Herbig Ae/Be stars TY CrA and R CrA, a close companion of the B9e star HD 176386, and the F0e star T CrA are detected, no X-ray emission is found from any of the Herbig-Haro (HH) objects or the protostellar cores without infrared source. We find indications for diffuse X-ray emission near R CrA / IRS 7.
Conclusions. The observed X-ray properties of the Coronet YSOs are consistent with coronal activity; no soft spectral components hinting towards X-ray emission from accretion shocks were found. The X-ray emission of the AeBe stars TY CrA and HD 176386 originates probably from close late-type companions. The Ae star R Cra shows a peculiar X-ray spectrum and an extremely hot plasma temperature. Finally, we discuss the differences of the X-ray properties of YSOs in different evolutionary stages.
Key Words.:
Stars: individual: R CrA, TY CrA, HD 176386, T CrA - stars: pre-main sequence - stars: activity - stars: magnetic fields X-rays: stars1 Introduction
Young stellar objects (YSOs) generally show high levels of X-ray activity, exceeding the emission level of the Sun and late-type field stars by several orders of magnitudes (for a recent review see Feigelson et al., 2007). A good knowledge of the X-ray properties of YSOs is of paramount importance not only for the understanding of the physical mechanisms that lead to the X-ray emission; the X-ray emission has also far-reaching implications for the physical processes in the circumstellar environment, the formation of planetary systems, and the evolution of protoplanetary atmospheres (e.g., Glassgold et al., 2005; Feigelson, 2005b). In the investigation of the stellar populations of star-forming regions, X-ray studies are particularly effective in discriminating YSOs from unrelated fore- and background field stars. X-ray studies can give a census of the members of a star-forming region that is independent of circumstellar material, allowing to overcome the bias in membership determinations based on infrared excess criteria. Furthermore, since radiation at energies above keV is much less affected by extinction than optical light, X-ray observations can penetrate up to mag into the cloud and allow a deep look at embedded YSOs.
Recently, two very large observational projects provided unprecedented X-ray datasets on young stars. The Orion Ultradeep Project (COUP), a 10-day long observation of the Orion Nebula Cluster with /ACIS (see Getman et al., 2005) is the deepest and longest X-ray observation ever made of a young stellar cluster. With a detection limit of erg/sec for lightly absorbed sources, X-ray emission from more than 97% of the optically visible and well characterized late-type (spectral types F to M) cluster stars was detected (Preibisch et al., 2005a). The XMM-Newton Extended Survey of the Taurus Molecular Cloud (XEST) covered the densest stellar populations in a 5 square degree region of the Taurus Molecular Cloud (see Güdel et al., 2007a) and provided X-ray data on 110 optically well characterized young stars. Despite the new dimension in the quantity and quality of the X-ray data on these two star-forming regions, sensitive X-ray observations of other star-forming regions are still useful to shed new or additional light on several still open questions.
The first question concerns the origin of the X-ray emission in T Tauri stars (TTS). The hot ( MK) plasma temperatures typically derived from the X-ray spectra of TTS show quite clearly that the bulk of the X-ray emission must be related to coronal magnetic activity (Preibisch et al., 2005a), a conclusion that is also supported by the lack of correlated X-ray and optical variability (Stassun et al., 2006, 2007; Forbrich et al., 2007). However, in some TTS, some fraction of the X-ray emission seems to originate in accretion shocks at the stellar surface (e.g. Kastner et al., 2002) and/or in shocks in the innermost parts of stellar jets (e.g. Güdel et al., 2007b). Due to the relatively low shock temperatures of at most a few MK, such shock-related X-ray emission should be detected as a soft excess (at energies below keV) superposed onto the much harder coronal emission (e.g. Schmitt et al., 2005; Günther et al., 2007). Although high-resolution X-ray spectra are required for a detailed investigation of the origin of the different spectral components (e.g. Telleschi et al., 2007), in some cases indications for very soft spectral components have also been found in CCD low-resolution spectra of young stars (e.g., Flaccomio et al., 2006; see also the model spectra in Günther et al., 2007).
A related question concerns the origin of the observed X-ray emission from young intermediate-mass (Herbig Ae/Be) stars. As these intermediate-mass stars have neither outer convection zones that may harbor a dynamo to produce magnetic activity, nor strong enough stellar winds to create X-rays in internal wind shocks, the detection of X-ray emission from a large fraction of the observed Herbig Ae/Be stars still remains largely unexplained (e.g., Damiani et al., 1994; Zinnecker & Preibisch, 1994; Hamaguchi et al., 2005a; Stelzer et al., 2005, 2006). Chandra observations with their superior spatial resolution revealed that in some of the X-ray–detected Herbig Ae/Be stars the true source of the X-ray emission is not the A or B star, but a nearby late-type companion. It remains unclear, however, whether late-type companions are the true source of the X-ray emission in all cases, or whether some Herbig Ae/Be stars may nevertheless be intrinsic X-ray emitters. Some Herbig Ae/Be stars, e.g. AB Aur and HD 163296, show very soft X-ray spectra that have been interpreted as emission from magnetically confined winds (Telleschi et al., 2007b) or accretion shocks Swartz et al. (2005). Obtaining good S/N X-ray spectra of further Herbig Ae/Be stars can help to investigate these possibilities.
Another open question is how early in the protostellar evolution X-ray activity start. While class I protostars are well established X-ray emitters (e.g., Grosso et al., 1997; Neuhäuser & Preibisch, 1997; Imanishi et al., 2001a), it is still unclear whether class 0 protostars, which represent an even earlier, extremely young evolutionary stage in which most of the mass resides still in the circumstellar environment, also show X-ray activity. The detection of an X-ray flare from the candidate class 0 protostar IRS 7E in the Coronet cluster by Hamaguchi et al. (2005b) provided the first piece of evidence for the presence of X-ray emission in extremely young objects, but the exact evolutionary stage of IRS 7E is not yet fully clear. This object clearly deserves further examination. Having no near-infrared counterpart, this source was recently classified as a class 0/I transitional object by Groppi et al. (2007), based on mid-infrared detections and new submillimeter data.
A final interesting issue is X-ray emission from HH objects. Since the X-ray detection of HH 2 (Pravdo et al., 2001), it is clear that the shock-heated material in some jets can actually produce observable soft X-ray emission (e.g. Pravdo et al., 2004; Grosso et al., 2006; Favata et al., 2006). However, the vast majority of all HH objects remain undetected in X-ray observations. It is not clear whether this is due to the limited sensitivity of existing X-ray observations, or whether X-ray emission is created only in a small fraction (the fastest ?) of all jets. Very deep X-ray data of nearby star-forming regions allow to investigate this point.
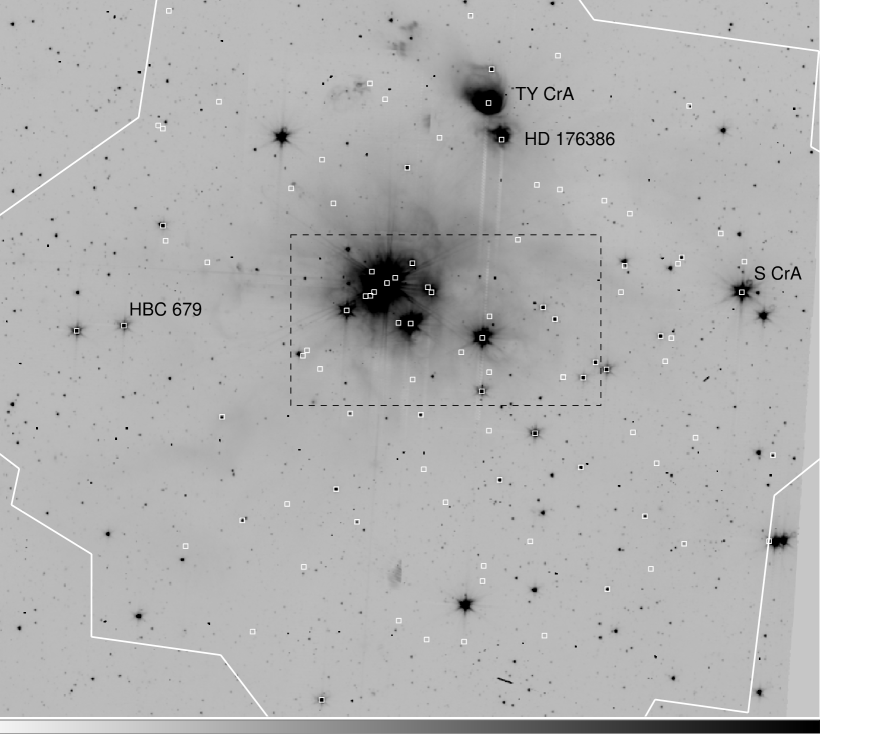
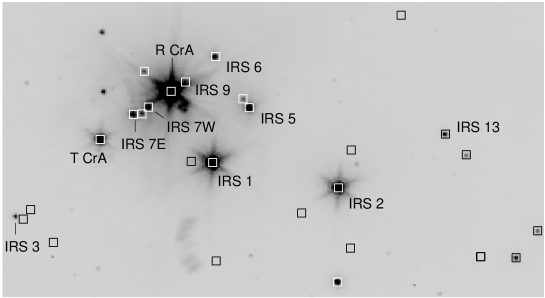
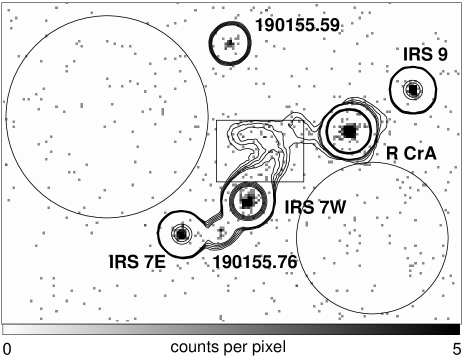
The deep Chandra data discussed in this paper are well suited to address all these issues. The Corona Australis star formation region is one of the nearest (about 3.5 times closer than the Orion Nebula Cluster) and most active regions of recent and ongoing star formation (e.g. Neuhäuser et al., 2000; Neuhäuser & Forbrich, 2007). It contains a loose cluster of a few dozen known YSOs, which cover a wide range of masses (from intermediate-mass Herbig AeBe stars down to very-low-mass brown dwarfs) and evolutionary stages (from pre-stellar cores through class 0 and class I protostars, class II T Tauri stars, to class III objects that have already cleared their dusty environment). The central part of the star-forming region, around the bright star R CrA, contains the densest clustering of very young, embedded objects, which is known as the “Coronet” cluster. Dozens of HH objects trace jets emanating from the YSOs. We refer to the region covered by the X-ray data discussed here as the Coronet region (see Fig. 1) because it is centered on the Coronet cluster and covers its surroundings. The distance to the Corona Australis star-forming region is relatively well known, based on distance determination of two members. The optically brightest member, the B8e star TY CrA, is a well known eclipsing spectroscopic multiple system, for which Casey et al. (1998) derived a distance of pc. The B9e star HD 176386, which forms a common proper motion pair with TY CrA (Teixeira et al., 2000) and shows signs of strong accretion (Grady et al., 1993), has a Hipparcos distance of pc, which is fully consistent with the distance derived for TY CrA. We thus adopt a distance of 130 pc for the CrA star-forming region.
The CrA star-forming region was the target of numerous X-ray observations prior to the present study, including observations with EINSTEIN (Damiani et al., 1994; Walter et al., 1997), ROSAT (Zinnecker & Preibisch, 1994; Neuhäuser & Preibisch, 1997; Neuhäuser et al., 2000), ASCA (Koyama et al., 1996), Chandra (Garmire & Garmire, 2003), and XMM-Newton (see Hamaguchi et al., 2005b; Forbrich et al., 2006). All these observations, however, were several times less sensitive than the dataset analyzed in the present paper.
2 Chandra observations and data analysis
We have performed a series of five individual ksec observations (separated by about one day) of the Coronet region with the ACIS camera on-board Chandra (Weisskopf et al., 2002; Garmire et al., 2003). The main aim of these observations was to monitor the X-ray emission of the YSOs simultaneously with optical, infrared, and radio observations, and the results of this multi-wavelength monitoring are described in Forbrich et al. (2007). In order to optimize the sensitivity of the X-ray data for the present study, we included into our analysis three previous Chandra observations retrieved from the public archive, which have exposure times between 20 and 40 ksec. Details of the individual observations are listed in Table 1.
| Obs | Expo. | Aimpoint | Start Date |
|---|---|---|---|
| [ksec] | [J2000] | ||
| 19 | 19.96 | 19 01 50.6 57 30 | 2000-10-07 17:00:55 |
| 3499 | 38.13 | 19 01 50.6 57 30 | 2003-06-26 12:57:06 |
| 4475 | 20.17 | 19 01 48.9 59 23 | 2004-06-17 23:15:56 |
| 5402 | 15.39 | 19 01 45.0 58 09 | 2005-08-08 02:36:49 |
| 5403 | 15.15 | 19 01 45.0 58 09 | 2005-08-09 02:37:49 |
| 5404 | 15.17 | 19 01 45.0 58 09 | 2005-08-10 01:57:21 |
| 5405 | 15.17 | 19 01 45.0 58 09 | 2005-08-12 03:11:53 |
| 5406 | 14.76 | 19 01 45.0 58 09 | 2005-08-13 01:50:17 |
Our data analysis was performed with the Chandra Interactive Analysis of Observations (CIAO) software package version 3.3, combined with CALDB 3.2.1. Merging all eight individual observations results in a very deep dataset with a total exposure time of 156 470 sec. In our analysis we consider only results arising from the imaging array (ACIS-I) of four abutted pixel front-side illuminated charge-coupled devices (CCDs) providing a field of view of about on the sky. As the aimpoints and the orientation of the camera on the sky (the “roll angle”) differed for the individual observations, the merged image covers a slightly larger area. Exposure maps and aspect histograms were computed for the single datasets as well as for the merged dataset, allowing for a determination of the effective exposure time at each sky position, taking into account the spatial variation of the detector quantum efficiency, non-uniformities across the face of a detector, mirror vignetting, and bad pixels.
The detection limit of the Chandra data was determined in the following way: using the PIMMS111PIMMS is the Portable, Interactive Multi-Mission Simulator provided by the HEASARC Online Service at http://heasarc.gsfc.nasa.gov/Tools/w3pimms.html software developed by the NASA High Energy Astrophysics Science Archive Science Center and assuming an intrinsic source spectrum of a 10 MK thermal plasma with a metal abundance of 0.4 times solar, as typical for young stellar X-ray sources (e.g., Getman et al., 2005), we find that one detected count in 156.47 ksec corresponds to an X-ray flux of in the keV energy range. A five count source detection thus corresponds to an X-ray luminosity of erg/s at the assumed distance of 130 pc and for no intervening extinction. Our dataset thus represents one of the most sensitive X-ray observations of a star-forming region ever obtained; it is about four times more sensitive than the data of the Chandra Orion Ultradeep Project (Getman et al., 2005), which provided a detection limit of erg/sec for lightly absorbed sources (Preibisch et al., 2005a). Many of the YSOs in the CrA star-forming region suffer from substantial extinction, up to mag. The intervening extinction raises the effective detection limit; for mag the detection limits are erg/s. Note that these values are valid for the central ( radius) area of the Chandra image; source detectability degrades with off-axis angle, and is times lower near the edges of the Chandra field of view (at offaxis angles ).
For locating the X-ray sources in our image, we used the wavelet transform detection algorithm implemented as the wavdetect program within the CIAO data analysis system (Freeman et al., 2002; Getman et al., 2005).
With a nominal threshold of identifying a pixel as belonging to a source (parameter ’sigthresh’) of and wavelet scales between 1 and 16 pixels, the program located 91 sources. We manually added one clearly detected source with about 100 counts (marked as such in Table A), which was missed by the algorithm due to its location very close to the edge of the image. Thus, we consider a total of 92 sources.
After reprocessing all observations with CIAO 3.3 yielded a homogeneous set of ”level 2” event files (without pixel randomization), the acis_extract package222see http://www.astro.psu.edu/xray/docs/TARA/code/, version 3.94, was used for further analysis. Spectral extraction regions were defined in a way to include a specified fraction of the point-spread function at the respective positions (90% at an energy of 1.5 keV), independently for each observation. In the framework of acis_extract, the background was determined from a region surrounding each source, containing a minimum number of counts (100 in our case) and excluding neighbouring sources. Composite source spectra were constructed by summing the single-observation spectra, taking into account appropriately scaled background spectra for each observation. Composite response matrix files (RMFs) and ancillary response files (ARFs) were constructed using the FTOOLs addrmf and addarf, weighting the single-observation source-specific RMFs and ARFs by their respective exposure times. Spectral fitting with Monte Carlo techniques was then performed with the CIAO tool Sherpa (see Sect. 4.1).
Basic results of this analysis, namely a source list with net counts, median energy, source significance, hardness ratios, as well as incident flux estimates and information on the effective exposure times are listed in Table A. The errors for the net counts contain the propagated Gehrels errors (Gehrels, 1986) of the source and background counts. The uncertainty of the absolute energy calibration of ACIS is 0.3%333see http://cxc.harvard.edu/cal/. Also listed is the source significance, i.e. the photometric signal-to-noise ratio. Hardness ratios compare the source counts in two energy bands in the form HR = (Ctshard - Ctssoft)/(Ctshard + Ctssoft). We list the three hardness ratios as defined in Getman et al. (2005) with the following energy ranges: [0.5-2.0] keV vs. [2.0-8.0] keV for HR1, [0.5-1.7] keV vs. [1.7-2.8] keV for HR2, and [1.7-2.8] keV vs. [2.8-8.0] keV for HR3. The uncertainties for the hardness ratios were calculated using a method described by Lyons (1991) with a script supplementary to acis_extract developed by Konstantin Getman444http://www.astro.psu.edu/users/gkosta/AE/accessory_tools.htm. In a few cases, no error could be estimated because divisions by zero occur, cases correspondingly marked by ’NaN’ (for ’not a number’). Finally, we list the two acis_extract flux estimates. Their difference lies in the handling of the ancillary response matrix which is done either channel-wise (for FLUX1) or using an averaged value (for FLUX2). For a detailed discussion of the algorithms used by acis_extract, see Getman et al. (2005) and the online documentation555http://www.astro.psu.edu/xray/docs/TARA/ae_users_guide.html.
For those (putative) members of the CrA star-forming region that remained undetected in the Chandra data, we determined upper limits to the count rates and X-ray luminosities in the following way. We counted the observed number of photons in source regions centered at their optical/infrared positions and compared them to the expected number of background photons determined from several large source-free background regions. We used the Bayesian statistics method described by Kraft et al. (1991) to determine the 90% confidence upper limits for their count rates. From these count rate upper limits we computed upper limits for the extinction corrected X-ray luminosities in the keV band assuming thermal plasma-spectra with a temperature of MK and computing the absorbing hydrogen column density from the visual extinction according to the empirical relation (Feigelson et al., 2005a).
3 X-ray sources and cluster members
3.1 Source identification
| Source | Counterpart | SED | Name | SpT | |||
|---|---|---|---|---|---|---|---|
| CXO J | DSS | 2MASS | Spitzer | class | |||
| 190104.58–370129.6 | n | y | y | III | CrA 453 | M4 | |
| 190108.60–365721.3 | y | y | y | II | S CrA | K3 | 2.29 |
| 190115.86–370344.3 | n | n | y | ||||
| 190116.26–365628.4 | y | y | y | II | V667 CrA | M5 | |
| 190118.90–365828.4 | n | y | y | II | CrA 466 | M4.5 | |
| 190119.39–370142.0 | n | n | y | ||||
| 190120.86–370302.9 | y | y | y | III | CrA 4111 | M5 | |
| 190122.40–370055.4 | n | n | y | ||||
| 190125.61–370453.9 | n | y | y | III | ISO-CrA 133 | ||
| 190125.75–365919.3 | n | y | y | II | ISO-CrA 134 | ||
| 190127.15–365908.6 | y | y | y | III | ISO-CrA 135 | M | 0.12 |
| 190128.72–365931.9 | y | y | y | ISO-CrA 136 | |||
| 190129.01–370148.8 | y | y | y | III | ISO-CrA 137 | ||
| 190132.34–365803.1 | n | y | y | II | TS 2.9 = ISO-CrA 139 | ||
| 190133.84–365745.0 | n | y | y | II | TS 2.8 = IRS 13 | 0.07 | |
| 190134.84–370056.7 | y | y | y | III | V709 CrA | K1 IV | 1.55 |
| 190139.15–365329.6 | y | y | y | HD 176386-B | |||
| 190139.34–370207.8 | y | y | y | III | |||
| 190140.40–365142.4 | n | y | y | II | |||
| 190140.81–365234.0 | y | y | y | TY CrA a/b/c/d | B8e/K2/F–K/M | ||
| 190141.55–365831.6 | n | y | y | I | IRS 2 | K2 | 4.3 |
| 190141.62–365953.1 | y | y | y | II | HBC 677 | ||
| 190143.12–365020.9 | n | n | y | ||||
| 190148.02–365722.41 | n | y | y | I | IRS 5 a/b | K6 V/? | 1.6/? |
| 190148.46–365714.5 | n | n | y | I | |||
| 190149.35–370028.6 | y | y | y | III | LS-RCrA 2 | M6 (BD cand.) | |
| 190150.45–365638.1 | n | y | y | II | IRS 6A | M2 | 0.5 |
| 190150.66–365809.9 | n | y | y | I | V710 CrA = IRS 1 = HH 100 IR | K5-M0 | 3.1 |
| 190151.11–365412.5 | n | y | y | II | IRS 8 | ||
| 190152.63–365700.2 | n | y | y | I | IRS 9 | ||
| 190153.67–365708.3 | y | y | y | R CrA | A5 IIe var | ||
| 190155.31–365722.0 | n | n | y | I | IRS 7 W (= 7 A) | ||
| 190155.61–365651.1 | n | n | y | I | |||
| 190155.76–365727.7 | n | n | y | I/II | |||
| 190155.85–365204.3 | n | n | y | ||||
| 190156.39–365728.4 | n | n | y | 0/I | IRS 7 E (= 7 B) | ||
| 190157.46–370311.9 | n | y | y | ||||
| 190158.32–370027.5 | n | n | y | III | |||
| 190158.79–365750.1 | y | y | y | II | T CrA | F0e | 3.4 |
| 190200.11–370222.3 | y | y | y | III | 2MASS J19020012-3702220 | M4 | |
| 190201.92–370743.0 | y | y | y | III | V702 CrA | G5 | 1.55 |
| 190201.94–365400.1 | n | n | y | B185839.6-365823 | BD cand. | ||
| 190211.99–370309.4 | n | y | y | II | ISO-CrA 143 | BD cand. | 0.01 |
| 190222.13–365541.0 | y | y | y | III | HBC 679 | K2 IV | 0.50 |
| 190227.05–365813.2 | y | y | y | II | HBC 680 | M | 0.72 |
| 190233.07–365821.1 | y | y | y | II | ISO-CrA 159 | M | 0.45 |
In order to identify the X-ray sources, we inspected the source positions on optical images from the Digitized Sky Survey, near-infrared images from 2MASS, and near- to mid-infrared images from the Spitzer observatory.
A set of reduced Spitzer-IRAC mosaic images of the CrA star-forming region and a list of sources with IRAC photometry and classifications of their broad-band infrared spectral energy distributions (SEDs) was kindly provided to us by Lori Allen. The SED classification was performed as described in Megeath et al. (2004) and sorts the objects into the different infrared classes 0/I/II/III (with class 0 = protostar, class I = evolved protostar, class II = T Tauri star with disk, class III = T Tauri star without disk; for further information see Lada, 1987; André et al., 1993). The superb PSF of Chandra/ACIS and the high accuracy of the aspect solution, resulting in a positional accuracy of typically better than , allowed a clear and unambiguous identification of 46 of the 92 X-ray sources with optical and/or infrared counterparts. Figure 1 shows the location of the X-ray sources marked on the m and the m Spitzer images. Further information about the counterparts was obtained from the SIMBAD database and the literature; references are given in the text describing the individual objects. The results of the source identification are listed in Table 2.
46 X-ray sources have either no counterparts in any of the optical/infrared images mentioned above. Given the detection limits of for the 2MASS image and our estimate of for the Spitzer m image, it is very unlikely that these objects are related to the CrA star-forming region: According to the Siess et al. (2000) pre-main sequence (PMS) models, a 5 Myr old star at a distance of 130 pc would have un-reddened magnitudes of and . An extinction of mag would thus be required to prevent detection in the 2MASS -band image, and an even higher value of mag to prevent detection in the Spitzer m image. We also note that the number of X-ray sources without counterparts is in good agreement with the expected number of (mostly extragalactic) background X-ray sources that has been derived from the deep X-ray source counts666Based on the X-ray source counts presented by Brandt et al. (2001) there should be extragalactic sources exceeding the flux limit of our data. The number of actually detectable extragalactic sources must be somewhat smaller due to the extinction of the dark cloud, especially in the central part of our field of view. . Furthermore, the background nature of these sources is also supported by their uniform spatial distribution within the field of view.
We also searched for, but could not find any X-ray emission associated with the protostellar cores in the CrA star-forming region as listed by Nutter et al. (2005), unless these contain infrared objects. Finally, we also searched for X-ray sources at the positions of 43 HH objects in the CrA star-forming region as listed in Wang et al. (2004). From none of these objects X-ray emission is detected777 We note that the Chandra source 190205.84–365444.2 has neither optical nor infrared counterparts, but is located near a bow shock seen in the Spitzer images. However, a relation between the X-ray emission and the bow shock seems very unlikely. First, the positional offset of is clearly much larger than the astrometric accuracy, and the offset is not along the flow direction, i.e. cannot be explained by the non-simultaneous nature of the X-ray and infrared images. Second, the distribution of energies of the 21 detected source counts is quite hard (no photons with energy keV, 4 photons in the keV, and 17 photons in the keV range), in strong contrast to the very soft X-ray emission expected from jet shocks and observed in some cases (e.g. Pravdo et al., 2004; Grosso et al., 2006). We therefore believe that the X-ray emission comes from a background object and is not related to the bow shock..
As discussed in the following subsections in more detail, we detect X-ray emission from 9 class 0, class I, and flat-spectrum objects, 14 class II objects, and 12 class III objects.
3.2 X-ray emission and membership in the star-forming region
The observed X-ray properties can provide crucial information for a clarification of the membership status of presumed members discussed in the literature. We can confidently expect to detect X-ray emission from (almost) any stellar member of the region, given the following considerations: The COUP data showed that all young late-type stars in the Orion Nebula Cluster show strongly elevated X-ray emission as compared to the Sun and solar-like field stars (Preibisch et al., 2005a): at least 98% of all late type YSOs in the Orion Nebula Cluster have fractional X-ray luminosities of , and there are strong indications that the 2% of the stars below this value are not cluster members but field stars (see discussion in Preibisch et al., 2005a).
Assuming a lower limit to the fractional X-ray luminosities of to hold for the YSOs in the CrA star-forming region, we expect to detect X-ray emission from any of its stellar members, unless the extinction is too high. To put this statement in a more quantitative way, we conservatively assume that the YSOs have fractional X-ray luminosities of , and ages of 5 Myr. For the case of no extinction, the X-ray detections should then be 100% complete down to stars of or spectral type M7. For an extinction of mag, the limit of complete detections is at or spectral type M5, and for mag at or spectral type M0. Note that the typical X-ray emission level of young stars is , i.e. a factor of 25 higher than our assumed lower limit, so we expect to detect also the majority of lower-mass objects, unless their extinction is very high.
3.2.1 Previously known and suspected members
Neuhäuser et al. (2000) list 34 previously known or suspected members of the CrA star-forming region. Among the objects in the field of view of the Chandra data, only two remain undetected. 2MASS J19010586-3657570 (= ISO CrA 113, spectral type G0) shows no near-infrared excess and the Spitzer photometry is consistent with purely photospheric emission. Neuhäuser et al. (2000) reported that no signs of 6708 Å Lithium absorption are seen in its spectrum, suggesting that it is not a young star. The second case is 2MASS J19014791-3659302 (= TS 13.4), which also shows no infrared excess and has a class III Spitzer SED. Together with the non-detection in the Chandra data, these points strongly suggest that these two stars are not members of the CrA star-forming region but unrelated field stars.
The results of a ISOCAM survey of the CrA star-forming region were reported by Olofsson et al. (1999). They identified 21 infrared sources with mid-infrared excess, 10 of which are located within the field of view of the Chandra data. Eight of these 10 objects are detected as X-ray sources, only ISO CrA 140 and ISO CrA 145 remain undetected by wavdetect. The 2MASS colors of ISO CrA 140 show a near-infrared excess, but the Spitzer photometry suggest a class III SED, and we note that this object was not detected in the ISOCAM m band, raising doubts about the presence of excess emission. The near-infrared colors of this object suggest an extinction on the order of mag. Since ISO CrA 140 is a relatively faint infrared source, we suspect that its low intrinsic luminosity in combination with strong extinction may have prevented the X-ray detection. Alternatively, it may be an unrelated background AGB star rather than a young star in the CrA star-forming region. With 28 counts in an area of radius ( net counts), ISO CrA 145 may actually be marginally detected although the source was not found by wavdetect. The same region for ISO CrA 140 contains only 10 counts.
López Martí et al. (2005) identified 13 candidate very low-mass members of the CrA star-forming region by optical spectroscopy. Six of these are in the field of view of the Chandra image, and five of them, CrA 453, 466, 468, 4110, and 4111, all with estimated spectral types around M5, are detected as X-ray sources, consistent with the assumption that they are young members of the CrA star-forming region. The X-ray detection of all these very low-mass star reinforces our expectation that our X-ray data should be complete for all stellar members of the Coronet region, unless they are particularly strongly obscured.
The remaining object is CrA 465, a brown dwarf candidate with estimated spectral type M8.5. It was not detected as an X-ray source by the automatic source detection, but as will be discussed in §4.2.5, inspection of the location of this object in the Chandra image yields indications of a tentative detection of very weak X-ray emission.
3.2.2 IRS 3: a background giant rather than a YSO
The bright infrared source IRS 3 (2MASS J19020491-3658564) is usually considered to be a YSO associated with the CrA star-forming region. In a spectroscopic and photometric study, Nisini et al. (2005) derived a spectral type K5–M0 III, , mag, , and an age Myr, but found no no significant near-infrared excess and no signs of accretion. Remarkably, IRS 3 remains undetected in the Chandra data. We derive a 90% confidence count rate upper limit of counts/ksec, that corresponds to an upper limit of erg/sec and . This value would be most unusually low if IRS 3 was a YSO: in the COUP data more than 99.5% of all young late-type stars in the Orion Nebula Cluster have fractional X-ray luminosities above this level. This non-detection therefore suggests that IRS 3 is not a young star, and this argument is supported by several other pieces of evidence: First, IRS 3 shows no infrared excess. Second, the age of Myr, derived under the assumption that the object is located in the CrA star-forming region, is considerably larger than the ages of all other Coronet objects observed by Nisini et al. (2005). Third, IRS 3 is the only one of the objects studied by Nisini et al. (2005) with luminosity class III; all other have luminosity class V (as expected for young stars). Taken together, these considerations strongly suggest that IRS 3 is not a YSO in the Coronet cluster, but rather a background giant behind the dark cloud.
3.2.3 YSO candidates from Spitzer-IRAC photometry
Spitzer IRAC colors were used to classify the infrared sources as described in Megeath et al. (2004). While class I or class II objects are probably YSOs, the class III objects are a mixture of YSOs which have already dispersed their (inner) disks and unrelated field stars. We thus consider objects with class I or class II SEDs and no previous identification as new YSO candidates. As discussed in Megeath et al. (2004), several factors may lead to incorrect classifications. For example, some of the objects identified as class I may be in fact strongly reddened class II objects, and background objects such as planetary nebulae, AGB stars, and galaxies may be misidentified as class I or class II objects. The detection of X-ray emission at levels typical for YSOs allows a clear distinction between YSOs and background objects of the above-mentioned kind. We detect 14 of the 17 objects with Spitzer class II SEDs, and 9 of the 10 objects with Spitzer class (0)I SEDs.
Class I objects:
Spitzer photometry reveals three objects in the Chandra field of view with class I SEDs that were not identified as YSOs before. Two of them, 190148.46–365714.5 and 190155.61–365651.1 (both remained undetected in the 2MASS images), can be identified with X-ray sources. Their X-ray detections strongly support the YSO status of these objects. With 22 and 41 source counts, respectively, these X-ray sources are too faint for detailed spectral fitting, but the high median energies of their source photons of 4.1 keV and 4.5 keV are fully consistent with the hard spectra expected for embedded class I objects.
The third new object with Spitzer class I SED is the infrared source B185836.1-370131 discovered originally by Wilking et al. (1997). It is invisible in the 2MASS - and -band images but is seen as a very faint source in the 2MASS -band image. This object coincides with sub-mm source SMM 2 from Nutter et al. (2005), but remains undetected in the Chandra data. If it is truly a protostellar member of the CrA star-forming region, its non-detection in the Chandra data could be related to very strong extinction, as suggested by the non-detection in the 2MASS images. Since we cannot estimate the extinction to this object, no upper limit to the X-ray luminosity can be determined. However, we can ask how much extinction would be required to keep it undetected in the Chandra data, if one assumes that it has an X-ray luminosity of erg/sec (the mean value for the X-ray detected Coronet class I objects IRS 1, 5, and 2). Using PIMMS and assuming a plasma temperature of MK, we find that a hydrogen column density of , corresponding to an extinction of mag, would be required for this object to escape detection in the Chandra data. This extreme extinction may perhaps be caused by occultation of a massive circumstellar disk seen exactly edge-on, or B185836.1-370131 may be very deeply embedded in a dense circumstellar envelope, and thus is perhaps a class 0 object. An alternative possibility would be that it is a background AGB star (which would not be a strong X-ray emitter); in that case, however, its location just behind a sub-mm cloud core would be a quite curious coincidence.
Class II objects:
Three objects with class II Spitzer SEDs remain undetected in the Chandra data: LS CrA I and B185831.1-370456, two brown dwarf candidates which will be discussed in §4.2.5, and 2MASS J19020682-3658411. The later object is a relatively faint infrared source and shows a near-infrared excess. It may be a very-low luminosity (and correspondingly very-low mass, perhaps sub-stellar) member of the CrA star-forming region suffering from particularly strong extinction, or an unrelated background AGB star.
4 X-ray properties of the YSOs
4.1 X-ray variability and spectroscopic analysis
Since the short-term variability (as seen in the light curves of the individual observations) of the Coronet X-ray sources is discussed in Forbrich et al. (2006) and Forbrich et al. (2007), we focus here entirely on the long-term variability defined by the temporal sequence of the Chandra observations, covering a period of nearly five years.
For the present analysis we determined for each source the mean count rates during each of the 8 individual Chandra observations. While many sources show only small and often statistically insignificant variations, strong variability is seen in some of the YSOs. The more interesting long-term lightcurves are shown in Fig. 2, and the variability of individual objects will be discussed below.

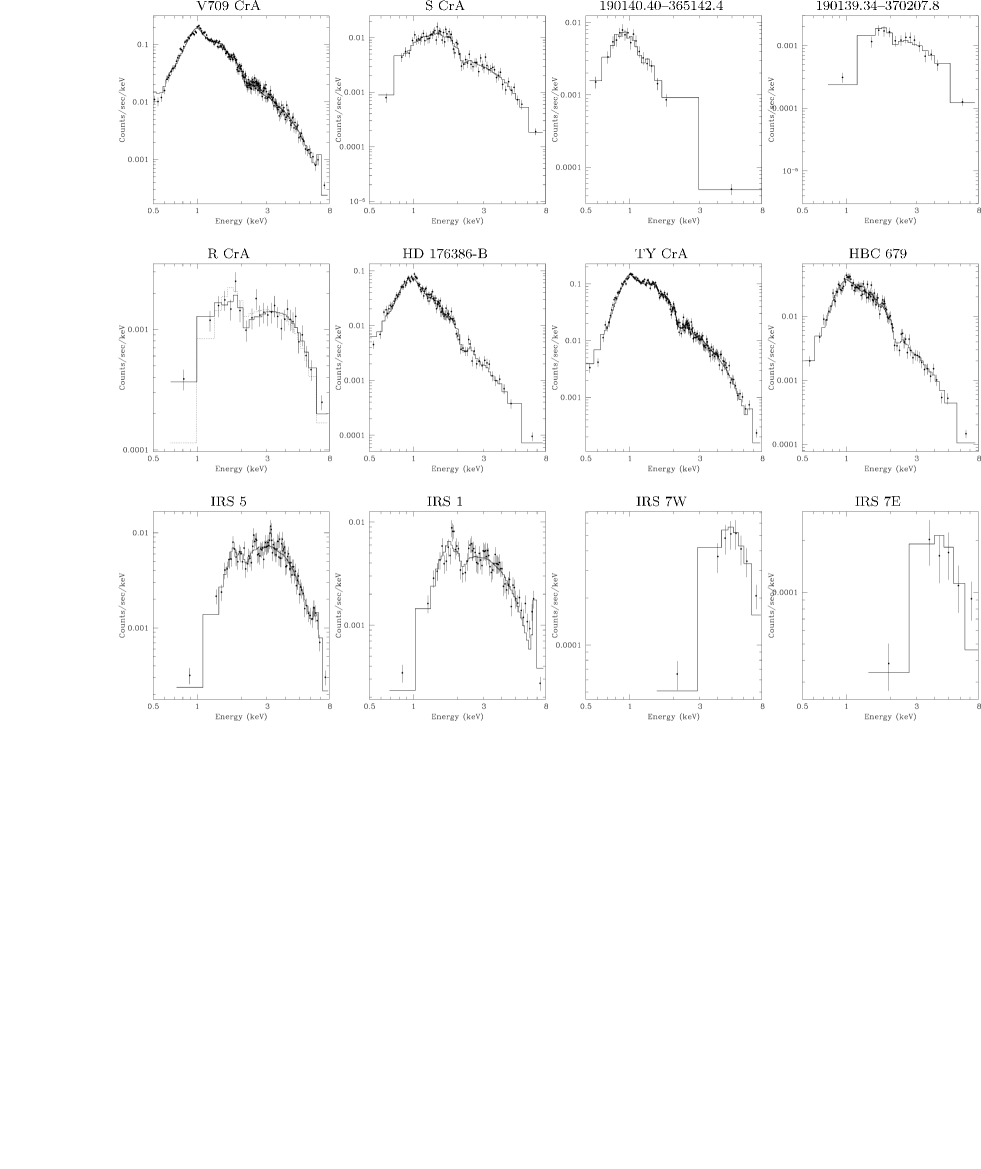
A detailed analysis of the X-ray spectra of all sources with optical/infrared counterparts was performed with the Sherpa package in CIAO. The spectra were fitted with one- and two-temperature optically thin thermal plasma models plus an intervening absorption term. We used the XSPEC models “apec”, assuming a uniform density plasma with 0.3 times solar elemental abundances, and “wabs” for the absorption model. Spectral fits were carried out ignoring energy bins outside an energy range of 0.2–10 keV. As X-ray spectral fits sometimes suffer from ambiguities in the spectral parameters, special emphasis was placed on a careful scanning of the parameter space in order to find the best fit model. For this, we employed the monte-lm algorithm implemented in Sherpa, which performs hundreds of fitting runs per spectrum, each one using a different set of randomly chosen starting values for the fitting parameters.
Spectra of sources with less than 1000 counts were generally well fitted with a single-temperature plasma model, for stronger sources and sources for which the single-temperature model did not provide an acceptable fit, a two-temperature model was employed. The spectral analysis yielded plasma temperatures and hydrogen column densities and was also used to compute the intrinsic (extinction-corrected) X-ray luminosity by integrating the model source flux over the keV band. The results are listed in Table 4. Some representative examples of spectra are shown in Fig. 3. For X-ray sources with less than counts, the spectral fitting procedure often does not allow to reliably determine the spectral parameters. In these cases, the incident flux at the telescope aperture as determined by acis_extract (see Table A) provides at least a rough estimate of the observed (i.e. not extinction-corrected) source luminosity.
4.2 X-ray properties of different object classes
4.2.1 B- to F-type stars
TY CrA:
The B8e star TY CrA is (at least) a quadruple system: in addition to the two spectroscopic companions with separations of 0.07 AU and 1.2 AU and estimated spectral types of K2 and late F to early K (Casey et al., 1995; Corporon et al., 1996; Casey et al., 1998), a visual companion at a projected separation of 41 AU () and of spectral type M4 was found by Chauvin et al. (2003). With 21026 counts, the TY CrA system represents the second-brightest X-ray source in the field of view. Since the individual components cannot be resolved in the X-ray data, their contributions to the observed X-ray emission cannot be discerned. However, it is interesting to note that the observed X-ray properties agree very well with the expected X-ray emission of the three late-type companions, assuming that these stars have X-ray characteristics similar to those of other stars with similar age and mass: the median X-ray luminosities of young G- and early K-type stars in the COUP sample are erg/sec, and for young M-type stars erg/sec (Preibisch & Feigelson, 2005). Thus, the expected combined X-ray luminosity of the three companions of TY CrA is erg/sec, a value that is very close to the observed system X-ray luminosity of . Also, the plasma temperatures of MK and MK derived from the fit to the X-ray spectrum of the TY CrA system are in the prototypical range observed for G- and early K-type T Tauri stars (see, e.g., Preibisch et al., 2005a). The observed X-ray emission from the TY CrA system can thus be very easily understood as originating from the late-type companions of TY CrA; the data provide no direct hint towards possible X-ray emission from the B8e star. Of course, we cannot rule out the possibility that (some fraction of) the observed X-ray emission may nevertheless come from the Be star, but the data provide no indications for this assumption.
HD 176386:
This B9 IVe star has a visual companion at separation (Jeffers et al., 1963). The strong decrease of the brightness ratio between primary and companion from optical to near-infrared wavelengths of ( mag according to Turon et al. (1993) and the 2MASS point-source catalog) suggests that the companion is of substantially later spectral type and thus most likely a low-mass () star.
A strong X-ray source with 7720 counts is perfectly centered on the position of the companion to HD 176386, whereas there is no evidence for emission from the B star in our data. The spectral fit yields parameters ( MK, MK, ) which are very typical for K- and early M-type T Tauri stars.
In order to derive an upper limit to the possible X-ray emission from the primary B-star HD 176386, we extracted counts in a radius aperture centered on its optical position. There are 21 photons in this region, which however is strongly affected by the wings of the PSF of the X-ray emission from the companion. Comparison with nearby “background regions” at the same radial distance from the strong X-ray source yielded an expected background of 22 counts in a radius aperture. The 90% confidence upper limit to the number of counts from HD 176386 is 8.4 source counts. After correction for the small extraction region, which would contain only about 30% of the flux from a point source at the off-axis angle of , we derive an upper limit of counts/ksec for the source count rate; with mag and (Bibo et al., 1992) we derive upper limits of erg/sec and .
R CrA:
The Herbig Ae star R CrA shows an extremely strong infrared excess. According to the analysis of Acke & van den Ancker (2004), the stellar luminosity, derived by fitting and integrating a model for the stellar photosphere to the de-reddened photometry, is only a very small fraction of the bolometric luminosity, i.e. the total integrated luminosity of the SED. The fact that the derived stellar luminosity would place R CrA below the main-sequence in the HR-diagram, shows that the stellar parameters are very uncertain. Perhaps, the central star is deeply embedded in circumstellar material and seen only in scattered light. In that case, the stellar luminosity and also the derived extinction of mag would be considerably underestimated.
The X-ray emission from R CrA is strongly variable and has risen to considerably higher levels in the last two epochs of our monitoring Chandra observations (Fig. 2, see also X-ray lightcurves in Forbrich et al., 2006). The lightcurves of the individual August 2005 Chandra observations (shown in Forbrich et al., 2007) reveal numerous flare-like peaks, suggesting that the source is more or less continuously flaring. Our spectrum of R CrA contains 981 source counts. The extreme hardness of the spectrum, providing clear evidence for the presence of very hot plasma, was already noted in Forbrich et al. (2006) and is clearly confirmed. A one-temperature model cannot produce an acceptable fit to the observed spectrum; while the hard part ( keV) of the spectrum is rather well fitted, a clear excess of counts remains at and just below 1 keV (this model is shown by the dashed line histogram in the spectrum in Fig. 3). A two-temperature model provides a formally acceptable fit (), but the resulting spectral parameters are very dubious: in addition to an extremely hot plasma component, for which only a lower bound to the temperature ( MK) can be established, the fit yields an extremely strong and cool low-temperature component of MK and strong extinction of . The emission measure of this alleged low-temperature plasma component would be more than 2000 times larger than that of the high-temperature component, and its (extinction-corrected) X-ray luminosity would be erg/sec, orders of magnitude higher than the luminosity of the high-temperature component of erg/sec. This extremely high X-ray luminosity makes it very unlikely that this very soft spectral fit component represents soft X-ray emission due to accretion shock emission. Rather, we strongly suspect that this fit result is an example of the highly nonlinear interaction of very low-temperature plasma components and strong extinction (see, e.g., the discussion in Getman et al., 2005). For high hydrogen column densities, such a very low-temperature plasma component is almost entirely absorbed, and thus any uncertainties in the lowest energy bins of the spectrum can lead to large overestimates of the extinction-corrected X-ray luminosity.
In an attempt to find a spectral fit solution that avoids this kind of inference of a very luminous, but heavily absorbed, ultrasoft component, we considered a spectral model in which both of the two plasma components have individual extinction factors rather than a common extinction factor for both components (model = wabs apec wabs apec2, instead of the “usual” model = wabs [apecapec2]). This model provides a very good fit () for ( mag), MK, and ( mag), MK, and is shown by the solid line histogram in the spectrum in Fig. 3. The extinction-corrected X-ray luminosities for the two spectral components are erg/sec and erg/sec.
The requirement of different extinction values for the two temperature components in the spectrum of R CrA is similar to the case of FU Ori, for which Skinner et al. (2006) found that the hot plasma component also requires a considerably larger hydrogen column density than the low-temperature component to fit the observed spectrum. They argued that the hot component represents coronal emission that is strongly absorbed in accretion streams or a strong stellar wind. Why the cooler spectral component is less absorbed, remains unclear; perhaps it originates from a different location. An alternative explanation would be that the X-ray emission comes from two different, close and thus unresolved objects (perhaps late type companions to R CrA) for which the extinction along the line-of-sight is different. Although these explanations remain quite speculative, it is interesting that R CrA and FU Ori are both very strongly accreting, and their peculiar X-ray spectra may therefore be in some way affected by accretion processes. If the X-ray emission originates from R CrA (and not from an unresolved companion) the extinction derived from the X-ray spectrum ( mag) supports the suspicion that the optical extinction value of mag is a serious underestimate.
T CrA:
This F0e star is particularly interesting because its spectral type is very close to the upper boundary for stars with convective envelopes. For the stellar parameters of T CrA as listed in Acke & van den Ancker (2004), the models of Siess et al. (2000) suggest an extremely shallow convective envelope with relative thickness of . An interesting question is whether a magnetic dynamo may work in such an extremely thin convection zone.
From an analysis of the first Chandra observation of the Coronet (ObsID=19), Skinner et al. (2004) reported a tentative X-ray detection of T CrA with counts in these data. In our much deeper dataset we clearly detect X-ray emission from T CrA, although again only as a rather faint source (14 source counts). A fit of the X-ray spectrum, with the hydrogen column density fixed at the value corresponding to the extinction of mag as derived by Acke & van den Ancker (2004), suggests a plasma temperature of MK and yields an X-ray luminosity of erg/sec. This F0 star is thus clearly a much weaker X-ray emitter than the G type T Tauri stars in the Coronet and in other young clusters (see, e.g., Preibisch et al., 2005a). This suggests that T CrA is the hottest object in the Coronet region with coronal X-ray activity driven by a dynamo in a very shallow convection zone.
4.2.2 T Tauri Stars
S CrA :
This classical T Tauri star of spectral type K3 has a faint companion (), also a classical T Tauri star, with spectral type M0, located at a separation of from S CrA (Prato et al., 2003; McCabe et al., 2006). The Chandra data yield 3020 source counts, and their spatial distribution is consistent with a single source at the position of the primary; there is no elongation along the direction toward the companion (along position angle ). The spectral parameters are prototypical for T Tauri stars.
HBC 679 :
This weak-line T Tauri star of spectral type K5 has a companion of spectral type M3 at a separation of (Prato et al., 2003). The Chandra source with 5468 counts is centered at the position of the primary, but there is an elongation in the direction of the secondary. Since the source is located close to the edge of the field of view of the Chandra image, where the PSF is already degraded, the contributions of the individual components cannot be reliably disentangled.
4.2.3 The class 0 protostar candidate IRS 7E
The infrared source IRS 7E has many properties that are characteristic for class 0 protostars. Its SED is dominated by the strong submillimeter emission (Nutter et al., 2005), and possibly the source has a disk and an outflow (Anderson et al., 1997; Groppi et al., 2004), although a definitive attribution is currently difficult due to the high source density in the region and the comparably low angular resolution. Harju et al. (2001) find evidence for a radio jet emanating from IRS 7E. IRS 7E is detected in all four IRAC bands of the Spitzer images. Based on this and new high-angular resolution submillimeter data, Groppi et al. (2007) conclude that IRS 7E (their source SMA 1) is a transitional class 0/I source, thus the youngest of the sources discussed here. This result supports the notion that IRS 7E is different (i.e. in an earlier evolutionary state) from the class I objects.
The X-ray detection of IRS 7E (originally reported by Hamaguchi et al., 2005b) represents up to now the only reliable case for high-energy emission from this early evolutionary stage. The long-term lightcurve (see Fig. 2) suggests considerable variability, but (probably due to the low count rate) no individual flares are detected in the individual Chandra observations. The X-ray spectrum of IRS 7E (see Fig. 3) is very hard; the spectral fit suggests an extinction of mag, yields a plasma temperature of MK, and gives an extinction-corrected X-ray luminosity of erg/sec. These parameters are roughly consistent with those derived by Hamaguchi et al. (2005b) from their XMM data for the phase of “constant” emission before the flare. The very high plasma temperature clearly shows that the X-ray emission is dominated by magnetic processes, suggesting that magnetic activity starts already in extremely early stages of (proto)stellar evolution.
4.2.4 Class I protostars

X-ray emission from seven class I protostars is detected in our dataset: IRS 1, 2, 5, 7 W, 9, 190148.46–365714.5, and 190155.61–365651.1. The X-ray properties of these objects are similar to those of other X-ray detected class I protostars.
The class I object IRS 5 is especially interesting. The object is a close binary with a separation of (Chen & Graham, 1993; Nisini et al., 2005). The X-ray emission is marginally resolved in the Chandra data, with the infrared brighter component being also the stronger X-ray source. Due to the PSF overlap, the individual components cannot be reliably resolved and thus we study here only the composite spectra and lightcurves. The X-ray spectrum of IRS 5 (Fig. 3) shows a prominent emission line at 6.7 keV, which is the K-line from highly ionized iron (Fe XXV). A closer look at the spectrum (Fig. 4) reveals significant excess emission around 6.4 keV, which we identify as 6.4 keV line emission from neutral to low-ionized iron. The addition of a 6.4 keV emission line to the spectral model yielded a good fit for a line width of eV. The quality of the spectral fit with this 6.4 keV line (reduced of 0.91 for 84 DOF) is clearly better than without this line (reduced of 0.97 for 87 DOF); an -test shows that the null hypothesis, i.e. the assumption that the observed 6.4 keV excess is due to random noise, can be rejected with 99% certainty. Considering only the keV range of the spectrum, as shown in Fig. 4, the reduced changes from 1.45 (10 DOF) for the fit without a 6.4 keV line to 0.78 (7 DOF) for the fit with a 6.4 keV line.
Similar 6.4 keV iron fluorescence lines have been observed in some other YSOs (e.g., Imanishi et al., 2001a; Favata et al., 2005; Tsujimoto et al., 2005). The presence of the 6.4 keV K-line from cool iron in addition to the 6.7 keV K-line from hot iron can be explained as fluorescence emission from cool material that is irradiated by the hard X-ray emission from the YSO. However, it is not immediately clear where this cool, fluorescing material is located. One obvious possibility would be fluorescence from irradiated material in a circumstellar disk, but the emission may in principle also originate from interstellar material somewhere along the line of sight. As discussed in Tsujimoto et al. (2005), the width of the 6.4 keV line can help to distinguish between these different possibilities (see also Favata et al., 2005). For fluorescence emission from interstellar material along the line of sight, one would expect a line width that should be considerably smaller than 10 eV (formula (4) in Tsujimoto et al., 2005). The observed line width of 44 eV therefore clearly suggests that the fluorescent emission comes from dense local, i.e. circumstellar material of higher column density, most likely from the irradiated circumstellar disk of IRS 5. The strong X-ray irradiation of circumstellar disk material has important consequences for the physical processes in the circumstellar dust and gas and the evolution of proto-planets (e.g., Glassgold et al., 2005; Wolk et al., 2005).
4.2.5 Brown Dwarfs
| Name | Ref | SpT | M | source | |||||
|---|---|---|---|---|---|---|---|---|---|
| [mag] | counts | [MK] | [erg/sec] | ||||||
| B185815.3-370435 | 1 | ||||||||
| B185831.1-370456 | 1,2 | M8.5 | 9 | ||||||
| B185839.6-365823 | 1 | 47 | |||||||
| B185840.4-370433 | 1 | 6 | |||||||
| B185853.3-370328 | 1 | ||||||||
| LS-RCrA 1 | 3 | M6.5-7 | |||||||
| LS-RCrA 2 | 3 | M6 | 113 | 4.5 | |||||
| ISO CrA 143 | 4 | M8: | 88 | 8 |
X-ray emission has been detected from numerous young BDs (e.g., Neuhäuser & Comerón, 1998; Imanishi et al., 2001b; Preibisch & Zinnecker, 2001, 2002; Tsuboi et al., 2003; Preibisch et al., 2005b), but the origin of their activity is still not well understood. The CrA star-forming region contains a number of very low-mass objects, some of which are most likely young brown dwarfs (BDs). Several objects have been identified as BD candidates in different studies (Wilking et al., 1997; Neuhäuser et al., 1999; Olofsson et al., 1999; Fernández & Comerón, 2001; López Martí et al., 2005), but, unfortunately, in no case a fully reliable spectroscopic classification as BD is available, because either the spectral types were estimated from (narrow-band) photometry and are thus quite uncertain, or the objects are very close to the stellar/sub-stellar boundary. Therefore, all objects discussed here are BD candidates, not bona-fide BDs.
There are eight BD candidates in the field of view of the Chandra image. Three of them (B185839.6-365823, LS-RCrA 2, and ISO CrA 143) are among the X-ray sources detected by wavdetect. For the remaining five BD candidates we have performed a detailed investigation of the corresponding positions in the Chandra image. For each object we defined a source region centered at its optical position with a radius of and a corresponding background region as annulus with inner radius and outer radius . Then we determined the numbers of detected counts in the source and background regions and compared the number of background counts scaled by the corresponding area to the number of counts detected in the source regions. For two objects (B185840.4-370433 and B185831.1-370456) the number of counts in the source region exceeded the number of expected background counts with at least 90% confidence, tentatively indicating the presence of very weak X-ray emission. For the remaining 3 objects, upper limits to their count rates and (if information on extinction was available) also to their X-ray luminosities were determined as described above. The results of this analysis are listed in Table 3.
The X-ray luminosities and fractional X-ray luminosities of the young BD candidates in the CrA star-forming region are similar to those of the low-mass stars, and thus there is no evidence for changes in the magnetic activity around the stellar/substellar boundary. In two of the three objects which yielded enough counts for spectral analysis, the derived plasma temperatures are in the lower range of plasma temperature found for young stars, consistent with previous findings. On the other hand, the BD candidate B185839.6-365823 shows a rather hard spectrum and the fit suggests a very high plasma temperature. Although the S/N of the spectrum is quite low and thus no reliable determination of the spectral parameters is possible, the median photon energy of 3.4 keV already suggests a relatively hard spectrum. We also note that this objects shows strong variability in the long-term lightcurve, so its hard spectrum may be related to X-ray flaring.
4.3 Comparison of the X-ray properties of different object classes
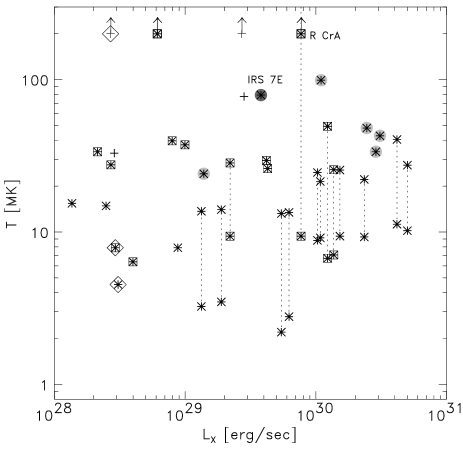
In Fig. 5 we plot the plasma temperatures versus X-ray luminosities for the YSOs in the Coronet cluster. We first consider the derived plasma temperatures, which yield information about the X-ray emission process in the sense that hot ( MK) temperatures require magnetic processes while the expected signature of emission from accretion shocks would be at much cooler ( MK) temperatures. Only two objects show cool plasma components below 3 MK; both are class III objects, i.e. not accreting. For all potentially accreting objects (IR classes 0, I, or II) the lowest plasma temperatures are above 6 MK. We thus conclude that the derived plasma temperatures provide no hint to X-ray emission from accretion shocks.
Next, we compare the plasma temperatures derived for objects in different evolutionary stages. While the source numbers are too low for statistically sound conclusions, the plot reveals that Class II objects tend to show systematically hotter plasma temperatures than class III objects. This effect is also illustrated in the comparison of the spectra for V709 CrA (class III) to S CrA (class II) and 190139.34 (class III) to 190140.40 (class II) in Fig. 3. We note that a similar spectral difference was found by Flaccomio et al. (2006) for the YSOs in the NGC 2264 star-forming region.
Another interesting aspect is that the class I objects in turn tend to show systematically higher plasma temperatures than class II objects. This is especially interesting in the context of the recent debate whether class I and class II objects are truly in different evolutionary stages, or whether the classification is affected by other factors such as the inclination under which the YSO is seen (see discussion in White & Hillenbrand, 2004; Eisner et al., 2005; Doppmann et al., 2005). In addition to the difference in plasma temperatures of class I and II objects, we also note that our long-term lightcurves (see Fig. 2) suggest that the class I objects display stronger levels of variability than class II objects. Similar differences in the plasma temperatures and levels of variability between class I and class II/III objects were found by Imanishi et al. (2001a,b) for the Ophiuchi dark cloud. These differences in the characteristics of the X-ray emission support the notion that class I and class II objects are truly different.
5 Diffuse X-ray emission
Inspection of the Chandra image reveals an excess of counts in a region north of the class I object IRS 7 W and east of R CrA (see Fig.6). The box-shaped region contains 102 counts, whereas the local background, estimated from two nearby source-free regions, should contribute only counts. The excess of 64 counts apparently represents diffuse X-ray emission. Comparing the distribution of photon energies within this region to that in the background regions reveals a statistically significant excess in the keV band.
The available optical and infrared images show no objects or other structures that may be related to this emission. We note that the continuum-subtracted [S II] image presented by Wang et al. (2004) shows a small arc of emission that seems to roughly coincide with the diffuse X-ray emission. However, as there is much stronger and extended [S II] emission to the east of this patch, it is not clear whether the X-ray emission is actually related to this [S II] emission. Furthermore, if the X-ray emission were related to the jets and outflows in this region, one would expect a quite soft X-ray spectrum, with most of the detected photons at energies of keV and not keV as observed.
Another possibility would be that we see (perhaps scattered) X-rays originating from one or several embedded sources in this area. The source of the emission could be IRS 7W, R CrA or perhaps other, extremely deeply embedded protostars. In this context, it is interesting to note that Choi & Tatematsu (2004) found four 6.9 mm sources near IRS 7W, which may be very deeply embedded YSOs (none of them has a counterpart in any of the Spitzer images). Although none of these radio sources coincides with the region of extended X-ray emission, there may be further, still undetected, deeply embedded YSOs in this region, which could be the source of the X-ray emission.
6 Conclusions and Summary
The main results of our very deep X-ray study of the Coronet cluster can be summarized as follows:
The observed X-ray properties of the YSOs in the Coronet region are fully consistent with coronal magnetic activity. We find no indications for X-ray emission from accretion- or jet-shocks: in our X-ray spectral analysis, we find neither significant plasma components at temperatures below MK, nor indications for soft ( keV) excesses for any of the accreting stars. This is consistent with results from other X-ray studies (e.g., Preibisch et al., 2005a; Stassun et al., 2007) showing that the bulk of the observed X-ray emission in most T Tauri stars cannot originate in accretion shocks. However, it has clearly to be noted that this result does not exclude the possibility that accretion shocks may produce some fraction of the X-ray emission in some of the Coronet stars. A relatively weak soft excess in the X-ray spectrum of a star suffering from more than a few magnitudes of visual extinction would hardly be detectable in the data.
The observed tendency that the class I objects exhibit a higher degree of X-ray variability than the older class II and III objects may be a consequence of magnetic reconnection events in the proto(star)-disk magnetic fields, causing frequent strong flares (see, e.g., Montmerle et al., 2000). The apparent differences in the X-ray properties of class I versus class II/III objects supports the assumptions that class I objects are truly in an earlier evolutionary stage. Finally, the high plasma temperatures of the class 0 and class I protostars clearly show that the X-ray emission of these extremely young objects must be dominated by magnetic processes.
The Coronet class I objects with relatively well determined spectroscopic ages as young as 0.1 Myr are clearly detected as X-ray sources. IRS 7E is so far the only case of a reliable X-ray detection of an object in earlier evolutionary stage than class I objects. The X-ray properties of this object are similar to those of the class I objects, showing that hot coronae and thus magnetic activity exist already in extremely young protostellar objects.
Concerning now the origin of the X-ray emission from young intermediate-mass stars, we first show that the X-ray emission from HD 176386 originates not from the Be star, but from a late type companion. Then we demonstrate that the characteristics of the observed X-ray emission from the TY CrA multiple system agree very well with the expected X-ray emission of the three late-type companions; there is no need to assume that the Be star itself emits any X-rays. The case of R CrA remains unclear; its extremely hard X-ray spectrum clearly suggests a magnetic origin of the emission. One or several yet undiscovered and spatially unresolved late-type companions may provide the most straightforward explanation, although even in that case the extraordinarily high plasma temperature is very unusual.
Finally, we point out that none of the numerous HH objects in the CrA star-forming region is detected in the Chandra data despite the very high sensitivity. As X-ray emission at levels similar to those of the X-ray detected HH objects in the other star-forming regions should have been easily detected in our data, this null-result suggests that observable X-ray emission from HH objects is not very frequent.
The further results can be summarized as follows: X-ray emission is detected from about half of the brown dwarf candidates in the observed region. Diffuse X-ray emission is tentatively detected in the central part of the Coronet cluster, but its nature and origin remain unclear.
Acknowledgements.
We are grateful to Lori Allen for providing us with the Spitzer IRAC images of the CrA star-forming region and the classification of the sources prior to publication. We would like to thank Stefan Kraus for help with the Spitzer images. This work made extensive use of NASA’s Astrophysics Data System Bibliographic Services and the SIMBAD database (CDS, Strasbourg, France). This publication makes use of data products from the Two Micron All Sky Survey, which is a joint project of the University of Massachusetts and the Infrared Processing and Analysis Center/California Institute of Technology, funded by the National Aeronautics and Space Administration and the National Science Foundation.References
- Acke & van den Ancker (2004) Acke, B., & van den Ancker, M. E. 2004, A&A, 426, 151
- Anderson et al. (1997) Anderson, I. M., Harju, J., Knee, L. B. G., & Haikala, L. K. 1997, A&A, 321, 575
- André et al. (1993) André, P., Ward-Thompson, D., & Barsony, M. 1993, ApJ, 406, 122
- Bibo et al. (1992) Bibo, E. A., The, P. S., & Dawanas, D. N. 1992, A&A, 260, 293
- Brandt et al. (2001) Brandt, W. N., et al. 2001, AJ, 122, 2810
- Calvet & Gullbring (1998) Calvet, N., & Gullbring, E. 1998, ApJ, 509, 802
- Casey et al. (1995) Casey, B. W., Mathieu, R. D., Suntzeff, N. B., & Walter, F. M. 1995, AJ, 109, 2156
- Casey et al. (1998) Casey, B. W., Mathieu, R. D., Vaz, L. P. R., Andersen, J., & Suntzeff, N. B. 1998, AJ, 115, 1617
- Chauvin et al. (2003) Chauvin, G., et al. 2003, A&A, 406, L51
- Chen & Graham (1993) Chen, W. P., & Graham, J. A. 1993, ApJ, 409, 319
- Choi & Tatematsu (2004) Choi, M., & Tatematsu, K. 2004, ApJ, 600, L55
- Corporon et al. (1996) Corporon, P., Lagrange, A. M., & Beust, H. 1996, A&A, 310, 228
- Damiani et al. (1994) Damiani, F., Micela, G., Sciortino, S., & Harnden, F. R. 1994, ApJ, 436, 807
- Doppmann et al. (2005) Doppmann, G. W., Greene, T. P., Covey, K. R., & Lada, C. J. 2005, AJ, 130, 1145
- Drake (2005) Drake, J. J. 2005, in Cool Stars, Stellar Systems and the Sun: 13th Cambridge Workshop, ed. F. Favata & G. Hussain (ESA-SP; Noordwijk: ESA), p. 519
- Eisner et al. (2005) Eisner, J. A., Hillenbrand, L. A., Carpenter, J. M., & Wolf, S. 2005, ApJ, 635, 396
- Favata et al. (2005) Favata, F., Micela, G., Silva, B., Sciortino, S., & Tsujimoto, M. 2005, A&A, 433, 1047
- Favata et al. (2006) Favata, F., Bonito, R., Micela, G., Fridlund, M., Orlando, S., Sciortino, S., & Peres, G. 2006, A&A, 450, 17
- Feigelson et al. (2005a) Feigelson, E. D., et al. 2005, ApJS, 160, 379
- Feigelson (2005b) Feigelson, E. D. 2005, American Astronomical Society Meeting Abstracts, 207, 1611
- Feigelson et al. (2007) Feigelson, E. D., Townsley, L., Güdel, M., Stassun, K. 2007, Protostars & Planets V, (eds. B. Reipurth, D. Jewitt, and K. Keil, Univ. Arizona Press), p. 313
- Fernández & Comerón (2001) Fernández, M., & Comerón, F. 2001, A&A, 380, 264
- Flaccomio et al. (2006) Flaccomio, E., Micela, G., & Sciortino, S. 2006, A&A, 455, 903
- Forbrich et al. (2006) Forbrich, J., Preibisch, Th., & Menten, K. M. 2006, A&A, 446, 155
- Forbrich et al. (2007) Forbrich, J., Preibisch, Th., Menten, K. M., et al. 2007, A&A, 464, 1003
- Freeman et al. (2002) Freeman, P. E., Kashyap, V., Rosner, R., & Lamb, D. Q. 2002, ApJS, 138, 185
- Garmire & Garmire (2003) Garmire, G. P. & Garmire, A. B. 2003, Astronomische Nachrichten, 324, 153
- Garmire et al. (2003) Garmire, G. P., Bautz, M. W., Ford, P. G., Nousek, J. A., & Ricker, G. R. 2003, Proc. SPIE, 4851, 28
- Gehrels (1986) Gehrels, N. 1986, ApJ, 303, 336
- Getman et al. (2005) Getman, K. V., et al. 2005a, ApJS, 160, 319
- Glassgold et al. (2005) Glassgold, A. E., Feigelson, E. D., Montmerle, T., & Wolk, S. 2005, ASP Conf. Ser. 341: Chondrites and the Protoplanetary Disk, 341, 165
- Grady et al. (1993) Grady, C. A., Perez, M. R., & The, P. S. 1993, A&A, 274, 847
- Groppi et al. (2004) Groppi, C. E., Kulesa, C., Walker, C., & Martin, C. L. 2004, ApJ, 612, 946
- Groppi et al. (2007) Groppi, C. E., Hunter, T. R., Blundell, R., & Sandell, G. 2007, ApJ, in press
- Grosso et al. (1997) Grosso, N., Montmerle, T., Feigelson, E. D., André, P., Casanova, S., & Gregorio-Hetem, J. 1997, Nature, 387, 56
- Grosso et al. (2006) Grosso, N., Feigelson, E. D., Getman, K. V., Kastner, J. H., Bally, J., & McCaughrean, M. J. 2006, A&A, 448, L29
- Güdel et al. (2007a) Güdel, M., et al. 2007, A&A, 468, 353
- Güdel et al. (2007b) Güdel, M., Telleschi, A., Audard, M., L. Skinner, S., Briggs, K. R., Palla, F., & Dougados, C. 2007, A&A, 468, 515
- Günther et al. (2007) Günther, H. M., Schmitt, J. H. M. M., Robrade, J., & Liefke, C. 2007, A&A, 466, 1111
- Hamaguchi et al. (2005a) Hamaguchi, K., Yamauchi, S., & Koyama, K. 2005a, ApJ, 618, 360
- Hamaguchi et al. (2005b) Hamaguchi, K., Corcoran, M. F., Petre, R., et al. 2005b, ApJ, 623, 291
- Harju et al. (2001) Harju, J., Higdon, J. L., Lehtinen, K., & Juvela, M. 2001, in Science with the Atacama Large Millimeter Array, ed. A. Wootten, ASP Conf. Ser., 235, 125
- Imanishi et al. (2001a) Imanishi, K., Koyama, K., & Tsuboi, Y. 2001a, ApJ, 557, 747
- Imanishi et al. (2001b) Imanishi, K., Tsujimoto M., & Koyama K. 2001b, ApJ, 563, 361
- Jardine et al. (2006) Jardine, M., Cameron, A. C., Donati, J.-F., Gregory, S. G., & Wood, K. 2006, MNRAS, 367, 917
- Jeffers et al. (1963) Jeffers, H. M., van Denbos, W. H., & Greeby, F. M. 1963, Publications of the Lick Observatory, Mount Hamilton: University of California, Lick Observatory
- Kastner et al. (2002) Kastner, J. H., Huenemoerder, D. P., Schulz, N. S., Canizares, C. R., & Weintraub, D. A. 2002, ApJ, 567, 434
- Kastner et al. (2006) Kastner, J. H., et al. 2006, ApJ, 648, L43
- Koyama et al. (1996) Koyama, K., Hamaguchi, K., Ueno, S., Kobayashi, N., & Feigelson, E. D. 1996, PASJ, 48, L87
- Kraft et al. (1991) Kraft, R.P., Burrows, D.N., & Nousek, J.A. 1991, ApJ, 374, 344
- Kroupa (2002) Kroupa, P. 2002, Science, Vol. 295, No. 5552, p. 82
- Lada (1987) Lada, C. J. 1987, IAU Symp. 115: star-forming regions, 115, 1
- López Martí et al. (2005) López Martí, B., Eislöffel, J., & Mundt, R. 2005, A&A, 444, 175
- Lyons (1991) Lyons, L. 1991, A practical guide to data analysis for physical science students, Cambridge University Press, Cambridge, p. 26
- McCabe et al. (2006) McCabe, C., Ghez, A. M., Prato, L., Duchêne, G., Fisher, R. S., & Telesco, C. 2006, ApJ, 636, 932
- Megeath et al. (2004) Megeath, S. T., et al. 2004, ApJS, 154, 367
- Montmerle et al. (2000) Montmerle, T., Grosso, N., Tsuboi, Y., Koyama, K. 2000, ApJ, 352, 1097
- Neuhäuser et al. (1999) Neuhäuser, R., et al. 1999, A&A, 343, 883
- Neuhäuser et al. (2000) Neuhäuser, R., et al. 2000, A&AS, 146, 323
- Neuhäuser & Comerón (1998) Neuhäuser, R., & Comerón, F. 1998, Science, 282, 83
- Neuhäuser & Preibisch (1997) Neuhäuser, R., & Preibisch, Th. 1997, A&A, 322, L37
- Neuhäuser & Forbrich (2007) Neuhäuser, R., & Forbrich, J. 2007, in: Handbook of Star Forming Regions, Bo Reipurth (editor), ASP, submitted
- Nisini et al. (2005) Nisini, B., Antoniucci, S., Giannini, T., & Lorenzetti, D. 2005, A&A, 429, 543
- Nutter et al. (2005) Nutter, D. J., Ward-Thompson, D., & André, P. 2005, MNRAS, 357, 975
- Olofsson et al. (1999) Olofsson, G., et al. 1999, A&A, 350, 883
- Palla & Stahler (2001) Palla, F., & Stahler, S. W. 2001, ApJ, 553, 299
- Pravdo et al. (2001) Pravdo, S. H., Feigelson, E. D., Garmire, G., Maeda, Y., Tsuboi, Y., & Bally, J. 2001, Nature, 413, 708
- Pravdo et al. (2004) Pravdo, S. H., Tsuboi, Y., & Maeda, Y. 2004, ApJ, 605, 259
- Prato et al. (2003) Prato, L., Greene, T. P., & Simon, M. 2003, ApJ, 584, 853
- Preibisch (2004) Preibisch, Th. 2004, A&A, 428, 569
- Preibisch & Zinnecker (2001) Preibisch, Th., & Zinnecker H. 2001, AJ, 122, 866
- Preibisch & Zinnecker (2002) Preibisch, Th., & Zinnecker H. 2002, AJ, 123, 1613
- Preibisch & Feigelson (2005) Preibisch, Th., & Feigelson, E.D. 2005, ApJS, 160, 390
- Preibisch et al. (2005a) Preibisch, Th., et al. 2005a, ApJS, 160, 401
- Preibisch et al. (2005b) Preibisch, Th., et al. 2005b, ApJS, 160, 582
- Scalo (1998) Scalo, J. 1998, In: Gilmore G., Howell D. (eds.), The Stellar Initial Mass Function, ASP Conf. Series Vol. 142, p. 201
- Schmitt (1997) Schmitt, J. H. M. M. 1995, A&A, 318, 215
- Schmitt & Liefke (2004) Schmitt, J.H.M.M., & Liefke, C. 2004, A&A, 417, 651
- Schmitt et al. (2005) Schmitt, J. H. M. M., Robrade, J., Ness, J.-U., Favata, F., & Stelzer, B. 2005, A&A, 432, L35
- Siess et al. (2000) Siess, L., Dufour, E., & Forestini, M. 2000, A&A, 358, 593
- Skinner et al. (2004) Skinner, S. L., Güdel, M., Audard, M., & Smith, K. 2004, ApJ, 614, 221
- Skinner et al. (2006) Skinner, S. L., Briggs, K.R., & Güdel, M. 2006, ApJ, 643, 995
- Stassun et al. (2006) Stassun, K. G., van den Berg, M., Feigelson, E., & Flaccomio, E. 2006, ApJ, 649, 914
- Stassun et al. (2007) Stassun, K. G., van den Berg, M., & Feigelson, E. 2007, ApJ, 660, 704
- Stelzer et al. (2005) Stelzer, B., Flaccomio, E., Montmerle, T., Micela, G., Sciortino, S., Favata, F., Preibisch, T., & Feigelson, E. D. 2005, ApJS, 160, 557
- Stelzer et al. (2006) Stelzer, B., Micela, G., Hamaguchi, K., & Schmitt, J. H. M. M. 2006, A&A, 457, 223
- Swartz et al. (2005) Swartz, D. A., Drake, J. J., Elsner, R. F., Ghosh, K. K., Grady, C. A., Wassell, E., Woodgate, B. E., & Kimble, R. A. 2005, ApJ, 628, 811
- Teixeira et al. (2000) Teixeira, R., Ducourant, C., Sartori, M. J., Camargo, J. I. B., Périé, J. P., Lépine, J. R. D., & Benevides-Soares, P. 2000, A&A, 361, 1143
- Telleschi et al. (2007) Telleschi, A., Güdel, M., Briggs, K. R., Audard, M., & Scelsi, L. 2007, A&A, 468, 443
- Telleschi et al. (2007b) Telleschi, A., Güdel, M., Briggs, K. R., Skinner, S. L., Audard, M., & Franciosini, E. 2007, A&A, 468, 541
- Tsuboi et al. (2003) Tsuboi, Y., Maeda, Y., Feigelson, E. D., Garmire, G. P., Chartas, G., Mori, K., & Pravdo, S. H. 2003, ApJ, 587, L51
- Tsujimoto et al. (2005) Tsujimoto, M., Feigelson, E. D., Grosso, N., Micela, G., Tsuboi, Y., Favata, F., Shang, H., & Kastner, J. H. 2005, ApJS, 160, 503
- Turon et al. (1993) Turon, C., et al. 1993, Bulletin d’Information du Centre de Donnees Stellaires, 43, 5
- Walter et al. (1997) Walter, F. M., Vrba, F. J., Wolk, S. J., Mathieu, R. D., & Neuhauser, R. 1997, AJ, 114, 1544
- Wang et al. (2004) Wang, H., Mundt, R., Henning, Th., & Apai, D. 2004, ApJ, 617, 1191
- Weisskopf et al. (2002) Weisskopf, M. C., Brinkman, B., Canizares, C., Garmire, G., Murray, S., & Van Speybroeck, L. P. 2001, PASP, 114, 1
- White & Hillenbrand (2004) White, R. J., & Hillenbrand, L. A. 2004, ApJ, 616, 998
- Wilking et al. (1992) Wilking, B. A., Greene, T. P., Lada, C. J., Meyer, M. R., & Young, E. T. 1992, ApJ, 397, 520
- Wilking et al. (1997) Wilking, B. A., McCaughrean, M. J., Burton, M. G., Giblin, T., Rayner, J. T., & Zinnecker, H. 1997, AJ, 114, 2029
- Wolk et al. (2005) Wolk, S.J., et al. 2005, ApJS, 160, 423
- Zinnecker & Preibisch (1994) Zinnecker, H. & Preibisch, Th. 1994, A&A, 292, 152
Appendix A Detailed source lists
[x]lrrrrrrrrrr
Complete source list with parameters determined by acis_extract for the energy range of 0.5–8 keV, i.e. total counts, median photon energy, source significance, hardness ratios, as well as estimates of the observed flux. Also given are the ratio of the summed exposure map values at the source position relative to the maximum value, i.e., an information on the effective exposure time, and the number of observations in which a source was detected (Nobs). This number can be lower than eight in the outer parts of the map. The manually added source is marked by an asterisk.
Src ID Net Med. Source HR1 HR2 HR3 FLUX1 FLUX2 rel.exp.
counts [keV] signif. [cm-2 s-1] [cm-2 s-1] (Nobs)
\endfirstheadcntd.
Src ID Net Med. Source HR1 HR2 HR3 FLUX1 FLUX2 rel.exp.
counts [keV] signif. [cm-2 s-1] [cm-2 s-1] (Nobs)
\endhead\endfoot190104.58-370129.6 1.3 4.8 1.99E-06 1.94E-06 0.50 (7)
190105.05-370340.2 1.4 3.8 1.41E-05 1.80E-05 0.02 (1)
190108.31-365634.7 2.8 8.5 2.49E-06 3.35E-06 0.68 (7)
190108.60-365721.3 1.8 53.7 7.24E-05 9.55E-05 0.72 (8)
190111.30-365551.9 2.7 4.6 8.96E-07 1.32E-06 0.63 (7)
190114.54-370102.3 2.9 3.3 4.62E-07 8.20E-07 0.59 (7)
190115.32-365237.2 2.8 5.8 2.05E-06 2.54E-06 0.47 (6)
190115.86-370344.3 1.7 28.2 2.87E-05 3.47E-05 0.58 (7)
190116.26-365628.4 1.2 6.4 2.27E-06 1.76E-06 0.80 (8)
190116.65-365638.9 3.5 4.0 6.67E-07 8.26E-07 0.81 (8)
190117.52-365831.9 3.3 5.1 9.85E-07 1.26E-06 0.75 (8)
190118.29-365906.7 2.1 6.0 1.24E-06 1.56E-06 0.79 (8)
190118.90-365828.4 1.4 11.4 3.62E-06 4.43E-06 0.81 (8)
190119.39-370142.0 1.8 8.0 2.01E-06 2.76E-06 0.72 (8)
190120.07-370422.9 3.0 3.9 1.10E-06 1.21E-06 0.57 (7)
190120.86-370302.9 1.1 11.7 7.35E-06 6.24E-06 0.63 (7)
190122.40-370055.4 2.5 4.4 6.57E-07 1.11E-06 0.66 (8)
190123.95-365721.5 3.3 2.8 2.70E-07 4.40E-07 0.81 (8)
190125.61-370453.9 1.1 14.6 1.09E-05 9.58E-06 0.60 (7)
190125.75-365919.3 1.6 44.7 4.40E-05 6.13E-05 0.81 (8)
190126.10-365501.9 2.4 8.4 2.57E-06 2.48E-06 0.85 (8)
190127.15-365908.6 1.0 28.7 3.33E-05 2.61E-05 0.82 (8)
190128.72-365931.9 1.5 59.8 7.52E-05 1.02E-04 0.87 (8)
190129.01-370148.8 1.1 30.1 3.19E-05 2.69E-05 0.85 (8)
190131.28-365931.0 3.0 2.6 2.79E-07 3.43E-07 0.94 (8)
190131.73-365445.4 1.0 1.5 3.36E-07 2.01E-07 0.75 (8)
190132.01-365121.7 3.2 3.6 7.21E-07 7.84E-07 0.72 (8)
190132.34-365803.1 1.6 3.8 3.69E-07 6.28E-07 0.89 (8)
190133.61-370606.2 2.0 3.9 4.78E-07 1.16E-06 0.57 (7)
190133.84-365745.0 2.1 28.0 1.61E-05 2.21E-05 0.94 (8)
190134.65-365438.4 2.6 1.9 3.08E-07 2.25E-07 0.89 (8)
190134.84-370056.7 1.3 158.5 6.03E-04 6.89E-04 0.89 (8)
190135.42-370340.9 1.8 5.2 7.58E-07 1.18E-06 0.84 (8)
190137.07-365601.9 3.8 9.7 3.54E-06 3.37E-06 0.79 (8)
190139.15-365329.6 1.1 86.8 2.19E-04 2.17E-04 0.85 (8)
190139.34-370207.8 1.0 25.6 2.37E-05 1.96E-05 0.90 (8)
190140.40-365142.4 2.6 23.1 1.33E-05 1.70E-05 0.80 (8)
190140.63-365758.9 0.7 0.8 3.35E-07 1.03E-07 0.68 (8)
190140.67-365923.9 3.5 2.7 2.42E-07 3.61E-07 0.90 (8)
190140.70-370052.9 2.8 7.4 1.39E-06 1.84E-06 0.95 (8)
190140.81-365234.0 1.4 143.9 4.87E-04 6.18E-04 0.80 (8)
190141.35-370419.3 1.9 4.1 5.29E-07 8.10E-07 0.85 (8)
190141.49-370441.7 2.1 4.3 4.64E-07 9.07E-07 0.81 (8)
190141.55-365831.6 2.7 54.1 9.61E-05 1.14E-04 0.65 (8)
190141.62-365953.1 1.3 31.2 2.28E-05 2.87E-05 0.89 (8)
190143.12-365020.9 3.2 5.1 9.41E-07 1.44E-06 0.71 (8)
190143.80-370614.0 2.2 11.0 3.81E-06 4.75E-06 0.77 (8)
190144.22-365853.6 2.8 7.6 2.08E-06 2.56E-06 0.69 (8)
190145.91-364929.3 3.5 9.4 3.82E-06 4.45E-06 0.58 (7)
190146.18-370241.8 3.0 3.5 5.74E-07 5.83E-07 0.83 (8)
190147.01-365326.9 3.7 3.7 4.84E-07 6.83E-07 0.79 (8)
190148.02-365722.4 3.3 59.0 8.42E-05 9.26E-05 0.97 (8)
190148.46-365714.5 4.1 3.7 4.77E-07 5.43E-07 0.97 (8)
190148.53-370611.2 4.1 5.6 2.44E-06 1.56E-06 0.72 (8)
190148.97-370151.7 2.8 1.9 2.75E-07 2.85E-07 0.68 (8)
190149.35-370028.6 0.9 9.5 5.04E-06 3.11E-06 0.89 (8)
190150.38-365935.3 4.1 2.4 2.80E-07 2.96E-07 0.89 (8)
190150.45-365638.1 2.1 15.1 5.18E-06 6.83E-06 0.95 (8)
190150.66-365809.9 3.1 50.2 8.70E-05 9.74E-05 0.68 (8)
190151.11-365412.5 1.9 6.7 1.04E-06 1.63E-06 0.90 (8)
190152.10-370542.4 3.4 6.8 1.20E-06 1.99E-06 0.79 (8)
190152.20-365809.0 5.1 3.0 5.60E-07 4.86E-07 0.81 (8)
190152.63-365700.2 2.2 14.7 4.99E-06 6.45E-06 0.97 (8)
190153.67-365708.3 3.3 30.3 2.34E-05 2.59E-05 0.95 (8)
190153.92-365228.8 3.5 3.6 6.05E-07 7.05E-07 0.76 (8)
190155.31-365722.0 5.2 14.9 1.00E-05 7.54E-06 0.85 (8)
190155.61-365651.1 4.5 5.4 1.56E-06 1.24E-06 0.80 (8)
190155.76-365727.7 4.4 3.5 7.67E-07 7.15E-07 0.68 (8)
190155.85-365204.3 3.7 18.1 1.14E-05 1.12E-05 0.80 (8)
190156.39-365728.4 4.7 9.4 6.32E-06 5.01E-06 0.55 (8)
190157.46-370311.9 1.4 3.8 4.04E-07 6.64E-07 0.85 (8)
190158.32-370027.5 1.8 3.9 4.48E-07 6.49E-07 0.89 (8)
190158.79-365750.1 1.3 2.7 3.11E-07 5.39E-07 0.63 (7)
190200.11-370222.3 1.0 21.9 2.05E-05 1.47E-05 0.87 (8)
190200.49-365507.2 3.4 4.0 7.74E-07 6.92E-07 0.88 (8)
190201.92-370743.0 1.1 75.7 5.79E-04 4.93E-04 0.20 (2)
190201.94-365400.1 3.4 5.4 1.08E-06 1.18E-06 0.88 (8)
190202.16-365919.1 4.6 2.5 3.65E-07 3.18E-07 0.93 (8)
190203.82-365851.0 4.1 5.3 1.22E-06 1.08E-06 0.92 (8)
190204.22-370420.9 2.3 12.1 4.10E-06 5.40E-06 0.75 (8)
190210.72-370559.2 2.6 5.2 2.67E-06 2.50E-06 0.38 (3)
190211.99-370309.4 1.2 7.5 2.87E-06 2.30E-06 0.76 (8)
190215.00-365232.2 1.8 4.2 1.19E-06 1.48E-06 0.48 (7)
190216.54-365637.8 3.7 3.9 6.36E-07 7.70E-07 0.84 (8)
190219.19-370346.3 3.4 5.8 1.31E-06 1.91E-06 0.66 (8)
190221.22-365013.5 2.7 5.8 4.18E-06 4.32E-06 0.26 (2)
190221.79-365604.2 4.4 6.2 1.94E-06 1.78E-06 0.80 (8)
190222.12-365313.2 1.9 3.1 7.58E-07 1.22E-06 0.39 (3)
190222.13-365541.0 1.3 72.8 1.89E-04 2.25E-04 0.59 (8)
190222.71-365308.5 2.5 3.4 1.26E-06 1.46E-06 0.35 (3)
190227.05-365813.2 1.6 17.6 8.68E-06 1.15E-05 0.71 (8)
190233.07-365821.1∗ 2.2 9.1 8.05E-06 8.62E-06 0.28 (2)
| Source | norm1 | norm2 | DOF | |||||
|---|---|---|---|---|---|---|---|---|
| [1022 cm-2] | [MK] | [MK] | [erg s-1] | |||||
| 190108.60–365721.3 | 0.72 | 6.8 | 49.4 | 0.93 | 64 | |||
| 190115.86–370344.3 | 0.22 | 77.5 | 0.50 | 19 | ||||
| 190118.90–365828.4 | 0.14 | 27.6 | 1.09 | 5 | ||||
| 190119.39–370142.0 | 0.54 | 33.1 | 0.08 | 1 | ||||
| 190120.86–370302.9 | 0 +0.03 | 14.9 | 1.80 | 5 | ||||
| 190125.61–370453.9 | 0.32 | 7.9 | 1.96 | 5 | ||||
| 190125.75–365919.3 | 1.07 | 7.2 | 25.6 | 0.57 | 45 | |||
| 190127.15–365908.6 | 0.04 | 3.4 | 13.8 | 1.22 | 17 | |||
| 190128.72–365931.9 | 0.53 | 8.8 | 24.6 | 0.75 | 78 | |||
| 190129.01–370148.8 | 0.15 | 3.5 | 14.2 | 0.93 | 19 | |||
| 190133.84–365745.0 | 1.63 | 26.1 | 0.57 | 19 | ||||
| 190134.84–370056.7 | 0.137 | 11.3 | 40.6 | 1.39 | 213 | |||
| 190139.15–365329.6 | 0.07 | 9.3 | 21.5 | 1.18 | 99 | |||
| 190139.34–370207.8 | 0.457 | 2.82 | 13.6 | 0.65 | 13 | |||
| 190140.40–365142.4 | 2.34 | 29.5 | 0.65 | 12 | ||||
| 190140.81–365234.0 | 0.357 | 10.2 | 27.6 | 1.13 | 186 | |||
| 190141.55–365831.6[1] | 2.42 | 33.8 | 1.07 | 72 | ||||
| 190141.62–365953.1 | 0.32 | 9.5 | 28.5 | 0.72 | 21 | |||
| 190148.02–365722.4[2] | 3.87 | 42.8 | 0.90 | 84 | ||||
| 190149.35–370028.6 | 0.24 | 4.6 | 1.39 | 3 | ||||
| 190150.45–365638.1 | 1.09 | 37.4 | 0.69 | 5 | ||||
| 190150.66–365809.9[1] | 2.75 | 48.2 | 1.41 | 64 | ||||
| 190152.63–365700.2 | 1.81 | 24.3 | 1.11 | 5 | ||||
| 190155.31–365722.0 | 27.67 | 99.3 | 0.82 | 5 | ||||
| 190155.85–365204.3 | 3.40 | 0.96 | 7 | |||||
| 190156.39–365728.4 | 14.81 | 79.4 | 1.68 | 3 | ||||
| 190200.11–370222.3 | 0.51 | 2.2 | 13.2 | 0.35 | 8 | |||
| 190201.92–370743.0 | 0.005 +0.006 | 9.4 | 22.2 | 1.30 | 87 | |||
| 190211.99–370309.4 | 0.47 | 7.9 | 2.36 | 1 | ||||
| 190222.13–365541.0 | 0.25 | 9.5 | 25.6 | 0.96 | 97 | |||
| 190227.05–365813.2 | 0.16 | 39.7 | 0.71 | 6 | ||||
| 190233.07–365821.1 | 0 +0.10 | 1.87 | 3 |
[1] iron abundance adjusted to fit the 6.7 keV line; [2] fit including flourescent iron line at 6.4 keV