Relationships between the H i 21-cm line strength, Mg ii equivalent width and metallicity in damped Lyman- absorption systems
Abstract
We present the results of a survey for 21-cm absorption in four never previously searched damped Lyman- absorption systems (DLAs) with the Westerbork Synthesis Radio Telescope. The one detection is presented and discussed in Curran et al. (2007b) and here we add our results to other recent studies in order to address the important issues regarding the detection of cold gas, through 21-cm absorption, in DLAs: Although, due to the DLAs identified with spiral galaxies, there is a mix of spin temperature/covering factor ratios at low redshift, two recent high redshift end points (Kanekar et al., 2006; Kanekar et al., 2007) confirm that this ratio does not generally rise much above K over the whole redshift range searched (up to ). That is, if the covering factors of many of these galaxies were a factor of smaller than for the spirals (which span K), then no significant difference in the spin temperatures between these two classes would be required.
Furthermore, although it is difficult to separate the relative contributions of the spin temperature and covering factor, the new results confirm that 21-cm detections tend to occur at low angular diameter distances, where the coverage of a given absorption cross section is maximised. This indicates a dominant contribution by the covering factor. Indeed, the two new high redshift detections occur towards two extremely compact radio sources (), although the one other new detection, which may have an impact parameter in excess of kpc, occurs towards one of the largest radio sources (Curran et al., 2007b).
Finally, we also find an apparent 21-cm line strength–Mg ii equivalent width correlation, which appears to be due to a coupling of the velocity structure between the components that each species traces. That is, the gas seen in 21-cm absorption could be the same as that seen in optical absorption. Combined with the known equivalent width–metallicity relation, this may be manifest as a spin temperature–metallicity anti-correlation, which is non-evolutionary in origin.
keywords:
quasars: absorption lines – cosmology: observations – cosmology: early Universe – galaxies: ISM1 Introduction
Although currently relatively rare111See table 3 of Curran et al. (2006)., redshifted absorption systems lying along the sight-lines to distant quasars are important probes of the early to present day Universe. Of particular interest are damped Lyman- absorption systems (DLAs), which contain at least 80% of the neutral gas mass density in the Universe (Prochaska et al., 2005). DLAs are believed to be the precursors of modern-day galaxies and studies over a range of redshifts are important to establish the link between the early stages of galaxy formation and the galaxies known in detail today. However, despite their importance in the context of galactic evolution, the typical size and structure of DLAs has long been an issue of much controversy, with models ranging from large, rapidly rotating proto-disks (e.g. Prochaska & Wolfe 1997) to small, merging sub-galactic systems (e.g. Haehnelt et al. 1998). Moreover, imaging of DLA host galaxies at (where the galaxy can be distinguished against the point spread function of the background QSO), reveals a mixed bag of spiral, irregular, low surface brightness (LSB) and dwarf galaxies (e.g. Bergeron & Boissé 1991; Le Brun et al. 1997; Chen & Lanzetta 2003; Rao et al. 2003). This variety being confirmed by a blind 21-cm emission survey of local galaxies (Ryan-Weber et al., 2003).
Whatever their morphologies, the high abundance of cold neutral gas in DLAs is expected to provide a reservoir for star formation at high redshift. However, abundances of (the star forming) molecular gas in DLAs are exceedingly low, only being detected in a very few cases (Levshakov & Varshalovich, 1985; Levshakov et al., 2000, 2002; Ge et al., 2001; Ledoux et al., 2002, 2003, 2006; Petitjean et al., 2002, 2006; Lopez & Ellison, 2003; Reimers et al., 2003; Cui et al., 2005; Noterdaeme et al., 2007), which calls into question the ability of DLAs to contribute significant star formation activity to the earlier Universe (Ledoux et al., 2003). Despite this, DLAs exhibit a (weak) evolution of elemental abundance with redshift (Pettini et al., 1995; Lu et al., 1996; Vladilo et al., 2000; Kulkarni & Fall, 2002; Prochaska et al., 2003), which would be expected from the enrichment of the interstellar medium in each galaxy by successive generations of stars. Additionally, for the -bearing DLAs, the molecular fraction also exhibits an anti-correlation with redshift, and the fact that the metallicity evolution is significantly steeper for these DLAs may suggest that these actually constitute a narrower class of objects (or sight-lines) than the general DLA population (Curran et al., 2004). Furthermore, the decrease of molecular fraction with look-back time indicates an evolution in the dust abundance222Note that, at , the general DLA population shows no sign of reddening due to dust (Murphy & Liske, 2004) and that the -bearing DLAs have optical–near-IR colours of only , cf. for the five OH absorbers towards reddened quasars (Curran et al., 2006)., which is also evident through a decrease in the dust depletion factor with redshift in the -bearing DLAs (Murphy et al., 2004).
Where the DLA occults a radio-loud QSO, the 21-cm transition can provide complementary data to that obtained from the ultra-violet Lyman- observations (which are redshifted into the optical band at ). The former transition traces the cold gas, whereas the latter traces all of the neutral gas, thus providing a potential thermometer of the absorber. Provided that the 21-cm and Lyman- absorption arise in the same cloud complexes, the spin temperature, [K], of a homogeneous cloud can be derived from the column density, [], obtained from the Lyman-, via
| (1) |
where is the integrated optical depth of the 21-cm line. However, obtaining the spin temperature from a 21-cm observation is not quite so straightforward, since the observed optical depth of the 21-cm line also depends upon on how effectively the background radio continuum is covered by the absorber. Specifically, , where is the depth of the line relative to the flux density and is the covering factor of the flux by the absorber.
Of the DLAs searched (and published) in 21-cm absorption, there is currently a detection rate of slightly less than %. Most of these occur at , where there is a roughly equal number of non-detections. Chengalur & Kanekar (2000); Kanekar & Chengalur (2001, 2003) attribute this distribution to the low redshift DLAs having a mix of spin temperatures, whereas the high redshift absorbers have exclusively high spin temperatures, resulting in the large number of non-detections at high redshift (none then detected at ). Since all of the DLAs identified as large spirals have low spin temperatures, whereas those identified with LSBs and dwarf galaxies, have higher spin temperatures, Kanekar & Chengalur (2003) conclude that the DLA host population consists mainly of the warmer dwarfs and LSBs at high redshift, which evolves to include a higher proportion of spirals at low redshift. However, there are several caveats regarding this conclusion:
-
1.
Although Kanekar & Chengalur (2003) have undertaken a careful analysis in order to obtain the most likely covering factors, estimating this from the flux of the compact unresolved component to the total flux of the quasar or by examining the quasar’s spectral energy distribution, none of these methods provides any information on the size of the absorbing region.
-
2.
When such information is unavailable, more often than not in the literature the covering factor is usually assumed to have its maximum value of unity (notable exceptions are Brown & Roberts 1973; Wolfe et al. 1981; Briggs & Wolfe 1983; Wolfe et al. 1985; Carilli et al. 1992; Lane et al. 2000; Kanekar & Chengalur 2001, see table 1 of Curran et al. 2005). If in reality , this assumption would have the effect of assigning artificially high spin temperatures to DLAs. In the case of Kanekar & Chengalur (2003), half of the 12 detections have and half , whereas for the non-detections, 10 out of 11 have , the vast majority of which (8) are at (see figure 1 of Curran et al. 2005).
-
3.
If the degeneracy is left intact, there still remains a mix of values at low redshift, with exclusively high values at high redshift (figure 5 of Curran et al. 2005). However, of the non-detections only one morphology is actually known (see Fig. 5), and although, due to their high “spin temperatures”, it is tempting to count these as non-spirals, this is not actually known. In fact. there are no host identifications at .
-
4.
Furthermore, figure 3 Kanekar & Chengalur (2003) suggests that at spin temperatures in DLAs are expected to exceed K, with half of these K, rendering these very difficult to detect. However, since then, 21-cm absorption has been detected at towards 0201+113 (Kanekar et al., 2007) at a spin temperature of K (for ), when this was previously believed to have K (Kanekar & Chengalur, 2003).
Additionally:
-
5.
Curran et al. (2005) find that per cent of the non-detections occult large background ( arc-sec) sources and that 21-cm absorption tends to be detected towards these large sources only when the DLA host has been identified as a spiral.
-
6.
Again, although for the non-detections the morphologies are essentially unknown, lower covering factors, resulting in non-detections at high redshift, would also be consistent with hierarchical galaxy formation scenarios, where compact galaxies at high redshift evolve to include a higher proportion of larger galaxies in the more immediate Universe.
-
7.
Most recently, Curran & Webb (2006) find that all of the absorbers have large DLA-to-QSO angular diameter distance ratios (), whereas the absorbers have a mix of ratios. Thus reproducing the “spin temperature” segregation of Kanekar & Chengalur (2003) through geometrical effects alone. Since the DLAs with low ratios are almost always detected in 21-cm absorption, this and the other points suggest that the covering factor, rather than the spin temperature (which could range from to K, Kanekar & Chengalur 2003), is the important criterion in determining whether 21-cm absorption is detected in a DLA.
We therefore expect 21-cm absorption to be readily detectable in DLAs located along the sight-lines towards compact radio sources. In order to further address this, as well as finding new sources in which to pursue our primary objective, the measurement of cosmological variations in the fundamental constants at large look-back times (e.g. Tzanavaris et al. 2007), we are undertaking a survey for H i 21-cm absorption in the suitably radio-illuminated DLAs yet to be searched: In Section 2 we present the results of the first phase of this survey, observations of both low and high redshift DLAs with the Westerbork Synthesis Radio Telescope (WSRT). In Section 3 we discuss these and the other new results (since Curran et al. 2005) in the context of factors affecting the detectability of 21-cm in DLAs, as well as investigating correlations between the 21-cm line strength, Mg ii equivalent width and metallicity in these absorbers.
2 Observations and Results
2.1 Sample Selection
The DLAs were selected from the Sloan Digital Sky Survey Damped Lyman- Survey Data Release 1 (Prochaska & Herbert-Fort, 2004) and the known systems also occulting radio-loud quasars ( Jy) as yet unsearched (Curran et al., 2002)333Available from http://www.phys.unsw.edu.au/sjc/dla. Of those redshifted into the WSRT’s Ultra High Frequency (UHF) receiver bands, we selected an initial sample which gave a mix of low and high redshifts in order to test the arguments presented above. Since we require deep observations in order to, at the very least, obtain useful limits, each absorber was observed for 12.5 hours, which limited the number of sources to four, although a further two candidate sub-DLAs were also observed along the line-of-sight to 1402+044 (Table 1). With two DLAs each at and , we prioritised according to highest neutral hydrogen column density, the largest background radio flux ( Jy) and the most compact background source size, in order to maximise the covering factor. Unfortunately, this sample, prioritised by the first two criteria, gave a range of values for the radio source size (, see Table 3), none of which are especially compact. However, in order to shed light on the above arguments, DLAs occulting all radio source sizes should be searched. Furthermore, at the time of application, the DLA at towards 1622+238 was believed to be due to a spiral galaxy (Chen et al. 1998, although see Curran et al. 2007b) and the background radio source size of is similar to that of the other spirals detected in 21-cm absorption (Curran et al. 2005 and references therein).
2.2 Observations, Data Reduction and Results
All of the observations were performed in June and July of 2006 with the Westerbork Synthesis Radio Telescope in the Netherlands. To cover the redshifted 21-cm line, the UHF and 92-cm receivers were backed by a band-width of 5 MHz over 2048 channels (dual polarisation), giving channel spacings of 0.85 to 1.9 (for to 2.7). This ensured that the observations not only covered uncertainties in the optical redshifts, but gave a fine enough resolution to avoid resolving out any possibly narrow absorption lines; the full-width half maxima (FWHMs) range from 4 to 53 for the DLAs already detected in 21-cm (see Curran et al. 2005). The two orthogonal polarisations (XX & YY) were used in order to allow the removal of any polarisation dependent radio frequency interference (RFI). Upon the removal of this, the polarisations were combined in order to maximise the signal-to-noise ratio. For all of the observations, the quasars 3C 48, 3C 147 and 3C 286 were used for bandpass and flux calibration. The data were reduced using the miriad interferometry reduction package, with which we extracted a summed spectrum from the emission region of the continuum maps.
2.2.1 0149+336
0149+336 was observed in hour slots on 25 June 2006, with the UHF-low receiver. However, in this band the RFI was severe, particularly in the XX polarisation. Upon flagging this and the worst affected channels out of the YY data, RFI still dominated on each baseline at all time intervals and the remaining data were of too poor a quality to obtain an image (Fig. 1).
2.2.2 0809+483
After realising that 0149+336 was mistakingly observed in 10 second integrations, we switched to the default 60 seconds, making each slot 2.5 hours long, for which 0809+483 and the other remaining sources were observed for 5 slots. 0809+483 (3C 196) was observed on 2 July 2006, with the UHF-high receiver. Severe RFI in this band (783.8 to 788.2 MHz) meant that one of the slots had to be removed completely. Furthermore, for all of the slots, the XX polarisation had to be completely flagged from the baselines involving antenna 3, leaving 76 full and partial (XX or YY) baseline pairs, over a total observing time of 7.5 hours, after the flagging of further time dependent RFI. The source was unresolved by the beam and the final extracted spectrum is shown in Fig. 2.

2.2.3 1402+044
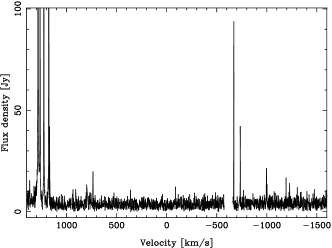
1402+044 was observed on 1 July 2006 with the 92-cm receiver. Although the strongest absorber towards this quasar would exhibit 21-cm absorption at MHz, the central frequency was offset from this (as shown in Fig. 3) in order to also cover the other two absorbers in this band (see Table 1). The observations were RFI free, except the last 2.5 hour slot, which was rejected along with the calibrator used after the run, 3C 48. This left 9.3 hours of good data and the RFI-free observations of 3C 286 were used for the bandpass and flux calibration. Thanks to the low degree of interference in this band, 91 full baseline pairs could be used. The source was unresolved by the beam.

All but one of the features in the extracted spectrum (Fig. 3) were noted to be due to RFI during the reduction process and occurred in one polarisation only. The exception is the “absorption feature” closest to (Fig. 3) and thus the only confirmed DLA (with , Table 1). This feature was present in both polarisations, each of which can be fitted by similar Gaussians, giving & and FWHMs of & for the XX and YY polarisations, respectively. These values agree to less than one channel width and give a redshift of 2.707, cf. the quoted DLA value of (Prochaska & Herbert-Fort, 2004), (Si ii, 1526 Å) and (Al ii, 1670 Å), from the Sloan Digital Sky Survey. However, the fact that the depth of the feature differs significantly between each polarisation ( Jy in XX & Jy in YY), as well as these features also appearing at other locations in the image remote from the continuum source, forces us to conclude that this absorption feature is an artifact.
2.2.4 1622+238
1622+238 (3C 336) was observed on 9–10 July 2006 with the UHF-high receiver. After flagging of time dependent RFI, 12.0 hours of good data remained, although there was some RFI remaining on some baselines, particularly in the XX polarisation. After further flagging, 63 full and partial pairs remained, resulting in a detection (Fig. 4).
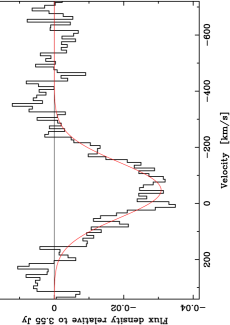
Further details are given in Curran et al. (2007b), where this detection is reported and discussed.
3 Discussion
3.1 These and other recent results
In Table 1 we present our observations and derived results.
| QSO | ID | [MHz] | [Jy] | [mJy] | [] | Ref. | [K] | ||||
|---|---|---|---|---|---|---|---|---|---|---|---|
| 0149+336 | 2.1413 | U | 2.431 | 452.17 | – | – | 1.6 | – | 20.6 | 1,2 | – |
| 0809+483a | 0.80787 | U | 0.871 | 785.68 | 20.5 | 0.93 | 3 | ||||
| 1402+044 | 2.688b | U | 3.215 | 385.14 | 1.12 | 1.9 | – | 2 | – | ||
| … | 2.708 | U | … | 383.07 | … | … | … | … | 20.9 | 4 | |
| … | 2.713b | U | … | 382.55 | … | … | … | … | – | 2 | – |
| 1622+238c | 0.6561 | S | 0.927 | 857.68 | 3.55 | 0 .85 | 0.0088 | 20.4 | 5 | 60 |
In the optically thin regime (), Equation 1 reduces to thus giving a direct measure of the spin temperature of the gas for a known column density and covering factor. However, as recalled in the introduction, in the absence of any direct measurement of the size of the radio absorbing region, this latter value cannot be determined. Therefore in Table 1, we quote our derived results in terms of .
| Reference | No. | [] | [K] | ||
|---|---|---|---|---|---|
| Previous detectionsa | 15 | 0.09–2.04 | 0.64–2.85 | ||
| Kanekar et al. (2006) | 1 | 2.347 | 2.852 | 1500 | |
| Gupta et al. (2007)b | 3 | 1.17–1.37 | 1.37–1.64 | unknown | |
| Kanekar et al. (2007)c | 1 | 3.386 | 3.610 | 1600 | |
| This paper | 1 | 0.6561 | 0.927 | 60 | |
| Previous non-detectionsa | 16 | 0.10–3.18 | 0.31–3.61 | ||
| Gupta et al. (2007)b | 6 | 1.31–1.45 | 1.40–2.17 | unknown | |
| Srianand et al. (2007) | 1 | 1.365 | 2.22 | ||
| This paper | 2 | 0.81–2.71 | 0.87–3.22 |
Notes: aSee Kanekar & Chengalur (2003); Curran et al. (2005) for full details. Note that 0438–436 has now graduated from a non to a detection (Kanekar et al., 2006). bDLA candidates only and so neutral hydrogen column densities are unavailable, hence the upper limits in for the non-detections. Note that the sub-DLA 0237–223 is common to both Gupta et al. (2007) and Srianand et al. (2007). cWe quote the most recent result as this was previously detected by de Bruyn et al. (1996); Briggs et al. (1997).
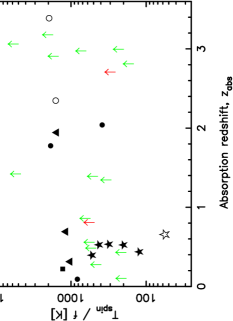
In Fig. 5 we add these and the other recent results to the –redshift distribution of Curran et al. (2005). Like Kanekar & Chengalur (2003), for the detections we see that at low redshift we have a mix of ratios (cf. spin temperatures) and at high redshift exclusively high values, although not segregated to the extent seen in figure 3 of Kanekar & Chengalur (2003). We also see that the low values are dominated by the identified spirals, although by no means does this irrefutably indicate that the lower redshifts do indeed have a mix of spin temperatures: If the larger spirals have larger covering factors than the dwarfs and LSBs, then the spin temperatures of these non-spirals would be correspondingly lower.
As stated, however, in view of the uncertainty in determining the covering factor and spin temperature, we prefer to retain the degeneracy. Through the two new high redshift end points (Kanekar et al., 2006; Kanekar et al., 2007), which nearly double the number of detections at , it appears as though does not increase indefinitely with redshift. This supports our previous hypothesis that 21-cm absorption should be readily detectable towards compact radio sources at (Curran et al., 2005). Since , the ordinate values in Fig. 5 can be considered as the maximum permissible values of , and so the very high spin temperatures at (Kanekar & Chengalur, 2003) are not seen. Ironically, the largest value (10,000 K)444Detected by Kanekar & Chengalur (2001) and using the total neutral hydrogen column density of , obtained from Hubble Space Telescope observations (Rao & Turnshek, 2000). is obtained in one of the lowest redshift DLAs of the sample, at towards 0952+179.
3.2 The detection of 21-cm absorption
3.2.1 Radio source sizes
If generally levels off at high redshift, as suggested by Fig. 5, we reiterate that 21-cm absorption should be readily detectable (especially towards compact radio sources, thus maximising ). In Table 3 we show the sizes of the background continuum sources, as obtained from the highest resolution radio images available, closest in frequency to the redshifted 21-cm values.
| QSO | Study | Reference | ||
| J0108–0037 | G07 | 0.98 | 1.4 | FIRST |
| B0201+113 | K07 | 0.018 | 0.33 | K07 |
| B0438–436 | K06 | 0.039 | 1 & 5 | VLBI/VLA† |
| J0804+3012 | G07 | 0.65,1.4 | G07,NVSS | |
| B1622+238 | C07 | 15.33 | 1.4 | FIRST |
| J2358–1020 | G07 | 0.95 | 1.4 | FIRST |
| J0214+1405 | G07 | 1.4 | NVSS | |
| J0240–2309 | G07 | 1.4,2.3 | NVSS,EVN | |
| J0748+3006 | G07 | 1.93 | 1.4 | FIRST |
| B0809+483 | C07 | 5.27 | 0.4 | VLA/Merlin† |
| J0845+4257 | G07 | 1.06 | 1.4 | FIRST |
| J1017+5356 | G07 | 3.84 | 1.4 | FIRST |
| B1402+044 | C07 | 1.35 | 1.4 | FIRST |
| J1411–0300 | G07 | 0.59,1.4 | G07,FIRST | |
| J1604–0019 | G07 | 0.61,1.4 | G07,FIRST |
References: K06: Kanekar et al. (2006), G07: Gupta et al. (2007), K07: Kanekar et al. (2007), C07: This paper. VLBI: Very Long Baseline Interferometry (†see table 2 of Curran et al. 2005) for details. EVN: (European VLBI Network (Dallacasa et al., 1998), FIRST: The Very Large Array’s “Faint Images of the Radio Sky at Twenty Centimetres”, NVSS: “NRAO VLA Sky Survey”.
From this, we see that the two new high redshift end points (0201+113 & 0438–436) occur towards the most compact background radio sources (which are also compact in comparison to all of the DLAs searched, table 2 of Curran et al. 2005). This may indicate that the spin temperatures in these two DLAs, whose host types are unidentified, are indeed higher than in the low redshift spirals, although still K. However, in the absence of any knowledge of the absorption cross section, this is still inconclusive.
Apart from these two new high redshift examples, the radio source sizes do not reveal much, with a very similar range of values between the detections and non-detections. While the only two significantly smaller radio sources illuminate DLAs detected in 21-cm, so does the largest, although the absorber towards 1622+238 may have an impact parameter kpc (Steidel et al., 1997; Chen et al., 1998). The FWHM of 235 for the 21-cm absorption, which is over four times wider than any other DLA and an order of magnitude wider than the average value, also suggests that this is a very extended absorption system (Curran et al., 2007b). This emphasises the need for knowledge of the size of the absorbing region in relation to the background emission, as the size of the background source by itself gives an incomplete picture of the covering factor.
3.2.2 Angular diameter distance ratios
As discussed in Curran & Webb (2006), a major factor in determining the extent of the absorbing cross section in relation to the background emission is how much closer the absorber is to us than the emitter. At low redshifts (, see figure 3 of Curran & Webb 2006), the absorber/quasar angular diameter distance ratio () follows the (near) linear increase with which we are familiar – move something twice as far and it appears to be half the size. However, beyond , the angular diameter distance begins to decrease and so the absorber and quasar are essentially at the same angular diameter distance for . Therefore the DLA gains no advantage in its coverage by being at a lower redshift than the quasar and in fact, the larger the redshift of the quasar, the more the coverage is decreased.
As seen from Fig. 5, most of the non-detections may simply not have been searched deeply enough555Since the ordinate of Fig. 5 is proportional to , this gives an accurate indication of the limits, although if the FWHM of the any non-detected 21-cm absorption is (Sect. 3.1), the limits would be better than shown. The plot nevertheless gives a truer representation of the limits reached than the spin temperature plots of Chengalur & Kanekar (2000); Kanekar & Chengalur (2001, 2003), where a covering factor is assigned., particularly if the host galaxies are non-spirals. Statistically, however, combining the new with the previous results (Table 2), at the binomial probability of obtaining 11 or more detections out of 13 DLAs at 666 splits the low redshift sample approximately in half and is where the increase in with redshift begins to lose its linearity., with 16 or more non-detections out of 22 DLAs, sub-DLAs and candidates777The possible candidates at and absorbers towards 1402+044 are not included., is 0.03% (cf. 0.06% previously), a significance of assuming Gaussian statistics. This becomes 0.02% when no redshift partition is used ( out of detections at and out of non-detections at ).
3.3 The strength of the 21-cm absorption
3.3.1 Correlation with Mg ii equivalent width
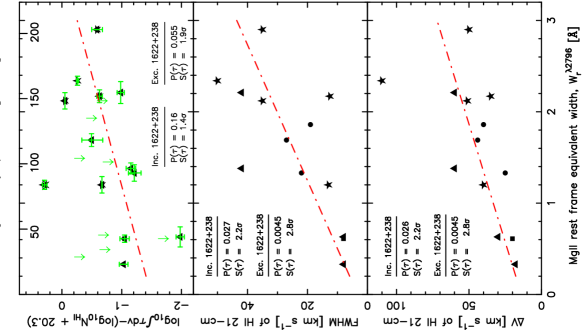
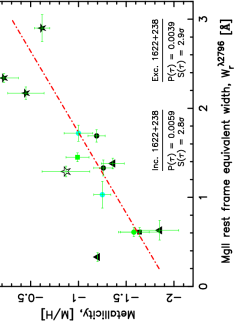
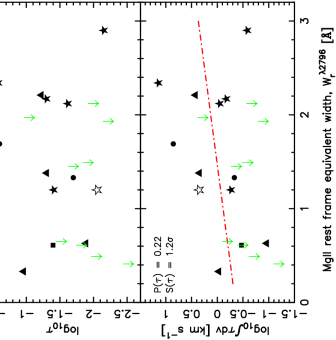
Now that we have recapped the factors which could determine whether 21-cm absorption is detected or not, we turn our attention to what could possibly determine the strength of the absorption, where detected. Curran & Webb (2006) noted that, although the strength of the absorption appears to be correlated with the equivalent width of the Mg ii 2796 Å line, this is not decisive in whether absorption is detected or not: In Fig. 6 (top panel) we see that the non-detections span a similar range of equivalent widths as the detections and that 21-cm absorption is detected down to W Å. Although there is a strong tendency for 21-cm absorption to occur in DLAs originally identified through the Mg ii doublet, Curran & Webb (2006) argue that this is a mere consequence of the Mg ii selection bias towards low redshift absorbers and thus lower angular diameter distance ratios (see their figure 3). Therefore the deciding criteria in regards to detectability may be related to the coverage, as discussed above. Of course, if the fit in Fig. 6 (top) is an accurate indicator, again, the non-detections may not have been searched sufficiently deeply to overcome these low covering factors.
For strong (W Å) Mg ii absorption, characteristic of the DLAs searched in 21-cm, the line is completely saturated and above these equivalent widths the profile traces the number of absorbing components (e.g. Ellison 2006). Therefore the strength of the Mg ii absorption is dominated by the velocity structure. On the other hand, the 21-cm absorption is optically thin, and therefore less susceptible to the same kinematics, although the top panel of Fig. 6 suggests that this may nevertheless by important in determining the strength of the 21-cm profile. In order to verify this, in the lower two panels of Fig. 6 we show the full width half maximum and the total velocity spread () of the 21-cm absorption profiles (obtained from the references given in table 1 of Curran et al. 2005). The fact that the non-parametric correlations are considerably more significant than for the line-strength correlation, suggests that the strength of the 21-cm absorption may indeed be dominated by the velocity structure888A far weaker, non-linear correlation between and W, in a sample of five Mg ii/21-cm absorbers, was previously noted by Lane (2000) [figure 3.5], who interpreted this as the spread of the 21-cm components being related to the Mg ii equivalent width and thus the number of Mg ii velocity components., although the spirals do introduce some scatter, perhaps due to a contribution from the large-scale galactic dynamics. In particular, 1622+238 (FWHM = 235 and ), which is more reminiscent of a large-scale emission profile, rather than the typical pencil beam absorption profile (Curran et al., 2007b).
3.3.2 Correlation with metallicity and implications
In addition to the correlation between the Mg ii and 21-cm profile widths, a relationship between the velocity spreads of low ionisation lines and the metallicity has been well documented: Wolfe & Prochaska (1998) originally noted a tentative correlation in a sample of 17 DLAs, over the redshift range , with a similarly tentative correlation between [Zn/H] and being found in a sample of 72, over the range , by Péroux et al. (2003). From composites of 370 SDSS spectra, Nestor et al. (2003) found higher metallicities in the W Å sample than for W, over both low and high redshift regimes. This was confirmed by Turnshek et al. (2005) with composites from nearly 6000 SDSS spectra and metallicities obtained from Zn, Si, Cr, Fe and Mn abundances. A correlation between the metallicity and velocity spread from individual systems was found by Ledoux et al. (2006), using several low ionisation species (O i, Si ii, Fe ii, Cr ii & S ii), in 70 DLAs and sub-DLAs (with )999A correlation between the metallicity and velocity spread is also found for “true sub-DLAs” ( ) by Meiring et al. (2007). over the redshift range . Like Wolfe & Prochaska (1998) [and Khare et al. 2007; Prochaska et al. 2007], the velocity spread is attributed to the galactic dynamics, indicating that the metallicity traces the mass of the galaxy with which the DLA is associated. However, Bouché et al. (2006) find, from a sample of 1806 Mg ii absorbers with W Å, that the halo mass and equivalent width are anti-correlated, thus leading Murphy et al. (2007) [see Fig. 7] to suggest that the velocity spread may be due to outflows of cold dusty gas, which enrich the gas with metals101010Note also that the abundance of metals appears to be anti-correlated with the neutral hydrogen column density, which when combined with a mass–metallicity relationship, suggests that sub-DLAs arise in more massive galaxies than DLAs, perhaps due a deficit of neutral gas in the central regions of these larger galaxies. This may suggest that it is the sub-DLAs which contribute star forming activity, and thus elemental abundances, to the early Universe (Wolfe & Prochaska, 1998; Khare et al., 2007), perhaps bypassing the inconsistency raised by the low abundance of cold, star forming, molecular gas observed in DLAs (Sect. 1).. Finally, note that although the gas responsible for C iv absorption is not believed to be the same as that evident through singly ionised absorption (Wolfe & Prochaska, 2000), a correlation between the metallicity and C iv velocity spread has also been found (Fox et al., 2007)111111Interestingly, in 40% of the absorbers the C iv gas exceeds the escape velocity, suggesting that the absorption occurs in outflows. Unlike, the outflows of Murphy et al. (2007), however, these consist of photoionised and collisionally excited gas..
Metallicity–velocity spread correlations are therefore common to both DLAs and sub-DLAs in a variety ionisation states. The fact the 21-cm line strength and width are both correlated with the velocity spread of the Mg ii therefore suggests that these should also follow the metallicity:
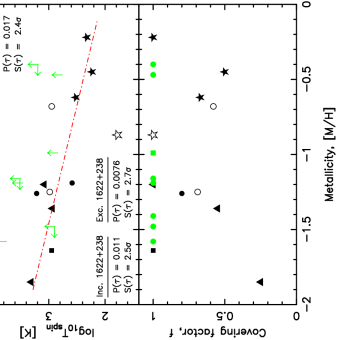
Kanekar & Briggs (2004) state that, due to redshift evolution, there is an anti-correlation between the spin temperature and metallicity in DLAs, where the higher redshift absorbers have lower metallicities, resulting in higher spin temperatures (Chengalur & Kanekar, 2000). Plotting this (Fig. 8), we see that with , the correlation is fairly significant, although treating the non-detections as detections decreases this to . Since all but two of these are located far above the fit, the actual spin temperatures will be larger, further reducing this significance121212Although the two non-detections with upper limits to their metallicities could be located closer to the fit, the metallicities would have to be if taking these limits as the spin temperature values.. The trend is, however, expected on the basis that metals provide radiation pathways (e.g. Wolfire et al. 1995), meaning that a higher metallicity gas is expected to have a higher cooling rate. Furthermore, the metallicity is known to correlated with the molecular hydrogen abundance, which traces cold gas, at high redshift (Curran et al., 2004; Petitjean et al., 2006), further supporting a spin temperature–metallicity anti-correlation. This suggests that, for the detections at least, the covering factor estimates may be reasonable (Fig. 8, bottom panel), although it leads us to reiterate that the very high “spin temperatures” in the non-detections could in fact be due to overestimates in the covering factors of these DLAs.
As discussed previously, since the covering factor can at best be estimated for a very few sources, the spin temperature–covering factor degeneracy is best left intact, thus only utilising the values of known parameters. Plotting this (Fig. 9), we see that
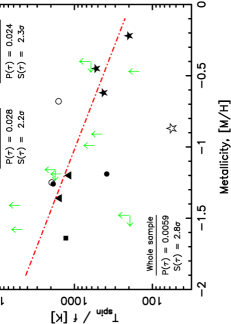
there is more scatter than in the only plot, resulting in a slightly lower significance. However, in this case the non-detections have considerably less scatter and the fit suggests that we may be close to the sensitivities required to detect 21-cm in these DLAs. It should be borne in mind, however, that these are still lower limits, although they are, on the whole, several factors lower than the “spin temperatures” implied by Fig. 8, thus being more consistent with the implied correlation. More to the point, through retaining the degeneracy, only observed measurements are used.
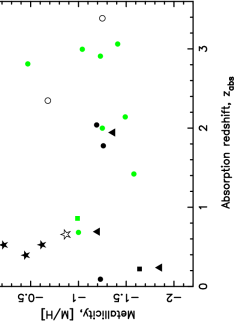
From the enrichment of the interstellar medium by successive generations of stars, a metallicity–redshift anti-correlation is expected. In conjunction with a possible spin temperature–metallicity correlation (Fig. 8), this could explain an increase in the spin temperature with redshift (Kanekar & Chengalur, 2003). However, from the results of Curran et al. (2005); Curran & Webb (2006) and the flattening of at K (Fig. 5), we believe that this may be artificial. In Fig. 10 we show the metallicity–redshift distribution for this sample, which due to the limited dataset, does not exhibit the metallicity–redshift relation, present in much larger (Prochaska et al., 2003) or more homogeneous (Curran et al., 2004) datasets. So, although a spin temperature–metallicity correlation may be expected, we suggest that this is not due to the spin temperature evolving with redshift.
3.3.3 The cause of the correlations
In the optically thin regime, the normalised 21-cm line strength is
| (2) |
where here (Sect. 3.1). Therefore one has to be wary of over-interpreting the spin temperature (as well as the covering factor): According to Equation 2, Fig. 6 (top) exhibits an increase in with the Mg ii rest frame equivalent width, which when combined with the metallicity–equivalent width relation (Fig. 7), would suggest that is correlated with metallicity, giving the anti-correlation between and [M/H] (Fig. 9).
However, is but a measure of the normalised 21-cm line strength (Equation 2), which, as seen from Fig. 6 (middle, bottom), may be a consequence of the kinematics, as is the Mg ii equivalent width. So what we are seeing here is that the velocity structure of the cold neutral atomic gas does share a degree of coupling with that of the singly ionised species131313Such a coupling of the cold atomic and molecular gases towards reddened quasars has also recently been found by Curran et al. (2007a).. This confirms that the neutral and singly ionised gas are spatially coincident, as suggested by the correspondence of their strongest absorption components (Tzanavaris et al., 2007). Therefore, any correlation with the metallicity could well be dominated by the left, rather than right, hand side of Equation 2, more specifically , which, through its tracing of the Mg ii velocity spread will also trace the metallicity. In order to determine which term on the left hand side of the equation is dominating the correlation with W, and thus [M/H], in Fig. 11 (top) we show the optical depth of the 21-cm absorption against the Mg ii rest frame equivalent width and, as noted by Briggs & Wolfe (1983), there appears to be little correlation between these two quantities. It therefore appears that the relationship between the 21-cm line strength and the Mg ii equivalent width (Fig. 6, top), is predominately due to the 21-cm velocity spread (Fig. 6, middle & bottom)141414In fact, including the optical depth on its own actually has a destabilising effect on the correlation; Fig. 11 (bottom) cf. Fig. 6 (middle & bottom), which is somewhat neutralised by normalising this by the column density (Fig. 6, top). Interestingly, although DLAs at arise almost entirely from the Mg ii absorbers with Å, Rao & Turnshek (2000) also find little direct correlation between and ..
This confirms (as shown by the statistics in Fig. 6) that the kinematics of the 21-cm line is the key factor in giving a correlation between the 21-cm line strength and the Mg ii equivalent width, and therefore the metallicity. How this itself ties in with the right hand side of Equation 2 is more complicated, since, as discussed at length above, it is very hard to determine the degeneracy between these two unknowns. For example, a larger covering factor could well be manifest in larger observed velocity spreads of the 21-cm profiles, as seen for the spirals (Fig. 6), particularly 1622+238 (Curran et al., 2007b). Conversely, the spin temperature could be anti-correlated with the velocity spread, although this would be counter-intuitive if the spin temperature is related to the kinetic temperature of the gas, a problem further compounded if the relationship in Fig. 8, rather than Fig. 9, were used. On the other hand, as expected, the spin temperature could indeed be directly anti-correlated with the metallicity (through higher cooling rates), or the covering factor correlated, due to larger covering factors being associated with larger, more evolved galaxies. Either, or both, of these scenarios could explain the relation seen in Fig. 9, although we know that for this sample the ratio between these two parameters shows no significant redshift evolution (Fig. 5).
In light of these various possibilities, once again it is prudent to leave the degeneracies intact and only conclude as far as
| (3) |
where the first and third terms are essentially and , respectively.
4 Summary
We have searched four sight-lines for 21-cm absorption in four DLAs and two candidate sub-DLAs with the Westerbork Synthesis Radio Telescope. This has resulted in one detection and four non-detections, with one observation being lost to severe radio frequency interference at 452 MHz. Adding these to the results from other surveys since Curran et al. (2005), gives a total of six new detections (three in confirmed DLAs) and eleven new non-detections (five in confirmed DLAs). From these and the previous results, we find:
-
1.
There is indeed a mix of spin temperature/covering factor ratios at low redshift, although at these are mostly close to the (typical151515There is one outlier with a significantly larger ratio, K, but at redshift of this definitely does not contribute to an increase in the spin temperature with redshift.) maximum value of K. This levelling off of the spin temperature at high redshift, confirmed by the two new high redshift detections (Kanekar et al., 2006; Kanekar et al., 2007), is consistent with the suggestion by Curran et al. (2005) that the spin temperature does not increase indefinitely with redshift.
-
2.
Occulting extremely compact radio sources (), these two new high redshift detections vindicate the prediction of Curran et al. (2005) that, despite extremely high “spin temperatures”, DLAs should be detectable at high redshift, particularly through the targetting of those located towards compact radio sources. However, the radio sources illuminating the other new (intermediate redshift) detections, are not significantly smaller than those illuminating the non-detections ().
-
3.
The addition of the new search results increases the significance that the 21-detections generally have smaller angular diameter distances than their background quasars, thus maximising the covering factor through line-of-sight geometry (Curran & Webb, 2006). This results in a mix of distance ratios at low redshift, but exclusively high ratios at high redshift, as per the “spin temperature” distribution of Kanekar & Chengalur (2003).
As suggested by Curran & Webb (2006), since DLAs originally identified through the Mg ii doublet generally have lower redshifts (, in the optical bands of ground based telescopes) than those identified through the Lyman- line (), these will usually have low angular diameter distance ratios. This manifests itself as 21-cm absorption being more likely to be detected in Mg ii selected absorbers. This is evident in the fact that, although the 21-cm line strength is correlated with the Mg ii equivalent width, it is not decisive in whether 21-cm absorption is detected or not, with the non-detections spanning a similar range of equivalent widths as the detections. Investigating this and other correlations further, we find:
-
4.
The relationship between the 21-cm line strength and the Mg ii equivalent width (significant at ) is dominated by the velocity width of the 21-cm line, thus indicating a correlation between the 21-cm and Mg ii velocity profiles ().
-
5.
Since the Mg ii equivalent width is also correlated with the metallicity, this would suggest a 21-cm line strength–metallicity relation, which we find at a significance.
-
6.
Such a correlation has previously been suggested, on evolutionary grounds, by Kanekar & Briggs (2004). However, although the metallicity is known to decrease with redshift for larger or more homogeneous samples of DLAs, no metallicity–redshift correlation is seen for this sample, suggesting that this relationship may be non-evolutionary in origin for the 21-cm absorbing DLAs. This is confirmed by our finding that the ratio does not appear to exhibit an overall increase with redshift.
Although the relationships between these various parameters are expected to be complex and intricately interconnected, we suggest since , that the observed 21-cm line strength–metallicity correlation is a consequence of the coupling between the velocity structure of the cold neutral (H i 21-cm) and the singly ionised (Mg ii) gas.
Acknowledgments
We would like to thank the anonymous referee for their very helpful comments, Raffaella Morganti for coordinating the WSRT observations, Michael Murphy for analysing the SDSS spectra of 1402+044,Martin Zwaan, Matthew Whiting and Martin Thompson for their advice. The Westerbork Synthesis Radio Telescope is operated by the ASTRON (Netherlands Foundation for Research in Astronomy) with support from the Netherlands Foundation for Scientific Research NWO. This research has made use of the NASA/IPAC Extragalactic Database (NED) which is operated by the Jet Propulsion Laboratory, California Institute of Technology, under contract with the National Aeronautics and Space Administration. This research has also made use of NASA’s Astrophysics Data System Bibliographic Services.
References
- Akerman et al. (2005) Akerman C. J., Ellison S. L., Pettini M., Steidel C. C., 2005, A&A, 440, 499
- Bergeron & Boissé (1991) Bergeron J., Boissé P., 1991, A&A, 243, 344
- Bouché et al. (2006) Bouché N., Murphy M. T., Péroux C., Csabai I., Wild V., 2006, MNRAS, 371, 495
- Briggs et al. (1997) Briggs F. H., Brinks E., Wolfe A. M., 1997, AJ, 113, 467
- Briggs & Wolfe (1983) Briggs F. H., Wolfe A. M., 1983, ApJ, 268, 76
- Brown & Roberts (1973) Brown R. L., Roberts M. S., 1973, ApJ, 184, L7
- Carilli et al. (1992) Carilli C. L., Perlman E. S., Stocke J. T., 1992, ApJ, 400, L13
- Chen et al. (1998) Chen H., Lanzetta K. M., Webb J. K., Barcons X., 1998, ApJ, 498, 77
- Chen & Lanzetta (2003) Chen H.-W., Lanzetta K. M., 2003, ApJ, 597, 706
- Chengalur & Kanekar (2000) Chengalur J. N., Kanekar N., 2000, MNRAS, 318, 303
- Cui et al. (2005) Cui J., Bechtold J., Ge J., Meyer D. M., 2005, ApJ, 633, 649
- Curran et al. (2007a) Curran S. J., Darling J. K., Bolatto A. D., Whiting M. T., Bignell C., Webb J. K., 2007a, MNRAS, in press (arXiv:0708.1636)
- Curran et al. (2005) Curran S. J., Murphy M. T., Pihlström Y. M., Webb J. K., Purcell C. R., 2005, MNRAS, 356, 1509
- Curran et al. (2007b) Curran S. J., Tzanavaris P., Murphy M. T., Webb J. K., Pihlström Y. M., 2007b, MNRAS, in press (arXiv:0706.2692)
- Curran & Webb (2006) Curran S. J., Webb J. K., 2006, MNRAS, 371, 356
- Curran et al. (2002) Curran S. J., Webb J. K., Murphy M. T., Bandiera R., Corbelli E., Flambaum V. V., 2002, PASA, 19, 455
- Curran et al. (2004) Curran S. J., Webb J. K., Murphy M. T., Carswell R. F., 2004, MNRAS, 351, L24
- Curran et al. (2006) Curran S. J., Whiting M., Murphy M. T., Webb J. K., Longmore S. N., Pihlström Y. M., Athreya R., Blake C., 2006, MNRAS, 371, 431
- Dallacasa et al. (1998) Dallacasa D., Bondi M., Alef W., Mantovani F., 1998, A&AS, 129, 219
- de Bruyn et al. (1996) de Bruyn A. G., O’Dea C. P., Baum S. A., 1996, A&A, 305, 450
- Ellison (2006) Ellison S. L., 2006, MNRAS, 368, 335
- Ellison et al. (2001) Ellison S. L., Pettini M., Steidel C. C., Shapley A. E., 2001, ApJ, 549, 770
- Fox et al. (2007) Fox A. J., Ledoux C., Petitjean P., Srianand R., 2007, A&A, accepted (arXiv:0707.4065)
- Ge et al. (2001) Ge J., Bechtold J., Kulkarni V. P., 2001, ApJ, 547, L1
- Gupta et al. (2007) Gupta N., Srianand R., Petitjean P., Khare P., Saikia D. J., York D. G., 2007, ApJ, 654, L111
- Haehnelt et al. (1998) Haehnelt M. G., Steinmetz M., Rauch M., 1998, ApJ, 495, 647
- Kanekar & Briggs (2004) Kanekar N., Briggs F. H., 2004, Science with the Square Kilometer Array, New Astronomy Reviews. Elsevier, Amsterdam, pp 1259–1270
- Kanekar & Chengalur (2001) Kanekar N., Chengalur J. N., 2001, A&A, 369, 42
- Kanekar & Chengalur (2003) Kanekar N., Chengalur J. N., 2003, A&A, 399, 857
- Kanekar et al. (2007) Kanekar N., Chengalur J. N., Lane W. M., 2007, MNRAS, 375, 1528
- Kanekar et al. (2006) Kanekar N., Subrahmanyan R., Ellison S. L., Lane W., Chengalur J. N., 2006, MNRAS, 370, L46
- Khare et al. (2007) Khare P., Kulkarni V. P., Péroux C., York D. G., Lauroesch J. T., Meiring J. D., 2007, A&A, 464, 487
- Kulkarni & Fall (2002) Kulkarni V. P., Fall S. M., 2002, ApJ, 580, 732
- Lane (2000) Lane W. M., 2000, PhD thesis, University of Groningen
- Lane et al. (2000) Lane W. M., Briggs F. H., Smette A., 2000, ApJ, 532, 146
- Le Brun et al. (1997) Le Brun V., Bergeron J., Boissé P., Deharveng J. M., 1997, A&A, 321, 733
- Le Brun et al. (1998) Le Brun V., Viton M., Milliard B., 1998, A&A, 340, 381
- Ledoux et al. (2006) Ledoux C., Petitjean P., Fynbo J. U., Møller P.and Srianand R., 2006, A&A, 457, 71
- Ledoux et al. (2003) Ledoux C., Petitjean P., Srianand R., 2003, MNRAS, 346, 209
- Ledoux et al. (2006) Ledoux C., Petitjean P., Srianand R., 2006, ApJ, 640, L25
- Ledoux et al. (2002) Ledoux C., Srianand R., Petitjean P., 2002, A&A, 392, 781
- Levshakov et al. (2002) Levshakov S. A., Dessauges-Zavadsky M., D’Odorico S., Molaro P., 2002, ApJ, 565, 696
- Levshakov et al. (2000) Levshakov S. A., Molaro P., Centurión M., D’Odorico S., Bonifacio P., Vladilo G., 2000, A&A, 361, 803
- Levshakov & Varshalovich (1985) Levshakov S. A., Varshalovich D. A., 1985, MNRAS, 212, 517
- Lopez & Ellison (2003) Lopez S., Ellison S. L., 2003, A&A, 403, 573
- Lu et al. (1996) Lu L., Sargent W. L. W., Barlow T. A., Churchill C. W., Vogt S. S., 1996, ApJS, 107, 475
- Meiring et al. (2007) Meiring J. D., Lauroesch J. T., Kulkarni V. P., Péroux C., Khare P., York D. G., Crotts A. P. S., 2007, MNRAS, 376, 557
- Murphy et al. (2004) Murphy M. T., Curran S. J., Webb J. K., 2004, in Duc P.-A., Braine J., Brinks E., eds, Recycling Intergalactic and Interstellar Matter, IAU Symposium No. 217 H2-bearing damped lyman- systems as tracers of cosmological chemical evolution. ASP Conf. Ser., San Francisco, p. 252
- Murphy et al. (2007) Murphy M. T., Curran S. J., Webb J. K., Ménager H., Zych B. J., 2007, MNRAS, 376, 673
- Murphy & Liske (2004) Murphy M. T., Liske J., 2004, MNRAS, 354, L31
- Nestor et al. (2003) Nestor D. B., Rao S. M., Turnshek D. A., Vanden Berk D., 2003, ApJ, 595, L5
- Noterdaeme et al. (2007) Noterdaeme P., Ledoux C., Petitjean P., Petit F. L., Srianand R., Smette A., 2007, A&A, accepted (arXiv:0707.4479)
- Péroux et al. (2003) Péroux C., Dessauges-Zavadsky M., D’Odorico S., Kim T.-S., McMahon R. G., 2003, MNRAS, 345, 480
- Petitjean et al. (2006) Petitjean P., Ledoux C., Noterdaeme P., Srianand R., 2006, A&A, 456, L9
- Petitjean et al. (2002) Petitjean P., Srianand R., Ledoux C., 2002, MNRAS, 332, 383
- Pettini et al. (1995) Pettini M., King D. L., Smith L. J., Hunstead R. W., 1995, in Meylan G., ed., QSO Absorption Lines The Chemical Evolution of Damped Lyman-Alpha Galaxies. Springer-Verlag, Berlin, p. 71
- Prochaska et al. (2007) Prochaska J. X., Chen H.-W., Wolfe A. M., Dessauges-Zavadsky M., Bloom J. S., 2007, ApJ, submitted (astro-ph/0703701)
- Prochaska et al. (2003) Prochaska J. X., Gawiser E., Wolfe A. M., Castro S., Djorgovski S. G., 2003, ApJ, 595, L9
- Prochaska & Herbert-Fort (2004) Prochaska J. X., Herbert-Fort S., 2004, PASP, 116, 622
- Prochaska et al. (2005) Prochaska J. X., Herbert-Fort S., Wolfe A. M., 2005, ApJ, 635, 123
- Prochaska & Wolfe (1997) Prochaska J. X., Wolfe A. M., 1997, ApJ, 487, 73
- Rao et al. (2003) Rao S., Nestor D. B., Turnshek D., Lane W. M., Monier E. M., Bergeron J., 2003, ApJ, 595, 94
- Rao & Turnshek (2000) Rao S. M., Turnshek D. A., 2000, ApJS, 130, 1
- Reimers et al. (2003) Reimers D., Baade R., Quast R., Levshakov S. A., 2003, A&A, 410, 785
- Ryan-Weber et al. (2003) Ryan-Weber E. V., Webster R. L., Staveley-Smith L., 2003, MNRAS, 343, 1195
- Srianand et al. (2007) Srianand R., Gupta N., Petitjean P., 2007, MNRAS, 375, 584
- Steidel et al. (1997) Steidel C. C., Dickinson M., Meyer D. M., Adelberger K. L., Sembach K. R., 1997, ApJ, 480, 568
- Turnshek et al. (2005) Turnshek D. A., Rao S. M., Nestor D. B., Belfort-Mihalyi M., Quider A., 2005, in Williams P. R., Shu C., Ménard B., eds, Probing Galaxies through Quasar Absorption Lines, Proceedings IAU Colloquium No. 199 (astro-ph/0506701)
- Turnshek et al. (1989) Turnshek D. A., Wolfe A. M., Lanzetta K. M., Briggs F. H., Cohen R. D., Foltz C. B., Smith H. E., Wilkes B. J., 1989, ApJ, 344, 567
- Tzanavaris et al. (2007) Tzanavaris P., Murphy M. T., Webb J. K., Flambaum V. V., Curran S. J., 2007, MNRAS, 374, 634
- Vladilo et al. (2000) Vladilo G., Bonifacio P., Centurión M., Molaro P., 2000, ApJ, 543, 24
- Wolfe et al. (1981) Wolfe A. M., Briggs F. H., Jauncey D. L., 1981, ApJ, 248, 460
- Wolfe et al. (1985) Wolfe A. M., Briggs F. H., Turnshek D. A., Davis M. M., Smith H. E., Cohen R. D., 1985, ApJ, 294, L67
- Wolfe et al. (1995) Wolfe A. M., Lanzetta K. M., Foltz C. B., Chaffee F. H., 1995, ApJ, 454, 698
- Wolfe & Prochaska (1998) Wolfe A. M., Prochaska J. X., 1998, ApJ, 494, L15
- Wolfe & Prochaska (2000) Wolfe A. M., Prochaska J. X., 2000, ApJ, 545, 591
- Wolfe et al. (1986) Wolfe A. M., Turnshek D. A., Smith H. E., Cohen R. D., 1986, ApJS, 61, 249
- Wolfire et al. (1995) Wolfire M. G., Hollenbach D., McKee C. F., Tielens A. G. G. M., Bakes E. L. O., 1995, ApJ, 443, 152