Argon Abundances in the Solar Neighborhood:
Non-LTE Analysis of Orion Association B-type Stars11affiliation: Based on observations obtained with the Apache Point Observatory
3.5-meter telescope, which is owned and operated by the Astrophysical
Research Consortium.
Abstract
Argon abundances have been derived for a sample of B main-sequence stars in the Orion association. The abundance calculations are based on NLTE metal line-blanketed model atmospheres calculated with the NLTE code TLUSTY and an updated and complete argon model atom. We derive an average argon abundance for this young population of A(Ar) = 6.66 0.06. While our result is in excellent agreement with a recent analysis of the Orion nebula, it is significantly higher than the currently recommended solar value which is based on abundance measurements in the solar corona. Moreover, the derived argon abundances in the Orion B stars agree very well with a measurement from a solar impulsive flare during which unmodified solar photospheric material was brought to flare conditions. We therefore argue that the argon abundances obtained independently for both the Orion B stars and the Orion nebula are representative of the disk abundance value in the solar neighborhood. The lower coronal abundance may reflect a depletion related to the FIP effect. We propose a new reference value for the abundance of argon in the solar neighborhood, A(Ar) = 6.63 0.10, corresponding to Ar/O = 0.009 0.002.
1 INTRODUCTION
Establishing the abundance of noble gases in the Sun has been a notoriously complex task, with significant uncertainties still remaining in some cases. These difficulties primarily ensue from the atomic structure of noble gases, in particular their high first ionization potential and the large excitation energies of the excited levels in neutral atoms. Noble gases are therefore in the neutral ground state to a great extent in the solar photosphere and, consequently, no spectral lines of these elements have been identified in the photospheric solar spectrum. Well-established model stellar atmosphere and quantitative spectroscopic techniques therefore cannot be applied to study noble gases in the Sun. Furthermore, these species are volatile. Meteoric studies thus yield only a lower limit of the actual abundance of noble gases in the solar system and, therefore, are of limited usefulness for inferring the solar argon abundance.
While the solar helium abundance can be determined with a great degree of accuracy from helioseismology, abundance studies of heavier noble gases depend on the analysis of coronal lines and in-situ measurements of energetic particles from the solar wind. These techniques have greater uncertainty than photospheric abundance studies which have been applied to many other chemical elements. Moreover, measurements are made relative to a reference element, and they actually yield abundance ratios such as the Ar/O ratio. In a recent compilation of solar abundance works, Asplund et al. (2005) recommend a solar argon abundance, A(Ar).333Abundances are quoted in number densities throughout the paper, in the standard scale where A(H) = 12.0. This value significantly revises downward the earlier standard value (A(Ar), Anders & Grevesse (1989); A(Ar), Lodders (2008)), mostly because of the downward revision of the solar oxygen abundance (Allende Prieto et al., 2001; Asplund et al., 2004).
Because of the shortcomings of solar studies, it appears that abundance measurements in the solar neighborhood may shed more light on the argon abundance at near-solar metallicity. Indeed, this approach is suggested by the similar case of neon, for which recent analyses in B-type stars (Cunha et al., 2006), in the Orion nebula (Esteban et al., 2004), and in the interstellar medium (ISM) toward the Crab nebula (Kaastra et al., 2007), provide very consistent results, Ne/O = 0.260.01, and therefore indicate that the currently adopted solar value, (Ne/O)⊙=0.15, most likely underestimates the actual neon abundance in the solar photosphere and in the solar neighborhood. Defining a reliable set of standard chemical abundances is an essential undertaking, because abundance studies are a common tool used to study physical processes which are revealed by changes in the chemical composition of various astrophysical media, for instance including chemical anomalies in the solar corona, in the ISM (e.g., depletion into grains, ISM ionization), or in stellar photospheres (e.g., mixing of nucleosynthesis products).
The optical spectra of early-type stars reveal a number of unblended, weak Ar II lines. Despite appearing to be the most fitting targets from which to derive the argon abundance in the solar neighborhood, very limited abundance work on argon in early-type stars has been carried out to this day. Keenan et al. (1990) analyzed two Ar II lines in the blue spectrum of 5 bright B-type stars in the field, assuming Local Thermodynamic Equilibrium (LTE), and they derived an argon abundance, A(Ar). Holmgren et al. (1990) supplemented this study with an investigation of the importance of departures from LTE, which were found to be small. The NLTE result (A(Ar)) thus does not differ significantly from the LTE analysis; these NLTE calculations, however, were based upon non-blanketed model atmospheres.
In this paper we report on the results of a new NLTE analysis of a sample of 10 main-sequence B-type stars which are members of the young Orion association. The argon abundances are derived from NLTE line-blanketed model atmosphere calculations. We argue that the argon abundances obtained for this young population may well represent the actual argon content of the solar neighborhood and that the Orion B stars can be used as good proxies to define the argon abundance in the solar photosphere. Sect. 2 briefly presents the new observational material, while the NLTE calculations are detailed in Sect. 3. We discuss our results in Sect. 4, comparing them to other determinations of the argon abundance in different sites. In our conclusions (§5), we propose a new reference value for the argon abundance in the solar neighborhood.
2 OBSERVATIONS AND DATA REDUCTION
The sample under study consists of 10 main-sequence early B-type stars, which have been previously analyzed in our recent work devoted to neon (Cunha et al., 2006). New spectra were obtained on the nights of 2007 January 29/30, February 5/6, and March 2/3, using the ARC echelle spectrograph on the 3.5 m telescope at the Apache Point Observatory. The ARC echelle covers the entire visible spectrum on a single 2048x2048 detector with a resolving power of 35,000. Exposure times for the different targets are listed in Table 1. Because of partly cloudy conditions, some stars were observed repeatedly in order to achieve a signal-to-noise ratio of at least 100 in the co-added spectra.
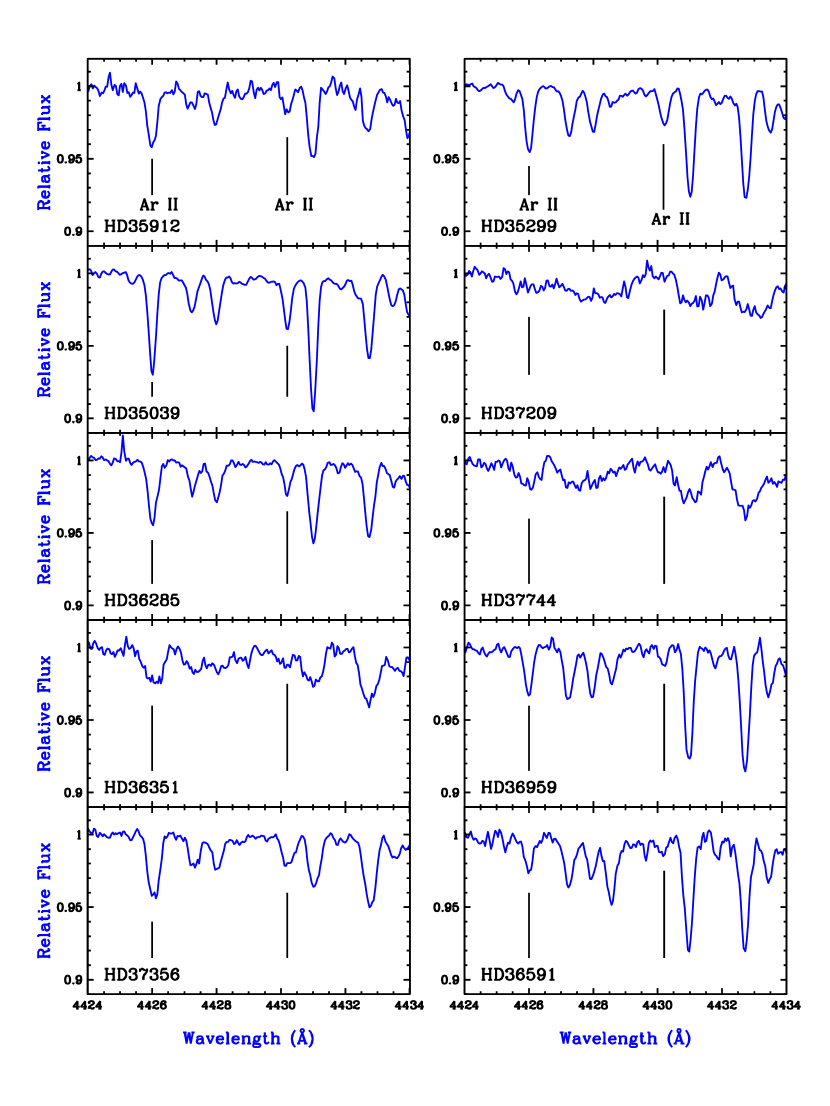
The data were reduced and the spectra extracted following fairly standard procedures. Bias frames and flat field exposures were combined; flat frames included frames with a blue filter to insure a high signal-to-noise ratio across the entire spectrum. Individual orders were extracted from both the flats and the object frames, after subtraction of a relatively small scattered light component. Some care was taken with the extraction parameters because of the relatively narrow width of the orders in the spectrograph. The extracted spectra were flattened using the one dimensional extracted flats. Wavelength calibration was performed with Th-Ar exposures, and applied to the object spectra. Noise spectra were obtained using the known gain and readout noise of the detector. The extracted spectra were coadded when multiple observations were available. Finally, the individual orders were combined, using the noise spectra to properly weight the different orders in regions where there was spectral overlap. Sample spectra of all target stars in the region around 4429 Å are shown in Fig. 1.
3 NON-LTE ABUNDANCE CALCULATIONS
The NLTE calculations have been performed with the NLTE model stellar atmosphere code TLUSTY (Hubeny, 1988; Hubeny & Lanz, 1995).444See http://nova.astro.umd.edu. The TLUSTY model atmospheres assume hydrostatic and radiative equilibria, and incorporate all essential sources of opacity while allowing for departures from LTE. A large grid of NLTE fully line-blanketed model atmospheres of early B-type stars has been made available recently (BSTAR2006; Lanz & Hubeny 2007). The present calculations follow the BSTAR2006 models, but for larger Ne i-ii model atoms (Cunha et al., 2006) and for adding extensive Ar i-iv model atoms (see §3.1) in the NLTE calculations. The NLTE argon calculations thus benefit from an extensive and detailed NLTE treatment of all background opacity sources.
We have adopted for the new models the same stellar parameters of the target stars as Cunha et al. (2006), see Table 3. The stellar parameters were derived by Cunha & Lambert (1992), who provided a detailed discussion about uncertainties. We examine their implications for the argon abundances in §3.2. Like in BSTAR2006, a constant microturbulent velocity of 2 km s-1 was assumed in the NLTE model atmosphere calculations.
NLTE synthetic spectra were then calculated with the spectrum synthesis code SYNSPEC44footnotemark: 4 using the NLTE level populations for all levels included in the TLUSTY models. We have adopted in this step a microturbulent velocity of 5 km s-1 that is typical for early B-type main-sequence stars. We stress, however, that the Ar II lines analyzed in all 10 stars are relatively weak and, therefore, the results are quite insensitive to the microturbulence parameter (see §3.2).
3.1 Argon model atom
The argon model atom consists of 71 levels of Ar I, 54 levels of Ar II, 44 levels of Ar III, 36 levels of Ar IV, plus the ground state of Ar V. Because the level structure of Ar I is better described with intermediate -coupling (similarly to Ne I), the Ar I model atom was constructed to account for fine structure. It includes the lowest 71 fine-structure levels (up to the and levels, cm-1). Experimental energy level data and line oscillator strengths were extracted from the Atomic and Spectroscopic Database at NIST (Martin et al., 1999).555See http://physics.nist.gov/PhysRefData/ASD/index.html. The photoionization cross-sections were taken from the Opacity Project (OP) database Topbase (Cunto et al., 1993).666See http://vizier.u-strasbg.fr/topbase. Since OP calculations assume -coupling, we followed a procedure analogous to the case of Ne I (Seaton, 1998) for relating fine-structure levels to -multiplet levels and thus for assigning the appropriate photoionization cross-section to each level. The collisional excitation rates were considered using the Van Regemorter (1962) formula, including a modification for neutral atoms (as also used by Auer & Mihalas (1973)); for collisional ionization the Seaton formula was used (for a synopsis of expressions, see Hubeny (1988)).
For the Ar ii-iv ions, we closely followed the approach described in Lanz & Hubeny (2003) regarding the treatment and inclusion of atomic data in model atmosphere calculations. In particular, the bulk of the data are taken from Topbase. The level energies were updated with the more accurate experimental values whenever available in the NIST ASD database. For a detailed description of the process of setting up the atomic data, the reader should refer to §4 of Lanz & Hubeny (2003). In particular, we include in each model ions all the energy levels which are in Topbase and below the respective ionization limit, that is, typically up to . The Ar II model atom includes individually the lowest 42 levels up to D ( cm-1). The 206 higher levels are grouped into 12 superlevels, 6 in the doublet and 6 in the quartet systems. The Ar III model atom includes the lowest 27 levels up to Po ( cm-1). The 349 higher levels are grouped into 17 superlevels, 6 in the singlet, 6 in the triplet and 5 in the quintet systems. The Ar IV model atom includes the lowest 22 levels up to D ( cm-1), and the first 3 sextet levels. The 322 higher levels are grouped into 10 superlevels, 5 in the doublet and 5 in the quartet systems. Five excited sextet levels, below the ionization limit, are grouped into an additional superlevel.
3.2 Abundances from selected Argon lines
The optical spectra of early B-type stars contain a number of unblended Ar II lines. The sample of 11 Ar II lines analyzed in this study is presented in Table 2. The Ar II -values for these transitions were extracted from Bennett et al. (1965) via the NIST ASD database. The accuracy assessment of these oscillator strengths by NIST is very high, with 7 values estimated to be as accurate as 3% while the 4 other lines have estimated uncertainties smaller than 10%. The linelist used in computation of the synthetic spectra around each of the Ar II transitions is an update of the Kurucz (1994) linelist and is available from the TLUSTY website.44footnotemark: 4
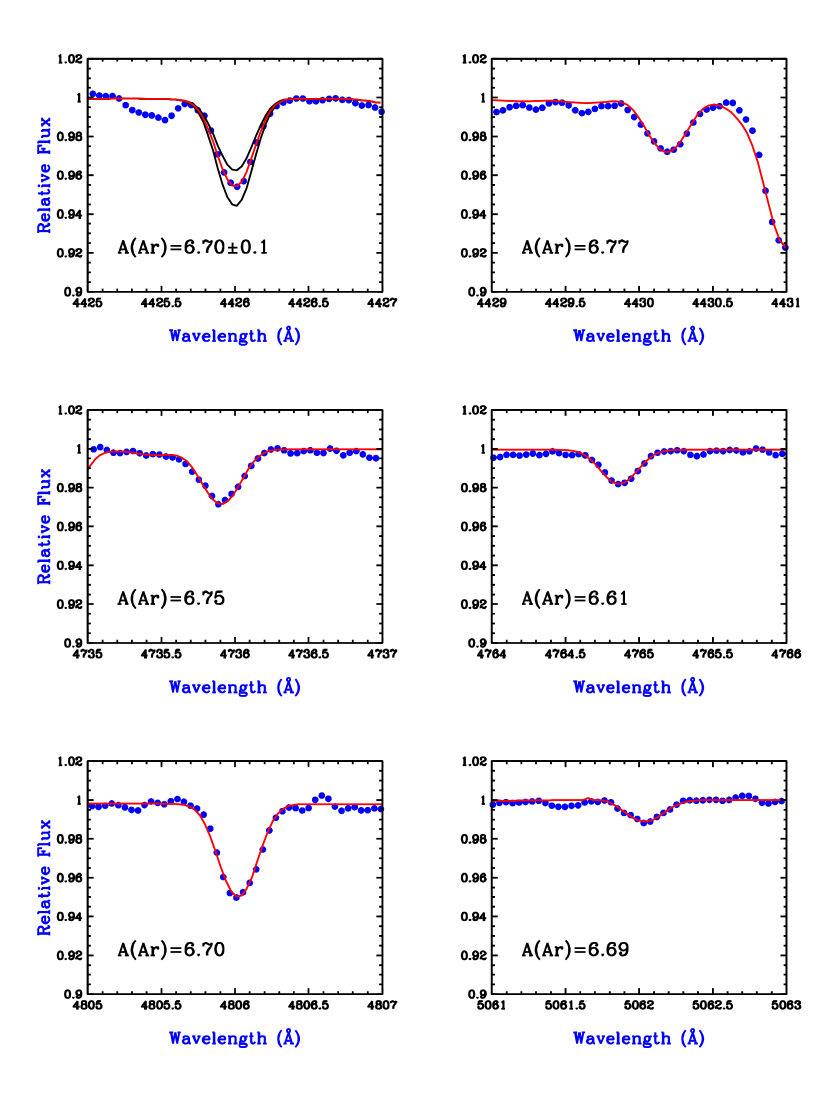
Argon abundances were derived from best fits between synthetic and observed spectra. Sample fits for 6 Ar II lines ( 4426; 4430; 4735; 4764; 4806 and 5062 Å) in the star HD35299 are shown in Fig. 2. The best-fit synthetic profiles for each line were calculated with the argon abundances indicated in the different panels of the figure. The sensitivity of the fits to changes in the argon abundance by 0.1 dex is illustrated for the Ar II4426 line in the top left panel of Fig. 2. The final argon abundances for the target stars are given in Table 3. They are the averages of the abundances derived from the individual Ar II lines. The corresponding standard deviations represent the line-to-line scatter, which may be attributed in part to the remaining uncertainties on the values (up to 0.05 dex). For completeness, we also show in Table 3 the oxygen abundances obtained previously for the target stars, because coronal studies provide the abundance ratio Ar/O. The oxygen abundances are extracted from Cunha & Lambert (1994); see Cunha et al. (2006) for a discussion of consistency checks between these oxygen abundances and TLUSTY. Abundances are listed as number densities in the standard logarithmic scale, where the hydrogen abundance is A(H)=12.
The uncertainties in the derived argon abundances can be evaluated by investigating abundance changes resulting from model atmospheres computed with modified stellar parameters. The error budget in the argon abundances is dominated by the uncertainties in . The adopted effective temperatures are derived from Strömgren photometry; Cunha & Lambert (1994) carefully assessed the uncertainties to = 3 at most. We verified that the adopted values and uncertainties are consistent with temperature-sensitive spectroscopic diagnostics such as the Si III4553, 4568, 4575 lines. These uncertainties translate to an error on the derived abundances, A(Ar)= 0.08 dex. On the other hand, the uncertainty on gravity, log g= 0.1 dex, has a very limited effect on the abundances, A(Ar)= 0.01 dex. The errors due to uncertainties in the adopted microturbulent velocities are small given that the sample Ar II lines are all reasonably weak. A change in microturbulence of 1.5 km/s results in A(Ar)= 0.01 dex. The total error from uncertainties in these stellar parameters is 0.08 dex, using a quadratic error summation.
4 DISCUSSION
The argon abundance cannot be measured in the photospheres of the Sun and of other cool stars. We discuss and compare argon abundances derived in different sites, including the solar corona, in-situ measurements in the solar system, the interstellar medium (ISM), H II regions and planetary nebulae, along with our analysis of early-type stars. The most representative results are discussed in the next sections. This comparison provides for a reliable determination of the abundance of argon in the solar neighborhood, which can then serve as a reference point for further studies. A similar overview of argon abundance determinations has been recently presented by Lodders (2008).
4.1 Argon in early-type stars and departures from LTE
The weighted (as well as straight) average of the NLTE abundances measured in 10 early B stars of the Orion association, and listed in Table 3, is A(Ar). All the Ar II lines give a consistent result, as indicated by the line-to-line scatter for each star which is always smaller than 0.1 dex, and the abundances span a very tight range ( A(Ar) ). The error budget from uncertainties in stellar parameters is 0.08 dex. Furthermore, the available -values are of high accuracy, generally better than 3%. We therefore believe that the accuracy of the derived argon abundance is likely of the order of 0.1 dex or better.
Keenan et al. (1990) carried out an early, but very limited, study of argon in 5 nearby field B-type stars. They observed two Ar II lines (4590, 4658). One star was excluded from the sample because only Ar II4590 was marginally detected. Argon abundances were derived from equivalent widths and LTE model atmospheres. Results from a second star (HR 1350) were also excluded because the derived abundance differed by 0.25 dex relative to the 3 other stars, which was attributed to larger uncertainties in the stellar parameters. They derived an abundance, A(Ar), based on 4 measurements only. Their value is 0.17 dex lower and barely consistent with our results. However, if we retain the abundance derived for HR 1350 that they excluded, and if we correct for small systematic differences in the -values (0.024 and 0.046 dex for 4590, 4658, respectively), we find a better agreement (A(Ar)). The larger scatter seems to be a more likely estimate of the actual uncertainties of their results.
Holmgren et al. (1990) supplemented Keenan et al.’s study and evaluated the importance of departures from LTE. They applied the NLTE line formation codes DETAIL and SURFACE (Giddings, 1981; Butler, 1984) and found that the corrections from LTE are very small. Holmgren et al. derived an argon abundance, A(Ar). However, their NLTE analysis is based on unblanketed NLTE model atmospheres, while Keenan et al. used metal line-blanketed LTE models. Their comparison therefore amalgamates two different effects, namely direct NLTE effects in argon and differences arising from the changes in atmospheric structure between blanketed and unblanketed models.
To ascertain better the extent of departures from LTE in argon, we have repeated our analysis of the target star HD35299 using a Kurucz LTE blanketed model atmosphere and LTE spectrum synthesis. We can then make a direct comparison of two consistent analyses with and without the assumption of LTE, but based on fully line-blanketed model atmospheres in both cases. The LTE abundances obtained for the sample Ar II lines are not significantly different from the NLTE values: (NLTE - LTE) 0.02 0.01 dex, supporting Holmgren et al.’s earlier claim that departures from LTE are small. LTE argon abundances can also be derived using the same NLTE model atmosphere, but only setting argon populations to their LTE values. This second approach may isolate the non-LTE effects in argon since the same model structure is adopted. In this case, our results show that NLTE effects are also small, the NLTE abundances being larger than the LTE values by 0.03 dex. These results therefore support the earlier NLTE study of Holmgren et al. (1990). We stress however the importance of performing extensive NLTE calculations when aiming at determining abundances with accuracies as high as 0.1 dex or better. Indeed, even small corrections to LTE may easily introduce systematic errors of the order of the expected accuracy.
We examine now the reasons why the departures from LTE are small for Ar II lines while quite significant for Ne I lines (Sigut, 1999; Cunha et al., 2006). The top panels of Fig. 3 show that the typical NLTE ionization shift toward higher ionization is limited. Because of the high ionization potentials of neon and argon ions, the ionization thresholds are found in the extreme ultraviolet where B stars have a low flux. In this spectral range, the opacity is dominated by hydrogen and helium. The bound-free transition from the ground states of neon and argon are optically thick and in detailed radiative balance in the region of formation of neon and argon optical lines. Consequently, the contribution of radiative photoionization to departures from LTE remains small. Rather than by a global ionization shift, the line strengths are then better described by the departure coefficients, , where is the population of level and its LTE counterpart. The bottom panels of Fig. 3 show a very different behavior for lines in the Ne I and in the Ar II systems to which the analyzed lines belong. In both cases, the optical lines behave mostly like lines in a 2-level atom because the resonance lines are optically thick at the depth of formation of the optical lines. In the neon case, the (red) lines provide a downward channel, overpopulating the lower levels, thus resulting in stronger absorption and yielding thus lower abundances (Cunha et al., 2006). On the other hand, the Ar+ levels are collisionally coupled to the Ar2+ ground state, as indicated by the fact that all Ar+ levels show similar departure coefficients. In first approximation, the ratio of the line source function to the Planck function behaves like . In the line forming region, our calculations typically give , thus yielding only a small correction to LTE. Finally, the Ne I and Ar II resonance lines are formed in the outermost atmospheric layers, around , where they provide a downward radiative channel, leading to an overpopulation of the ground states and underpopulation of the excited states.
Among hot stars, Werner et al. (2007) have recently reported the identification of Ar VII 1063 in very hot central stars of planetary nebulae and (pre-)white dwarfs. Because of large remaining uncertainties on stellar parameters, and because of processes such as nucleosynthesis and elemental diffusion occurring in late evolutionary stages, their derived argon abundances cannot be used as a reference value. Several stars however show an argon abundance close to the value that we derived for B-type stars, hence supporting the idea that there is no large production of argon in the previous AGB evolution and that argon remains essentially unchanged in these stages.
4.2 Nebular emission abundances
Esteban et al. (2004) derived emission line abundances for several elements in the Orion nebula. In particular, they obtained A(Ar)= 6.62 0.05 when adopting their preferred value for the temperature fluctuation parameter, =0.02. The argon abundance in the Orion nebula derived earlier by Peimbert & Torres-Peimbert (1977) also ranges between A(Ar)=6.6 (with =0) and A(Ar)=6.7 (for =0.35). There is therefore a good indication of a consensus regarding the nebular argon abundance in Orion. Furthermore, the nebular analysis is fully consistent with our results from B stars in the Orion association (A(Ar)= 6.66 0.06), even with the tight uncertainties of the two studies.
Argon abundances can also be derived from planetary nebulae (PNe). Stanghellini et al. (2006) present argon abundances for a large sample of galactic PNe and find an average argon abundance for the round nebulae (representing the lower mass and probably local population) of A(Ar) = 6.11. These argon abundances rely on optical argon lines and are deemed as more uncertain in their study. Pottasch & Bernard-Salas (2006) give a summary of PN abundances from measurements recorded with the Infrared Space Observatory. The Galactic chemical gradient is apparent from their dataset when plotting abundances as a function of galactocentric distances. Therefore, for comparison with the Orion results, we have retained only the PNe which are within 1 kpc from the Sun. The average argon abundance of the 7 PNe satisfying this criterion is A(Ar) = 6.50. The average value is 0.12 – 0.16 dex lower than the results from Orion. However, the scatter is much larger and we cannot conclude that there is a significant difference. The results of our study therefore support Pottasch & Bernard-Salas (2006) conclusion that the argon abundance is essentially the same in young objects (B stars, Orion nebula) and in older PNe in the solar neighborhood.
4.3 ISM absorption studies
Because of its high ionization potential, argon is mostly in the neutral state in the ISM. Argon abundances can be derived from column densities measured from the far-ultraviolet resonance lines, Ar I . Sofia & Jenkins (1998) detected these Ar I lines towards several early-type stars using the interstellar medium absorption profile spectrograph during the first ORFEUS-SPAS shuttle mission in 1993 September. They found deficiencies in Ar I/H I ranging from 0.2 to 0.6 dex, relative to the Ar/H abundance ratio in the Sun and in B stars (Anders & Grevesse, 1989; Keenan et al., 1990). They argued that this result does not provide an indication of argon depletion onto dust grains, but it rather reflects selective argon ionization relative to hydrogen because of the larger Ar I photoionization cross-section.
With the launch of the Far Ultraviolet Spectroscopic Explorer, many more line-of-sights in the ISM have been observed. Lehner et al. (2003) carried out an analysis of 23 line-of-sights toward white dwarfs and derived argon abundances in the local ISM. They confirmed deficiencies of the order of 0.4 dex, as found earlier by Sofia & Jenkins (1998). Moreover, the idea that these deficiencies actually map the local ISM ionization is well supported by an increase of the abundance scatter outside the local Bubble. It is therefore essential to have a good reference value of the local argon abundance for ISM ionization studies, but Ar I column densities are thus of limited use for accurately determining the reference argon abundance in the solar neighborhood.
4.4 Coronal vs. photospheric abundances
The standard solar argon abundance recommended by Asplund et al. (2005), A(Ar)= 6.18 0.08, has been derived from measured abundance ratios in the solar corona and solar energetic particles. However, significant differences in the chemical composition of the solar corona relative to the photosphere were noticed very early on. These differences were found to correlate with the first ionization potential of the studied elements, the so-called “FIP effect”. While there is still no agreed theoretical explanation of the FIP effect, the current general consensus is that elements with lower FIP ( eV) are enhanced in the corona by a factor 4 to 6, while elements with higher FIP ( eV) have essentially photospheric abundances (Favata & Micela, 2003). However, most coronal studies based for instance on Ar XIV (e.g., Young et al., 1997) or on helium-like argon lines observed in X-ray flares (Veck & Parkinson, 1981; Phillips et al., 2003) indicate an argon abundance, typically in a range between A(Ar) , that is lower than in Orion stars and nebula. The Orion results thus support the idea that the solar corona exhibits significant underabundances of the two elements with a high FIP ( eV). However, we cannot define the origin of these underabundances. The FIP effect might either cover a whole range, from overabundances for low FIP elements, to photospheric abundances at intermediate FIP and underabundances for elements with the higest FIP, or different physical processes might be in play and the behavior of low FIP and high FIP elements might be unrelated.
Since the neon and argon emission lines observed in the coronal and chromospheric spectra of the Sun are potentially affected by the FIP effect, Feldman & Widing (2003) argued that it would be much preferable to observe and analyze unmodified photospheric plasma. During a low-altitude impulsive flare, photospheric plasma raised to flare temperature was observed by Skylab (Feldman & Widing, 1990). From the high measured plasma density and a Mg/O abundance ratio similar to the photospheric value, Feldman & Widing established the origin of the emission. They determined the Ar/Mg and Ne/Mg abundance ratios, yielding A(Ar) = 6.57 0.12 and A(Ne) = 8.08 0.10, with A(Mg) = 7.53 from Asplund et al. (2005). These values are in excellent agreement with the argon and neon abundances measured in B stars and in the Orion nebula.
Argon abundances can also be measured in the corona of other cool stars where the FIP effect might not be as prevalent as in the Sun. Maggio et al. (2007) recently reported on a large study of X-ray bright pre-main sequence (PMS) stars in Orion. They derived an average argon abundance of A(Ar) = 6.51. The larger scatter implies that this result remains consistent with the abundance measured in Orion B-type stars and, therefore, does not support an underabundance of argon in the corona of Orion PMS stars similar to the underabundance found in the solar corona.
4.5 In-situ measurements in the Solar system
Argon abundances have also been measured from energetic particles in the solar wind, from lunar soils, and meteorites. Reames (1998) contended that the most comprehensive measurements of element abundances in the solar corona comes from measurements of energetic particles that have been ejected during coronal mass ejections. Because of their origin, we expect however that these abundances to show the FIP effect. Reames (1998) reported an abundance ratio Ar/O = 0.0033 0.0002. Using Asplund et al. (2005) oxygen abundance, this ratio translates to A(Ar) = 6.18 0.03. Cerutti (1974) reported a similarly low Ar/O ratio in lunar soils, yielding A(Ar) = 6.26 0.1. Finally, C1 chondrites reveal strong depletion because of the volatile nature of noble gases. For instance, Asplund et al. (2005) list an argon abundance in meteorites that is 6 to 7 orders of magnitude lower than all other measurements.
4.6 Abundances in the Solar neighborhood
Table 4 summarizes the argon abundances measured in different sites in the Solar system and in the solar neighborhood, using a broad variety of methods. Excluding meteorites, argon abundances span a range of 0.6 dex (a factor of 4), 6.1 A(Ar) . On one hand, solar corona and in-situ measurements in the Solar system yield a low value (6.2 A(Ar) , or A(Ar) = 6.18 as adopted by Asplund et al.). On the other hand, Orion B-type stars and nebula provide a tight agreement with emerging photospheric material during an impulse flare, 6.57 A(Ar) . What is therefore the best value to represent the argon abundance in the Solar system? Can we use Orion stars and nebula as proxies to the Sun in order to determine standard abundances in the solar neighborhood?
Table Argon Abundances in the Solar Neighborhood: Non-LTE Analysis of Orion Association B-type Stars11affiliation: Based on observations obtained with the Apache Point Observatory 3.5-meter telescope, which is owned and operated by the Astrophysical Research Consortium. lists the abundances of light elements in the Sun, Orion B stars, and Orion nebula, showing an excellent agreement for all elements if we adopt Feldman & Widing (2003) values for neon and argon in the solar photosphere. This table has been constructed from representative studies that we view as current state-of-the-art works in different objects, and without intending to review comprehensively all abundance studies in the solar neighborhood (in particular for C, N, and O). We aim at putting the present study in a broader context and discuss its relevance to the Ar solar abundance question. First, we need to emphasize that the agreement between the nebular and the photospheric analyses for all five elements (C, N, O, Ne, and Ar) cannot be fortuitous. It rather demonstrates the degree of reliability that can be achieved today in abundance analyses. We believe that we may thus reasonably claim that the accuracy of these abundances is 0.1 dex or better. Second, the long-standing puzzle regarding the C, N, O abundances in the Sun and in young OB stars appears now to have been resolved. In Anders & Grevesse (1989) reference work, the CNO abundances were higher in the Sun than in OB stars, in an apparent contradiction with the older age of the Sun. Recent studies have now led to revise downward the solar abundances, and Asplund et al. (2005) recommend C, N, O solar abundances that are very close to the values derived for Orion stars and nebula. Therefore, these two arguments provide a robust support to the idea that the composition of Orion’s young material (in stars and in the nebula) is very similar to the solar composition; hence, Orion’s studies may be good proxies to determine the composition in the solar neighborhood, in particular for neon and argon too.
Let us assume on the other hand that the coronal abundances are representative of the standard composition in the Solar system. This assumption thus implies that the chemical enrichment over the last 5 Gyr would have been a factor of 2 for neon, and a factor of 2 to 3 for argon, while C, N, and O remained virtually unchanged. Analyses of PNe do not support such an enrichment of neon and argon over the last few billion years. Within 1 kpc of the Sun, 7 PNe have mean abundances of A(O) = 8.66, A(Ne) = 8.12 and A(Ar) = 6.50 (Pottasch & Bernard-Salas, 2006), in good agreement with Orion’s results (see Table Argon Abundances in the Solar Neighborhood: Non-LTE Analysis of Orion Association B-type Stars11affiliation: Based on observations obtained with the Apache Point Observatory 3.5-meter telescope, which is owned and operated by the Astrophysical Research Consortium.). The 7 PNe reveal however an enrichment in carbon and nitrogen resulting from nucleosynthesis in the late evolution of their parent stars. We therefore conclude that neon and argon do not reveal a strong chemical enrichment in the solar neighborhood during the last few billion years, and that the depletion of neon and argon in the solar corona most likely arise from yet little-understood processes in the corona, such as the FIP effect.
5 CONCLUSIONS
We have completed a new analysis of Ar II lines in the blue spectrum of 10 B main-sequence stars in the Orion association. The analysis involved a fully consistent NLTE treatment based on our NLTE line blanketed model atmospheres. We have derived a mean argon abundance which is in excellent agreement with recent results for the Orion nebula (Esteban et al., 2004). However, the derived abundance is significantly higher (0.45 dex) than the standard solar value recommended in the recent compilation of Asplund et al. (2005). Based on a review of available argon abundance determinations in various sites in the solar neighborhood, we argue that the Orion’s results much more likely represent the abundance of argon (and neon) in the solar neighborhood, while the lower coronal abundances reflect a depletion due to physical processes in the corona such as the FIP effect.
Therefore, we propose to adopt the following values as new reference abundances in the neighborhood of the Sun in the Galactic disk:
A(Ne) = 8.09 0.06
A(Ar) = 6.63 0.10
The argon abundance is in excellent agreement with Lodders (2008) recent work, in which she adopts for the solar system (protosolar) abundance, A(Ar) = 6.57 0.10. These abundances yield the abundance ratios Ne/O = 0.26 and Ar/O = 0.009. We believe that these values should provide valuable reference points for various fields of investigations, from the solar corona to the ionization of the interstellar medium.
References
- Allende Prieto et al. (2001) Allende Prieto, C., Lambert, D. L., & Asplund, M. 2001, ApJ, 556, L63
- Anders & Grevesse (1989) Anders, E. & Grevesse, N. 1989, Geochimica et Cosmochimica Acta, 53, 197
- Asplund et al. (2004) Asplund, M., Grevesse, N., Sauval, A. J., Allende Prieto, C., & Kiselman, D. 2004, A&A, 417, 751
- Asplund et al. (2005) Asplund, M., Grevesse, N., & Sauval, A. J. 2005, in Cosmic Abundances as Records of Stellar Evolution and Nucleosynthesis, Ed. T. G. Barnes III & F. N. Bash, ASP Conf. Ser., 336, 25
- Auer & Mihalas (1973) Auer, L. H., & Mihalas, D. 1973, ApJ, 184, 151
- Bennett et al. (1965) Bennett Jr., W. R., Kindlmann, P. J., & Mercer, G. N. 1965, Appl. Opt., Suppl. 2 of Chemical Lasers, 34.
- Butler (1984) Butler, K. 1984, Ph.D. thesis, University of London
- Cerutti (1974) Cerutti, H. 1974, Ph.D. thesis, University of Bern
- Christensen-Dalsgaard (1998) Christensen-Dalsgaard, J. 1998, Space Sci. Rev., 85, 19
- Cunha & Lambert (1992) Cunha, K., & Lambert, D. L. 1992, ApJ, 399, 586
- Cunha & Lambert (1994) Cunha, K., & Lambert, D. L. 1994, ApJ, 426, 170
- Cunha et al. (2006) Cunha, K., Hubeny, I., & Lanz, T. 2006, ApJ, 647, L143
- Cunto et al. (1993) Cunto, W., Mendoza, C., Ochsenbein, F., & Zeippen, C. J. 1993, A&A, 275, L5
- Esteban et al. (2004) Esteban, C., Peimbert, M., García-Rojas, J., Ruiz, M. T., Peimbert, A., & Rodríguez, M. 2004, MNRAS, 355, 229
- Favata & Micela (2003) Favata, F., & Micela, G. 2003, Space Sci. Rev., 108, 577
- Feldman & Widing (1990) Feldman, U., & Widing, K. G. 1990, ApJ, 363, 292
- Feldman & Widing (2003) Feldman, U., & Widing, K. G. 2003, Space Sci. Rev., 107, 665
- Giddings (1981) Giddings, J. R. 1981, Ph.D. thesis, University of London
- Holmgren et al. (1990) Holmgren, D. E., Brown, P. J. F., Dufton, P. L., & Keenan, F. P. 1990, ApJ, 364, 657
- Hubeny (1988) Hubeny, I. 1988, Comput. Phys. Commun., 52, 103
- Hubeny & Lanz (1995) Hubeny, I., & Lanz, T. 1995, ApJ, 439, 875
- Kaastra et al. (2007) Kaastra, J. S., de Vries, C. P., Constantini, E., & den Herder, J. W. A. 2007, A&A (submitted)
- Keenan et al. (1990) Keenan, F. P., Bates, B., Dufton, P. L., Holmgren, D. E., & Gilheany, S. 1990, ApJ, 348, 322
- Kurucz (1994) Kurucz, R. L. 1994, Atomic Line Data, Kurucz CD-ROM 23 (Cambridge, Mass: SAO)
- Lanz & Hubeny (2003) Lanz, T., & Hubeny, I. 2003, ApJS, 146, 417
- Lanz & Hubeny (2007) Lanz, T., & Hubeny, I. 2007, ApJS, 169, 83
- Lehner et al. (2003) Lehner, N., Jenkins, E. B., Gry, C., Moos, H. W., Chayer, P., & Lacour, S. 1998, ApJ, 595, 858
- Lodders (2008) Lodders, K. 2008, ApJ (in press)
- Maggio et al. (2007) Maggio, A., Flaccomio, E., Favata, F., Micela, G., Sciortino, S., Feigelson, E. D., & Getman, K. V. 2007, ApJ, 660, 1462
- Martin et al. (1999) Martin, W. C., Sugar, J., Musgrove, A., Wiese, W. L., & Fuhr, J. R. 1999, NIST Atomic Spectra Database (Gaithersburg: NIST)
- Peimbert & Torres-Peimbert (1977) Peimbert, M., & Torres-Peimbert, S. 1977, MNRAS, 179, 217
- Phillips et al. (2003) Phillips, K. J. H., Sylwester, J., Sylwester, B., & Landi, E. 2003, ApJ, 589, L113
- Pottasch & Bernard-Salas (2006) Pottasch, S. R., & Bernard-Salas, J. 2006, A&A, 457, 189
- Reames (1998) Reames, D. V. 1998, Space Sci. Rev., 85, 327
- Seaton (1998) Seaton, M. J. 1998, J. Phys. B, 31, 5315
- Sigut (1999) Sigut, T. A. A. 1999, ApJ, 519, 313
- Sofia & Jenkins (1998) Sofia, U. J., & Jenkins, E. B. 1998, ApJ, 499, 951
- Stanghellini et al. (2006) Stanghellini, L., Guerrero, M. A., Cunha, K., Manchado, A., & Villaver, E. 2006, ApJ, 651, 898
- Van Regemorter (1962) Van Regemorter, H. 1962, ApJ, 136, 906
- Veck & Parkinson (1981) Veck, N. J., & Parkinson, J. H. 1981, MNRAS, 197, 41
- Werner et al. (2007) Werner, K., Rauch, T., & Kruk, J. W. 2007, A&A, 466, 317
- Young et al. (1997) Young, P. R., Mason, H. E., Keenan, F. P., & Widing, K. G. 1997, A&A, 323, 243
| Star ID | Spectral Type | UT Date | Exposure times [s] | |
|---|---|---|---|---|
| HD 35039 | B2 IV-V | 4.70 | 2007-01-30 | 2x150 |
| HD 35299 | B1.5 V | 5.68 | 2007-01-30 | 2x300 |
| HD 35912 | B2 V | 6.38 | 2007-02-06 | 720 |
| 2007-03-03 | 2x700 | |||
| HD 36285 | B2 IV-V | 6.32 | 2007-03-03 | 2x600 |
| HD 36351 | B1.5 V | 5.46 | 2007-02-06 | 330 |
| 2007-03-03 | 500, 2x700 | |||
| HD 36591 | B1 IV | 5.33 | 2007-02-06 | 180 |
| HD 36959 | B1 V | 5.67 | 2007-02-06 | 2x270 |
| HD 37209 | B1 V | 5.72 | 2007-02-06 | 360 |
| HD 37356 | B2 IV-V | 6.18 | 2007-03-03 | 2x600 |
| HD 37744 | B1.5 V | 6.20 | 2007-02-06 | 480 |
| Wavelength [Å] | [cm-1] | AccuracyaaEstimated accuracy is better than 3% (A) or better than 10% (B). | |
|---|---|---|---|
| 4426.001 | 135 085.9960 | 0.158 | A |
| 4430.189 | 135 601.7336 | -0.174 | A |
| 4589.898 | 148 620.1411 | 0.100 | A |
| 4657.901 | 138 243.6442 | -0.236 | B |
| 4726.868 | 138 243.6442 | -0.103 | A |
| 4735.906 | 134 241.7392 | -0.108 | A |
| 4764.865 | 139 258.3384 | -0.06 | B |
| 4806.020 | 134 241.7392 | 0.210 | A |
| 4847.810 | 135 085.9960 | -0.223 | B |
| 4879.864 | 138 243.6442 | 0.246 | A |
| 5062.037 | 135 601.7336 | -0.465 | B |
| Star | A(Ar) | A(O) | ||
|---|---|---|---|---|
| HD 35039 | 20550 | 3.74 | 6.62 0.06 | 8.60 |
| HD 35299 | 24000 | 4.25 | 6.70 0.04 | 8.57 |
| HD 35912 | 19590 | 4.20 | 6.66 0.05 | 8.70 |
| HD 36285 | 21930 | 4.40 | 6.59 0.04 | 8.80 |
| HD 36351 | 21950 | 4.15 | 6.59 0.05 | 8.76 |
| HD 36591 | 26330 | 4.20 | 6.73 0.09 | 8.60 |
| HD 36959 | 24890 | 4.40 | 6.67 0.07 | 8.76 |
| HD 37209 | 24050 | 4.15 | 6.63 0.04 | 8.83 |
| HD 37356 | 22370 | 4.15 | 6.76 0.04 | 8.67 |
| HD 37744 | 24480 | 4.40 | 6.65 0.05 | 8.63 |
| A(Ar) | Sites, methods | References |
|---|---|---|
| 6.66 0.06 | B stars; NLTE | This study |
| 6.50 0.05 | B stars; NLTE | Holmgren et al. (1990) |
| 6.54 0.15aaCorrected as discussed in text. | B stars; LTE | Keenan et al. (1990) |
| 6.62 0.05 | Orion nebula, | Esteban et al. (2004) |
| 6.6 – 6.7 | Orion nebula, | Peimbert & Torres-Peimbert (1977) |
| 6.50 | Planetary nebulae, kpc | Pottasch & Bernard-Salas (2006) |
| 6.1 0.2 | ISM, Ar I | Sofia & Jenkins (1998); Lehner et al. (2003) |
| 6.62 0.12 | Low-altitude impulsive flare, Ar/Mg | Feldman & Widing (1990, 2003) |
| 6.45 0.03 | Solar corona, X-ray flares, Ar XVII | Phillips et al. (2003) |
| 6.23 0.1 | Solar corona, Ar XIV | Young et al. (1997) |
| 6.38 | Solar corona, X-ray flares | Veck & Parkinson (1981) |
| 6.51 | PMS stars in Orion, corona, X-rays | Maggio et al. (2007) |
| 6.18 0.03 | Solar energetic particles, Ar/O | Reames (1998) |
| 6.26 0.1 | Lunar soils, Ar/O | Cerutti (1974) |
| Element | Sun | Orion B stars | Orion nebula | PNe ( 1 kpc) | References |
|---|---|---|---|---|---|
| He | 10.98 0.02 | 10.988 0.003 | 2,…, 7, … | ||
| C | 8.39 0.05 | 8.35 0.05 | 8.42 0.02 | 8.65 | 1, 4, 7, 8 |
| N | 7.78 0.06 | 7.78 0.07 | 7.73 0.09 | 8.13 | 1, 4, 7, 8 |
| O | 8.66 0.05 | 8.70 0.09 | 8.65 0.03 | 8.66 | 1, 4, 7, 8 |
| Ne | 8.08 0.10 | 8.11 0.04 | 8.16 0.09 | 8.12 | 3, 5, 7, 8 |
| Ar | 6.57 0.12 | 6.66 0.06 | 6.62 0.05 | 6.50 | 3, 6, 7, 8 |