EROs found behind lensing clusters
Abstract
Aims. We study the properties and nature of extremely red galaxies (ERO, 5.6) found behind two lensing clusters and compare them with other known galaxy populations.
Methods. New HST/ACS observations, Spitzer IRAC and MIPS, and Chandra/ACIS observations of the two lensing clusters Abell 1835 and AC114 contemplate our earlier optical and near-IR observations (Richard et al. 2006) and have been used to study extremely red objects (EROs) in these deep fields.
Results. We have found 6 and 9 EROs in Abell 1835 and AC114. Several (7) of these objects are undetected up to the and/or band, and are hence “optical” drop-out sources. The photometric redshifts of most of our sources (80%) are 0.7–1.5. According to simple colour-colour diagrams the majority of our objects would be classified as hosting old stellar populations (“ellipticals”). However, there are clear signs of dusty starbursts for several among them. These objects correspond to the most extreme ones in colour. We estimate a surface density of (0.970.31) arcmin-2 for EROs with (5.6) at K. Among our 15 EROs 6 (40 %) also classify as distant red galaxies (DRGs). 11 of 13 EROs (85 %) with available IRAC photometry also fulfil the selection criteria for IRAC selected EROs (IEROs) of Yan et al. (2004). SED modelling shows that 36 % of the IEROs in our sample are luminous or ultra-luminous infrared galaxies ((U)LIRG). Some very red DRGs are found to be very dusty starbursts, even (U)LIRGs, as also supported by their mid-IR photometry. No indication for AGNs is found, although faint activity cannot be excluded for all objects. From mid-IR and X-ray data 5 objects are clearly classified as starbursts. The derived properties are quite similar to those of DRGs and IEROs, except for 5 extreme objects in terms of colours, for which a very high extinction () is found.
Key Words.:
Galaxies – high-redshift – evolution– starburst– Cosmology– early Universe– Infrared: galaxies1 Introduction
Since their discovery in the late 1980ies (Elston et al. 1988, 1989), extremely red objects (EROs)
have attracted serious attention.
These first detections were initially presumed to be high-redshift ()
galaxies in a star-forming phase
(Elston et al. 1988). Multi-colour follow-up observations later identified these
objects as luminous galaxies at , dominated by an old stellar population
(Elston et al. 1989). The detection of two bright (K18.4) extended objects
(HR10 & HR14) with () colours near 6.5 by Hu and Ridgway (1994)
highlighted the difficulty in classifying these galaxies. When first discovered,
HR10 and HR14 were interpreted as being ellipticals at . Subsequent
spectroscopic and morphological observations indicated that HR10 is not a quiescent
elliptical galaxy, but rather a bright interacting galaxy at
(Graham & Dey 1996; Stern et al. 2006).
In general there are two main scenarios which would produce a red
enough spectral energy distribution to satisfy the established colour
criteria for EROs (e.g. 5-7, 4-6), either due to an old
passively evolved population or by extreme dust reddening as found in
star bursts (Cowie et al. 1994; Cimatti et al. 1999; Daddi et al. 2002; Georgakakis et al. 2006) in a redshift
range of . A number of review articles discuss
various aspects related to this topic (e.g. McCarthy 2004; Ferguson et al. 2000).
Especially the abundance of massive old ellipticals poses a strong test for
the two competing scenarios of elliptical galaxy formation: early
assembly (2-3), e.g. by monolithic collapse, and passive luminosity
evolution thereafter (PLE models) (Tinsley & Gunn 1976; Pozzetti et al. 1996), or
hierarchical merging of smaller sized objects (White & Rees 1978; Kauffmann et al. 1993; Somerville et al. 2001).
Observational evidence has been found for both scenarios: several
surveys detected a deficit of ellipticals at 1, supporting the
hierarchical merging models (Roche et al. 2003; Kitzbichler & White 2006), while
others are consistent with PLE
(Im et al. 2002; Cimatti et al. 2002; Somerville et al. 2004).
However, in recent years the
hierarchical merging scenario in a CDM universe has been
established as the favoured model. Nevertheless, the vast number of
different renditions leaves room for dramatically different
predictions regarding critical parameters like the number density of
massive galaxies at specific times (Fontana et al. 2004; Treu et al. 2005, and references
therein).
The picture is complicated by the results of numerous morphological
studies on EROs, which assigns a large fraction of EROs to disk
galaxies at somewhat lower redshifts (Yan & Thompson 2003; Gilbank et al. 2003; Moustakas et al. 2004).
In addition, a small fraction of EROs could also be active galactic nuclei (AGNs),
as shown by deep XMM and Chandra data
(Alexander et al. 2002; Roche et al. 2003; Brusa et al. 2005).
With the increasing number of large scale surveys like UKIDSS
(Simpson et al. 2006) and others it became clear that other means than
spectroscopy is needed in order to classify to which of the two major
galaxy populations the large number of EROs belong. These could either
be combinations of
(Pozzetti & Mannucci 2000; Bergström & Wiklind 2004) colours, or the use of near and
mid-infrared bands (Wilson et al. 2004).
Independently of which exact colour criteria has been used, all EROs
have at least one mutual property, their faintness at optical
wavelengths causing limitations to the accuracy of photometric redshift
estimates and other parameters derived from SED features.
In order to increase the apparent brightness of EROs we use the natural magnification effect
provided by massive galaxy clusters. This method has been applied
successfully for the investigation of other faint sources, like Lyman
break galaxies (Pettini et al. 2000; Swinbank et al. 2007), faint SCUBA sources
(Smail et al. 1998; Ivison et al. 2001) and EROs (Smith et al. 2002; Takata et al. 2003).
In the present study we proceed to a systematic selection of EROs in the fields of the two lensing clusters Abell 1835 and AC114, based on observations obtained by Richard et al. (2006) and new ACS/HST, Spitzer, and Chandra observations. These are used to discuss their empirical properties, their nature and to derive physical parameters like photometric redshift, extinction, star formation rates, and stellar population properties. Several of these objects were found earlier in our -band selected sample of optical drop-out objects constructed for the search of high redshift galaxies (see Richard et al. 2006). The ERO subsample from that paper is analysed in detail in Schaerer et al. (2007).
Throughout this paper we adopted the following cosmology: , Ho=70 km s-1Mpc-1 in a flat universe. All magnitudes are given in the Vega system if not stated otherwise.
2 Observations and data reduction
The observations described here are part of multi-colour observations
on two galaxy clusters, AC114 and Abell 1835, which have well known
lensing properties. An
extensive description of the initial observations (optical and
near-infrared data) and the available
data can be found in Richard et al. (2006). Exposure time, limiting
magnitudes and more characteristics can be found in
Tab. LABEL:tab_data.
The near-infrared data ( and ) were obtained with the Infrared Spectrometer
and Array Camera (ISAAC) located on the VLT-UT1 (FOV 2.5 acrmin x 2.5
arcmin with a pixel size of 0.148 arcsec). The optical data for
Abell 1835 () are archive data from the CFHT12k camera at CFHT (Czoske et al. 2003), those for AC114 () were taken from Campusano et al. (2001).
| Filtera | [nm] | [sec] | depth [mag] | [mag] | |||||
| Abell 1835 | AC114 | Abell 1835 | AC114 | Abell 1835 | AC114 | Abell 1835 | AC114 | Abell 1835 | AC114 |
| 365 | 20000 | 29.1 | 0.693 | ||||||
| 443 | 9000 | 29.0 | -0.064 | ||||||
| 543 | 547 | 3750 | 20000 | 28.1 | 28.5 | 0.018 | 0.022 | ||
| 664 | 700 | 5400 | 8300 (400)b | 27.8 | 27.7 (26.1)b | 0.246 | 0.299 | ||
| 817 | 801 | 4500 | 2070 | 26.7 | 26.8 | 0.462 | 0.439 | ||
| 911 | 9110 | 9184 | 27.7 | 27.7 | 0.540 | ||||
| 1070 | 21960 | 26.9 | 0.691 | ||||||
| 1259 | 6480 | 6480 | 25.6 | 25.5 | 0.945 | ||||
| 1656 | 13860 | 12860 | 24.7 | 24.7 | 1.412 | ||||
| 2167 | 18990 | 18990 | 24.7 | 24.3 | 1.871 | ||||
| 3.6 | 3577 | 2400 | 2400 | Jy | 2.790 | ||||
| 4.5 | 4530 | 2400 | 2400 | Jy | 3.249 | ||||
| 5.8 | 5788 | 3600 | 2400 | Jy | 3.737 | ||||
| 8.0 | 8045 | 3600 | 2400 | Jy | 4.392 | ||||
| 24.0 | 23680 | 2700⋆ | 2700⋆ | Jy | |||||
2.1 ACS data
New -band (F850LP, denoted hereafter) imaging was obtained with the
ACS camera onboard HST in November 2004 (AC114) and July 2005 (Abell 1835).
The total observing time for AC114 and Abell 1835 were 9184 and 9110
seconds respectively.
While the AC114 field is centred at the central cluster galaxy, Abell
1835 was observed off centre in order to avoid bright sources north of the
cluster.
For the reduction of both data sets we used the IRAF/Pyraf
package multidrizzle on post-calibrated data 111for
details see http://stsdas.stsci.edu/pydrizzle/multidrizzle.
For the calculation of the 1 detection limit, we applied the
same method as for all other bands (see Richard et al. 2006): measuring the corresponding
standard deviation of the flux in randomly distributed
circular apertures of 1.5 arcsec diameter (approx. 3000). None of the aperture
positions lies within 3 arcsec to its closest neighbour or
sources which have at least a 3 detection.
2.2 IRAC & MIPS data
The 3.6, 4.5, 5.8, and 8.0 m images were obtained using the Infrared Array Camera (IRAC; Fazio et al. 2004) while the 24 m images were obtained using the Multi-band Imaging Photometer for Spitzer (MIPS; Rieke et al. 2004), both on board the Spitzer Space Telescope (Werner et al. 2004). The instruments, data, and reduction procedures are described in Egami et al. (2006).
2.3 Chandra
Both Abell 1835 and AC114 have been observed previously by Chandra. AC114 has been observed once for a total exposure of 75 ksec (OBSID 1562). A comprehensive analysis of the cluster X-ray properties based on this dataset has been published previously in De Filippis et al. (2004). In the case of Abell 1835, two short archival observations are available (OBSIDs 495 and 496) as well as a deep 200 ksec GO observation (OBSIDs 6880, 6881, and 7370) obtained as part of this program. All available data were reprocessed using CIAO 3.2 and the latest calibration files available in CALDB 3.0. Standard screening was applied to all event files to remove bad grades, bad pixels, and background flares. After standard cleaning, the resulting net exposures were 73 and 224 ksec for AC114 and Abell 1835, respectively.
Bright X-ray point sources in the fields of AC114 and Abell 1835 were identified using the CIAO tool wavdetect. No bright X-ray point sources were detected within 5 arcsec of the ERO source positions. To determine flux upper limits, source spectra were extracted in a 2 arcsec radius aperture around each ERO source position. This aperture captures virtually all of the Chandra PSF over the range of relevant off-axis angles. The local background for each source was determined using an annular aperture from 2-4 arcsec surrounding the source aperture. Count-weighted detector response (RMFs) and effective area (ARFs) files were created for each extraction region using the CIAO tools mkacisrmf and mkwarf, including the temporal, spectral, and spatial dependence of the ACIS filter contaminant. For Abel 1835, source spectra and matching background, RMF, and ARF files were produced for each OBSID separately and then fit jointly during the spectral analysis. This analysis is discussed in more detail in Section 3.3. All spectral analysis was done using the ISIS Houck & Denicola (2000) spectral fitting package and the XSPEC model library.
In the case of Abell 1835, spectra from all 5 observations (2 archival datasets and 3 datasets part of our program) were extracted for each source and fit simultaneously. Each dataset was individually reprocessed using CIAO 3.2 and calibration files available in CALDB 3.0.
| ID | a | V F702W F814W SZ J H K 3.6 4.5 5.8 8.0 |
| 305 | (1) |  |
| 319 |  |
|
| 347 |  |
|
| 532 |  |
|
| 676 |  |
|
| 1093 | (2) |  |
| EROs listed in (Richard et al. 2006) and (Schaerer et al. 2007) based on a 1 threshold in the used R-band | ||
| 311 | (17) |  |
| 314 | (11) |  |
| 454 | (10) |  |
| 493 | (3) |  |
| 504 | (4) |  |
| ID | a | V R I J H K 3.6 4.5 5.8 8.0 |
|---|---|---|
| 512 |  |
|
| 572 |  |
|
| 632 |  |
|
| 680 |  |
|
| 707 |  |
|
| 862 |  |
|
| 1006 |  |
|
| 1087 |  |
|
| 1167 | (1) |  |
3 Photometry
3.1 Optical and near-infrared
As our objective is to study EROs we proceed by identifying sources
in the ISAAC -band image using
SEXTRACTOR2.2.2 (Bertin & Arnouts 1996)222This
software is freely available from http://terapix.iap.fr/
and requiring a 3 threshold above the background in at least 4 pixels.
Note that our earlier work on these clusters, including the identification
of optical drop-out EROs, was done on an -band selected sample (Richard et al. 2006).
In contrast to Richard et al. (2006) we use AUTO_MAG instead of aperture photometry,
mainly because some of our
EROs are quite extended and using large enough apertures might induce
additional problems due to the close proximity of other sources. As a
consequence we used the error provided by SEXTRACTOR
and not one based on the S/N characteristics in a fixed aperture
(see Richard et al. 2006). However, comparing the photometric errors for the
EROs already described in Richard et al. (2006), we found no significant
difference between the photometric error based on aperture photometry
or AUTO_MAG. For the SED fitting a minimum photometric error of 0.1 mag
was generally used.
For the astrometry we used standard stars from the ESO-USNO-A2.0
catalogue to obtain correct coordinates (J2000). All coordinates are based on their
position in the -band image.
The photometry in all ISAAC images () was done in the double-image mode of
SEXTRACTOR2.2.2, using the -band image as reference.
For objects which were not detected in a specific band, we substituted the detection
limit for a 3 detection threshold as apparent magnitude.
Using our ERO criterion of we automatically compiled a
catalogue of ERO candidates. The image of each of these candidates was then examined by
eye in order to reject spurious detections, e.g. at the edge of the image or
candidates blended with another source.
This procedure resulted in the identification of 6 EROs in Abell 1835
and 9 in AC114. In Richard et al. (2006) we found 7 and 1 resolved objects with extremely red optical to
near-infrared colours in Abell 1835 and AC114 respectively, which qualified
as ERO. Five of the objects in Abell 1835 cannot be classified as ERO
if we use the 3 detection limit for R-band non-detections. Dismissing the optical drop-out criteria applied in that paper and
using a different photometry (see above) we now
find 4 additional EROs in Abell 1835 and 8 in AC114.
The postage stamps of our objects are shown in Figs. 1 and
2.
As result of the higher spatial resolution of ACS, A1835-#319
appears resolved into two sources.
It remains to be seen, whether or not we are looking at physically distinct
sources, or objects which are gravitational bound. For the adopted cosmology the
projected distance of 0.213 arcsec of the two components of #319 corresponds
to 1.7 kpc, assuming a source redshift of 2.5 as indicated from their SED analysis
(Schaerer et al. 2007).
These estimates are based on the angular
distance without correction for lensing and hence state an upper limit
for the distance between the two components.
| ID | RA | DEC | DRG | IERO | |||||||||
| 3 | 3 | 3 | 3 | 3 | 3 | 3 | 3 | ||||||
| 305 | ( 1) | 14:00:58.264 | 2:50:27.15 | 26.9 | 26.6 | 25.5 | 25.700.07 | 24.440.27 | 22.760.16 | 22.400.08 | 20.740.02 | no | yes |
| 319a | 14:01:06.059 | 2:50:29.53 | 26.9 | 26.6 | 25.5 | 25.670.10 | 22.320.07 | 21.530.09 | 20.640.03 | 19.310.01 | no | yes | |
| 319a | 14:01:06.059 | 2:50:29.53 | 26.9 | 26.6 | 25.5 | 24.720.08 | 22.320.07 | 21.530.09 | 20.640.03 | 19.310.01 | no | yes | |
| 347 | 14:01:06.143 | 2:50:34.24 | 26.9 | 26.590.37 | 23.380.18 | 23.450.02 | 22.520.04 | 21.610.05 | 20.790.02 | 19.670.01 | no | no | |
| 532 | 14:01:02.457 | 2:51:11.36 | 26.9 | 24.950.12 | 22.570.06 | 22.120.01 | 20.820.01 | 19.980.01 | 18.950.00 | 17.970.00 | no | yes | |
| 676 | 14:01:07.781 | 2:51:35.51 | 26.9 | 26.6 | 25.5 | 23.640.05 | 22.200.05 | 21.990.12 | 21.080.04 | 19.940.01 | no | ND | |
| 1093 | ( 2) | 14:00:57.530 | 2:52:49.34 | 26.9 | 26.6 | 25.5 | 26.5 | 24.080.26 | 24.4 | 21.780.06 | 20.450.02 | yes | yes |
| EROs listed in (Richard et al. 2006) and (Schaerer et al. 2007) based on a 1 detection threshold in the used R-band | |||||||||||||
| 311 | (17) | 14:01:04.995 | 2:50:27.73 | 26.9 | 26.6 | 25.5 | 26.5 | 25.7 | 24.4 | 23.510.16 | 22.110.03 | yes | yes |
| 314 | (11) | 14:01:06.163 | 2:50:28.38 | 26.9 | 26.6 | 25.5 | 26.5 | 25.7 | 23.920.36 | 23.490.18 | 21.290.03 | yes | ND |
| 454 | (10) | 14:00:59.876 | 2:50:57.90 | 26.9 | 26.6 | 25.5 | 25.560.11 | 24.000.12 | 23.720.26 | 23.360.13 | 21.670.03 | no | ND |
| 493a | ( 3) | 14:01:01.470 | 2:51:03.93 | 26.9 | 26.6 | 25.5 | 24.060.07 | 23.780.10 | 24.320.47 | 22.550.07 | 21.580.03 | yes | ND |
| 493a | ( 3) | 14:01:01.470 | 2:51:03.93 | 26.9 | 26.6 | 25.5 | 25.310.13 | 23.780.10 | 24.320.47 | 22.550.07 | 21.580.03 | yes | ND |
| 504 | ( 4) | 14:01:01.719 | 2:51:05.56 | 26.9 | 26.6 | 25.5 | 25.480.14 | 24.440.15 | 23.560.18 | 22.900.07 | 21.950.03 | no | no |
a Objects may appear twice because of multiple ACS detections (#319 and #493).
| ID | RA | DEC | DRG | IERO | ||||||||
|---|---|---|---|---|---|---|---|---|---|---|---|---|
| 3 | 3 | 3 | 3 | 3 | 3 | 3 | ||||||
| 512 | 22:58:53.278 | -34:49:02.48 | 27.3 | 26.490.12 | c | 26.310.11 | 23.420.15 | 21.760.03 | 20.88 0.02 | yes | yes | |
| 572 | 22:58:45.761 | -34:48:47.89 | 27.3 | 24.430.02 | 24.060.12 | 22.510.02 | 20.560.02 | 19.420.01 | 18.51 0.00 | no | yes | |
| 632 | 22:58:46.664 | -34:48:31.89 | 27.3 | 23.040.01 | 21.550.03 | 20.570.01 | 18.640.01 | 17.640.00 | 16.75 0.00 | no | no | |
| 680 | 22:58:51.361 | -34:48:26.90 | 27.3 | 26.650.13 | 25.6 | 24.510.07 | 21.900.05 | 20.300.01 | 19.34 0.01 | yes | yes | |
| 707 | 22:58:51.357 | -34:48:18.55 | 27.3 | 24.270.03 | 24.170.15 | 22.360.02 | 20.520.02 | 19.500.01 | 18.60 0.00 | no | no | |
| 862 | 22:58:52.560 | -34:47:56.54 | 27.3 | 25.180.04 | 23.640.09 | 22.660.02 | 20.830.02 | 19.720.01 | 18.69 0.00 | no | yes | |
| 1006 | 22:58:49.014 | -34:47:26.53 | 27.3 | 27.7 | 25.6 | 24.270.04 | 21.190.04 | 20.000.01 | 19.01 0.01 | yes | ND | |
| 1087 | 22:58:51.727 | -34:47:07.85 | 27.3 | 24.9a | 25.50.33 | 23.770.04 | 20.920.03 | 19.630.01 | 18.66 0.00 | yes | yes | |
| 1167 | (1) | 22:58:49.775 | -34:46:55.00 | 27.3 | 24.9b | 25.6 | 24.550.07 | 21.260.04 | 19.750.01 | 18.62 0.00 | yes | yes |
a Since the effective exposure time is lower in this region a lower detection limit
has been applied (cf. Section 4.1).
b Object located where two regions with different exposure times meet.
The detection limit for the shorter exposure has been adopted (see
Section 4.1 for more details).
c Object lies outside of image
3.2 IRAC and MIPS photometry
The IRAC photometry used a circular aperture with a radius of 24 with a sky background annulus of 24–72 in radius. The point-source aperture corrections were applied, which were 1.213, 1.234, 1.379, and 1.584 at 3.6, 4.5, 5.8, and 8.0 m, respectively, based on the IRAC Data Handbook.
The MIPS 24 m photometry used a circular aperture with a radius of 6″ with a sky background annulus of 6″–13″ in radius. The corresponding point-source aperture correction was 1.698 based on the MIPS instrument Web site. For several EROs we encountered severe blending problems (see Tab.LABEL:tab1) and hence these were not included in our discussion.
| ID | 3.6m | 4.5m | 5.8m | 8.0m | 24m | |
|---|---|---|---|---|---|---|
| Abell 1835 | Jy | Jy | Jy | Jy | Jy | |
| 305 | (1) | 2.9 0.2 | 4.0 0.2 | 3.6 | 4.5 | 30. |
| 319 | 19.7 0.4 | 22.5 0.4 | 26.5 1.7 | 18.1 1.6 | 2729⋆ | |
| 347 | 15.7 0.3 | 13.9 0.3 | 3.6 | 8.0 1.5 | 30. | |
| 532 | 73.6 0.3 | 75.3 0.3 | 51.3 1.5 | 37.1 1.5 | 30. | |
| 676 | blended | |||||
| 1093 | (2) | 14.4 0.2 | 23.0 0.3 | 37.6 1.5 | 50.9 1.6 | 32011 |
| 311 | (17) | 2.4 0.2 | 1.6 0.2 | 3.6 | 30. | |
| 314 | (11) | blended | ||||
| 454 | (10) | blended | ||||
| 493 | (3) | blended | ||||
| 504 | (4) | 1.9 0.2 | 1.0 0.3 | 3.6 | 30. | |
| AC114 | ||||||
| 512 | 5.20.2 | 5.30.2 | 7.11.2 | 4.5 | 30. | |
| 572 | 56.00.3 | 57.40.3 | 51.01.3 | 43.81.4 | 124.97.9 | |
| 632 | 210.81.0 | 194.60.9 | 131.21.7 | 92.12.2 | 30. | |
| 680 | 27.00.2 | 29.90.3 | 31.81.1 | 16.91.4 | 30. | |
| 707 | 46.20.3 | 43.80.3 | 25.11.2 | 23.21.4 | 30. | |
| 862 | 39.00.2 | 35.20.3 | 28.71.1 | 22.51.4 | 58.010.4 | |
| 1006 | blended | 36.01.2 | 27.51.4 | 51.07.9 | ||
| 1087 | 48.20.2 | 55.30.3 | 44.01.2 | 36.51.5 | 183.77.4 | |
| 1167 | (1) | 67.30.5 | 64.40.5 | 50.31.5 | 44.92.2 | 189.08.9 |
3.3 Chandra photometry
None of the ERO sources were detected in the fields of AC114 and A1835. In order to place upper limits on the possible X-ray emission from the EROs, we have compared the extracted spectra discussed in Section 2.3 at each ERO source position with a number of spectral models for the assumed underlying spectral energy distribution. These flux distributions were fit to a simple power law model including foreground Galactic absorption. Such a model would be expected if the intrinsic X-ray spectra of the ERO was dominated by AGN emission. The absorbing column was fixed to the Galactic value for each cluster and held fixed during the fitting procedure. Due to the low number of counts associated with a given source, the spectral index of the power-law model was similarly held fixed during the fitting. Values of 1.0, 1.4, and 2.0 were considered for the photon spectral index and different energy ranges were considered for comparison with other data from the literature. The resulting flux limits for each ERO source (at a 3-sigma level) are listed in Table LABEL:tab_chandra.
| ID | (0.5-7.0 keV) | (2.0-10.0 keV) | |
|---|---|---|---|
| Abell 1835 | =1.0 | =2.0 | =1.4 |
| 305 | 3.14e-16 | 2.21e-16 | 2.64e-16 |
| 319 | 5.44e-16 | 3.85e-16 | 4.60e-16 |
| 347 | 9.98e-16 | 7.08e-16 | 8.43e-16 |
| 532 | 3.81e-16 | 2.70e-16 | 3.21e-16 |
| 676 | 1.71e-15 | 1.22e-15 | 1.45e-15 |
| 1093 | 5.47e-16 | 3.87e-16 | 4.63e-16 |
| 311 | 5.42e-16 | 3.85e-16 | 4.60e-16 |
| 314 | 3.72e-16 | 2.64e-16 | 3.16e-16 |
| 454 | 3.98e-16 | 2.81e-16 | 3.36e-16 |
| 493 | 4.72e-16 | 3.34e-16 | 3.99e-16 |
| 504 | 5.11e-16 | 3.61e-16 | 4.30e-16 |
| AC114 | |||
| 512 | 8.79e-16 | 4.52e-16 | 6.55e-16 |
| 572 | 2.37e-15 | 5.75e-16 | 1.26e-15 |
| 632 | 3.25e-15 | 9.74e-16 | 2.06e-15 |
| 680 | 4.32e-15 | 1.70e-15 | 3.05e-15 |
| 707 | 1.09e-15 | 5.58e-16 | 8.13e-16 |
| 862 | 3.05e-15 | 1.55e-15 | 2.26e-15 |
| 1006 | 1.25e-15 | 6.31e-16 | 9.25e-16 |
| 1087 | 9.72e-16 | 4.91e-16 | 7.19e-16 |
| 1167 | 8.63e-16 | 4.38e-16 | 6.40e-16 |
4 Empirical properties of our EROs and comparisons with other samples
As mentioned above our search for EROs with in Abell 1835
and AC114 has yielded 15 (16) objects in total, depending if or not sources appearing
as double in the ACS images are counted. Two of the additional EROs
(#347 & #532) detected in
Abell 1835 were not included in Richard et al. (2006) and Schaerer et al. (2007) due to
the additional selection criterion, optical non-detection, imposed in
these papers. Two more objects (#319 & #676) were previously excluded during the by eye
examination (as described in section 3).
Six of the additional EROs in AC114 can be detected in R using the initial
detection threshold of 1 and hence were not included in
Richard et al. (2006) or Schaerer et al. (2007). The remaining two new sources were
previously excluded during the visual examination, either due to a
close by bright object (#1006) or
because its position at the edge of the image (#1087).
We now discuss the properties of the EROs and compare them to other
samples and to related objects. At this point we note that we do not differentiate between the various -band filters.
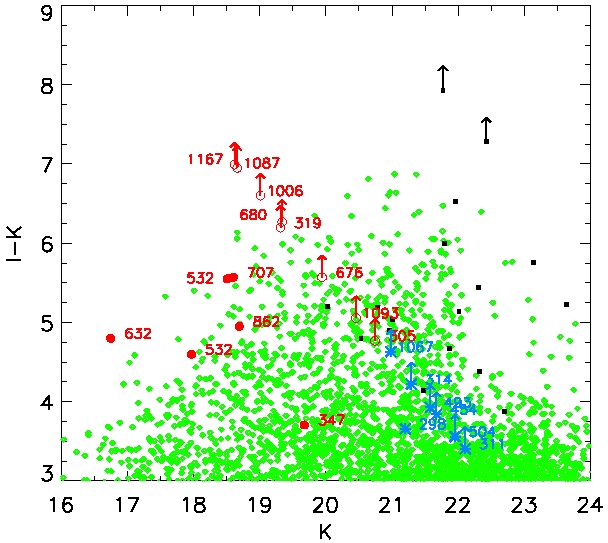
4.1 EROs with very red colours
Fig. 3 and 4 show some of the photometric properties of our EROs in comparison to other samples. These figures show that there are some sources, both in Abell 1835 and AC114, which have very red colours both with and (adopting limits for the non-detected bands). Such relatively bright () and red sources were not found in other surveys, e.g. HUDF (Yan et al. 2004), MUNICS (Longhetti et al. 2005) and GOODS-MUSIC (Grazian et al. 2006, 2007) although their depth is sufficient to detect such red objects. However, Sawicki et al. (2005) report 5 EROs with 7.0 at similar magnitudes as our objects. The origin of these apparent differences is not clear. However, it has to be recognised that all samples except GOODS-MUSIC are relatively small and lack statistical significance.
4.2 ERO classification (starburst vs. old population)
Although colours alone cannot provide the same strong constrains on their nature and photometric redshift as SEDs or spectra, we used the colour based classification scheme introduced by Pozzetti & Mannucci (2000) for a first classification of our sample. This photometric method uses the vs. colour plane to separate between galaxies with old stellar populations and dusty starbursts, assuming a redshift range of . The corresponding colour-colour diagram of our EROs is shown in Fig. 3. For comparison we have also included EROs found by the MUNICS survey (Longhetti et al. 2005), IEROs in the HUDF (Yan et al. 2004) and a sample of EROs found by Takata et al. (2003) in the field of the submillimeter source SMM J04542-0301 (cluster MS0451.6-0305).
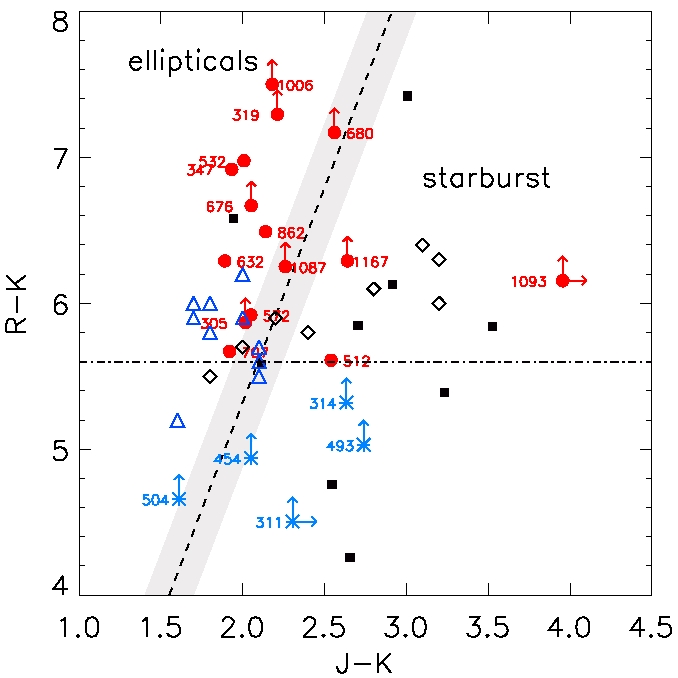
However, taking other information into account this simple classification
scheme does not always yield consistent results.
For example, several objects classified as “elliptical” on the basis of
Fig. 3 are detected at 24 m – incompatible with
an old and dust free population. Furthermore the SED analysis (cf. Sect. 5) of these objects and several other objects in the “ellipticals”
region shows that they are more likely dusty bursting objects.
Nevertheless, one has to keep
in mind that many of our objects have colours close to the separation
line (as calculated by Pozzetti & Mannucci 2000) and that the gap between
both populations is approximately 0.3 magnitudes wide (shaded area in Fig.3). In this respect,
many of our less extreme EROs
could also be classified as starburst. Also, Pozzetti & Mannucci
include exponential declining SFH up to decay times of 0.3
Gyr in their models of evolved populations, while we only consider
instantaneous burst scenarios for evolved populations.
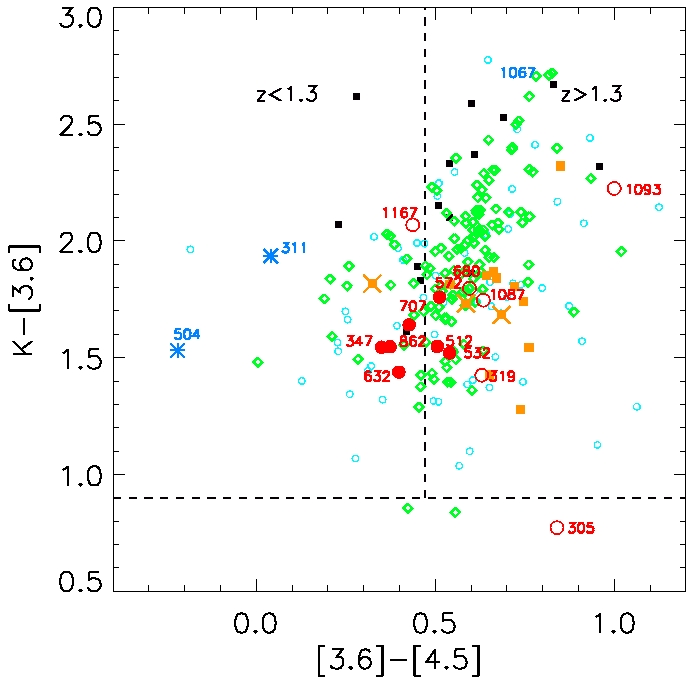
4.3 Redshift estimates for EROs with IRAC and/or MIPS detection
According to Wilson et al. (2004) an ERO selection equivalent to
(less red than our colour threshold) using the IRAC 3.6m band would require an
colour redder than 6.6 (Vega) or 4.0 (AB magnitude).
All our IRAC detected EROs fulfil this criterion (generally .
The combination of -band and IRAC bands also allow a rough estimate
of redshift, based on the shift of the 1.6 bump. This spectral
feature can be found in the spectra of all galaxies with the exception of AGN
dominated SEDs, and hence it can be used to estimate the
photometric redshift (Sawicki 2002).
In practice using colour criteria of and
limits the photometric redshift interval to , while
and should select galaxies with redshifts above 1.3,
according to Wilson et al. (2004).
The corresponding colour-colour plot showing our objects and comparison
samples is given in Fig.5. All objects except #305 satisfy this criterion.
From their red we expect that #1093 is clearly
above . In fact, detailed SED modelling yields photometric redshifts
estimates of 2.0 and 2.8–3. respectively (see
Section 5 and Schaerer et al. (2007)) in agreement with this simple
criterion.
However, for the remaining objects with close to the
limit proposed by Wilson et al. (2004), there is only partial agreement for
the separation of sources above or below using the two methods,
as can be seen by comparison with Table 7.
More details on the photometric redshift determination of the EROs are
given in Sect.5 and Schaerer et al. (2007).
From a study of 24-m selected objects Magliocchetti et al. (2007) suggest
that objects with extreme 24-m to
-band ratios of –3 are likely 1.6–3.
All 6 MIPS detected objects, except # 572 fall in this category.
For #1093 both the colour criteria discussed above and
SED modelling agree with this classification. For the 3 remaining
objects (# 1006, # 1087, # 1167) a more complete SED fitting
yields, however, photometric redshifts between 0.9 and 1.5.
Such a simple criterion may thus overestimate the redshift of sources
with extreme IR/optical flux ratios.
However, since our objects have quite faint MIPS fluxes, below the levels
of 0.3 mJy discussed by Magliocchetti et al. (2007) and Houck et al. (2005)
their criterion may be correct for more luminous sources.
4.4 Comparison of EROs with other galaxy populations
A significant overlap between different galaxy populations selected e.g. according to ERO, DRG, and other criteria is known to exist. In our case, e.g. 6 of our 15 EROs satisfy also the DRG selection criterion as indicated in Tables LABEL:taba1835 and 3, while 11 objects show a large 3.6m/ flux ratio used by Yan et al. (2004) to classify IRAC selected objects (IEROs).
Considering e.g. the near-IR and IRAC colours shown in Fig. 5, we do not find a distinct difference to other populations: EROs (Wilson et al. 2004), DRGs (Papovich 2006) and IEROs (Yan et al. 2004). However, from this and from Fig. 6 it is clear that all sources without -band detection lie at the outer regions in these plots, indicating somewhat more extreme colours than DRGs, which are however shared by some IEROs. Overall most of them correspond to objects with very strong extinction as obtained from the SED analysis in Section 5.
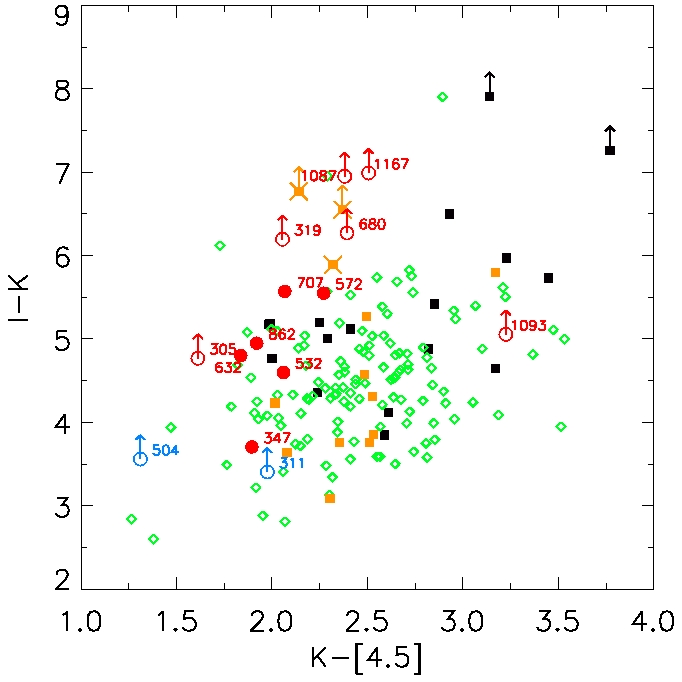
In Fig. 6 we show the versus colour, which Labbé et al. 2005 use to separate distant red galaxies (DRGs) from 2.5 Lyman break galaxies. All samples, DRGs (Labbé et al. (2005); Papovich (2006), orange and green symbols), IEROS (Yan et al. (2004), black symbols) and our EROs (red) occupy the same colour space, with EROs without -band detection again occupying the outer regions. We also include the ERO sample of Wilson et al. (2004). Three of the DRGs by Labbé et al. (2005) are thought to have old stellar populations (orange stars), due to their very red colour. The 5 EROs in our sample, which have similar or even redder colours and comparable colours, were classified as “old evolved” galaxies due to their blue colour. However, from SED fitting (see below) we find that the majority of them are best fit with GRASIL spectral templates of very dusty star forming galaxies, which is also supported by their detection at 24 m. Such extreme templates were not considered by Labbé et al. (2005). This shows that not all objects with such extreme colours are “old and dead” galaxies, as suggested by Labbé et al. (2005). In Schaerer et al. (2007) we have also shown that the bulk of the IEROs of Yan et al. (2004) are more likely dusty starbursts than old composite stellar populations. Detailed SED analysis including deep mid-IR observations may thus be needed to determine accurately the fraction of “old and dead” galaxies among red distant galaxies, as also pointed out by Kriek et al. (2006).
4.5 Starburst vs. AGN classification from X-rays
None of our EROs is detected in X-rays above the background of the galaxy cluster emission. However, thanks to the depth of the observations and the location of the objects away from the maximum cluster emission, the upper limits provide some interesting information on the nature of the EROs.
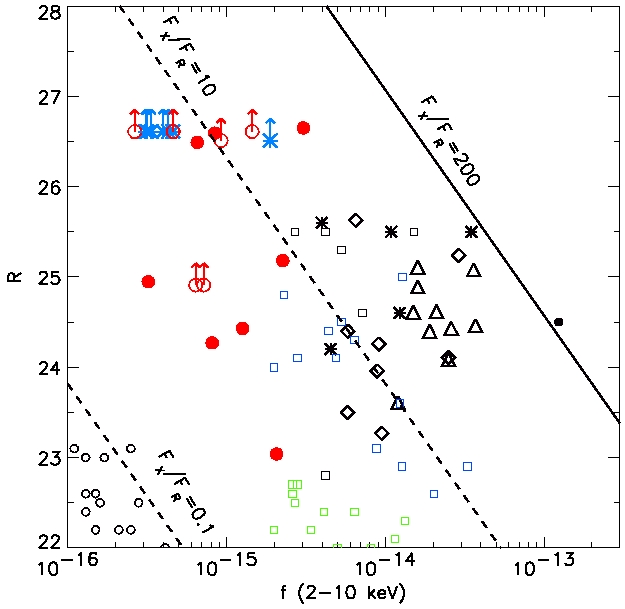
In Fig. 7 we plot the optical (-band) flux or upper limits of
our objects versus their X-ray flux limits. Also shown are other ERO samples
from the literature (Mignoli et al. 2004; Brusa et al. 2005; Severgnini et al. 2006)
and curves of constant X-ray to optical flux ratios; the range between
and 10 is typical for unobscured type 1 AGN.
The majority of our objects detected in are close to the border or outside
of this region, indicating that they are likely not unobscured AGN. However, deeper X-ray observations might position our sources in the part of the plot occupied by those objects. For the other objects
this comparison relying on the -band is not a strong constraint on
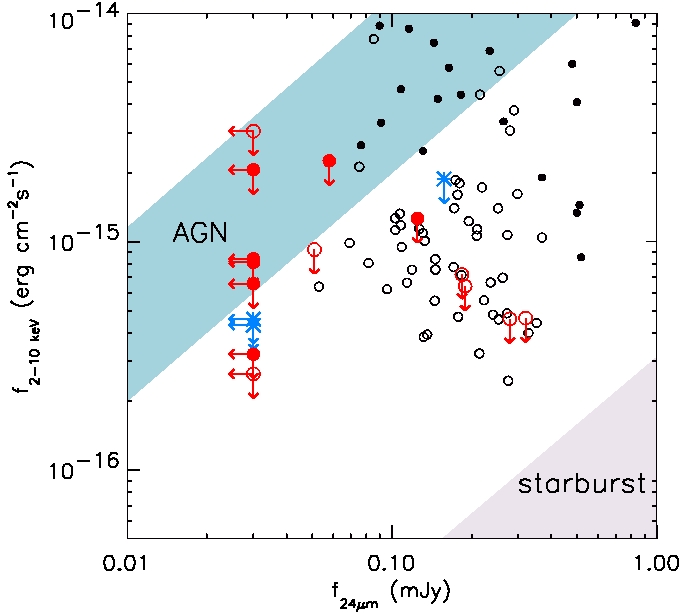
their nature. More interesting is the comparison of the MIPS 24 m flux with
the X-rays, which is very useful to compare AGN or starburst dominated
objects, as shown e.g. by Alonso-Herrero et al. (2004).
These data are shown in Fig. 8 together with the regions
of typical X-ray/mid-IR fluxes of local hard X-ray selected AGNs and
local starbursts taken from Alonso-Herrero et al. (2004).
Clearly the majority of 24 m detected sources , i.e. 5 out of 7, have
X-ray limits excluding AGNs and compatible with expectations from
local starbursts.
For the remaining objects we cannot conclude firmly on their nature.
However, no signature of an AGN is detected. In fact if some of these objects
turned out to be AGN they would correspond to very faint AGN, given
their reasonably well established redshift.
For our MIPS detected objects the relatively small 8/24 m flux
ratio is also compatible with starburst dominated objects
(cf. Magliocchetti et al. 2007).
We conclude that the bulk of our EROs are more likely starburst than AGN
dominated at near- to mid-IR wavelengths.
4.6 Magnification
Our only selection criteria is based on colour which is not influenced by the magnification effects. However, in order to compare the number counts with other surveys, either in the field of lensing clusters (e.g. Smith et al. 2002) or large surveys (Simpson et al. 2006; Daddi et al. 2000; Smail et al. 2002) one has to correct for the magnification of the source flux and the dilution of the source plane. Magnification maps were derived following the procedure described in Richard et al. (2006) using the mass models of Abell 1835 (similar to Smith et al. 2005) and AC114 (Natarajan et al. 1998; Campusano et al. 2001). Given the position of each object (in terms of RA and DEC), we then determined the magnification factors. Table 6 lists the necessary correction if the source plane lies at redshift 0.5, 1.0, 1.5, 2.0, 3.0 and 7.0 respectively. As the field of Abell 1835 is positioned away from the cluster centre, most of the sources experience a relative small correction. These magnification factors also have to be taken into account to compute absolute quantities, such as the stellar, SFR, etc. derived in Section 5.
| ID | |||||||
|---|---|---|---|---|---|---|---|
| Abell 1835 | |||||||
| 305 | (1) | 1.13 | 1.21 | 1.24 | 1.26 | 1.28 | 1.30 |
| 319 | 1.15 | 1.26 | 1.29 | 1.31 | 1.33 | 1.36 | |
| 347 | 1.17 | 1.28 | 1.32 | 1.34 | 1.36 | 1.39 | |
| 532 | 1.33 | 1.60 | 1.71 | 1.77 | 1.83 | 1.91 | |
| 676 | 1.34 | 1.62 | 1.75 | 1.81 | 1.89 | 1.98 | |
| 1093 | (2) | 1.43 | 1.82 | 1.99 | 2.09 | 2.20 | 2.34 |
| 311 | (17) | 1.17 | 1.28 | 1.32 | 1.34 | 1.36 | 1.39 |
| 314 | (11) | 1.15 | 1.26 | 1.29 | 1.31 | 1.33 | 1.36 |
| 454 | (10) | 1.22 | 1.38 | 1.44 | 1.47 | 1.50 | 1.54 |
| 493 | (3) | 1.27 | 1.48 | 1.57 | 1.61 | 1.66 | 1.72 |
| 504 | (4) | 1.29 | 1.51 | 1.60 | 1.64 | 1.70 | 1.76 |
| AC114 | |||||||
| 512 | 1.60 | 2.74 | 3.47 | 3.97 | 4.61 | 5.63 | |
| 572 | 1.32 | 1.71 | 1.88 | 1.97 | 2.06 | 2.19 | |
| 632 | 1.70 | 3.03 | 3.84 | 4.39 | 5.06 | 6.07 | |
| 680 | 1.65 | 3.03 | 4.01 | 4.74 | 5.75 | 7.56 | |
| 707 | 1.60 | 2.71 | 3.40 | 3.86 | 4.45 | 5.36 | |
| 862 | 1.31 | 1.69 | 1.85 | 1.94 | 2.04 | 2.16 | |
| 1006 | 1.50 | 2.26 | 2.65 | 2.88 | 3.14 | 3.50 | |
| 1087 | 1.20 | 1.42 | 1.51 | 1.56 | 1.61 | 1.66 | |
| 1167 | (1) | 1.24 | 1.53 | 1.64 | 1.71 | 1.77 | 1.86 |
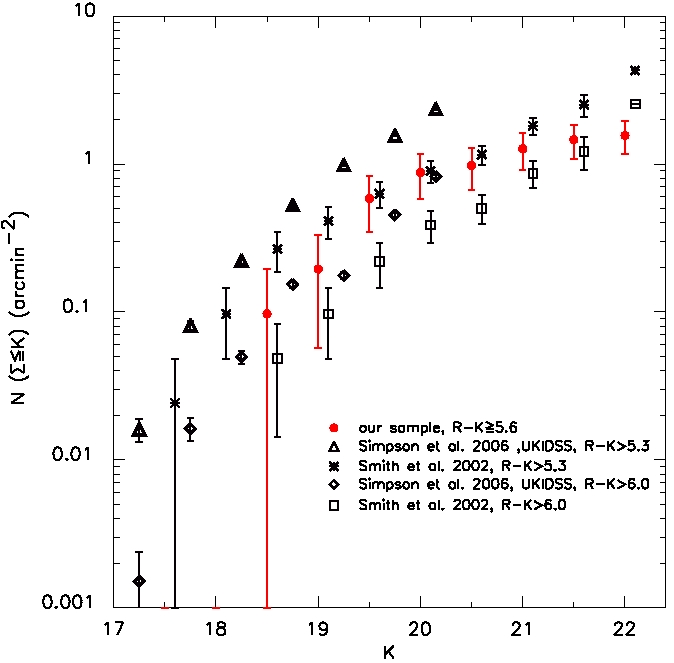
4.7 Surface density
After correction for lensing and incompleteness we obtain the surface density of EROs shown in Fig.9. Although we use a slightly redder colour threshold than most authors, we compare our cumulative number counts with various other surveys. A comparable ERO sample in terms of environment is available from Smith et al. (2002), who studied 10 massive galaxy clusters at z0.2, including Abell 1835. However, the single ERO detected there has a colour of =5.3 and hence does not satisfy our colour threshold, while even the brightest of our EROs in Abell 1835 (#532 K=17.97) is not part of this sample. The explanation lies both in the smaller field size of the UKIRT camera (1.5 arcmin) and the centering of the field on the central cluster galaxy. As a result EROJ140057+0252.4 (see Smith et al. 2002) lies at the very edge of our image, which we excluded due to the low signal-to-noise. The bright incompleteness limits (80% at 20.6mag) in Smith et al. (2002) might be responsible for their non-detection of our fainter objects. The largest ERO survey, using the UKIDSS Ultra Deep survey, has been released recently by Simpson et al. (2006). However, for now a comparison is only possible at brighter magnitudes, K20.1.
Fig. 9 shows the cumulative surface density of
5.6 EROs in comparison with the samples of Smith et al. (2002)
and
Simpson et al. (2006) ( and ).
Up to =20.5mag, our number counts are slightly lower than those
found by (Smith et al. 2002; Smail et al. 2002) but agree well within the
1 error bars. Our lower number counts are also to be expected
due to the redder colour threshold. We estimate the
cumulative surface density of EROs at 20.5 with (0.970.31)
arcmin-2, compared to (1.160.17) arcmin-2 and (0.500.11) arcmin-2by
Smith et al. (2002) for 5.3 and 6.0 (up to the same K-limit). The number counts increase
only slightly for fainter magnitudes, up to (1.360.36)
arcmin-2 at 22.0.
The slope of N( K)= 10αK for our sample is =0.780.03 for
K20.0, compared to =1.050.05 from Daddi et al. (2000)
and =1.040.05 for Smith et al. (2002). This slope decreases for fainter magnitudes (20 22) to
=0.110.01. Such a break in the cumulative number counts at
K19-20 has been observed in
various surveys (Smith et al. 2002; Daddi et al. 2000), although the actual
values for are found to be larger by a factor of 2-3 in
(Smith et al. 2002; Daddi et al. 2000) at fainter magnitudes (20.5). This
flattening could be caused by the absence of evolved ellipticals with
fainter magnitudes.
The preliminary results from UKIDSS UDS EDR (Simpson et al. 2006)
(K20.15) show much higher number counts than any other survey
(e.g. Daddi et al. 2000; Smail et al. 2002; Smith et al. 2002). The authors attribute this
result partly to the use of different filters and apertures.
5 Analysis of the observed SED
5.1 SED fitting method
To analyse quantitatively the observed SEDs we follow the procedures outlined in Schaerer & Pelló (2005) and described in detail in Schaerer et al. (2007). We shall only briefly summarise the main points here.
The photometry in all bands except 24 m with MIPS has been used.
To take uncertainties in absolute flux calibrations between different instruments
into account we adopt a minimum photometric error of 0.1 mag in most computations.
We have used an updated version of the Hyperz code
from Bolzonella et al. (2000) to constrain the redshift, stellar population
properties (age, star formation history), and extinction of the galaxies
studied in this paper. To do so we use in particular a large library
of synthetic, empirical and semi-empirical spectral templates.
The templates are gathered into the 4 following groups:
1)
Bruzual & Charlot plus Coleman et al. (1980) empirical templates galaxies
of all Hubble types (hereafter named BC or BCCWW group).
The theoretical Bruzual models (Bruzual & Charlot 2003), taken here for solar
metallicity, include various
star formation histories representative of different Hubble types.
The IMF adopted in these models is the Miller-Scalo IMF from 0.1 to 125 M⊙.
2)
Starburst SEDs from Schaerer (2002; 2003) models at
different metallicities extended up to ages of 1 Gyr and considering instantaneous
bursts or constant star formation (hereafter s04gyr group).
These models assume a Salpeter IMF from 1 to 100 M⊙.
3)
Empirical or semi-empirical starburst, ULIRG and QSO templates.
We use starburst templates from the Calzetti et al. (1994) and
Kinney et al. (1996) atlas and the HST QSO template of Zheng et al. (1997).
To include also more obscured objects we have added
UV to millimeter band templates of EROs, ULIRGS, starburst and normal
galaxies (HR 10, Arp 220, M82, NGC 6090, M51, M100, NGC 6949) from fits of GRASIL models
to multi-wavelength observations (Silva et al. (1998), named GRASIL group).
This template group will be used in particular to predict mid-IR to sub-mm fluxes,
and hence to estimate total bolometric luminosities,
after fitting the optical to 8 m part of the spectrum.
The main free parameters we consider are: the spectral template (among
a group), redshift , and (additional) extinction () assuming a
Calzetti et al. (2000) law.
To increase the diversity of empirical or semi-empirical templates
and to allow for possible deviations from them, we also allow
for an additional reddening.
From the luminosity distance of the object or, if templates generated by
evolutionary synthesis models are used, by scaling the template
SED to the observed absolute fluxes we obtained the absolute scaling
for properties such as stellar mass or the star formation rate (SFR).
In some cases we also use the bolometric luminosity computed from
a GRASIL template to determine the SFR.
Finally, the absolute quantities must also be corrected
for the effects of gravitational lensing. The magnification factors
listed in Table 6 are used for this purpose.
5.2 Results
5.2.1 Abell 1835
SED fits and the derived properties for the optical drop-out objects #305 (1), #311 (17), #314 (11), #454 (10), #493 (3), #504 (4), and #1093 (2), corresponding to the objects of Richard et al. (2006) with IDs in brackets, have already been discussed in depth in Schaerer et al. (2007). In case of #1093 (2), the known sub-mm source SMMJ14009+0252, this includes also the SCUBA measurements by Ivison et al. (2000). We therefore limit the discussion here to the new objects in this field, i.e. #319, #347, #532, and #676. A summary of their derived properties is given in Table 7. For completeness and comparison the derived properties of the objects from Schaerer et al. (2007) are listed at the bottom of this table. Note the stellar masses have been corrected by to eliminate an error in the absolute scaling found in Schaerer et al. (2007). In contrast to the degeneracies found for many of the objects discussed in Schaerer et al. (2007) the photometric redshifts of the “new” objects show all well defined best fits at low- redshifts, 0.9 to 2.5. Object #319, one of the two newly identified drop-outs, has the highest photometric redshift, 2.4–2.5, which is well constrained by the “curvature” measured in the IRAC bands due to the stellar peak at 1.6 m (restframe). Except possibly for #319, none of these objects are detected with MIPS at 24 m.
Object #319, is best fitted without extinction and with templates of elliptical galaxies or maximally old simple stellar populations (bursts). From SED fitting, this object is thus best characterised as “elliptical” in agreement with its empirical classification (Fig.3). However, these SEDs are not able to explain the 24 m flux.
The three remaining objects all show clear indications for dust, younger ages, and short star formation histories (“bursts”), although they would be classified as “ellipticals” according to their (R-K) vs (J-K) colours (see Fig. 3). The estimated stellar masses of all these objects are between and M⊙ with small magnification factors .
5.2.2 AC114
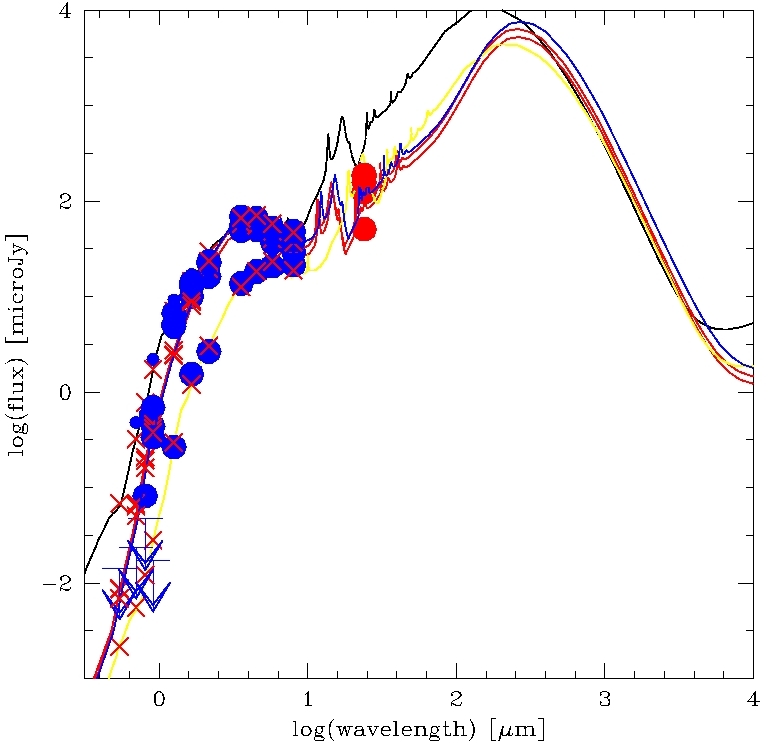
Using the templates from the BCCWW and s04gyr groups all except one object have best-fit redshifts of 1.–2.6 (see Table 7). The exception is the -dropout #1087, whose SED shows a very rapid and strong decline between the near-IR and optical bands, which is better fit with a Lyman-break than with a Balmer break. Formally its best photometric redshift is thus , but given the brightness of this object at near-IR and Spitzer bands the high- solution is extremely unlikely. Using the semi-empirical GRASIL templates the best fit is found at . This solution also naturally explains the observed 24 m flux of this object, as shown in Fig. 10. For #862 the best fit with the BCCWW and s04gyr templates is found at 1.1, where GRASIL templates yield a somewhat lower redshift of 0.6 retained in the Table.
For 4 objects (#512, #632, #680, #707) the SED fitting indicates relatively small amounts of extinction (Av 0.6). Interestingly these correspond precisely to all the objects which are non-detected at 24 m. From their star formation history (all burst-like) and their low (but not zero?) extinction these objects resemble ellipticals, in agreement with their empirical classification. For the brightest of all our EROs, #632, we obtain different solutions with the BC and S04gyr templates respectively, namely 1.3 (2.5), ages of 4.5 (2.6) Gyr, and little or no extinction, Av 0.6 (0.). The estimated stellar masses of these objects are between and M⊙.
The remaining objects, also all detected at 24 m, show all clear evidence for substantial extinction. In Table 7 we list their properties derived from fits with the GRASIL templates. The best fits are found with the M51 or M82 templates requiring, however, additional extinction in 5 of 6 cases. The predicted 24 m fluxes, not included in the SED modelling, agree well with the observations except maybe for 572 whose MIPS flux is somewhat overestimated (see Fig. 10). In conclusion, for 572, 862, 1006, 1087, and 1167 all indications (SED fitting and MIPS detections) consistently confirm the dusty low- ( 0.9 to 2 or maybe 2.5) starburst nature of these objects. This shows the limitations of empirical diagrams, which would e.g. clearly classify three of them as ellipticals (cf. Fig.3). As already mentioned above, our conclusion does also not support the explanation of objects with such extreme colours (cf. Fig.6) as “old and dead galaxies” as proposed by Labbé et al. (2005).
| Object | Av | template | DMa | Mass | SFR | stellar age | |||
| [mag] | [mag] | [mag] | M⊙ | M⊙ yr-1 | [Gyr] | ||||
| Abell 1835: | |||||||||
| 298 | 0.8–1.1 | 0 | elliptical | 43.65 | -22.0 | ||||
| 319 | 2.4–2.5 | burst | 46.60 | -26.4 | 3.3 | 2.3 | |||
| 347 | 1.1–1.2 | 1.6–2.2 | burst | 44.35 | -24.4 | (3.1-4.4) | 0.5–1.0 | ||
| 532 | 1.3–1.4 | 0.4–2.0 | burst | 44.71 | -26.4 | (3.0-4.6) | 1.0–3.5 | ||
| 676 | 1.4 | 1.4–1.8 | burst | 45.0 | -24.8 | (3.3-3.8) | 0.4–0.7 | ||
| AC114: | |||||||||
| 512 | 2.4–2.6 | 0.4 | burst | 46.65 | -25.2 | 4.3 | 0.7 | ||
| 572 | 1.2 | M82 | 44.65 | -26.1 | 35.7 | ||||
| 632 | 1.3 (2.5) | 0.6 (0.) | burst | 44.76 | -27.5 | 1.5 | 4.5 (2.6) | ||
| 680 | 2.1 | 0.6 | burst | 46.12 | -26.5 | 2.3 | 1.4 | ||
| 707 | 1.2 | 0.6 | elliptical | 44.63 | -25.8 | ||||
| 862 | 0.6 | +3.2 | M51 | 42.76 | -24.2 | 10.6 | |||
| 1006 | 0.9 | +3.6 | M51 | 43.86 | -25.4 | 30.5 | |||
| 1067 | 2.0 | +2.0 | M82 | 46.02 | -26.0 | 205.5 | |||
| 1087 | 0.9 | +3.8 | M51 | 43.77 | -25.6 | 34.2 | |||
| 305 | (1) | 0.4 –1.5 | ? | Fits uncertain – see paper I | |||||
| 311 | (17) | 0.7–0.8 | 3.8 | burst | 43.0 | -21.7 | ? | 0.9 | ? (see paper I) |
| 504 | (4) | 1.2 | 0–1.6 | burst/elliptical | 44.60 | -21.6 | 5 | 0.7 to 4.5 | |
| 1093 | (2) | 2.8–3 | 2.4–3 | young burst | 47.0 | -27.7 | 2100 | 0.36 | |
| 1167 | (1) | 1.3–1.6 | 1.6–2.8 | burst | 44.84 | -26.4 | 0.9–4.5 Gyr | ||
| 1167 | (1) | 1.0 | +3.8 | M51 | 44.03 | -25.9 | 48 | ||
| 493 | (3) | 1.1 | 0.6–0.8 | burst | 44.4 | -22.2 | 0.5 | ||
| 454 | (10) | 1.2 | 1.8 | burst | 44.68 | -22.9 | 0.5 | ||
| 314 | (11) | ? | |||||||
| a distance modulus computed for minimum redshift | |||||||||
The star formation rates estimated for these dusty objects from the bolometric luminosity of the GRASIL model fit are between 15 and 120 M⊙ yr-1, after correction for lensing. Their bolometric luminosities classify them in the range of luminous infrared galaxies (LIRG) with L⊙.
5.3 Discussion
As we can see from Table 7 the properties of our EROs span a rather wide range in extinction, stellar age, and stellar mass. The properties and their range are quite similar to those determined for DRGs by Förster-Schreiber et al. (2004) and for the IEROs of Yan et al. (2004) in Schaerer et al. (2007). However, in our sample we find some extreme objects in terms of colours, for which the SED modelling indicates quite clearly very high extinction ( and higher), which is not found in the DRG samples of Förster-Schreiber et al. (2004) and Papovich (2006). According to our analysis (see Schaerer et al. 2007) some IEROs of Yan et al. (2004) show also such high extinction.
6 Summary and conclusions
We have combined new ACS/HST observations, Spitzer IRAC and MIPS guaranteed time observations, and the optical and near-IR observations of Richard et al. (2006) of two well-known lensing clusters, Abell 1835 and AC114, to study extremely red galaxies (EROs) in these fields. New and archival X-ray observations with ACIS/Chandra have also been obtained for these clusters.
Using a standard criterion we have found 6 and 9 EROs in Abell 1835 and AC114 respectively. Several (8) of these objects are undetected up to the and/or band, and are hence “optical” drop-out sources. Three of them, already identified earlier by Richard et al. (2006), have been discussed in detail in Schaerer et al. (2007).
We have discussed the empirical properties of these EROs and compared them to other samples in the literature. We have also undertaken SED modelling based on a modified version of the Hyperz photometric redshift code and using a large number of spectral templates, including also very dusty galaxies.
The main results can be summarised as follows:
-
•
Among our EROs we find 3 sources showing quite unusually red colours in and other colours. Few similar objects are found e.g. among the samples of IRAC selected IEROs of Yan et al. (2004), EROs of Sawicki et al. (2005) and the DRGs of Labbé et al. (2005). Our source density is compatible with other counts from the literature.
-
•
After correcting for lens amplification, we estimate a surface density of (0.970.31) arcmin-2 for EROs with (5.6) at K. We observe a significant flattening of the number count at K20, possibly the result of loosing the contribution of bright evolved ellipticals to the overall ERO population.
-
•
According to “empirical” and to Hyperz modelling, the photometric redshifts of most of our sources yield are 0.7–1.5. Five of them are found at higher redshift ( 2.–2.5.).
-
•
According to simple colour-colour diagrams the majority of our objects would be classified as hosting old stellar populations (“ellipticals”). However, there are clear signs of dusty starbursts for several among them. These objects correspond to the most extreme ones in colour.
-
•
We found that some very red DRGs, which would be classified as old and dead galaxies according to other studies (e.g. Labbé et al. (2005)), are rather very dusty starbursts, even (U)LIRGs, as also supported their mid-IR photometry. Estimates of the fraction of old and dead galaxies among red galaxies may thus need to be treated with caution.
-
•
As in earlier studies an overlap of different populations is found. Among our 15 EROs six also classify as DRGs (40%). 12 of 14 EROs (85 %) with available IRAC photometry also fulfil the selection criteria for IRAC selected IEROs of Yan et al. (2004). Objects which do not classify as IERO are also not DRGs; the reverse is however not true. SED modelling shows that 40 % of the IEROs are luminous or ultra-luminous infrared galaxies ((U)LIRG).
-
•
None of our objects detected at X-rays above the cluster background emission, with upper limits typically of the order of ergs s-1cm-2 in the 0.5–7.0 keV band. No indication for AGNs is found, although faint activity cannot be excluded for all objects. From mid-IR and X-ray data 5 objects are clearly classified as starbursts.
-
•
Quantitative SED fitting for our objects shows that they cover a fairly wide range in properties, such as extinction, stellar age, mass, and SFR. The derived properties are quite similar to those of DRGs and IEROs, except for 5 extreme objects in terms of colours, for which a very high extinction () is found. According to our analysis some IEROs of Yan et al. (2004) show also such high extinction (see Schaerer et al. 2007). From the SED modelling these 5 EROs are expected to be (U)LIRG, and their IR to sub-mm SED is predicted.
Understanding the links between these different galaxy populations
and their evolutionary history remains largely to be done.
Acknowledgements.
We thank Andrea Grazian for providing us with the GOODS-MUSIC catalogues and Graham Smith for making their results available in electronic format.Support from ISSI (International Space Science Institute) in Bern for an “International Team” is kindly acknowledged. Part of this work was supported by the Swiss National Science Foundation, the French Centre National de la Recherche Scientifique, and the French Programme National de Cosmologie (PNC) and Programme National de Galaxies (PNG).
This paper is based on observations collected at the European Space Observatory, Chile (069.A-0508,070.A-0355,073.A-0471), and the Canada-France-Hawaii Telescope operated by the National Research Council of Canada, the French Centre National de la Recherche Scientifique (CNRS) and the University of Hawaii, and the NASA/ESA Hubble Space Telescope operated by the Association of Universities for Research in Astronomy, Inc., the Spitzer Space Telescope, which is operated by the Jet Propulsion Laboratory, California Institute of Technology under NASA contract 1407, and the Chandra satellite. This research was supported in part by Chandra General Observer Program grant GO6-7106X.
References
- Alexander et al. (2003) Alexander, D. M., Bauer, F. E., Brandt, W. N., et al. 2003, AJ, 126, 539
- Alexander et al. (2002) Alexander, D. M., Vignali, C., Bauer, F. E., et al. 2002, AJ, 123, 1149
- Alonso-Herrero et al. (2006) Alonso-Herrero, A., Pérez-González, P. G., Alexander, D. M., et al. 2006, ApJ, 640, 167
- Alonso-Herrero et al. (2004) Alonso-Herrero, A., Pérez-González, P. G., Rigby, J., et al. 2004, ApJS, 154, 155
- Bergström & Wiklind (2004) Bergström, S. & Wiklind, T. 2004, A&A, 414, 95
- Bertin & Arnouts (1996) Bertin, E. & Arnouts, S. 1996, A&AS, 117, 393
- Bolzonella et al. (2000) Bolzonella, M., Miralles, J.-M., & Pelló, R. 2000, A&A, 363, 476
- Brusa et al. (2005) Brusa, M., Comastri, A., Daddi, E., et al. 2005, A&A, 432, 69
- Bruzual & Charlot (2003) Bruzual, G. & Charlot, S. 2003, MNRAS, 344, 1000
- Calzetti et al. (2000) Calzetti, D., Armus, L., Bohlin, R. C., et al. 2000, ApJ, 533, 682
- Calzetti et al. (1994) Calzetti, D., Kinney, A. L., & Storchi-Bergmann, T. 1994, ApJ, 429, 582
- Campusano et al. (2001) Campusano, L. E., Pelló, R., Kneib, J.-P., et al. 2001, A&A, 378, 394
- Cimatti et al. (1999) Cimatti, A., Daddi, E., di Serego Alighieri, S., et al. 1999, A&A, 352, L45
- Cimatti et al. (2002) Cimatti, A., Pozzetti, L., Mignoli, M., et al. 2002, A&A, 391, L1
- Coleman et al. (1980) Coleman, G. D., Wu, C.-C., & Weedman, D. W. 1980, ApJS, 43, 393
- Cowie et al. (1994) Cowie, L. L., Gardner, J. P., Hu, E. M., et al. 1994, ApJ, 434, 114
- Czoske et al. (2003) Czoske, O., Kneib, J.-P., & Bardeau, S. 2003, in Astronomical Society of the Pacific Conference Series, Vol. 301, Astronomical Society of the Pacific Conference Series, ed. S. Bowyer & C.-Y. Hwang, 281–+
- Daddi et al. (2002) Daddi, E., Cimatti, A., Broadhurst, T., et al. 2002, A&A, 384, L1
- Daddi et al. (2000) Daddi, E., Cimatti, A., Pozzetti, L., et al. 2000, A&A, 361, 535
- De Filippis et al. (2004) De Filippis, E., Bautz, M. W., Sereno, M., & Garmire, G. P. 2004, ApJ, 611, 164
- Della Ceca et al. (2004) Della Ceca, R., Maccacaro, T., Caccianiga, A., et al. 2004, A&A, 428, 383
- Egami et al. (2006) Egami, E., Misselt, K. A., Rieke, G. H., et al. 2006, ApJ, 647, 922
- Elston et al. (1988) Elston, R., Rieke, G. H., & Rieke, M. J. 1988, ApJ, 331, L77
- Elston et al. (1989) Elston, R., Rieke, M. J., & Rieke, G. H. 1989, ApJ, 341, 80
- Fazio et al. (2004) Fazio, G. G., Hora, J. L., Allen, L. E., et al. 2004, ApJS, 154, 10
- Ferguson et al. (2000) Ferguson, H. C., Dickinson, M., & Williams, R. 2000, ARA&A, 38, 667
- Fiore et al. (2003) Fiore, F., Brusa, M., Cocchia, F., et al. 2003, A&A, 409, 79
- Fontana et al. (2004) Fontana, A., Pozzetti, L., Donnarumma, I., et al. 2004, A&A, 424, 23
- Förster-Schreiber et al. (2004) Förster-Schreiber, N. M., van Dokkum, P. G., Franx, M., et al. 2004, ApJ, 616, 40
- Georgakakis et al. (2006) Georgakakis, A., Hopkins, A. M., Afonso, J., et al. 2006, MNRAS, 140
- Gilbank et al. (2003) Gilbank, D. G., Smail, I., Ivison, R. J., & Packham, C. 2003, MNRAS, 346, 1125
- Graham & Dey (1996) Graham, J. R. & Dey, A. 1996, ApJ, 471, 720
- Grazian et al. (2006) Grazian, A., Fontana, A., de Santis, C., et al. 2006, A&A, 449, 951
- Grazian et al. (2007) Grazian, A., Nonino, M., & Gallozzi, S. 2007, astro-ph/0701233
- Houck & Denicola (2000) Houck, J. C. & Denicola, L. A. 2000, in ASP Conf. Ser. 216: Astronomical Data Analysis Software and Systems IX, ed. N. Manset, C. Veillet, & D. Crabtree, 591–+
- Houck et al. (2005) Houck, J. R., Soifer, B. T., Weedman, D., et al. 2005, ApJ, 622, L105
- Hu & Ridgway (1994) Hu, E. M. & Ridgway, S. E. 1994, AJ, 107, 1303
- Im et al. (2002) Im, M., Simard, L., Faber, S. M., et al. 2002, ApJ, 571, 136
- Ivison et al. (2000) Ivison, R. J., Smail, I., Barger, A. J., et al. 2000, MNRAS, 315, 209
- Ivison et al. (2001) Ivison, R. J., Smail, I., Frayer, D. T., Kneib, J.-P., & Blain, A. W. 2001, ApJ, 561, L45
- Kauffmann et al. (1993) Kauffmann, G., White, S. D. M., & Guiderdoni, B. 1993, MNRAS, 264, 201
- Kinney et al. (1996) Kinney, A. L., Calzetti, D., Bohlin, R. C., et al. 1996, ApJ, 467, 38
- Kitzbichler & White (2006) Kitzbichler, M. G. & White, S. D. M. 2006, MNRAS, 366, 858
- Kriek et al. (2006) Kriek, M., van Dokkum, P. G., Franx, M., et al. 2006, ApJ, 649, L71
- Labbé et al. (2005) Labbé, I., Huang, J., Franx, M., et al. 2005, ApJ, 624, L81
- Longhetti et al. (2005) Longhetti, M., Saracco, P., Severgnini, P., et al. 2005, MNRAS, 361, 897
- Maccacaro et al. (1988) Maccacaro, T., Gioia, I. M., Wolter, A., Zamorani, G., & Stocke, J. T. 1988, ApJ, 326, 680
- Magliocchetti et al. (2007) Magliocchetti, M., Silva, L., Lapi, A., et al. 2007, MNRAS, 375, 1121
- Mainieri et al. (2002) Mainieri, V., Bergeron, J., Hasinger, G., et al. 2002, A&A, 393, 425
- McCarthy (2004) McCarthy, P. J. 2004, ARA&A, 42, 477
- Mignoli et al. (2004) Mignoli, M., Pozzetti, L., Comastri, A., et al. 2004, A&A, 418, 827
- Moustakas et al. (2004) Moustakas, L. A., Casertano, S., Conselice, C. J., et al. 2004, ApJ, 600, L131
- Natarajan et al. (1998) Natarajan, P., Kneib, J.-P., Smail, I., & Ellis, R. S. 1998, ApJ, 499, 600
- Papovich (2006) Papovich, C. 2006, New Astronomy Review, 50, 134
- Pettini et al. (2000) Pettini, M., Steidel, C. C., Adelberger, K. L., Dickinson, M., & Giavalisco, M. 2000, ApJ, 528, 96
- Piccinotti et al. (1982) Piccinotti, G., Mushotzky, R. F., Boldt, E. A., et al. 1982, ApJ, 253, 485
- Pozzetti et al. (1996) Pozzetti, L., Bruzual A., G., & Zamorani, G. 1996, MNRAS, 281, 953
- Pozzetti & Mannucci (2000) Pozzetti, L. & Mannucci, F. 2000, MNRAS, 317, L17
- Ranalli et al. (2003) Ranalli, P., Comastri, A., & Setti, G. 2003, A&A, 399, 39
- Richard et al. (2006) Richard, J., Pelló, R., Schaerer, D., Le Borgne, J.-F., & Kneib, J.-P. 2006, A&A, 456, 861
- Roche et al. (2003) Roche, N. D., Dunlop, J., & Almaini, O. 2003, MNRAS, 346, 803
- Sawicki (2002) Sawicki, M. 2002, AJ, 124, 3050
- Sawicki et al. (2005) Sawicki, M., Stevenson, M., Barrientos, L. F., et al. 2005, ApJ, 627, 621
- Schaerer (2002) Schaerer, D. 2002, A&A, 382, 28
- Schaerer (2003) Schaerer, D. 2003, A&A, 397, 527
- Schaerer et al. (2007) Schaerer, D., Hempel, A., Egami, E., et al. 2007, A&A, 469, 47
- Schaerer & Pelló (2005) Schaerer, D. & Pelló, R. 2005, MNRAS, 362, 1054
- Severgnini et al. (2006) Severgnini, P., Caccianiga, A., Braito, V., et al. 2006, A&A, 451, 859
- Silva et al. (1998) Silva, L., Granato, G. L., Bressan, A., & Danese, L. 1998, ApJ, 509, 103
- Simpson et al. (2006) Simpson, C., Almaini, O., Cirasuolo, M., et al. 2006, MNRAS, 373, L21
- Smail et al. (1998) Smail, I., Ivison, R. J., Blain, A. W., & Kneib, J.-P. 1998, ApJ, 507, L21
- Smail et al. (2002) Smail, I., Owen, F. N., Morrison, G. E., et al. 2002, ApJ, 581, 844
- Smith et al. (2002) Smith, G. P., Smail, I., Kneib, J.-P., et al. 2002, MNRAS, 330, 1
- Somerville et al. (2004) Somerville, R. S., Moustakas, L. A., Mobasher, B., et al. 2004, ApJ, 600, L135
- Somerville et al. (2001) Somerville, R. S., Primack, J. R., & Faber, S. M. 2001, MNRAS, 320, 504
- Stern et al. (2006) Stern, D., Chary, R.-R., Eisenhardt, P. R. M., & Moustakas, L. A. 2006, AJ, 132, 1405
- Swinbank et al. (2007) Swinbank, A. M., Bower, R. G., Smith, G. P., et al. 2007, MNRAS, 72
- Takata et al. (2003) Takata, T., Kashikawa, N., Nakanishi, K., et al. 2003, PASJ, 55, 789
- Tinsley & Gunn (1976) Tinsley, B. M. & Gunn, J. E. 1976, ApJ, 203, 52
- Treu et al. (2005) Treu, T., Ellis, R. S., Liao, T. X., et al. 2005, ApJ, 633, 174
- Werner et al. (2004) Werner, M. W., Roellig, T. L., Low, F. J., et al. 2004, ApJS, 154, 1
- White & Rees (1978) White, S. D. M. & Rees, M. J. 1978, MNRAS, 183, 341
- Wilson et al. (2004) Wilson, G., Huang, J.-S., Pérez-González, P. G., et al. 2004, ApJS, 154, 107
- Yan et al. (2004) Yan, H., Dickinson, M., Eisenhardt, P. R. M., et al. 2004, ApJ, 616, 63
- Yan & Thompson (2003) Yan, L. & Thompson, D. 2003, ApJ, 586, 765
- Zheng et al. (1997) Zheng, W., Kriss, G. A., Telfer, R. C., Grimes, J. P., & Davidsen, A. F. 1997, ApJ, 475, 469