Simulation of LiCAS Error Propagation
Abstract
Linear Collider Alignment and Survey (LiCAS) R&D group is proposing a novel automated metrology instrument dedicated to align and monitor the mechanical stability of a future linear high energy collider. LiCAS uses Laser Straightness Monitors (LSM) and Frequency Scanning Interferometry (FSI) [2, 3] for straightness and absolute distance measurements, respectively. This paper presents detailed simulations of a LiCAS system operating inside a Rapid Tunnel Reference Surveyor (RTRS train). With the proposed design it is feasible to achieve the required vertical accuracy of the order of over tunnel sections meeting the specification for the TESLA collider [4].
1 Principle of the LICAS-RTRS train operation
In figure 1 the schematic view of the LiCAS train operating in the accelerator tunnel is presented. The train is composed of 6 cars, the distance between the centres of neighbouring cars is . Each car is equipped with 4 CCD cameras and two beam splitters (BS) constituting the straightness monitor. The straightness monitor measures the transverse translation () and transverse rotation () with respect to a axis defined by the laser beam passing through all cars in a vacuum pipe. The laser beam is reflected back using the retro-reflector (RR) located in the last car, illuminating the upper CCD cameras of the straightness monitors. 6 FSI lines placed in the same vacuum pipe between each pair of cars are responsible for the distance measurement along the axis (). In addition a clinometer located on each car provides a measurement of rotation around the axis ().
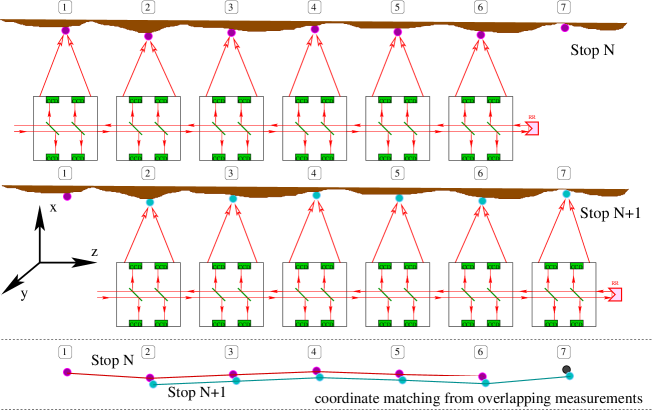 |
When the train stops in front of the wall markers it firstly measures the relative position and rotation of all cars with respect to the first car. This defines the local reference frame of the train in which the location of the wall mounted reference markers are measured next. This procedure is repeated for each train stop. Each marker is measured up to 6 times. Finally the coordinates of each marker, expressed in the local train frames are transformed to the frame of the first train (the global frame) by fitting them to each other under the constraint that wall markers have not moved during the entire measurement.
2 Opto-geometrical model of the LICAS-RTRS train
In order to study the expected precision on the position reconstruction of the tunnel reference markers a simulation of the LiCAS survey train was performed. To describe the sensing parts of the train the Simulgeo [5] package was used which allows for modelling of the opto-geometrical systems. This software is also capable of performing the full error propagation including correlations between various sub-components linked via common mechanical supports.
2.1 Results of the train simulations
Presented results were obtained assuming the intrinsic resolution of the CCD cameras and FSI lines equal to . The assumed precision of the clinometer was . The simulation was performed under the assumption that all calibration constants (positions and rotations of CCD cameras, beam splitters, FSI light sources and retro-reflectors) are known to the accuracy of for positions and for angles.
The long-distance operation of the train inside the accelerator tunnel was simulated by a set of many identical trains displaced by (distance between stops), each pair of them coupled via 5 overlapping wall markers. Simulgeo calculations provide very precise results (taking into account correlations between subcomponents of the system) based on the exact opto-geometrical model of the survey procedure. However, from the numerical point of view, such an approach, manipulating large matrices, is very time and memory consuming. The 20 train stop results ( tunnel section) were obtained after 34 hours of CPU time using RAM memory on a machine (the rank of the used matrix was of the order of ). The numerical complexity of these calculations scale like , where is the number of involved coordinates. The simulation of the full tunnel section would require more then 7 weeks of CPU time.
2.2 Random walk model
To overcome the above mentioned limitations a simplified analytical formula inspired by a random walk model was derived to extrapolate the Simulgeo predictions over long tunnel sections:
| (1) |
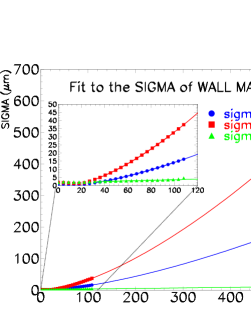
where is the wall marker number, is the effective length of the ruler (here: distance between cars), and the corresponding errors are the parameters of the random walk: is the angular error, are the transverse errors and is the longitudinal error. In this approach the procedure of accelerator alignment resembles the construction of a long straight line using short ruler. The overall error is a convolution of the precision of the ruler and the precision of the placement of the ruler with respect to the previous measurement. The asymptotic behaviour of the formulae from equation no. 1 is: , and . This fast growth of errors (especially for transverse directions) is a consequence of the fact that the errors are highly correlated and the precision of the element depends on the precision of all previous points.

|
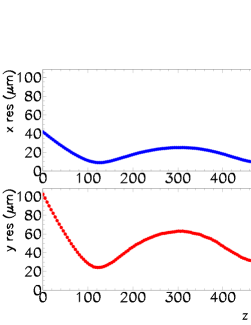
Formulae 1 were fitted to the Simulgeo points determining , , and then extrapolated over a tunnel section (fig. 2 left plot). The obtained predictions refer to the precision of the placement of the accelerator component with respect to the first one. However this is not the ultimate measure of the quality of the accelerator alignment. The relevant parameter is the mean deviation of each component from the ideal straight line which can be expected from the above procedure. To obtain the final prediction on the deviation of the alignment from the straight line a series of random walk trajectories was generated using the parameters fitted to the Simulgeo points (fig. 2 middle column). A straight line was fitted to each trajectory and the corresponding residua were calculated. The extracted RMS values of the residua distributions for each marker along provide the measure of the accuracy of the whole procedure. Because of high correlation between errors for and marker the generated trajectories exhibit much smaller oscillations that would be expected from completely random process. Figure 2 (right column) summarises the results obtained in this analysis demonstrating that the vertical precision of the order of over is feasible.
2.3 Spectral analysis of the alignment trajectories
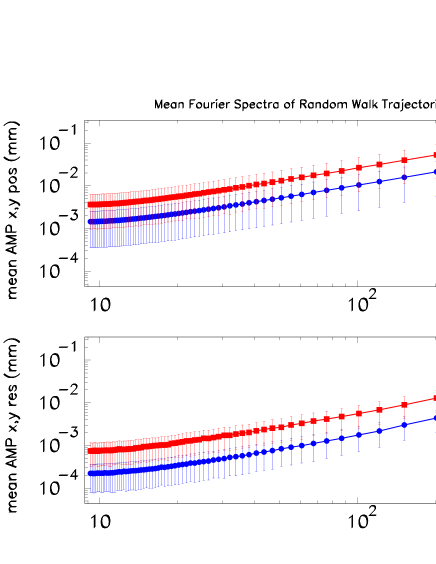
In order to study the spectra of the alignment trajectories obtained form the LiCAS Random Walk model the Fast Fourier Transformation (FFT) was performed. In figure 3 the mean values of the position and residua amplitude for several Monte Carlo generations is presented for tunnel section. The spectra are dominated by the long wave length components reaching the amplitude of about at . In the future more realistic model should also include the white noise component from the short distance ’stake out’ measurements.
 |
References
-
[1]
Slides:
http://ilcagenda.linearcollider.org/contributionDisplay.py?contribId=281&sessionId=90&confId=1296 - [2] P.A. Coe, D. F. Howell and R. B. Nickerson “Frequency scanning interferometry in ATLAS: remote, multiple, simultaneous and precise distance measurements in a hostile environment”, Meas. Sci. Technol. 15 (2004) 2175-2187.
- [3] A.F. Fox-Murphy et al., “Frequency scanned interferometry (FSI): the basis of the survey system for ATLAS using fast automated remote interferometry”, Nuclear Instruments and Methods in Physics Research A 383 (1996) 229-237.
- [4] “TESLA, The Superconducting Electron-Positron Linear Collider with an Integrated X-Ray Laser Laboratory”, Technical Design Report, DESY 2001-011.
- [5] L. Brunel, “SIMULGEO: Simulation and reconstruction software for optogeometrical systems”, CERN CMS Note 1998/079.