Discovery of a galactic wind in the central region of M100
Abstract
We report the discovery of a galactic wind in the central region of the galaxy M100. This result is based on a careful 2D spectroscopic study performed on observations made with the fibre system INTEGRAL on the WHT. The primary evidence of the wind is the presence of blueshifted interstellar NaD absorption lines. The velocity field of the absorbers show a clear rotation pattern but globally blueshifted ( -115 km/s) with respect to the systemic velocity of the galaxy. The emission lines also present a blueward component arising from the ionized gas phase of the galactic wind. The velocity field of the ionized gas wind component shows no evidences of rotation but exhibits a pattern that can be interpreted in terms of the projection of an outflowing cone or shell. The wind component has [NII]/H ratios of about 1.8, typical of shock ionization. The ionized component of the wind can be identified with an expanding shell of shocked gas, and the neutral component with disk gas entrained in the wind at the interface of the expanding shell with the galactic ISM. The galactic wind seems to be driven uniquely by the nuclear starburst. Our analysis indicates that a non negligible fraction of the wind material might escape to the IGM. In this case, if the wind detected in M100 were representative of similar phenomena in other galaxies with low to moderate activity, the current estimates of metal and dust content of the IGM might be drastically underestimated.
keywords:
galaxies: individual: M100 – galaxies:ISM – ISM: jets and outflows.1 Introduction
Galactic winds are one of the main mechanisms by which galaxies expel metals, dust, cosmic rays, magnetic fields, etc, to the intergalactic medium. This feedback makes winds an important phenomenon in our global understanding of galaxies. These winds are usually associated to galaxies with strong nuclear activity or with starbursts (see Veilleux et al., 2005, and references therein) which are powerful enough to feed the winds. But very little is known of this phenomenon in quiescent, inactive galaxies. In this paper, we explore this phenomenon in a relatively quiet galaxy. M100 is a nearby (D=16.1 Mpc) galaxy with low nuclear activity (cataloged as transition LINER/HII by Ho et al., 1997) and a moderate star formation rate of a few solar masses per year (according to its IR luminosity of , Sanders et al., 2003). Despite this apparent quiescence, we will show that this galaxy presents an unexpected fast wind emanating from its nuclear region.
Winds have been studied in highly inclined galaxies where the extraplanar gas can be directly seen through imaging of the emission lines of the ionized gas (see Veilleux et al., 2005). This technique has the inconvenient of lacking information on the kinematics of the outflow. Alternatively, winds have also been studied through detection in the spectra of a blueshifted component in some interstellar absorption lines (see for example Heed no recibe paquetesckman et al., 2000; Rupke et al., 2005; Martin, 2006). This latter approach lacks spatial resolution, and consequently does not provide information on the wind geometry. We have taken a new approach by using integral field spectroscopy, which combines spectroscopic and imaging techniques. We are therefore able to detect absorbing material throughout the field of view and to produce a map of the distribution and kinematics of the absorbers. In addition, we have been able to discriminate kinematically the ionized component of the outflowing material and to produce maps for the distribution and kinematics of this hotter phase of the wind. This approach provides a unique simultaneous global view of these two phases of a galactic wind.
2 Observations and Data Analysis
The data analyzed in this paper were obtained on 2002 March 16 at the Observatorio del Roque de los Muchachos on La Palma with the fibre system INTEGRAL (Arribas et al., 1998) at the William Herschel Telescope. The observational setup and basic data reduction are detailed in Castillo-Morales et al. (2007). We only mention here the aspects more relevant to the present work. The observed spectral range (5600-6850 ) contains a few strong interstellar emission lines (, [NII], [SII]) as well as several stellar absorption lines (NaD doublet and weaker, mostly blended FeI and CaI lines).
A first inspection of the spectra in the fibres with the highest S/N reveals an unusual ratio of the NaD absorption doublet with respect to the other stellar lines, with the NaD lines being deeper than expected (see Fig. 1 in Castillo-Morales et al., 2007). The most straightforward explanation for this is contamination by interstellar NaD absorption. We therefore proceed to separate the stellar and interstellar components in the fibre spectra. We use a synthetic stellar population of 1 Gyr with solar metallicity to subtract the stellar component of the spectra (see Castillo-Morales et al., 2007, for a detailed explanation). This synthetic spectrum is used as a template to fit the spectrum of each fibre. The free parameters in the fit are the velocity, velocity dispersion and (global) line strength. It is important to remove from the fitting the wavelength range containing the NaD doublet, as it is likely to be contaminated with interstellar absorption. The result of this procedure reproduces very well the stellar features in the spectra except for the NaD lines. The stellar template fits the redmost part of the NaD lines, leaving a strong interstellar residual which is clearly blueshifted with respect to the stellar component (see Fig. 1 in Castillo-Morales et al., 2007). The presence of blueshifted interstellar absorption lines is an unambiguous signature of outflowing material (see for example Rupke et al., 2005, and references therein). After subtraction of the stellar component, a spectrum of the interstellar material remains (with both, emission and absorption lines). We analyze these interstellar spectra throughout the rest of this paper.
3 Morphology and Kinematics of the Neutral Na I Phase
Most works on the study of outflows or galactic winds by means of the NaD absorption (e.g. Heed no recibe paquetesckman et al., 2000; Rupke et al., 2002; Schwartz & Martin, 2004; Martin, 2005, 2006; Rupke et al., 2005) do either select samples of objects where the NaD doublet is dominated by the interstellar component, or try to make a global rough correction for the stellar contribution. We present here a spatially resolved separation of these two components. With this aim, we apply the analysis described in section 2 to the spectra of the 2D collection obtained from the central region of M100, deriving full 2D maps of the distribution and kinematics of the absorbing material. A first result of this study is that regions where the NaD is dominated by the interstellar component coexist in the same galaxy with regions where the stellar component is dominant and there is very little, if any, cold interstellar absorbing gas. We would like to point out at this point that 2D spectroscopy has been critical in detecting the wind thanks to its ability to isolate the locations where interstellar absorption is relevant. Indeed, the wind might have been unnoticed in a spectrum taken in a large aperture where stars dominate the NaD absorption.
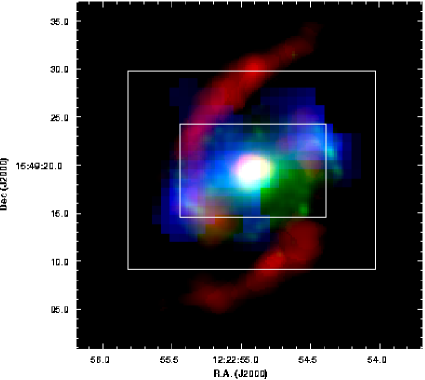
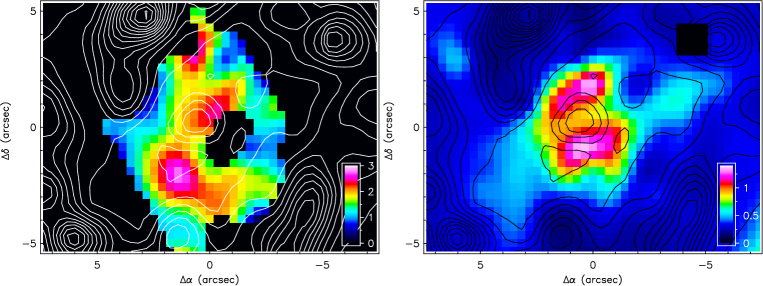
In Fig. 1 we present the equivalent width map for the interstellar NaD doublet, which ranges between 800 and 2100 throughout the field of view (lower values of the EW have been masked out). The distribution of NaI in the map is clearly elongated along the bar position angle (Knapen et al., 1995) with a central maximum and two knots. The central maximum coincides with the nuclear starburst and the location of the two knots matches that of the NIR knots corresponding to active star forming regions. These knots are also related to two strong concentrations of absorbing material at these locations that are clearly seen in the CO map (from Sakamoto et al., 1995). With the exception of these knots, most of the gas responsible for the NaD absorption is concentrated in the region interior to the star formation ring.
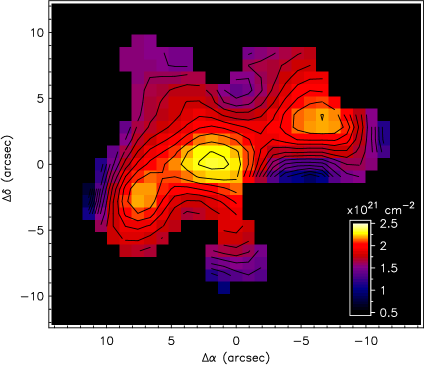
The determination of the column density of NaI from the spectra is, in general, not straightforward (see Martin, 2006, and references therein). In the case under study, the situation is worsened because the stellar component must be removed, which can seriously affect the shape of the final spectra. Thus, the fitting of optical depth and covering factor as performed by Rupke et al. (2005) might not be fully reliable for all spectra (particularly but not exclusively for those with relatively low S/N ratio). The equivalent width is much less affected by the above-mentioned effects and is therefore a more reliable estimator of the column density. We then estimate the column density of NaI from the equivalent width of the NaD doublet using a curve of growth technique. We have taken a hybrid approach for this purpose. In first place, we use a direct fitting as in Rupke et al. (2005) on a selected subset of high S/N spectra to estimate some average parameters of the redder, , line: covering fraction, , Doppler parameter, , and optical depth, . In a second step, we use these average values and the curve of growth to find the following relation between the NaI column density and the equivalent width of the NaD doublet: . Finally, to convert N(NaI) to hydrogen column density, we adopt the relation: with and from Stokes et al. (1978) as Rupke et al. (2002). The resulting map of hydrogen column density is shown in Fig. 2. From this map we have calculated the total hydrogen mass in the wind to be .
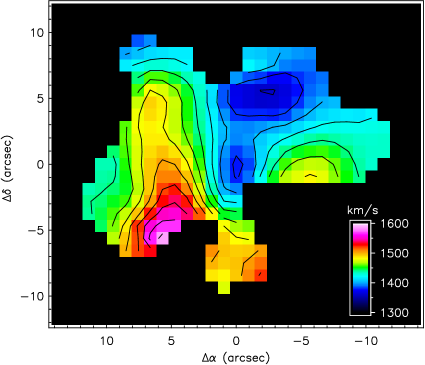
The velocity at each fibre is calculated by fitting two gaussians to the NaD doublet in the (stellar removed) spectra. Errors in the velocity determination range from 20 km/s to 70 km/s, with the highest errors occurring at the locations with the lowest EW. The velocity map of the absorbing gas (Fig. 3) presents a rotation pattern with a major kinematic axis orientation and velocity amplitude that clearly resembles that of the ionized gas in the disk (see Castillo-Morales et al., 2007). However, this rotation pattern is globally blueshifted with respect to the underlying ionized gas in the galactic disk ( 1567 km/s) by 115 km/s. The detection of this rotation pattern in the absorbing gas indicates that this neutral phase is very likely disk material that has been dragged upwards by the galactic wind, but that still keeps most of its angular momentum. It is probably material near the galactic disk, on the interface between the fast, hot gas filling the cavity, and the underlying quiescent gas in the galactic disk.
In order to measure the motion of the absorbing gas with respect to the underlying galaxy, we have subtracted the velocity field of the ionized gas in the disk (see Castillo-Morales et al., 2007) from the NaD velocity map. The resulting projected velocities range from -210 km/s to roughly -55 km/s with an average of -115 km/s.
4 Morphology, Kinematics and Physical Conditions of the Ionized Gas Phase
The distribution and kinematics of the ionized gas in the circumnuclear region of M100 has been extensively studied by several authors (see for example Castillo-Morales et al., 2007, and references therein). However, after our finding of a strongly blueshifted component in the neutral gas traced by the NaD lines, it is reasonable to wonder whether this outflowing gas has an ionized counterpart, and if this is the case, whether we can detect it. This detection has a major difficulty with respect to the neutral gas, namely, the fact that we see the outflowing material in front of the bright background galaxy. Fortunately, integral field spectroscopic data provides kinematical information, and we may try to kinematically discriminate these two ionized components (see for example Arribas & Mediavilla, 1993, 1994).
Visual inspection shows indeed a blue shoulder in the emission lines in many spectra taken with the SB3 and SB2 bundles (see, for instance, Fig. 4). Unfortunately, the spectral resolution with the SB3 fibre bundle is not high enough (4.8 ), and this blue shoulder is only visible in a few fibres. The SB2 bundle offers a much better (2.8 ) spectral resolution, and the line asymmetry is visible in many more fibres. We therefore perform this kinematical discrimination in the SB2 bundle only. In order to study this blueward component we try to fit two kinematical components to the emission lines of each spectra. To do this we simultaneously fit two sets of five spectral lines (, [NII], [SII]). We assume that, for each set, all these five lines have the same velocity and velocity dispersion. The theoretical 3:1 line ratio is fixed for the [NII] doublet. Fig. 4 shows the fit to a spectrum where the double component is clearly detected. A kinematical double component is said to be detected only if the five spectral lines are detected in the two sets and the reduced of the fit shows a significant improvement of at least 50% with respect to the fit to a single kinematical component. As a final check, each fit is inspected visually and in case of doubt a single component is kept. When this procedure is finished, there is still some ambiguity at some positions on which of the two components belongs to the background galaxy and which to the outflow. Continuity in the produced maps (particularly in the velocity field of the background galaxy), and the higher velocity dispersion of the secondary component are used to discriminate between the two.


In Figs. 5, 6 we present the intensity and velocity maps corresponding to the wind component of the ionized gas phase. The spatial distribution of the ionized gas wind component is concentrated around the nuclear starburst (although somewhat elongated along the major axis) with a bright ridge that extends towards the SW and a few weaker patches. The central and SW ridge may be enhanced emission from the walls of the expanding shell seen in projection. The ionized component of the wind fills the region interior to the ring. If there is indeed an expanding shell in this region it could be possible that the star forming ring is somehow related to the wind.
The velocity field of the ionized gas shows no rotation pattern. Nevertheless, the velocity field of the underlying ionized gas in the galaxy disk has been subtracted to view the motion of the wind with respect to it. It is blueshifted in most locations if we make exception of a redshifted region in the N. The maximum blueshifted velocity is located in the nucleus and on a ridge extending from the S to the NW, which can be interpreted in terms of the projection of the walls of an outflowing cone or shell. These results are compatible with a bi-polar outflow (in which case we could identify the region of receding velocities with the dimmed wind on the far side of the galaxy).
The wind component has [NII]/H ratios in the 1.2 to 2.7 range and [SII]/H in the 0.4 to 1.5 range, typical of shock ionization. The galactic component shows lower values, with [NII]/H of 0.9 for the nucleus, and () for the region inside the star forming ring and of about 0.2 in this ring (see Fig. 7). This indicates that even for the galactic component, shock ionization is not negligible in the nucleus, and is even more important in the region inside the star forming ring. This region also shows the highest velocity dispersion (up to 100 km/s) of the region. Whether a hidden wind component sharing the disc kinematics is responsible for the high line ratio and velocity dispersion in the galactic component in this region around the nucleus, remains unclear. On the contrary, the ionization in the stellar formation ring appears not to be directly related to the wind.
The velocity dispersion of the ionized gas in the wind is in the range between 150 and 230 km/s, while for the galactic component this value is much lower, ranging between 50 and 100 km/s.
5 Discussion
In previous sections we have reported the discovery of an important wind in the central region of M100. This is certainly an unexpected finding, particularly because its extent () and velocity () are quite large for a galaxy with a moderate nuclear and/or star forming activity. In fact, the velocity of this wind is comparable to the values found by Martin (2006) for ULIRGs. We have estimated the total mass of gas in the wind to be of about . Although this value is about an order of magnitude lower than the values found by Martin (2006), we must keep in mind that ULIRGs are forming stars one hundred times faster. This comparison makes the wind in M100 even more spectacular and surprising.
Although the geometry of the wind is uncertain, our findings indicate that the galactic wind is most likely driven uniquely by the nuclear starburst. The presence of rotation in the kinematics of the absorbing neutral gas indicates that it is likely disk ISM near the plane that has been entrained by the wind at the interface with the hot expanding shell. The fact that we have not detected a rotation pattern in the wind component of the ionized gas, together with the high [NII]/H and [SII]/H ratios, indicates that this is shocked gas at the top and/or walls of the expanding shell. This scenario is also fully compatible with the irregular geometry of the extended continuum radio emission found by Filho et al. (2000), and the diffuse X ray emission reported by Immler et al. (1998). This new scenario also opens the possibility that the nuclear star forming ring in M100 is related to this wind, either by direct compression of the ISM at the edges of the shell, or by material of the wind falling down to the disk. In fact, Ryder et al. (2001) found evidence for sequentially triggered star formation in the ring of M100, compatible with this scenario.
Taking into account that we find projected velocities of up to 210 km/s and velocity dispersions of up to 220 km/s for the ionized gas, there is a non negligible fraction of the gas (with ) which might be able to escape the gravitational potential of the galaxy (taken from a singular isothermal sphere as in Rupke et al. (2002)). Although this rough estimate should be taken with caution, it indicates that winds of this type in the abundant galaxies with low nuclear activity may be very important in polluting the IGM with dust and metals. The relevant question then is: how representative is the wind in M100 of similar phenomena in other normal, relatively unactive galaxies?. This question can only be answered by observing a significant sample of low to moderate activity galaxies with the techniques used in this paper.
Acknowledgments
This paper has been supported by the “Secretaría de Estado de Política Científica y Tecnológica” (AYA2004-08251-C02-02,ESP2004-06870-C02-02,AYA2006-02358). This research has made use of NED which is operated by the JPL, Caltech, under contract with NASA. We have used observations made with the NASA/ESA HST, obtained from the data archive at the STScI. J.J.V. acknowledges support from the Consejería de Educación y Ciencia de la Junta de Andalucía. A.C.M. acknowledges the support from the Ministerio de Educación y Ciencia. We also acknowledge the support of the RTN Euro3D: ”Promoting 3D spectroscopy in Europe”. We are grateful to the anonymous referee for valuable comments that have helped to improve the quality of the paper.
References
- Arribas & Mediavilla (1993) Arribas S., Mediavilla E. 1993, ApJ, 410, 552
- Arribas & Mediavilla (1994) Arribas S., Mediavilla E. 1994, ApJ, 437, 149
- Arribas et al. (1998) Arribas S. et al. 1998. Proc. SPIE, Vol. 3355, p.821. Optical Astronomical Instrumentation. D’Odorico S., Ed.
- Bingham et al. (1994) Bingham R. G., Gellatly D. W., Jenkins C. R., Worswick S. P., 1994. Proc. SPIE, Vol. 2198, p.56. Instrumentation in Astronomy VIII. Crawford D. L & Craine E. R. Eds.
- Castillo-Morales et al. (2007) Castillo-Morales A. Jiménez-Vicente J., Mediavilla E., Battaner E. 2007, MNRAS in press
- Filho et al. (2000) Filho M. E., Barthel P. D., Ho L. C. 2000, ApJS, 129, 93
- Heed no recibe paquetesckman et al. (2000) Heckman T. M., Lehnert M. D., Strickland D. K., Armus L. 2000, ApJS, 129, 493
- Ho et al. (1997) Ho L. C., Filippenko A. V., Sargent W. L. W. 1997, ApJS, 112, 315
- Immler et al. (1998) Immler S., Pietsch W., Aschenbach B. 1998, A&A, 331, 601
- Knapen et al. (1995) Knapen J. H., Beckman J. E., Shlosman I., Peletier R. F. Heller C.H., de Jong R. S. 1995, ApJ, 443, L73
- Martin (2005) Martin C. L. 2005, ApJ, 621, 227
- Martin (2006) Martin C. L. 2006, ApJ, 647, 222
- Rupke et al. (2002) Rupke D. S., Veilleux, S., Sanders, D. B. 2002, ApJ, 570, 588
- Rupke et al. (2005) Rupke D. S., Veilleux, S., Sanders, D. B. 2005, ApJS, 160, 87
- Ryder et al. (2001) Ryder S. D., Knapen J. K., Takamiya M. 2001, MNRAS, 323, 663
- Sanders et al. (2003) Sanders D. B., Mazzarella J. M., Kim, D.-C., Surace J. A., Soifer B. T. 2003, AJ, 126, 1607
- Sakamoto et al. (1995) Sakamoto K., Okumura S., Minezaki T., Kobayashi Y., Wada, K. 1995, AJ, 110, 2075
- Schwartz & Martin (2004) Schwartz C. M., Martin, C. L. 2004, ApJ, 610, 201
- Stokes et al. (1978) Stokes G. M. 1978, ApJS, 36, 115
- Veilleux et al. (2005) Veilleux S., Cecil G., Bland-Hawthorn J. 2005, ARAA, 43, 769