1–4
The Fundamental Plane of Bulges at Intermediate Redshift
Abstract
We report on a new study aimed at understanding the diversity and evolutionary properties of distant galactic bulges in the context of well-established trends for pure spheroidal galaxies. Bulges have been isolated for a sample of 137 spiral galaxies in the GOODS fields within the redshift range 0.1 1.2. Using proven photometric techniques we determine for each galaxy the characteristic parameters (size, surface brightness, profile shape) in the 4 GOODS-ACS imaging bands of both the disk and bulge components. Using the DEIMOS spectrograph on Keck, precision stellar velocity dispersions were secured for a sizeable fraction of the bulges. This has enabled us to compare the Fundamental Plane of our distant bulges with that of field spheroidal galaxies in a similar redshift range. Bulges in spiral galaxies with a bulge-to-total luminosity ratio () 0.2 show very similar patterns of evolution to those seen for low luminosity spheroidals. To first order, their recent mass assembly histories are equivalent.
keywords:
galaxies: bulges, galaxies: formation, galaxies: evolution, galaxies: high-redshift1 Introduction
Significant progress has been made recently about the mass dependence of the evolution of the field spheroidal (E/S0) galaxy population via Fundamental Plane (FP) analyses to 1 (\egTreu et al. 2005, hereafter T05; van der Wel et al. 2005). Whereas the most massive spheroidal galaxies support the long-held view of early collapse and subsequent passive evolution, a surprising amount of recent star formation (SF) is necessary to explain the scatter and FP offsets for lower mass galaxies. T05 find that as much as 20–40% of the present dynamical mass in systems with 10 formed since 1.2.
Meanwhile, the evolutionary history of galactic bulges, a key issue in the origin of the Hubble sequence, remains poorly understood. Originally thought to form at high- through dissipationless collapse, their continued growth, as predicted in hierarchical models, is consistent with the diversity observed in their present-day stellar populations. Local data alone, however, cannot distinguish between quite different hypotheses for bulge formation, including dynamical rearrangement of disk material triggered by interactions and the evolution of bars. Bulges grown in this way would show different evolutionary trends than those of isolated elliptical galaxies. FP observations at a range of epochs could thus distinguish between the different formation scenarios.
A first glimpse at the photometric properties of bulges at intermediate redshift was presented by Ellis, Abraham, & Dickinson (2001, hereafter EAD), who examined aperture colors of bulges in 68 isolated spirals with 24 in the Hubble Deep Fields. EAD found a remarkable diversity in bulge colors over the redshift range 0.3 1, with few as red as a passively-evolving track that matches the integrated colors of luminous spheroidal (E/S0) galaxies. They concluded that bulges have experienced recent periodic episodes of rejuvenation consistent with 15–30% growth in stellar mass since 1. These conclusions were challenged by Koo et al. (2005) who located 52 luminous ( 24) bulges at 0.8 in the Groth Strip Survey for which a more elaborate photometric decomposition was undertaken to isolate the bulge component. They found that 85% of their field sample had uniformly red colors consistent with passively-evolving coeval systems. Only a minority (8%) showed blue rest-frame colors of which a majority occurred in interacting or merging systems. It is important to note, however, the differences between the samples of these two analyses: EAD select on total galaxy magnitude and thus sample the full Hubble sequence of spirals; Koo et al. select on bulge luminosity and thus only sample the brightest (massive) end of the bulge luminosity function. If bulges indeed follow the same trends as a function of mass as seen in spheroidals, the early discrepancies are not surprising. Here we report on progress of a study aimed at illuminating the relationship between bulges and spheroidals by extending the color-based studies with kinematics and adding galaxy bulges to the FP studies (MacArthur et al. in prep.).
2 Sample & Data
The galaxies for this analysis are selected from the GOODS fields for which deep imaging in four Hubble Space Telescope Advanced Camera for Surveys (HST-ACS) passbands are available (Giavalisco et al. 2004). For our FP analysis, the spectroscopic sample is drawn from two campaigns using the DEIMOS spectrograph on Keck; (i) that of T05, who secured high spectra of a magnitude-limited ( 22.5) sample of isolated spheroidal galaxies in GOODS-North spanning 0.1 1.2, and (ii) a later 2005 campaign dedicated to increasing the spiral sample for the current project, also limited at 22.5, yielding a further target sample of 45 spirals in GOODS within 0.1 0.7.
For all galaxies, 1D surface brightness (SB) profiles are extracted from the ACS images and modeled either as single component Sérsic (generalized Gaussian) profiles or, when a disk component is evident, are decomposed simultaneously into bulge and disk components using the techniques outlined in MacArthur, Courteau, & Holtzman (2003). We model the disk light with a pure exponential function and the bulges with a Sérsic profile. An example of our B/D decomposition is shown in Fig. 1 [middle panel].
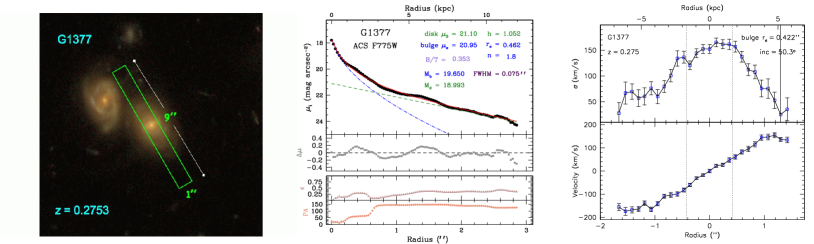
Velocity dispersion and rotation profiles were measured using the well-tested Gauss-Hermite Pixel Fitting algorithm of van der Marel (1994). Precision central velocity dispersions, , were secured for 181 galaxies in T05 and for 23 spiral bulges in the second campaign. An example of our derived kinematics is shown in the right panels of Fig. 1. We standardize the s to an aperture of according to the relation derived from early-type galaxy kinematic profiles of Cappellari et al. (2006). Finally, to minimize disk contamination to the measured kinematics, we limit our FP sample to spheroids residing in galaxies with 0.2, leaving us a total sample of 56 single- and 91 two-component galaxies at 0.1 1.2. Throughout we adopt a flat cosmology with = 0.3, = 0.7, H = 65 km s Mpc, and the AB magnitude system.
2.1 Observed Colors
Regarding the diversity in observed colors for our sample, we find that most of the single component galaxies are red and consistent with a single burst model with 3. On the other hand, the spiral bulges scatter strongly to the blue, consonant with EAD’s findings. Unlike EAD, however, we do see a few bulges that are at least as red as some of the E/S0s. These red bulges could be akin to those observed by Koo et al..
The question thus arises whether we are looking at two different populations each following a distinct formation path, or rather a more continuous mode of spheroid building, with the massive ellipticals generally being at a later stage of their evolution. Rephrased, we can ask whether bulges and E/S0s at a given mass are consistent with each other in terms of their evolutionary paths. To address this issue, we now consider the combined set of dynamical and photometric information.
3 Fundamental Plane Evolution
The FP is traditionally given as a relation between a galaxy’s effective radius, , the average SB within , SBe, and the central velocity dispersion, . In order to evaluate evolutionary trends as a function of ratio, it is necessary to convert these measured parameters into masses. An effective dynamical mass can be defined using the scalar virial theorem for a stationary stellar system as , where is the virial coefficient and is the Sérsic shape parameter. In the case of structural homology, the virial coefficient is a constant for all galaxies and the FP maps directly into a ratio (\egT05). However, in the case of varying , the profile shape does affect the through a variation in the profile. Several studies have constructed dynamical models to derive for different profile shapes with generally consistent results. We use the derivation of Trujillo et al. (2004, hereafter Truj04), who developed non-rotating isotropic spherical models accounting for the projection of over an effective aperture.
For the purpose of assessing evolutionary trends, we must have a local relation (at = 0) against which to compare higher- galaxies. As far as we are aware, the only analysis to date that provides a suitable local relation taking into account the varying profile shapes is that of Truj04. Their FP sample includes 45 local cluster ellipticals drawn from the literature. Converting the Truj04 relation to the units and cosmology used here their local relation reads, = 0.091 + 0.063, and we measure the offset for galaxy as, = .
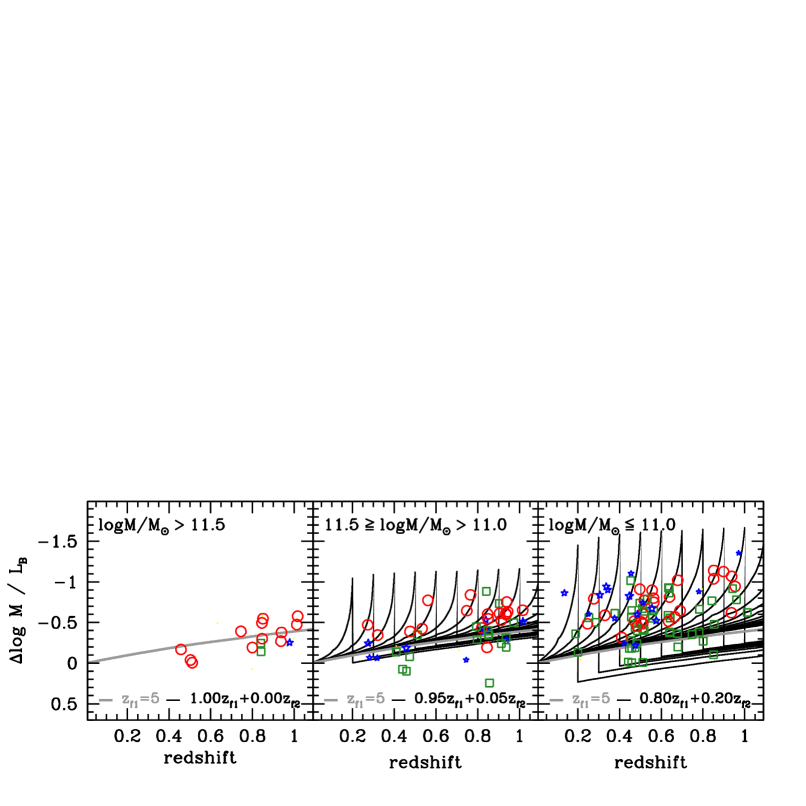
Figure 2 plots as a function of redshift, divided into three spheroid mass bins. This representation can be interpreted in terms of SF histories in an analogous manner to T05 (Fig. 21). Over-plotted are evolution models from Bruzual & Charlot (2003; see caption for details). The most massive spheroids (including E/S0s and bulges) are well described by an old population formed in a single burst. In the lower mass bins, however, many galaxies deviate significantly from this relation. This can be explained as more recent spheroid building via subsequent bursts of SF on top of an underlying old population, where the old population dominates the total stellar mass. The black lines in the two lower mass bins represent the evolution for such models. For the intermediate mass range, the data are consistent with a more recent burst of SF that represents 5% of the total stellar mass, and in the lowest mass bin, recent bursts involving up to 20% of the total mass are required. Due to the short timescales of the initial decline after a burst of SF, these mass fraction estimates are likely underestimates. Broadly speaking, it appears that the bulges follow a similar relation to that defined by the E/S0s at the same redshift. In particular, there is no evidence of an offset to lower ratios (due to increased -band luminosity) which may be expected if the bulges are undergoing a more continuous mode of SF, as is expected in the secular formation scenario.
We thus conclude that all spheroids at a given mass, and whose luminosity contributes at least 20% of the total galaxy light, appear to follow the same evolutionary path. Lower mass spheroids must have had more recent stellar mass growth, so the recent observations of “downsizing” in spheroidal galaxies (\egBundy et al. 2005) extends to the bulges of spiral galaxies.
Acknowledgements.
We would like to thank the conference organizers for putting together such a stimulating and informative meeting. L.A.M acknowledges partial financial support from NSERC.References
- [Bruzual & Charlot(2003)] Bruzual, A. G. & Charlot, S. 2003, MNRAS, 344, 1000 [BC03]
- [Bundy et al.(2005)] Bundy, K., Ellis, R. S., & Conselice, C. J. 2005, ApJ, 625, 621
- [Cappellari et al.(2006)] Cappellari, M., et al. 2006, MNRAS, 366, 1126
- [Ellis et al.(2001)] Ellis, R. S., Abraham, R. G., & Dickinson, M. 2001, ApJ, 551, 111 [EAD]
- [Giavalisco et al.(2004)] Giavalisco, M., et al. 2004, ApJ, 600, L93
- [Koo et al.(2005)] Koo, D. C., et al. 2005, ApJS, 157, 175
- [MacArthur, Courteau, & Holtzman(2003)] MacArthur, L. A., Courteau, S., & Holtzman, J. A. 2003, ApJ, 582, 689 [Mac03]
- [Treu et al.(2005)] Treu, T., et al. 2005, ApJ, 633, 174 [T05]
- [Trujillo et al.(2004)] Trujillo, I., Burkert, A., & Bell, E. F. 2004, ApJ, 600, L39 [Truj04]
- [van der Marel(1994)] van der Marel, R. P. 1994, MNRAS, 270, 271
- [van der Wel et al.(2005)] van der Wel, A., et al. 2005, ApJ, 631, 145