Fluctuations and Rheology in Active Bacterial Suspensions
Abstract
We probe non-equilibrium properties of an active bacterial bath through measurements of correlations of passive tracer particles and the response function of a driven, optically trapped tracer. These measurements demonstrate violation of the fluctuation-dissipation theorem and enable us to extract the power spectrum of the active stress fluctuations. In some cases, we observe scaling in the noise spectrum which we show can be derived from a theoretical model incorporating coupled stress, orientation, and concentration fluctuations of the bacteria.
pacs:
82.70.Dd, 83.60.Bc, 5.40.-a,87.17.Jj,87.18.HfActive complex fluid systems such as living cells Bursac ; Lau , assemblies of motors and filaments Furst , flocks of birds Toner , and vibrated granular media Narayan differ from conventional equilibrium media in that some of their components consume and dissipate energy, thereby creating a state that is far from equilibrium. An understanding of model active systems, even at a phenomenological level, provides insight about fundamental non-equilibrium statistical physics and, potentially, about the inner workings of biological systems. Bacterial baths Berg ; Wu ; Soni ; Tuval ; gregoire are attractive model active systems because energy input is homogeneous, because individual bacteria can be directly observed, and because critical parameters such as density, activity, and swimming behavior Berg can be brought under experimental control. Indeed, recent experiments have reported on a rich variety of non-equilibrium phenomena in this system class including anomalous diffusion Wu and pattern formation Tuval ; Park , while recent theories of self-propelled organisms predict ordered phases such as “flocks” Toner , their instabilities Simha , novel rheological effects Hatwalne , and giant density fluctuations Chate .
In this Letter, we describe measurements of the fluctuations and mechanical responses of an active bacterial suspension. In contrast to previous work Tuval ; Wu ; Soni , we concurrently measure the one- and two-point correlation functions of embedded passive tracer particles to assess material fluctuations over a wide range of length scales Crocker , and we independently measure the macroscopic response function of the “active” medium by displacing a particle through it with an optical trap Hough . Even at a low volume fraction () of bacteria, fluctuations in the medium are substantially greater than they are in the absence of bacteria while rheological response is unchanged, implying a strong violation of the fluctuation-dissipation theorem (FDT). The mean-square displacements (MSDs) of tracer particles as a function of time , depend on swimming behavior. For wild-type bacteria, the MSD extracted from two-point correlations scale superdiffusively as for the time scale of our experiments, and the stress power spectrum Lau as a function of frequency scales as . Existing theories of active media Simha predict long-time tails and anomalous corrections to diffusion but not superdiffusion. We propose a theoretical model, following Ref. Hatwalne , that accounts for our experimental observations.
We used two strains of E. coli, a rod-shaped bacterium with dimensions , in these studies: RP437, the “wild-type”, which runs and tumbles Parkin and RP1616, the “tumbler”, which predominantly tumbles Alon . Overnight cultures were diluted 1/300 in Luria Broth (Difco) and grown at for 6 hrs. Subsequently, they were centrifuged for 10 minutes at 5000 rpm and resuspended to the desired concentration in a buffer comprised of 10 mM K2HPO4, 0.1 mM EDTA, and 0.2 wt % glucose (pH = 8.2), which was added to maintain bacterial motility. We added a small amount () of fluorescently labeled polystyrene spheres (Duke Scientific) of radius to the bacterial suspension, and to density match them, we added 15 wt % sucrose to the solution. To prevent bacterial adhesion, we prepared the chambers from BSA coated glass slides and coverslips. We used parafilm spacers to bring the thickness of the chambers to ; and we recorded quasi-2D image slices from the middle of the 3D chamber. Samples were loaded into the chamber and sealed with optical glue just prior to each run.
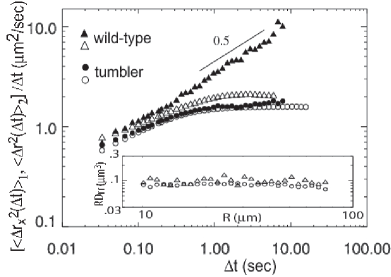
We quantified the fluctuations in the bacterial bath by computing MSDs from the motions of embedded micron-sized tracers Crocker . The one-point displacement (MSD1) is defined by , where is the particle displacement in the direction in time , and the brackets denote time and ensemble averaging. The two-point displacement (MSD2) is defined as , where is the longitudinal component of the two-point tensor , which measures correlations of two distinct particles with an initial separation . Over the time scale of our experiments, lies in the focus plane of our microscope and its magnitude is greater than that of individual particles’ displacements. The main advantage of two-point microrheology is that it provides a more reliable measure of length scale dependent fluctuations in media where the length scale of heterogeneities and tracer boundary conditions are not a priori known Crocker ; Lau . Indeed, since is ensemble averaged over tracer pairs with , it reflects the dynamics of the medium on larger length scales than the tracer size, permitting quantitative measurements even in the presence of heterogeneities. In general, MSD2 will equal MSD1 if heterogeneities in the medium have length scales smaller than the tracer size, otherwise they will differ in both magnitude and functional form.
Typical MSD data are presented in Fig. 1, which shows that the one-point MSD in both bacterial strains displays a crossover from superdiffusive behavior at short lag times () to diffusive behavior () at long lag times. This observation is similar to that of Ref. Wu . However, our two-point data for the wild-type, by contrast, exhibit a nearly power-law superdiffusion () over 2.5 decades of observation time. We also verified that (see inset of Fig. 1), indicating that the bacterial bath, though an active medium, can be treated on the separation scale as a coarse-grained continuum whose properties can be probed with two-point microrheology Lau ; Crocker . That MSDs exhibit superdiffusion is suggestive of but not a proof of violation of FDT, which requires an independent measurement of the rheological response function.
Response measurements were performed using an oscillating optical tweezer setup similar to that of Ref. Hough . Briefly, an optical trap with typical trap stiffness of was formed by focusing an mW laser beam () through a 1.3 NA oil immersion objective (Zeiss). The trapping beam position was sinusoidally scanned using a galvo-mirror at frequencies from 0.5 to 500 Hz. A 4.0 PS sphere was trapped from the coverslip. The position of the tracer was detected using forward scattered light from a co-linearly aligned HeNe laser beam focused onto a split photodiode (Hamamatsu S4204). The photodiode signal was fed into a lock-in amplifier (Stanford Research Systems 530) along with the reference from the driving function generator signal. The displacement and phase of the trapped particle output by the lock-in amplifier were logged into a PC running LabView (National Instruments).
The equation of motion for a particle of radius trapped in an oscillating harmonic potential may be written as: , where is the viscosity of the medium, is the stiffness of the trap, and is the driving amplitude. Its steady state solution yields the normalized displacement of the sphere in the trap: .
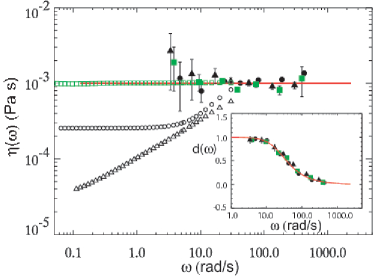
The inset of Fig. 2 shows the raw normalized displacement data for a particle in water and for a particle in an active bacterial bath (RP1616). The solid line is a fit to with , trap stiffness , and radius m. Both sets of experimental data agree with each other and with the theoretical curve. From them, we extract the viscosity shown in the main graph of Fig. 2. Clearly, the presence of actively swimming bacteria at volume fraction does not modify the viscosity of the medium from that of water, . We measured the same using a capillary viscometer.
While recent theories of active systems predict novel enhancement in the viscosity Hatwalne , our experiments are well below the concentration at which these effects are observable. Instead, our results are consistent with the Einstein result for hard spheres: , namely, a negligible modification in the viscosity for . Moreover, assuming for the moment the generalized Stokes-Einstein relation, we can extract the (FDT consistent) response from the collapsed two-point displacement (MSD2) Crocker : , as shown in Fig. 2. The difference between and explicitly indicates a strong violation of FDT.
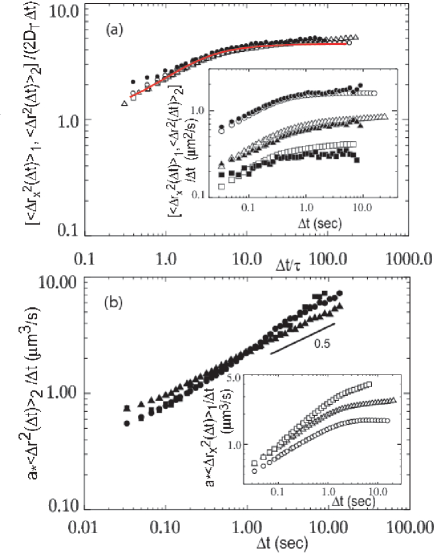
Next, to access the heterogeneity of the bacterial bath, we explored the length-scale dependence of fluctuations by systematically varying the size of the tracers at a fixed bacterial concentration. The inset of Fig. 3a shows MSDs obtained for spheres in the tumbler bath. All samples and all tracer sizes exhibit a crossover from superdiffusion to diffusion on similar timescales, with an enhanced diffusion coefficient , where and is the equilibrium coefficient. Moreover, MSD1 and MSD2 are nearly equal in magnitude and functional form. Rescaling time by the crossover time and the MSDs by collapses all the data onto a master curve: , where . Figure 3a shows the collapsed MSD data along with the master curve with .
The MSDs for the wild-type are strikingly different: the MSD1 exhibits a crossover dependent on tracer size, while all of the MSD2 exhibit superdiffusion with nearly the same exponent of over 2.5 decades of time, independent of the tracer size. The trivial rescaling collapsed the respective MSD2 data [Fig. 3b]. Under this rescaling, however, (and other simple scaling functional forms as well) the wild-type MSD1 failed to collapse [inset of Fig. 3b], signaling the presence of heterogeneity on the tracer length scale. The superdiffusive exponent of the MSD1 approaches that of the two-point data () as increases. This suggests that one-point measurements are intrinsically ambiguous: the activity inferred depends on the tracer size and boundary conditions Lau ; Chen . Two-point measurements, in contrast, provide a more robust characterization of the long-wavelength fluctuations of the medium than one-point measurements.
We employ a recently developed phenomenological theoretical framework for an active medium to interpret the experimental MSD data Lau . The bacterial activity gives rise to non-thermal stress fluctuations whose power spectrum can unambiguously be extracted from two-point microrheology data via
| (1) |
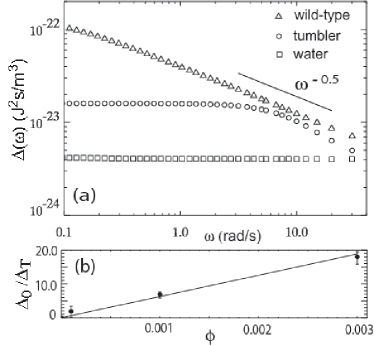
The results are exhibited in Fig. 4a. For water, the power spectrum is flat. For the tumblers, it is nearly Lorentzian, flat at low frequencies with a knee at higher frequencies. For wild-types, it exhibits power-law behavior, , over 2.5 decades. In both cases, is substantially greater than in a thermal system. For the wild-type, the prefactor of rises linearly with the bacterial concentration, as shown in Fig. 4b.
We propose a simple model to account for the observed spectra of the tumblers and the wild-types within the theoretical framework of Ref. Hatwalne . In the process of tumbling or swimming, each bacterium contributes an additional active stress to the medium. It has the form: , where is the concentration of the bacteria and is a force-dipole density generated by the active bacteria. In wild types and tumblers, forces are directed, respectively, along and perpendicular to the long-bacterial axes. Thus, in wild-types, is equal to the uniaxial nematic order parameter whereas in tumblers, it is equal to a biaxial order parameter . Active processes enhance stress fluctuations, and assuming long-range isotropy, the active stress fluctuations can be expressed as for both tumblers and wild-types. The power spectrum in Eq. (1) is related to by .
The linearized equation for () is , where is the relaxation time, the correlation length of , and is a spatial-temporal white noise with zero mean. Interactions among bacteria favor long-range order in but not in , implying that and . In both cases, the concentration of bacteria obeys the continuity equation: with , where is the average concentration, is the diffusion constant, is a random current, and the second term stems from the nonequilibrium driving of mass flow Toner . These equations lead after Gaussian decoupling to with . In tumblers is very small, and can be replaced by a Lorentzian with characteristic time (Fig. 4) andy in both MSD1 and MSD2 implying agreement between and . In wild-types, can be replaced by in MSD2 when [with (see inset of Fig. 1)], but not in MSD1 when it probes lengths shorter than , implying different values for and [Fig. 1]. Our calculations yield for to lowest order in , in agreement with our experiments andy . This result arises essentially from the concentration fluctuations in the active stress, which were ignored in previous theories. Note also that one might expect that swimming bacteria have a tendency to develop long-range polar rather than the nematic order of our model, but we find that incipient polar order yields in clear disagreement with our measurements andy .
In conclusion, using a combination of passive 2-pt microrheology and active response measurements, we have demonstrated that the macroscopic stress fluctuations depend sensitively on microscopic swimming behavior of the bacteria. When contrasted with other active systems such as living cells, our results suggest that departures from equilibrium proceed via non-universal mechanisms.
We thank J.S. Parkinson for the bacterial strains used in the experiment. We thank B. Hoffman, J.C. Crocker, and P. Collings for stimulating discussions. This work has been partially supported by the NSF MRSEC (DMR-05-20020) and NASA (NAG8-2172).
References
- (1) B. Fabry et al., Phys. Rev. Lett. 87, 148102 (2001); P. Bursac et al., Nature Materials 4, 557 (2005).
- (2) A.W.C. Lau et al., Phys. Rev. Lett. 91, 198101 (2003).
- (3) D. Humphrey et al., Nature 416, 413 (2002); K. Kruse, et al., Phys. Rev. Lett. 92, 078101 (2004); A. Ahmadi et al., Phys. Rev. E 74, 061913 (2006); D. Mizuno et al., Science 315, 370 (2007).
- (4) J. Toner and Y. Tu, Phys. Rev. Lett. 75, 4326 (1995); J. Toner et al., Ann. Phys. 318, 170 (2005).
- (5) S. Ramaswamy et al., Europhys. Lett. 62, 196 (2003).
- (6) H.C. Berg, E. coli in Motion (Springer, New York, 2004).
- (7) X.-L. Wu and A. Libchaber, Phys. Rev. Lett. 84 3017 (2000); ibid, 86 557 (2001).
- (8) G.V. Soni et al., Biophys. J. 84, 2634 (2003).
- (9) C. Dombrowski et al., Phys. Rev. Lett., 93 098103 (2004); I. Tuval et al., Proc. Natl. Acad. Sci. 102, 2277 (2005).
- (10) G. Gregoire et al., Phys. Rev. Lett. 86, 556 (2001); Phys. Rev. E 64, 011902 (2001); Physica D 181, 157 (2003).
- (11) S. Park et al., Proc. Natl. Acad. Sci. 100 13910 (2003).
- (12) R. A. Simha and S. Ramaswamy, Phys. Rev. Lett. 89 058101 (2002).
- (13) Y. Hatwalne et al., Phys. Rev. Lett., 92, 118101 (2004).
- (14) H. Chaté et al., Phys. Rev. Lett. 96, 180602 (2006); S. Mishra and S. Ramaswamy, Phys. Rev. Lett. 97, 090602 (2006).
- (15) J.C. Crocker et al., Phys. Rev. Lett. 85, 888 (2000).
- (16) L.A. Hough and H.D. Ou-Yang, Phys. Rev. E. 73, 031802 (2006).
- (17) J.S. Parkinson, J. Bact., 135, 45 (1978).
- (18) U. Alon et al., EMBO J., 17, 4238 (1998).
- (19) D.T. Chen et al., Phys. Rev. Lett. 90, 108301 (2003).
- (20) A.W.C. Lau and T.C. Lubensky, unpublished.