Physical interpretation of the near-infrared colours of low redshift galaxies
Abstract
We use empirical techniques to interpret the near-infrared (near-IR) colours of a sample of 5800 galaxies drawn from Sloan Digital Sky Survey (SDSS) main spectroscopic sample with photometry from the UK Infrared Deep Sky Survey (UKIDSS) data release one. Our study focuses on the inner 3 arcsec regions of the galaxies sampled by the SDSS fibre spectra. We study correlations between near-IR colours measured within this aperture and physical parameters derived from the spectra. These parameters include specific star formation rate (SFR), stellar age, metallicity and dust attenuation. All correlations are analyzed for samples of galaxies that are closely matched in redshift, in stellar mass and in concentration index. Whereas more strongly star-forming galaxies have bluer optical colours, the opposite is true at near-IR wavelengths – galaxies with higher specific star formation rate have redder near-IR colours. This result agrees qualitatively with the predictions of models in which Thermally Pulsing Asymptotic Giant Branch (TP-AGB) stars dominate the and -band light of a galaxy following a burst of star formation. We also find a surprisingly strong correlation between the near-IR colours of star-forming galaxies and their dust attenuation as measured from the Balmer decrement. Unlike optical colours, however, near-IR colours exhibit very little dependence on galaxy inclination. This suggests that the correlation of near-IR colours with dust attenuation arises because TP-AGB stars are the main source of dust in the galaxy. Finally, we compare the near-IR colours of the galaxies in our sample to the predictions of three different stellar population models: the Bruzual & Charlot (2003) model, a preliminary version of a new model under development by Charlot & Bruzual, which includes a new prescription for AGB star evolution, and the Maraston (2005) model.
keywords:
galaxies: star formation history, near-IR, dust1 Introduction
Unlike optical colours, the near-IR colours of star-forming galaxies are poorly understood. The area and depth of sky covered by near-IR surveys has been steadily increasing in recent years, so it is important to understand the nature of the stars that contribute to the light emitted in the wavelength range from 1 to 2 m. This is necessary if near-IR magnitudes and colours are to be used as a tool to infer physical information about integrated stellar populations. As we will see in this paper, the near-IR colours of local spiral galaxies turn out to be very sensitive to stars that contribute almost no flux at optical wavelengths and that are difficult to model theoretically.
One of the first observational studies of the integrated optical/near-IR colours of star-forming galaxies was carried out by Aaronson (1978), who showed that galaxies lie along a well-defined morphological sequence in the colour plane in a similar manner to the well-known colour-morphology relation. Frogel (1985) studied the colours of 19 late-type spiral galaxy nuclei and showed that there was no correlation between their and colours. This implied that different stars contribute to the blue and the infrared light. It was proposed that the blue light was dominated by young stars and that the infrared light was dominated by an old and metal-rich stellar population similar to that found in elliptical galaxies.
Stellar population synthesis techniques can be used to predict which stars contribute most strongly to the near-IR luminosity of a galaxy as a function of its age. The results show that the near-IR fluxes of galaxies are dominated by cool stars on the red giant branch at ages greater than 1-2 Gyr and by stars located on the asymptotic giant branch (AGB) at younger ages. In the last phase of their evolution, the thermally-pulsing (TP) phase, low metallicity AGB stars are extremely bright and dominate the K-band light of a galaxy even though they are few in number. This evolutionary phase is very difficult to model and can be a source of considerable discrepancy between different population synthesis models (Maraston et al. 2006, Bruzual 2007).
It has been proposed that the combination of optical and near-IR photometry can break the well-known degeneracy between the effects of age and metallicity on the stellar populations of galaxies at optical wavelengths. The idea is that the optical colours are primarily sensitive to age, because the main contribution to the optical luminosity of a galaxy comes from upper main sequence and turn-off stars. On the other hand the near-IR colours ( and bands) are mainly determined by stars in the AGB phase at low metallicity and in the red giant branch stars (RGB) phase at high metallicity. Low metallicity carbon-AGB stars are one magnitude brighter in the -band than oxygen-rich M stars and the ratio of carbon-rich to oxygen-rich stars decreases sharply with increasing metallicity (Lee et al. 2007). Several studies have used the combination of near-IR and optical broad band colours to estimate the ages and metallicities of star-forming galaxies. Generally a maximum likelihood method is used to infer these parameters from the nearly orthogonal age-metallicity grids that are predicted using stellar population synthesis models.
De Jong (1996) analysed radial gradients in the B-V and -K colours of 86 face-on spiral galaxies and tested different hypotheses to explain their origin. His conclusion was that the colour gradients are best explained by a combined stellar age and metallicity gradient accross the disk, with the outer regions being younger and less metal-rich on average. Similar analyses have been conducted by Bell & de Jong (2000) and MacArthur et al. (2004) using samples of low inclination galaxies that span a range in Hubble type. They used -H/K versus B- colours to investigate age and metallicity gradients and showed that both age and metallicity are strongly correlated with local surface brightness. Studying elliptical and spiral galaxies, Mobasher et al. (1986) have highlighted that near-IR colours are particularly sensitive to metallicity. The most recent study has been performed by Wu et al. (2005) using a sample of 36 nearby early-type galaxies from the Sloan Digital Sky Survey. This study found that metallicity variations are responsible for the observed colour gradients in these systems.
These results have recently been challenged by Lee et al. (2007), who show that the orthogonal age-metallicity grids computed using the Bruzual & Charlot (2003) models become much more degenerate when more accurate treatments of TP-AGB stars and of convective core overshoot are included. However, even after these improvements, the models have difficulty in matching data on star clusters of known age and metallicity. Geller et al. (2006) also encountered difficulties when attempting to model the near-IR colours of interacting galaxies in close pairs. They found a subset of galaxies with much redder colours than could be explained by simple models and interpreted their results as evidence for extremely hot (600-1000 K) dust within compact star-forming regions.
In this paper, we adopt an empirical approach.
We combine broadband photometry from the UK Infrared Deep Sky
Survey (UKIDSS) data release one with optical photometry from
Sloan Digital Sky Survey (SDSS) fourth data release. We calculate optical
and near-IR colours within the 3 arcsecond diameter
fibre aperture sampled by the SDSS spectra.
This allows us to study correlations between both
optical and near-IR colours and a variety of physical parameters
that have been derived directly from the spectra;
these include specific star formation rate, metallicity,
dust attenuation, and mean stellar age. Because
UKIDSS and SDSS spectroscopy are available for a sample of more than 5000
galaxies, we are able to study these correlations for subsamples
of galaxies that are closely matched in stellar mass and in
redshift.
We also compare the optical and near-IR colours of the galaxies
in our sample to the predictions of the
stellar synthesis population models of Bruzual &
Charlot (2003),
a preliminary version of an improved model under development by
Charlot &
Bruzual (2007) and the models of Maraston (2005),
which implement the
TP-AGB phase using ”fuel consumption” approch.
This paper is organised as follows. We describe our optical and near-IR data in section 2, as well as the physical parameters used for our analysis. Our methods for analyzing the correlations between near-IR colours and physical parameters are presented in section 3 and 4. In section 5, we compare the near-IR colours of the galaxies in our sample with the colours predicted by stellar population models. Finally we discuss the implications of our results in section 6 and we summarize our findings in section 7.
2 The data
2.1 Optical photometry
The optical photometry is drawn from the Sloan Digital Sky Survey (SDSS) photometric galaxy catalogue (York et al. 2000). We restrict our sample to galaxies in the publically available MPA SDSS database (http://www.mpa-garching.mpg.de/SDSS), for which physical parameters have been derived from the galaxy spectra. Our optical sample contains 473,034 galaxies from the main spectroscopic sample of the SDSS fourth data release (DR4; Adelman-McCarthy et al. 2006), covering 4783 square degrees to a depth of 17.77 in -band Petrosian AB magnitude. The magnitudes of interest are measured through the fibre aperture in the , , , , filters. We have applied corrections for foreground Galactic extinction according to Schlegel et al. (1998) and we have also k-corrected the magnitudes to redshift 0.1 (the mean redshift of the sample) using v3 of the KCORRECT code (Blanton et al. 2003) and assuming a standard cosmology with , and km s-1 Mpc-1. Our sample covers a redshift range from 0.005 to 0.3. In the following sections, we will use the concentration parameter , defined as the ratio of the radii enclosing 90 and 50 per cent of the galaxy light in the -band, as an indicator of the morphological type of the galaxy. The axis ratio of the galaxy is defined as the ratio of the isophotal minor axis to the isophotal major axis in the -band, where the isophotes are measured at 25 magnitudes per square arcsecond.
2.2 Near infrared photometry
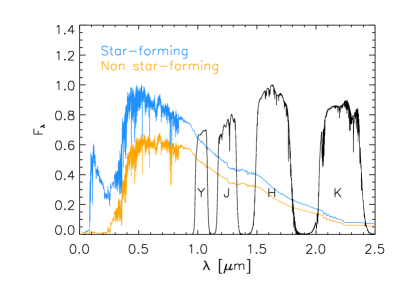
The near-IR data come from the UK Infrared Deep Sky Survey (Lawrence et al. 2007). The Large Area Survey, the largest of the five surveys that constitute UKIDSS, is the near-IR counterpart of SDSS. The images are obtained by the Wide-Field Camera on the UK Infrared Telescope in Hawaii. At the end of the 7 year observing campaign, it will cover 4000 square degrees of the Northern sky in the filters and it will reach a limiting -band magnitude that is three magnitudes deeper than that of 2MASS (Skrutskie et al. 2006). In the present study we focus on galaxies contained in the first data release of the Large Area Survey (Warren et al. 2007). This reaches a depth of 18 in -band Vega magnitude and covers 320 square degrees of the Northern sky. Our near-IR sample comprises 2.5 million objects with measured -band fluxes. The four filters cover the near infrared wavelenths from 1 micron for the filter to 2.4 micron for the filter. Circular aperture photometry is available for 13 diameters. We extract the Vega magnitude measured through a 2.8 arcsec diameter aperture 111From the UKIDSS catalogue apermag4 magnitudes were selected, which have been corrected for the effects of aperture and seeing under the assumption that the object is a point source. However, we have verified that the resulting colours are unaffected by this correction, which is well-matched to the 3 arcsec diameter fibre aperture of SDSS. These magnitudes are corrected for Galactic extinction and k-corrected to redshift 0.1. In Fig. 1, we show the response function of the UKIDSS filters on top of spectra computed for a 10 Gyr old star-forming galaxy (blue) and for a 10 Gyr old non star-forming galaxy (orange) at = 0.1 using the Bruzual & Charlot (2003) models.
2.3 Physical parameters
In this section, we briefly define the physical parameters that are used in our analysis: specific star formation rate, age, stellar and interstellar metallicity and dust attenuation. These quantities are all available in the public SDSS MPA database222 http://www.mpa-garching.mpg.de/SDSS/ and have been derived from the galaxy spectra. We note that the fibres in the SDSS spectrograph have diameters of 3 arcsec. At the mean redshift of our sample this corresponds to a diameter of 7 kpc (h = 0.7). Analyzing galaxy properties within a fixed fibre aperture means that the physical size of the region for which we carry out our analysis will be larger at higher redshifts.
| Mfib | SFR/M∗ | Age | Zgas | Zstellar | H/H | Az | |
|---|---|---|---|---|---|---|---|
| [log M⊙] | [log yr-1] | [Gyr] | [12+log(O/H)] | [] | - | [mag] | |
| SF: Mean value | 9.6 | -9.9 | 2 | 9.0 | 0.7 | 4.1 | 0.6 |
| SF: 1 sigma | 0.7 | 0.4 | 1 | 0.2 | 0.5 | 0.7 | 0.3 |
| NSF: Mean value | 10.1 | - | 7 | - | 1.1 | - | 0.0 |
| NSF: 1 sigma | 0.5 | - | 2 | - | 0.4 | - | 0.2 |
2.3.1 Star-forming and non star-forming classes
In order to select a sample of star-forming galaxies free of AGN contamination, we use the emission-line classifications of Brinchmann et al. (2004). The classifications are based on the location of galaxies in the Baldwin, Phillips & Terlevich diagram (Baldwin et al. 1981). Galaxies are divided into 6 classes: star-forming, composite, AGN, low S/N AGN, low S/N star-forming, and unclassifiable. We selected the star-forming and the non star-forming class (unclassifiable) for our analysis. The average values of the physical parameters are listed in Table1 for these two classes. As noted by Brinchmann et al. (2004), it is important to remember that this is a nuclear classification for the galaxies lying at redshift 0.1 and below, as these measurements are restricted to the central regions of the galaxies.
2.3.2 Star formation rate
The star formation rate (SFR) measured inside the fibre is also taken from the Brinchmann et al. (2004) analysis. To estimate this parameter, these authors matched the intensity of a variety of emission lines, including H and H, to a grid of HII region photo-ionization models. Because the stars that contribute to the ionizing flux are massive and very young, with a lifetime 20 Myr, this method provides a measure of the instantaneous star formation rate, independent of the previous star formation history. For our study, we use the specific SFR measured inside the fibre (SFR/M∗).
2.3.3 Age and metallicity
We use the light-weighted stellar ages and the stellar metallicities estimated by Gallazzi et al. (2005) using a carefully chosen set of absorption features that can break the age-metallicity degeneracy and that depend weakly on the /Fe abundance ratio: D4000, H, H+H, [Mg2Fe] and [MgFe]’. While the composite Mg+Fe indices are a good indicator of metallicity, the H-Balmer lines are mostly sensitive to age. For star-forming galaxies, we use the gas-phase oxygen abundance derived by Tremonti et al. (2004) from the strong optical nebular emission lines as the metallicity indicator, because for these galaxies, the gas-phase metallicity can be measured with better precision than the stellar metallicity. These values are expressed in 12 + log (O/H), where the solar metallicity in these units is 8.69.
2.3.4 Dust
As an estimate of the dust content of our star-forming galaxies, we have used the ratio of the H to the H emission line fluxes. These emission lines are measured after the subtraction of the continuum spectra. As H and H are attenuated differently because of their different wavelengths, their ratio is a measure of the amount of dust present in and around HII regions, where the star formation occurs. We assume a value of 2.86 corresponds to the dust-free case. An independent measurement of the dust content is provided by the -band attenuation parameter derived by Kauffmann et al. (2003a), which measures the amount of dust in the interstellar medium of the galaxy. It is calculated by fitting spectra with stellar population synthesis models with an attenuation curve of the form . The parameter can be estimated for both star-forming and non star-forming galaxies.
2.4 Matching near-IR and optical
We have matched the SDSS and UKIDSS samples in right ascension and declination with a maximal allowed separation of 0.5 arcsec in both coordinates. This upper limit is consistent with the measurement errors on the position of SDSS and UKIDSS, where 96% of SDSS objects have an error 0.2 arcsec in right ascension and declination and all UKIDSS objects have an error 0.26 arcsec. The mean separation obtained for the match is 0.17 arcsec. The matched sample consists of 12,415 galaxies with detections in all four near-IR bands. Nearly all SDSS galaxies with spectroscopy that are in the field observed by UKIDSS have a near-IR counterpart. The star-forming and non star-forming galaxy classes consist of 2377 and 3438 galaxies respectively.
3 Methods
In this section we present our method to derive the correlation between the optical/near-IR colours and the physical parameters described in section 2.3. We analyse the star-forming and the non star-forming galaxies separately. The pair matching method, described in the following section, allows us to suppress the dominant correlation with stellar mass. For each class, we then evaluate the correlation between the optical/near-IR colours and specific SFR, stellar age, metallicity and dust attenuation of paired galaxies using the Pearson correlation coeficient.
3.1 Matched galaxy pairs
It is well known that colours are strongly correlated with galaxy mass; the most massive galaxies have redder optical colours and the same is true for near-IR colours. The main physical driver of this trend is the fact that low-mass galaxies are currently forming stars and high-mass galaxies have very little ongoing star formation (Kauffmann et al. 2003b). If we wish to isolate the effects of other physical parameters on colours, it is useful to remove this dominant trend by comparing galaxies with a fixed stellar mass. We use a pair-matching technique; for each galaxy, we find a ”partner” that is closely matched in stellar mass, in redshift and in concentration index. We require a close match in redshift, because for a given stellar mass, the sample is biased towards bluer galaxies at higher redshifts. Matching in redshift also ensures that we compare colours within the same physical radius. Matching in concentration means that we compare galaxies with the same morphology, because the colour is influenced by the presence of a bulge component in the galaxy. To summarize, our matched galaxy pairs have: log 0.05 with expressed in M⊙, z 0.02 and C 0.1.
We proceed as follows: we begin by randomising the order of the galaxies in our sample. Then we take the first galaxy and define its partner as the galaxy minimising the quantity defined by equation (1) below and satisfying the limits in log, z and C defined above, where the denominators are the average of the absolute values. After this operation, the two galaxies are removed from the list, and we repeat the procedure with the rest of the sample.
| (1) |
This results in 708 and 673 galaxy pairs for the star-forming and non star-forming classes, respectively. The pairs are required to have unproblematic measurements of mass, specific SFR (for the star-forming class only), age, metallicity and dust attenuation for both galaxies.
3.2 Calculation of the correlations
We use our pair sample to study correlations between the colour differences of paired galaxies and differences in specific SFR, stellar age, metallicity and dust attenuation. The degree of correlation is evaluated using the Pearson’s product-moment correlation coefficient , defined as
| (2) |
where is the standard deviation. The correlation coefficient measures the degree of linear dependence between the two variables. When they are independent, then this coefficient is zero. In general, varies between 1 and +1, where = 1 means that and are linearly dependent with a negative slope, and = +1 means that they are linearly dependent with a positive slope. The errors on the correlation coefficients are calculated analytically by combining the measurement errors of the colours and the errors of the derived physical parameters (see Brinchmann et al 2004 for more details). We also use a resampling technique to assess whether the derived value of depends on the choice of galaxy pairs. The final values of and their associated errors represent the average of 1000 resamplings of the pair-matching process.
4 Results for the correlation
4.1 Correlations for star-forming galaxies
The results of our analysis for the star-forming sample are summarised in Table2. Given the null hypothesis that they are uncorrelated and taking into account the size of the samples, the probability that should be larger than 0.074 is 5% i.e. correlation coefficients below this value should be regarded as insignificant. The correlation coefficients have been calculated for optical and near-IR colours as a function of specific SFR, mean stellar age, gas-phase metallicity, H/H ratio, -band attenuation, and isophotal axis ratio. We note that all these parameters except the last one are derived from the galaxy spectra. Results are listed for the optical colours and and the infrared colours and . The chosen set of colours enables us to study how the shape of a galaxy’s spectral energy distribution depends on physical parameters from the optical to the near-IR in a continuous way. We also show examples of these correlations in Fig.2: and colour differences as a function of differences in specific SFR, gas-phase metallicity, H/H ratio and isophotal axis ratio.
| Correlation Coefficient | ||||||
|---|---|---|---|---|---|---|
| Colour | SFR/M∗ | Age | H/H | / | ||
| 0.49 0.05 | 0.62 0.09 | 0.09 0.05 | 0.11 0.03 | 0.09 0.03 | 0.34 0.04 | |
| 0.37 0.05 | 0.46 0.08 | 0.06 0.05 | 0.13 0.03 | 0.04 0.04 | 0.31 0.04 | |
| 0.02 0.02 | 0.07 0.05 | 0.08 0.03 | 0.20 0.03 | 0.12 0.03 | 0.20 0.02 | |
| 0.23 0.03 | 0.17 0.05 | 0.03 0.03 | 0.25 0.03 | 0.23 0.04 | 0.12 0.03 | |
| Correlation Coefficient | ||||
|---|---|---|---|---|
| Colour | Age | / | ||
| 0.4 0.1 | 0.05 0.08 | 0.02 0.05 | 0.08 0.11 | |
| 0.20 0.09 | 0.00 0.07 | 0.16 0.05 | 0.08 0.05 | |
| 0.08 0.04 | 0.04 0.04 | 0.02 0.02 | 0.04 0.02 | |
| 0.04 0.04 | 0.07 0.04 | 0.14 0.03 | 0.01 0.03 | |
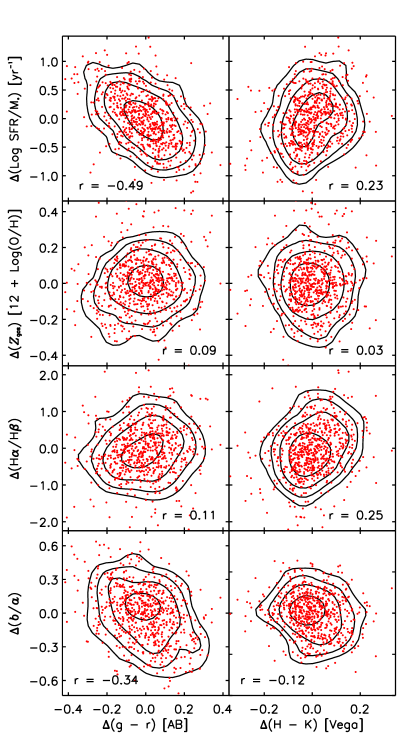
As can be seen from Table2 and from Figure2, the colour is strongly anti-correlated with the specific SFR ( = 0.49), with the bluest colours corresponding to the most strongly star-forming galaxies. This result is expected, because the emission from young stars peaks at UV and blue wavelengths. This anti-correlation still exists for the colour, but the colour displays a positive correlation with specific SFR ( = 0.23 as seen in Fig.2). At a constant mass, strongly star-forming galaxies have redder near-IR colours. Even if this correlation is not as strong as the one in the optical, it is significant. One possibility is that that AGB stars are responsible for this correlation, because they dominate the -band luminosity of a galaxy 0.1 Gyr after a burst of star formation (see section 5.2 for detailed predictions from stellar population models). Galaxies with ongoing star formation are rich in AGB stars and therefore have redder near-IR colours than quiescient galaxies of the same mass.
The colour also correlates with the mean stellar age measured from stellar-absorption lines; galaxies with older ages have redder optical colours. This correlation becomes weaker at longer wavelengths, and once again the sign of the correlation reverses for the colour ( = 0.17). The gas-phase metallicity does not seem to correlate with any colour. At a first glance, this is a surprising result, because metal-rich stellar populations are predicted to have redder colours. The most natural explanation is that the metallicity of a galaxy is very strongly correlated with its mass and not with any other parameter (Tremonti et al. 2004). Because our galaxy pairs are constrained to have the same stellar mass, the correlation with metallicity is strongly suppressed.
The correlation coefficients for the H/H ratio and the -band attenuation are also small for optical colours. Curiously, the strength of the correlation increases towards near-IR wavelengths ( = 0.25 and 0.23 for the correlation between colour and H/H and respectively). This result is very surprising, as dust should affect optical colours more than near-IR colours.
One way to gain further insight into this result is to look at the correlation between optical and near-IR colours and the axis ratios of the galaxies (see Table2 and the bottom panels in Fig.2). Our results show that low-inclination (/ 1) galaxies have bluer optical colours than high-inclination (/ 1) galaxies. This is most likely due to dust reddening, because the light coming from the center of high-inclination galaxies passes through a large amount of material, whereas for low-inclination galaxies it comes directly to us. As seen from Table2 the correlation of the near-IR colours with the axis ratios is much weaker. This leads us to suggest that the positive correlation of the near-IR colours with dust attenuation is caused by some phenomenon other than dust reddening. AGB stars are known to release large amounts of dust. We thus hypothesize that galaxies with redder colours contain a higher fraction of AGB stars, and by extension a larger amount of dust. The apparent tendency for the near-IR colours to correlate with Balmer decrement and the -band attenuation is thus an induced correlation, not a primary one.
4.2 Correlations for non star-forming galaxies
Correlations calculated for the non star-forming galaxy sample are presented in Table3. We show the correlation coefficient and its error for the relations between optical/near-IR colours and mean stellar age, stellar metallicity, -band dust attenuation, and the isophotal axis ratio. All the correlation coefficients are smaller than those obtained for the star-forming sample, but the overall results are quite similar. The strongest correlation is that between age and colour ( = 0.4), and the strength of the correlation decreases at longer wavelengths ( = 0.04 for the colour). Table3 shows that the correlation with stellar metallicity is below the 5% significance level ( 0.07). Once again, the correlation of colours with -band dust attenuation increases at near-IR wavelenghs, while the absolute correlation with isophotal axis ratio decreases. We note that the correlation between colour and isophotal axis ratio is less significant for this sample, as most of the galaxies are ellipticals.
5 Comparison with stellar population models
5.1 Description of Bruzual & Charlot (2003) and Charlot & Bruzual (2007) models
We use the Bruzual & Charlot (2003) (hereafter BC03) stellar population synthesis models to compute the optical and near-IR colours of model ”galaxies” for comparison with the data. We also test here a preliminary version of the Charlot & Bruzual (2007) (hereafter CB07) code, which includes a new prescription for AGB star evolution. We adopt the Padova 1994 single stellar population evolutionary tracks and the Chabrier initial mass function. 333The BC03 model package allows one to choose between Padova 1994 and Padova 2000 evolutionary tracks, but the latter tends to produce worse agreement with observed galaxy colours. On the other hand, as shown by Bruzual & Charlot (2003), the choice of the initial mass function should not influence significantly the output colours. The models allow us to compute the evolution of the spectrum and the colours of a composite stellar population between 0 and 20 Gyr for a given metallicity and star formation history. For each model galaxy, the output colours are evolution and k-corrected to = 0.1, so that they can be compared directly with the observational data.
We have computed a grid of models with different star formation histories and metallicities that are designed to span the observed colours of the galaxies in our sample. We parametrize an exponential declining SFR as
| (3) |
where is the age and is the star formation timescale. To represent the star-forming sample, we have chosen two models. The first one has a constant SFR, and the second one has an exponential declining SFR with = 3 Gyr. In general, the star formation history of early-type spiral galaxies can be described by an exponential law, because the gas available for forming new stars decreases with time (Kennicutt 1998). The constant SFR model describes galaxies where the available gas is replenished through further infall, and is therefore suited to describe later-type galaxies with higher rates of ongoing star formation. To model our non star-forming sample, we choose = 1 Gyr. In this model, the star formation rate decreases rapidly and reaches values close to zero at = 5 Gyr. This model is designed to reproduce the star formation histories of non-interacting elliptical galaxies.
We generate these models for five stellar metallicities: 0.02, 0.2, 0.4, , 2. This range is broader than that spanned by the galaxies in our samples, which vary between 0.2 and . Note that our model galaxies have a fixed metallicity, i.e. there is no metal enrichment with age. We plot galaxy colours at model ages of 5, 10 and 15 Gyr (we expect the typical age of the galaxies in our sample to be around 10 Gyr). The upper limit of 15 Gyr is older than currently favored estimates of the age of the Universe, but in a few cases models with large ages are needed to fit the data. We note that by ”age”, we mean here the time for which the model galaxy has been forming its stars; this must be distinguished from the observed age of the stellar population (such as that considered in section2.3.3), which is usually a measure of its luminosity-weighted mean stellar age. The luminosity-weighted age is generally considerably lower, because young stars always dominate the optical luminosity in a composite stellar population.
The effect of dust attenuation on the colours is included using the simple two-component model of Charlot & Fall (2000). This accounts for different attenuations affecting young stars in their birth clouds (i.e., giant molecular clouds) and older stars in the diffuse ambient (i.e. diffuse) interstellar medium of a galaxy. The main two adjustable parameters of this model are the total effective V-band optical depth affecting stars younger than 107 yr (the typical lifetime of a giant molecular cloud), , and the fraction of that optical depth that is contributed by dust in the ambient interstellar medium, . Our models include dust attenuation with = 1 and = 0.3. This corresponds to an attenuation of 1.1 magnitude in the V-band for stars younger than 107 yr and 0.3 mag for older stars. We note that the estimated -band attenuation varies between 0.4 magnitude and 0.8 magnitude for the star-forming galaxies in our sample and between 0. and 0.03 for the non star-forming galaxies. The attenuation curve across the spectrum has the form = (/5500 Å)-0.7. The effect of dust on the colours is indicated by an orange arrow on the figures in section 5.3. The length of the arrow corresponds to a galaxy with = 2 and = 0.5, corresponding to an attenuation of 2.2 mag in the V-band for stars younger than 107 yr and of 1.1 mag for older stars. This is a reasonable upper limit to attenuation by dust. The cross on the arrow indicates the amount of reddening that is already included in the models.
5.2 Difference between the BC03 and preliminary CB07 models
The preliminary version of the CB07 model used here differs from the BC03 models only in the treatment of AGB stars. The new models include the prescription of Marigo & Girardi (2007) for the TP-AGB evolution of low- and intermediate-mass stars. This prescription includes several important theoretical improvements over previous calculations, and it has been calibrated using carbon star luminosity functions in the Magellanic Clouds and TP-AGB lifetimes (star counts) in Magellanic Cloud clusters (we refer to the paper of Marigo & Girardi (2007) for detail). As outlined by Bruzual (2007), this implies brighter -band magnitudes and redder near-IR colours for the preliminary CB07 model than for the BC03 model. We caution the reader that the spectra of TP-AGB stars and the stellar evolution prescription for pre-AGB phases have not been updated in the preliminary version of CB07 model used here. The final version of this model will include new spectra for TP-AGB stars and an updated library of Marigo & Girardi (2007) TP-AGB calculations connected to a new comprehensive grid of pre-AGB stellar evolutionary tracks by Bertelli et al. (2007, in preparation). Nevertheless we feel that this preliminary analysis is informative.
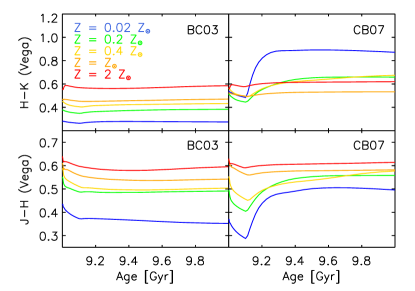
To illustrate the differences between the BC03 and CB07 models, we have computed the evolution of the near-IR colours after a burst of star formation. We assume that one third of the final mass of the galaxy is formed during the burst, which occurs at = 9 Gyr on top of a galaxy with exponentially declining SFR. As seen from Figure 3, when TP-AGB stars appear, about 0.1 Gyr after the burst, the CB07 models are significantly redder (from a tenth to a few tenths of a magnitude) in and than the BC03 model. This effect is seen mainly at metallicities of 0.2 and below. At such metallicities, the TP-AGB (and in particular, luminous carbon stars) dominate the near-IR light of intermediate-age stellar populations in the CB07 model, while RGB stars (which are less luminous than TP-AGB stars) prevail at medium to high metallicities.
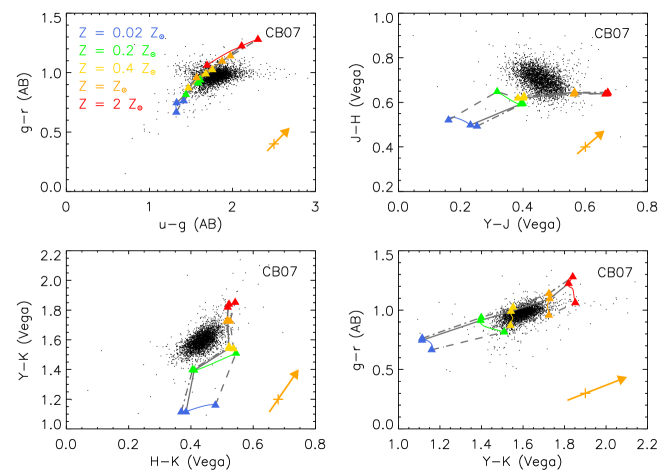
5.3 Results from BC03 and preliminary CB07 models
Figures 4, 5 and 6, 7 present comparisons of the BC03 and preliminary CB07 models with our data. The observational data are plotted as black dots in four colour-colour diagrams: versus , versus , versus and versus . The model grids are defined by 3 different ages and 5 metallicities from 0.02 to 2. The dotted, continuous and dashed-dotted lines correspond to model ages of 5 , 10 and 15 Gyr, respectively. For the star-forming sample, the models with constant SFR are plotted as stars, while the models with star formation timescale = 3 Gyr are plotted as filled squares (Figs.4 and 5). For the non star-forming sample, all models have = 1 Gyr and are plotted as filled triangles (Figs.6 and 7). All models in Figs.4–7 include dust attenuation with = 1 and = 0.3. The orange arrow on the lower right corner of each panel indicates the amount of reddening for a galaxy with = 2 and = 0.5. The orange cross indicates the reddening that is already included in our models.
5.3.1 Star-forming galaxies
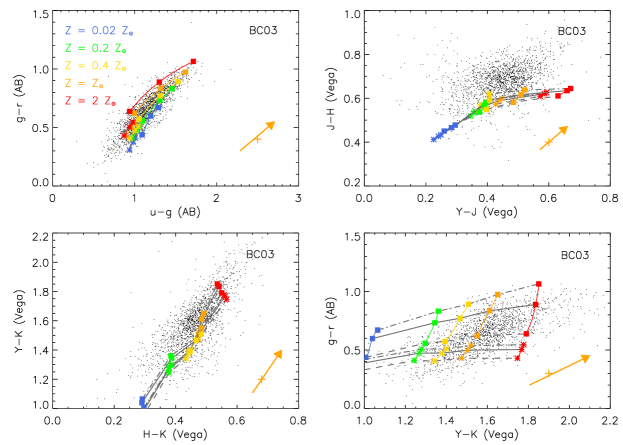
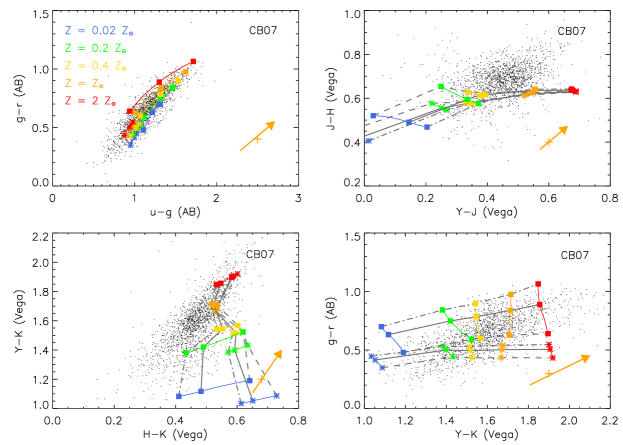
As seen from Fig. 4, the BC03 models cover the data in the optical versus colour-colour plane. The very bluest galaxies in can be fitted if a burst of recent star formation is superposed on the star formation history used in our models. The colours of the reddest galaxies can be understood if they are significantly reddened by dust. We therefore conclude that our choices of star formation history, age and metallicity are appropriate for the star-forming sample. These models should then be able to reproduce the near-IR colours of the galaxies in our sample.
We find that, however, the BC03 models fail to cover the data in the versus and versus colour-colour planes. In the near-IR, these models are sensitive primarily to metallicity. As can be seen, the models cannot reproduce the observed scatter of the star-forming galaxies in the near-IR colour-colour diagrams. Neither reddening nor a scatter in age or star formation history can account for the observed spread. We also note that the colours of the model tracks are too blue by approximatively 0.1 magnitude as compared to the data. This may not seem like a large offset, but as the near-IR colours of galaxies cover a small range of magnitude (0.4 magnitude in ) this is not a negligible discrepancy.
Fig. 5 shows the comparison with the preliminary version of the CB07 models. As expected, the results do not differ from the BC03 models at optical wavelengths. On the other hand, the near-IR colours are now dependent on stellar age at metallicities 0.4. Although this could in principle provide a mechanism for understanding the observed scatter in the near-IR colour-colour planes, we find that these more recent models still cannot fit the detailed trends seen in the data. The colours are skewed to significantly redder values in the CB07 models as compared to the data and the models fail to reproduce the observed spread in colour at colours greater than 0.4. This conclusion is likely to change when new spectra are adopted for TP-AGB stars in the final models. The and colours are better reproduced by the models. Both these colours are predicted to be good indicators of metallicity. In particular, the colour has almost no dependence on age in both the BC03 and the CB07 models. We note that there is an offset in the UKIDSS -band magnitudes of 0.09 in the sense that they are too faint (P.Hewett, private communication). Correcting for this effect will result in a better match in colour.
It is also interesting to consider what these preliminary CB07 models predict in terms of trends in the near-IR colours as a function of age and metallicity. The colour exhibits similar behaviour to optical colours, in that it increases with age. The colour also increases slightly with age at metallicities above 0.4, but it decreases with increasing age at lower metallicities. This effect is even stronger for the colour: a 0.2 galaxy becomes 0.2 magnitudes bluer as the galaxy ages from 5 Gyr to 15 Gyr. The lower right panel of Fig. 5 shows the best combination of optical and near-IR colours for deriving age and metallicity deduced from these preliminary CB07 models. As seen on this plot, the effect of increasing age is to move the galaxy along the colour axis, without affecting colours. Conversely, increasing metallicity moves the galaxy along the axis, with very little effect on the colour.
5.3.2 Non star-forming galaxies
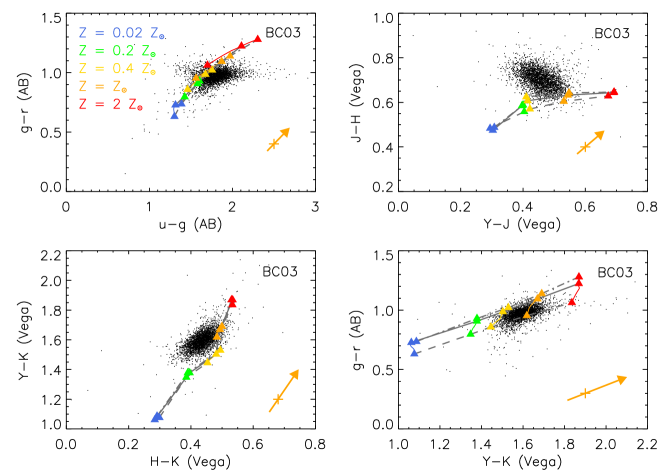
In Fig. 6 we compare the BC03 models with the colour distributions of galaxies in the non star-forming sample. Recall that all the models on this plot have exponential declining star formation histories with = 1 Gyr. The observed colours of non star-forming galaxies have significantly less scatter than those of galaxies in the star-forming sample. We find that models with metallicities between 0.4 and reproduce the location of the observed galaxies in the the versus colour-colour diagram, but the observed locus of the data in the versus colour-colour plane cannot be understood with these models. The models also predict colours that are too blue by about 0.1 magnitude.
As seen from Fig. 7, the preliminary CB07 models predict that the near-IR colours of non-star-forming galaxies depend weakly on age at metallicities below 0.4 . The age dependence is less pronounced than for the exponential declining models with = 3 Gyr that we used to model star-forming galaxies. This is due to the smaller fraction of luminous TP-AGB stars relative to RGB stars in the = 1 Gyr models at the ages considered here. As was the case for the star-forming galaxies, we find that the preliminary version of the CB07 models do not match our data. These models are almost identical to the BC03 models at metallicities above 0.4. The galaxies in our non star-forming sample are mainly massive, metal-rich systems, and the low-metallicity models are not applicable to them.
5.4 Comparison with Maraston (2005) models
5.4.1 Description of Maraston (2005) models
One of the first papers to point out the influence of the short duration thermally pulsating (TP-)AGB phase on the spectra of galaxies at was written by Maraston (1998). The most recent version of the Maraston models (Maraston 2005; hereafter M05) implements this phase by adopting a ‘fuel consumption’ approach. In Rettura et al. (2006) M05 model predictions were compared with those of BC03 and PEGASE.2 (Fioc & Rocca-Volmerange 1997) for estimating the stellar mass content of early-type galaxies at .
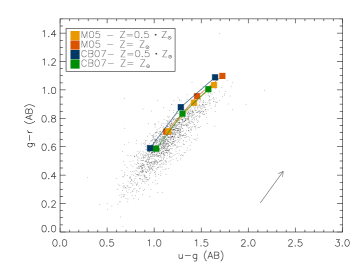
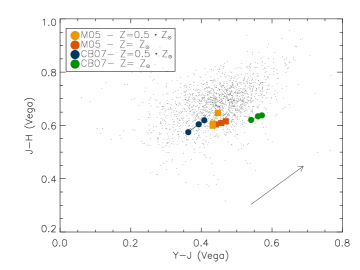
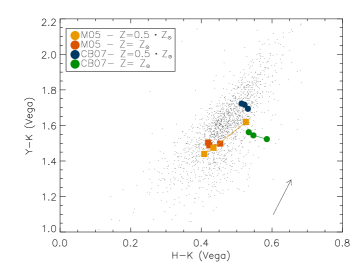
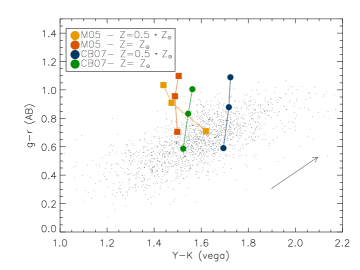
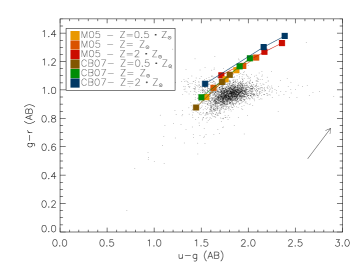
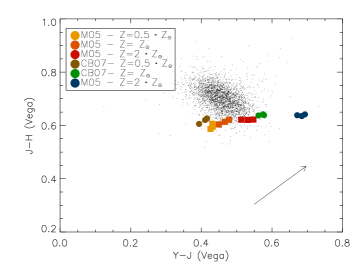
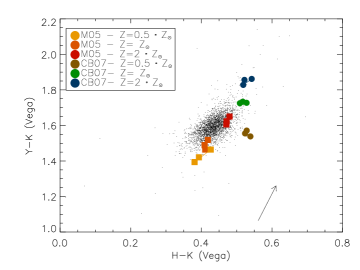
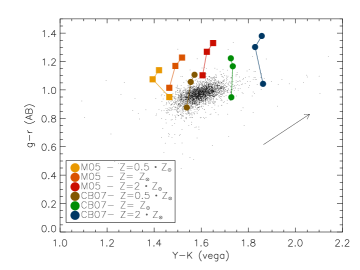
In the following sections we compare the predictions of CB07 with those of M05. In Figs. 8 and 9, we plot the M05 models and the preliminary CB07 models on the top of our star-forming sample and non star-forming sample in a series of optical and near-IR colour-colour diagrams. For the star-forming sample, the star formation history is an exponentially declining SFR with = 3 Gyr. The non star-forming sample is represented by an exponentially declining SFR with = 1 Gyr. Results are shown at three different ages (5,10 and 15 Gyr), but only for half solar and solar metallicities (we do not have lower metallicity predictions for M05). Figure 9 shows twice solar metallicity in addition. An extinction of = 0.3 is already included in the models. The arrow on each panel indicates the amount of extinction corresponding to = 1.4 as parametrised with a dust screen and the reddening curve of Cardelli et al. (1989), including the update for the near-UV given by O’Donnell (1994).
5.4.2 Results from M05 models for the star-forming sample
Figure 8 compares the predictions of CB07 with those of M05 for our star-forming sample, in the same way as described in the previous section. As seen from this figure, both models agree with the data for the optical colours, M05 predicting slightly redder colours in . In the vs colour-colour plane, we notice that the preliminary CB07 models are considerably more sensitive to metallicity. For both models, an extinction corresponding to = 1.4 is required to explain the reddest galaxies. This amount of extinction agrees with the measurement of the most dusty galaxies in our star-forming sample. On the other hand, such amount is not necessary to explain the distribution of the optical colours. The predictions of M05 models match the data particularly well in the vs colour-colour plane; in this plane, the preliminary CB07 models are offset in . Both models exhibit a larger sensitivity to age at lower metallicity. The lower right panel of Fig. 8 shows that the M05 and CB07 models differ quite significantly in their predictions for colours. If one uses the preliminary CB07 model, one might infer that this colour is a good indicator of metallicity, but this is is not true for the M05 models. Based on this comparison, neither model is particularly favoured to explain the colour distribution of our star-forming sample.
5.4.3 Results from M05 models for the non star-forming sample
Figure 9 compares the predictions of CB07 with those of M05 for our non star-forming sample. We have included the 2 isometallicity track as these galaxies have measured stellar metallities in the range 0.7 to 1.5. We note that M05 models require systematically higher metallicities (between and 2) to fit the observed colours than do the preliminary CB07 models (between 0.5 and ). The dust reddening should barely affect the colours as the non star-forming galaxies have a measured -band attenuation close to zero. Our conclusions regarding the fit of the optical and near-IR colours with both models are very similar to those reached for the star-forming sample. In optical colours, M05 models predict too red colours by approximately 0.2 magnitudes. Both models predict too blue colour by around 0.1 magnitude. The colour is better reproduced by M05 models. As pointed out in section 5.3.2, the age dependence is less pronounced than for the exponential declining models that are used to model the star-forming sample. The preliminary CB07 models provide a better fit to the data in colour; the M05 models requiring metallicities around 2, which is larger than the metallicities estimated for the galaxies in our sample (Gallazzi et al. 2005).
6 Implications
6.1 Can the age-metallicity degeneracy be broken?
As discussed in Section 5.3, the versus colour-colour plane may provide the ideal combination of colours to break the age-metallicity degeneracy. How well does this work in practice?
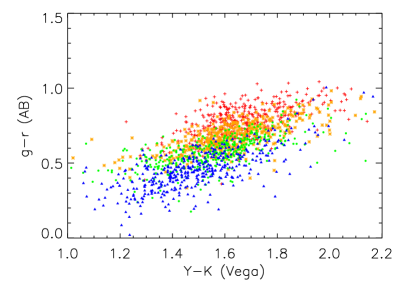
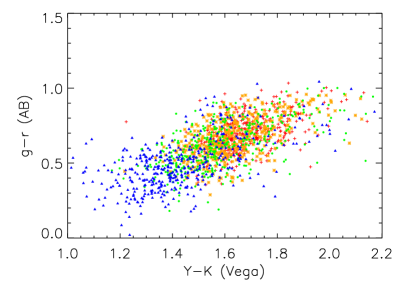
In this section we analyze how galaxies with different measurements of stellar age and gas-phase metallicity populate the versus colour-color plane. Fig. 10 shows the distribution of galaxies with different mean stellar ages. We have divided our sample into four age classes, which contain equal numbers of galaxies. Blue points represent the youngest galaxies and red points the oldest. As seen from this Figure, the four age classes are distributed in horizontal slices, showing that as predicted by the models, the colour is a good age indicator. Figure 11 shows how galaxies with different gas-phase metallicities are distributed in the same colour-colour plane. Again, we have divided our sample in four classes: the blue crosses indicate the most metal-poor galaxies, while the red crosses are for the most metal rich ones. According to our preliminary version of the CB07 models, the colour should be very sensitive to the metallicity. The data reveals that galaxies in the lowest metallicity class do have predominantly blue colours, but galaxies in the medium to high metallicity classes all have similar colours. Dust is probably the main reason for this degeneracy. As seen from Fig. 5, reddening can influence the colours quite significantly, because the and filters are distant in wavelength.
In summary, our preliminary version of the CB07 models predict that the location of galaxies in the versus colour-colour plane allows one to estimate age and metallicity independently for a fixed amount of dust attenuation, but the data show that the method is not as clean as it might first appear.
6.2 Estimating mass-to-light ratios
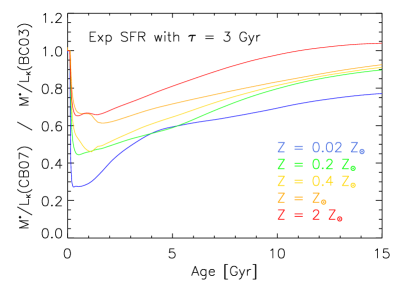
When spectroscopic information is not available, the mass-to-light ratio of a galaxy can be estimated by comparing the predicted spectral energy distributions of model galaxies derived using stellar population synthesis codes to the observational data. The stellar mass of the galaxy is then obtained by multiplying its mass-to-light ratio by its observed luminosity. As discussed by De Jong (1996), it is important that these mass estimates be anchored by observations in at least one photometric bandpass that is not too sensitive to the presence of very young stars, or to metallicity and dust attenuation. The -band is commonly regarded as the most reliable in this respect, because dust and young stars should have little effect on the light emitted by a galaxy at wavelengths around 2 m. Therefore, as pointed out by Maraston et al. (2006) and by Bruzual (2007), the influence of AGB stars on the model predictions for the -band luminosity have very important implications for the reliability of stellar mass estimates that make use of data in this wavelength range. In Fig. 12, we compare M∗/LK predicted by the BC03 and preliminary CB07 models as a function of the age of the galaxy. We show results for 5 different metallicities for a model with exponential declining SFR with = 3 Gyr. As described in the previous section, this model provides a rather good fit to the optical colours of the star-forming galaxies in our sample. As can be seen from this Figure, at ages less than 1 Gyr, the mass-to-light ratio predicted by the CB07 models ranges from 30% (for 0.02) to 70% (for 2) of the value predicted by the BC03 models. The difference between the two models decreases as a function of the age of the galaxy. At 10 Gyr, the typical age of the galaxies in our sample, the mass predicted by CB07 model ranges from 70% to 100% of the value predicted by the BC03 model. We conclude that even for present-day star-forming galaxies, there are significant uncertainties on stellar masses derived from -band luminosities that depend on how AGB stars are treated in the population synthesis models. The stellar masses predicted by the CB07 models are considerably smaller that those predicted by the BC03 models, the effect being more important at high redshifts and for low metallicity galaxies.
7 Summary
We have used a combination of empirical and theoretical techniques to interpret the near-IR colours of 5800 galaxies drawn from the SDSS main spectroscopic sample. This study focuses on the inner regions of galaxies that are sampled by the 3 arcsecond SDSS fibre spectra. In the first part of our analysis, we study correlations between near-IR colours and physical parameters derived from the spectra, which include the specific SFR, the stellar age, the metallicity, the dust attenuation and the axis ratio of the galaxy. All correlations are analyzed using galaxy samples that are matched in redshift, stellar mass and concentration parameter. We analyze star-forming and non-star-forming galaxies separately. In the second part of our analysis, we compare the near-IR colours of the galaxies in our sample to the predictions of stellar population models. Our main conclusions are as follows:
-
•
Whereas more strongly star-forming galaxies have bluer optical colours, the opposite is true at near-IR wavelengths: galaxies with higher values of SFR/ have redder near-IR colours. This result agrees well with the predictions of models in which TP-AGB stars dominate the and -band light of a galaxy following a burst of star formation.
-
•
We find a surprisingly strong correlation between the near-IR colours and dust attenuation measured from the Balmer decrement. However, the near-IR colours do not correlate with the axis ratios of the galaxies. This suggests that the correlation with dust attenuation arises because TP-AGB stars are the main source of dust in the galaxy.
-
•
We compare the near-IR colours of the galaxies in our sample with the colours predicted by the BC03 code, a preliminary version of the CB07 code and the M05 code. The preliminary CB07 code provides better qualitative agreement with the data than BC03, in that it predicts that more strongly star-forming galaxies have redder near-IR colours. However, this effect occurs only at low metallicities. The observed spread in the the near-IR colours of the star-forming galaxies is still unexplained by the current models. The M05 models agree well with the data in the vs colour-colour plane, but do not provide as a good a match for other colour combination.
-
•
The preliminary version of the CB07 model suggests that both the age and the metallicity of a galaxy can be estimated from its location in the versus colour-colour plane. We have tested this using our data and we find that although age can be quite accurately estimated from the colour, the colour can only be used to distinguish the lowest metallicity galaxies.
-
•
Even for present-day star-forming galaxies, the -band mass-to-light ratios predicted by the CB07 models can be significantly (up to 30%) smaller than those predicted by the BC03 models. This systematic uncertainty in the mass estimates is comparable to the differences obtained when stellar masses are estimated using a variety of different methods, for example fitting stellar population synthesis models to broadband colors or analysis of spectroscopic features (Drory et al. 2004).
Throughout this paper, we have been careful to stress that the model comparisons have been made using a preliminary version of the CB07 model. The published version of the model should include an improved library of spectra of TP-AGB stars, as well as new stellar evolutionary tracks for the pre-AGB phase. This is likely to improve the agreement with the data. The hope is that the sample of nearby galaxies with high quality photometric and spectroscopic data from UKIDSS and SDSS presented in this paper will continue to serve as a means of testing and calibrating future stellar population synthesis models.
acknowledgements
We thank Anna Gallazzi, Anthony Smith and Paula Coelho for useful discussions. We are grateful to Paul Hewett for providing useful comments on UKIDSS data. CE aknowledges the Max Planck Institute for hospitality and support while this work was carried out. CE was partly supported by the Swiss Sunburst Fund and the Barbour fondation.
The United Kingdom Infrared Telescope is operated by the Joint Astronomy Centre on behalf of the UK Particle Physics and Astronomy Research Council. Funding for the SDSS has been provided by the Alfred P. Sloan Foundation, the Participating Institutions, the National Science Foundation, the US Department of Energy, the National Aeronautics and Space Administration, the Japanese Monbukagakusho, the Max Planck Society, and the Higher Education Funding Council for England. The SDSS Web site is http://www.sdss.org. The SDSS is managed by the Astrophysical Research Consortium for the Participating Institutions. The Participating Institutions are the American Museum of Natural History, the Astrophysical Institute Potsdam, the University of Basel, Cambridge University, Case Western Reserve University, the University of Chicago, Drexel University, Fermilab, the Institute for Advanced Study, the Japan Participation Group, Johns Hopkins University, the Joint Institute for Nuclear Astrophysics, the Kavli Institute for Particle Astrophysics and Cosmology, the Korean Scientist Group, the Chinese Academy of Sciences, Los Alamos National Laboratory, the Max Planck Institute for Astronomy, the Max Planck Institute for Astrophysics, New Mexico State University, Ohio State University, the University of Pittsburgh, the University of Portsmouth, Princeton University, the US Naval Observatory, and the University of Washington.
References
- Aaronson (1978) Aaronson M., 1978, ApJL, 221, L103
- Adelman-McCarthy et al. (2006) Adelman-McCarthy et al. 2006, ApJS, 162, 38
- Baldwin et al. (1981) Baldwin J. A., Phillips M. M., Terlevich R., 1981, PASP, 93, 5
- Bell & de Jong (2000) Bell E. F., de Jong R. S., 2000, MNRAS, 312, 497
- Blanton et al. (2003) Blanton et al. 2003, AJ, 125, 2348
- Brinchmann et al. (2004) Brinchmann J., Charlot S., White S. D. M., Tremonti C., Kauffmann G., Heckman T., Brinkmann J., 2004, MNRAS, 351, 1151
- Bruzual (2007) Bruzual G., 2007, (astro-ph/0703052)
- Bruzual & Charlot (2003) Bruzual G., Charlot S., 2003, MNRAS, 344, 1000
- Cardelli et al. (1989) Cardelli J. A., Clayton G. C., Mathis J. S., 1989, ApJ, 345, 245
- Charlot & Bruzual (2007) Charlot S., Bruzual G., 2007, in preparation
- Charlot & Fall (2000) Charlot S., Fall S. M., 2000, ApJ, 539, 718
- De Jong (1996) De Jong R. S., 1996, A&AS, 118, 557
- Drory et al. (2004) Drory N., Bender R., Hopp U., 2004, ApJL, 616, L103
- Fioc & Rocca-Volmerange (1997) Fioc M., Rocca-Volmerange B., 1997, A&A, 326, 950
- Frogel (1985) Frogel J. A., 1985, ApJ, 298, 528
- Gallazzi et al. (2005) Gallazzi A., Charlot S., Brinchmann J., White S. D. M., Tremonti C. A., 2005, MNRAS, 362, 41
- Geller et al. (2006) Geller M. J., Kenyon S. J., Barton E. J., Jarrett T. H., Kewley L. J., 2006, AJ, 132, 2243
- Kauffmann et al. (2003a) Kauffmann et al. 2003a, MNRAS, 341, 33
- Kauffmann et al. (2003b) Kauffmann et al. 2003b, MNRAS, 341, 54
- Kennicutt (1998) Kennicutt Jr. R. C., 1998, ARA&A, 36, 189
- Lawrence et al. (2007) Lawrence et al. 2007, MNRAS, 379, 1599
- Lee et al. (2007) Lee H.-c., Worthey G., Trager S. C., Faber S. M., 2007, ApJ, 664, 215
- MacArthur et al. (2004) MacArthur L. A., Courteau S., Bell E., Holtzman J. A., 2004, ApJS, 152, 175
- Maraston (1998) Maraston C., 1998, MNRAS, 300, 872
- Maraston (2005) Maraston C., 2005, MNRAS, 362, 799
- Maraston et al. (2006) Maraston C., Daddi E., Renzini A., Cimatti A., Dickinson M., Papovich C., Pasquali A., Pirzkal N., 2006, ApJ, 652, 85
- Marigo & Girardi (2007) Marigo P., Girardi L., 2007, A&A, 469, 239
- Mobasher et al. (1986) Mobasher B., Ellis R. S., Sharples R. M., 1986, MNRAS, 223, 11
- O’Donnell (1994) O’Donnell J. E., 1994, ApJ, 422, 158
- Rettura et al. (2006) Rettura et al. 2006, A&A, 458, 717
- Schlegel et al. (1998) Schlegel D. J., Finkbeiner D. P., Davis M., 1998, ApJ, 500, 525
- Skrutskie et al. (2006) Skrutskie et al. 2006, AJ, 131, 1163
- Tremonti et al. (2004) Tremonti et al. 2004, ApJ, 613, 898
- Warren et al. (2007) Warren et al. 2007, MNRAS, 375, 213
- Wu et al. (2005) Wu H., Shao Z., Mo H. J., Xia X., Deng Z., 2005, ApJ, 622, 244
- York et al. (2000) York et al. 2000, AJ, 120, 1579