Spitzer-MIPS survey of the young stellar content in the Vela Molecular Cloud-D
Abstract
A new, unbiased Spitzer-MIPS imaging survey ( 1.8 square degrees) of the young stellar content of the Vela Molecular Cloud-D is presented. The survey is complete down to 5 mJy and 250 mJy at 24 m and 70 m, respectively. A total of 849 sources are detected at 24 m and 52 of them also have a 70 m counterpart. The VMR-D region is one that we have already partially mapped in dust and gas millimeter emission, and we discuss the correlation between the Spitzer compact sources and the mm contours. About half of the 24 m sources are located inside the region delimited by the 12CO(1-0) contours, corresponding to only one third of the full area mapped with MIPS. Therefore the 24 m source density increases by about 100 moving from outside to inside the CO contours. For the 70 m sources, the corresponding density increase is four times. About 400 sources of these have a 2MASS counterpart, and we have used this to construct a Ks vs. Ks-[24] diagram and to identify the protostellar population inside the cloud.
We find an excess of Class I sources in VMR-D in comparison with other star forming regions. This result is reasonably biased by the sensitivity limits at 2.2 and 24 m, or, alternatively, may reflect a very short lifetime (106 yr) of the protostellar content in this molecular cloud. The MIPS images have identified embedded cool objects in most of the previously identified starless cores in the region; in addition, there are 6 very young, possibly Class 0 objects identified. Finally we report finding of the driving sources for a set of five out of six very compact protostellar jets that had been previously discovered in near-infrared images of VMR-D.
1 Introduction
Infrared maps of star forming Giant Molecular Clouds (GMCs) are an essential tool in the modern study of star formation. When radio and millimeter maps also exist, the relationships between the regions of infrared, millimeter and radio activity provide one of the key new tools for clarifying the varieties of star formation that can occur. The sensitivity of infrared techniques means that even shallow surveys can in principle reveal the processes of both low and high mass star formation in clouds that are not too far away. There are, however, very few nearby GMCs with which to take full advantage of these techniques. Among these available targets, one is the Vela Molecular Ridge (VMR), a complex of four adjoining GMCs (Murphy & May 1991; Yamaguchi et al. 1999), located in the galactic plane (=3∘) outside the solar circle ( 260∘ - 275∘); most of the gas (clouds named A, C and D) is located at a distance of about 700 pc (Liseau et al. 1992).
This team has studied the star formation activity in the VMR for many years: the concentration of red and young sources (Liseau et al. 1992, Lorenzetti et al. 1993); the presence of embedded clusters (Massi et al. 2000, 2003); the occurrence of protostellar jets (Lorenzetti et al. 2002; Giannini et al. 2001, 2005, De Luca et al. 2007, hereinafter D07). Recently we mapped with the SIMBA bolometer array at SEST a 1 deg2 area of the cloud D in the 1.2 mm continuum of dust emission, and in the 12CO(1–0) and 13CO(2–1) transitions (Massi et al. 2007, hereinafter M07; Elia et al. 2007, hereinafter E07).
The advent of the Spitzer Space Telescope (SST, Werner et al. 2004) and the imaging photometric facilities on board, i.e. the Multiband Imaging Photometer for Spitzer (MIPS, 24, 70, 160 m; Rieke et al. 2004) and the InfraRed Array Camera (IRAC, Fazio et al. 2004) has enabled us to obtain maps of the VMR from 3.8 to 70 m across the same area already surveyed in the millimeter emission of dust and gas. The primary goal of this survey is to obtain a census of the embedded young stellar population of VMR-D and to correlate it with its gas and dust cores.
This paper describes our MIPS observations of the VMR-D; it is the first of a series of papers we are preparing dealing with VMR-D as seen by Spitzer; the IRAC data of the same region will be presented in a separate paper. Spitzer surveys of several other star forming regions have been already published, most of them in the framework of the cores-to-disk (c2d) legacy project (Evans et al. 2003). Most of these regions, however, are located outside the Galactic plane ( 10∘) in regions that were originally selected in part to avoid strong confusion and extinction problems. A huge amount of observational material has been so far accumulated and published on those clouds. For the VMR, our current multi-frequency database, when combined with the increased sensitivity of current instruments, has allowed us to overcome many of the problems associated with observations of GMCs in the galactic plane. Since the plane is where most of the material currently forming stars is located, it is both a natural and critical region to understand, and will also help with the comparison between the derived properties of our Galaxy with those of external galaxies, whose planes are the unique zones we are able to sample.
Spitzer has surveyed many different types of star formation regions. Therefore, legitimate comparisons between them all would benefit from a standard analysis and presentation, although some problems could arise because their numerous differing parameters, as well as the various details of the observations. In this paper we therefore adopt as much as possible the methods that have already been used successfully in the c2d program.
Our paper is organized as follows: in Sect. 2 we give the details of the observations and data reduction procedure; the results are presented in Sect. 3 and discussed in Sect. 4 and 5. Concluding remarks are given in Sect.6.
2 Observations
VMR-D cloud was observed with MIPS on board the Spitzer Space Telescope within the Guaranteed Time Observation program (PID 30335). The observations covered 1.15 (in R.A.) 1.6 (in dec.) degrees centered at , (J2000) = 8h 47m 50s, -43∘ 42′ 13′′ and 8h 48m 20s, -43∘ 31′ 26′′ at 24 m and 70 m, respectively (orientation: 145∘ W of N).
Data were collected on 14 Jun 2006 in scan mode, medium speed, with 5 scan legs and 160′′ cross-scan step, resulting in a total integration time of 40 seconds (for both 24 and 70 m) per pixel. The mapping parameters were optimized for the 24 and 70 m bands: as a consequence, the 160 m map suffers from coverage gaps and saturation and will be not considered in the following.
The SSC-pipeline, version S14.4.0, produced basic calibrated data (BCDs) that we have used to obtain mosaiced, pointing refined images by means of the MOPEX package provided by the Spitzer Science Center (Makovoz & Marleau 2005).
The main instrumental artifacts have been removed from the mosaiced images by means of the MOPEX package. Minor problems of residuals jailbars (expecially at 70 m) and background matching between adjacent frames (at 24 m) are still visible close to the brightest objects, but they do not affect significantly the point source photometry discussed in this paper.
The final 24 m map global properties can be summarized as follows: pixel scale of 2.45′′/pixel, background r.m.s. of 0.3 Jy/arcsec2, within the regions of high level of diffuse emission. The brightest sources saturate at the emission peak: for these we estimate a lower limit to the integrated flux of 4 Jy. In the 70 m map the pixel scale is 4.0 ′′/pixel and the background r.m.s. ranges between 23 and 94 Jy/arcsec2. None of the detected sources appears saturated at this wavelength.
3 Results
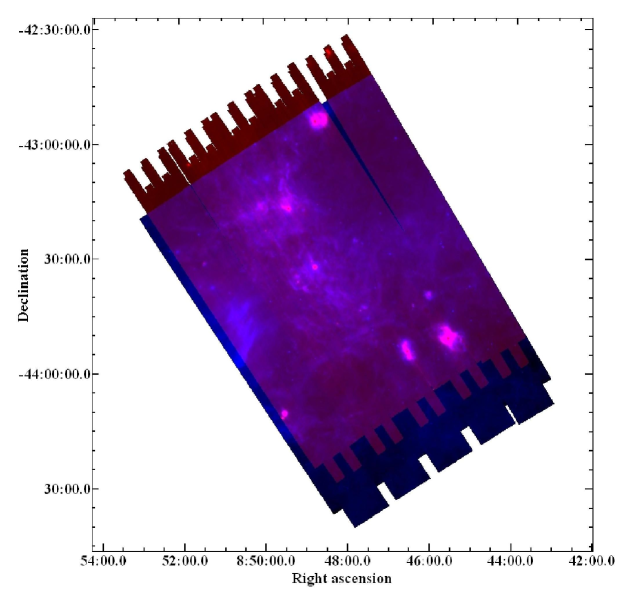
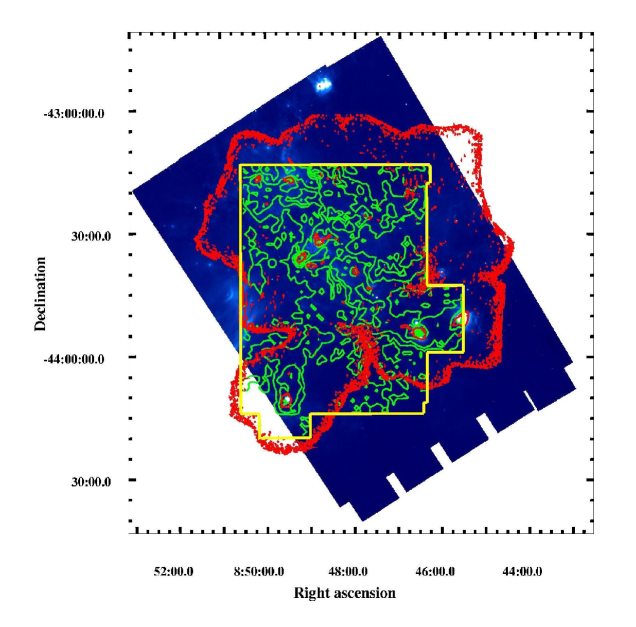
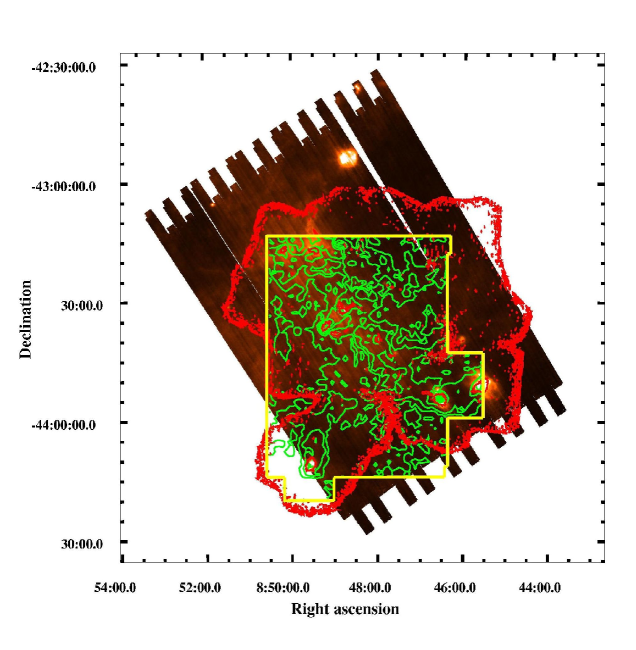
Figure 1 shows the two-color final mosaic of VMR-D (24 m in blue, 70 m in red), while on Figures 2 and 3, images in each of the two filters are shown separately. In these latter, the 1.2 mm dust map (adapted from M07) and the 12CO intensity map integrated in the velocity range -2 20 km s-1 (adapted from E07) have been superimposed for comparison. We define as ‘on-cloud’ all objects inside these latter contours. Such a definition is perforce just the first level effort of delimiting the sources belonging to the molecular cloud; indeed, it is clear from Figures 2 and 3 that the 12CO emission remains well above the 3 level at the north and west borders of the gas map, and thus sources belonging to VMR-D could exist toward these directions. Considering such sources as ’off-cloud’ will have the effect of reducing the distinctions between the ’on’ and ’off’ cloud populations; these sources should then be considered on a case-by-case basis (see sect.5.1). We have also considered as ’off-cloud’ those regions where the CO peak velocity is faster than 20 km s-1, since they are likely to be more distant and unassociated with VMR-D (see Figure 1 in Lorenzetti et al. 1993).
The point-source extraction and photometry processes were performed by using the DAOPHOT task of the astronomical data analysis package IRAF111IRAF, the Image Reduction and Analysis Facility, is a general purpose software written and supported by the IRAF programming group at the National Optical Astronomy Observatories (NOAO) in Tucson, Arizona (http://iraf.noao.edu).. Given the size of the MIPS mosaic it was impossible to apply any automatic procedure for finding sources down to the sensitivity limits without being affected by a locally varying background level; we therefore applied a searching algorithm as deep as possible, but still compatible with an automatic procedure. The search algorithm was applied to a differential image we produced between the final mosaic and a ’sky’ image, the latter obtained by applying to the mosaic a median filter over boxes of 55 pixels. A threshold of 30 has been imposed on the sky-subtracted image, which corresponds at least to 5 (depending on the local background) in the unsubtracted image.
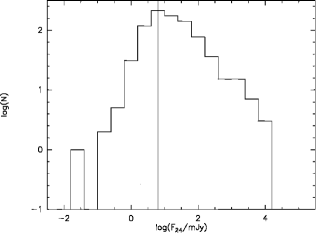
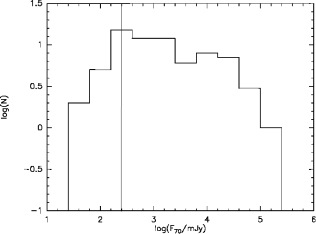
The automated methods just described lead to the detection of 838 and 61 point sources at 24 m and 70 m, respectively. A further 12 detections have been added to the 24 m list by applying local sky values in selected areas (see the discussion below). The source distribution as a function of the measured flux is depicted in Figures 4 and 5, where the completeness limits can be evaluated as the flux bin corresponding to the maximum counts before the decline at lower fluxes due to the instrumental sensitivity. We determine that our sample is complete down to 5 and 250 mJy at 24 and 70 m, respectively.
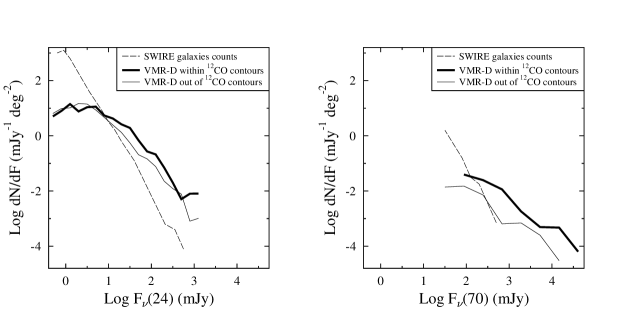
A statistical summary of the detected sources is presented in Table 1. About 45% of the 24 m sources are spatially located inside the region delimited by the 12CO contours ( 0.61 deg2), even though this latter is about one half the size of the remaining mapped area ( 1.23 deg2). This result gives an initial indication of how the IR source density increases by about 100% moving from outside to inside the CO contours, and the pattern becomes even more significant when considering the 70 m sources, whose source density increase is four times. The 24 m counts per deg2 are represented in Figure 6, left panel, where different symbols indicate those sources located respectively within and outside the CO contours. Also in this plot, where the differential number density is shown, there is a drop for Fν 35 mJy. For greater Fν values the number of objects inside the gas contours (i.e. those more likely associated to the cloud) systematically exceeds the number of objects outside the cloud, giving reasonable support to the empirical significance of this crude classification. In addition, Figure 6 is a comparison between the on- and off-cloud samples and the Spitzer Wide-area Infrared Extragalactic Survey (SWIRE, Lonsdale et al. 2003) legacy program. A significant amount of contamination from the extragalactic background is predicted (at 24 m) for flux densities 10 mJy down to the completeness limit, so that ’on’ and ’off’ source populations at this level become undistinguishable.
The counts per deg2 at 70 m are depicted
in Figure 6, right panel: here again the possible extragalactic contamination
appears just at (or even below) the completeness limit.
In the same Figure 6, we also note that the 70 m counts confirm the
on- and off-cloud distributions already found at 24 m.
The complete catalog of the detected sources is given in electronic form (a short sample version is printed in Table 2). In Table 3
we show the list of the 70 m detections: of the 61 sources, 52 of them are
coincident with a 24 m source (i.e. the distance in both right ascension
and declination is less than the 20′′ PSF radius
at 70 m, see the summary of Table 1). In Table 3, we list the
24 m coordinates (which are more accurate than the 70 m ones because of the
smaller PSF at 24 m), the distance from the 70 m coordinates,
(/)70, the measured flux at 24 and 70 m along with
the relative uncertainties, a flag indicating whether or not
the source is located inside the region delimited by CO emission contours, and
the association with a dust core, if any. This latter is based on the distance between the 24m
and mm coordinates, (/)mm, which must be within the SIMBA HPBW
of 24′′. All the dust cores associated with a 24 m source are also associated with
its 70 m counterpart.
Nine 70 m sources have no 24 m
counterpart. Four of these were not imaged at 24 m because of the shift between the two
maps, four appear as diffuse or with a filamentary structure at 24 m, and one
has F24 1.2 mJy (3 upper limit): this source (#1 in Table 3)
could be (if not a galaxy) a very young protostar which deserves further attention.
We also provide in Table 3 the association of MIPS 24/70 m sources with dust cores found in VMR-D by M07. The detailed study of these sources will be addressed in a future paper; here we give some preliminary results and point out some statistical aspects. In the region mapped in the dust emission at 1.2 mm (see Figures 2 and 3), a robust sample of 29 cores has been revealed, along with 26 cores whose size is below the map spatial resolution (24′′). D07 have associated 12 of these cores (8 resolved and 4 under-resolved) with an IRAS or MSX point source, while the remaining 43 cores are not associated with any FIR counterpart, so that they appear to be either cold Class 0 sources/starless cores (in case of resolved cores) or possibly data artifacts (in case of under-resolved cores). As stated in D07, such a high fraction of starless cores as compared to protostellar cores is most likely a result of the poor sensitivity of the IRAS/MSX facilities. Our significantly more sensitive MIPS data offers the opportunity to check whether or not such a bias exists, and to eventually find weak counterparts of the dust cores. In order to resolve this issue we closely reexamined our maps, performing photometry on the mm peaks coordinates using local rather than global thresholds for the background level. This technique turned up 12 new objects at a flux density as low as 0.7 mJy at 24 m, fainter than the completeness limit by more than a factor of 7.
This procedure, together with automatic finding described above, when applied overall led to the association of 23 resolved and 20 under-resolved cores with 58 sources at 24 m, 19 sources at 70 m (in some cases we found multiple associations), thereby dramatically increasing the percentage of cores associated with an embedded protostar from 22% (D07) to 78%. This result is in general agreement with recent MIPS findings in other GMCs that have substantially modified the percentage of active vs. inactive cores in favor of the former (e.g. Young et al. 2004). We also note that the existence of a MIPS counterpart to 20 out of 26 under-resolved cores significantly reduces the possibility that these objects are simply data artifacts. The lack, even at the MIPS sensitivity, of a FIR counterpart to five resolved dust peaks (namely MMS 6, 13, 15, 20, 24 in the list by M07) makes these objects a very robust sample of genuine starless cores.
4 Comparison with IRAS sources
The similarity of the MIPS 24 and 70 m bandpasses to the 25 and 60 m filters on-board IRAS offers us the opportunity to evaluate directly the reliability of the IRAS point source catalogue (IRAS-PSC) fluxes in crowded and diffuse clouds like VMR-D, objects that are commonly found in the galactic plane. A similar study has already been performed by R07 in the Perseus molecular cloud; although in this case the geographic location makes extended emission and source confusion less critical, only 61% (at 25m) and 32% (at 60m) of the objects of the IRAS-PSC are recovered by MIPS as point-like sources, while all the others, although detected, remain confused by nebulosity. Higher rates of coincidence are found, at least at 25 m, if the Faint Source Catalogue (FSC) - produced by point-source filtering the individual detector data streams - is used.
Unfortunately, the FSC does not cover the galactic plane, so that we cannot confirm this result on VMR-D. Here, a total of 57 high (fqual=3) or moderate (fqual=2) quality detections are listed in the IRAS-PSC catalogue at 25 m; 46 of them (80%) are also seen by MIPS and recovered with our algorithm, while the remaining 11 IRAS objects appear as diffuse emission at 24 m and are thus undetected as point-sources. The matching rate for VMR-D is thus higher than in Perseus. The same trend is seen at 60 m, where out of 48 IRAS-PSC items, the retrieval rate is of about 50%. In Table 4 we give the list of the IRAS-PSC (with any fqual) not recovered by MIPS. The IRAS sources in the table marked as ‘off-edge’ in one MIPS bandpass are necessarily ‘on-edge’ in the other, because of the spatial shift between the two focal plane arrays. Along with the fqual flag, we also give in Table 4 the IRAS correlation coefficient flag (cc) which provides an indication of the point-likeness confidence of the detected source. This flag is coded as alphabetical character and subsequent letters correspond to decreasing accuracy (i.e. A99%, E96%). Noticeably, PSC sources retrieved by MIPS (with fqual=2,3), show, on average, ‘cc’ flag equal to ”A” or ”B”: such an occurrence can thus be translated into a suitable tool to broadly distinguish between genuine point-source and diffuse emissions, if MIPS maps (and FSC detections) are unavailable.
5 Color-Magnitude diagrams
5.1 Ks vs. Ks-[24]
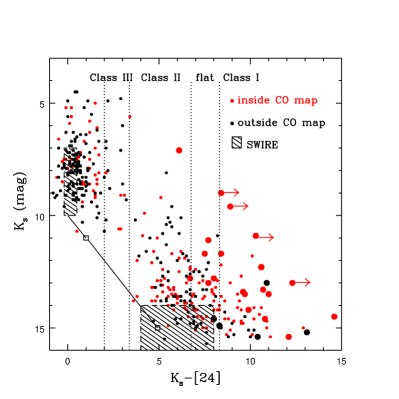
About half of the 24 m detections have identifiable 2MASS counterparts at Ks (limiting magnitude of 15.3) within a radius of 5′′. These 2MASS fluxes have been used to construct the Ks vs. Ks-[24] color-magnitude diagram given in Figure 7, where MIPS sources inside and outside the CO contours are shown with different colors. Also reported as hatched areas are the loci of the extragalactic sources in the SWIRE survey. As expected for a molecular cloud in the galactic plane, there are very few extragalactic sources seen. A remarkable number of objects fall at Ks8.5 mag and Ks-[24]0, which, given our completeness limit at 24 m of 5 mJy, delimits the region of normal photospheres in VMR-D. Noticeably, in this part of the diagram, the number density (per deg2) of the ’off-cloud’ sources is larger than that of the ’on-cloud’ ones (100 vs. 69, see Table 4): in principle, all the unreddened photospheres detected in VMR-D could be indeed foreground/background stars. More reasonably, we can affirm that no increase of main-sequence stars (with respect to the adjacent field) is registered in VMR-D, as expected because of the youth of the region.
The thick squares indicate the effects of an extinction of AV =
10 and 50 mag, respectively, on the data.
The quantitative AV map of the overall region by Dobashi et al. (2005) does not
provide values in excess to 5-10 mag (below the saturation limit of the catalog of 15
mag), while toward the dust cores AV can increase up to
20 mag (M07 and E07). We thus conclude that sources
with Ks-[24] 5 are probably reasonably young objects, and not merely extinguished
objects.
Indeed, it is not accidental that the large majority of these sources
belong to the molecular cloud, nor that the objects with normal photospheres are outside the
cloud.
From an evolutionary point of view, protostars can be characterized on the basis of the spectral
classification between 2 - 10 m (Greene et al. 1994), according to which
different evolutionary stages, from the accretion phase (Class I) to the beginning of
the main-sequence (Class III), are manifested.
The same authors have found that the 2 -10 m spectral index
does not change substantially when computed using fluxes up to 20 m
(by using photometry in the Q band); this result allows one to extrapolate the 24 m
flux for different spectral indexes and accordingly to compute
the expected value of the Ks-[24] color.
The result of this procedure is given in R07, who furthermore
requested that, to select Class III sources from
normal photospheres and foreground/background stars, Ks-[24]2. The spectral classification
derived for VMR-D is depicted in Fig. 7 and also reported in Table 5.
The ratio of ‘on-cloud’ over ‘off-cloud’ objects within the same class
increases with increasing Ks-[24] values;
moreover, most of the younger ’on-cloud’ objects are also detected in the 70 m band
(large, red dots in Fig. 7).
Noticeably, 70% of the ‘off-cloud’ objects showing the characteristics of the youngest
and coldest sources (black dots at Ks-[24]7) are located just outside the North and
West borders of the CO gas map, therefore they are reasonably genuine members of VMR-D; the
remaining sources (30%) with the same colours, if not belonging to VMR-D, could represent
star forming regions at larger distances.
In summary, we find a definitely many more young sources associated with the cloud, but
confirming that active star formation behind and/or in the close
neighbourhood of our cloud is going on as well.
The relative percentages of sources attributed to different evolutionary stages (see
Table 4) can be compared with those of other well studied star forming regions.
Schmeja et al. (2005), in particular, have investigated number ratios of sources
in different evolutionary classes in several star forming regions ( Ophiuchi, Serpens,
Taurus, Chamaleon I, IC348) basing on data obtained before than the Spitzer advent. They find,
on average, that Class I sources are 1-10%, while Class II/III sources are about 80-95%
of the total.
With the advent of Spitzer, these percentages have increased slightly in favor of younger
protostars: by combining both IRAC and MIPS data, Reach et al. (2004) classified as Class I
11% of the sources in IC1396A and Muzerolle et al. (2004) 20% of the sources in NGC7129.
Finally, in L1630 a ratio of 0.25 is found between Class I and Class II protostars (Muzerolle et
al. 2005). A comparison of our statistics with these is not straightforward both because of the
different classification adopted there (e.g. flat spectrum objects are not included) and the fact that
this paper uses MIPS data only. A more meaningful and direct comparison is with the works of Harvey
et al. (2007) and of R07, who performed a very similar analysis as the one we do here, but on
the Serpens star forming region and on the IC348 and NGC1333 clouds in Perseus. The percentage
of Class I vs. Class II objects is 6% vs. 63% (Serpens),
6% vs. 85% (IC348) and 7% vs. 67% (NGC1333), thus strongly in favoring the latter.
In contrast, we find percentages in VMR-D of 23% of Class I and 28%
of Class II.
Two possible alternatives could explain such a difference: i) VMR-D is significantly younger than either Perseus or Serpens. Such an hypothesis is supported by the age estimates of 1-2 Myr derived in the Perseus cloud (Palla & Stahler 2000, R07) and of 2 Myr derived in Serpens (Djupvik et al. 2006) as compared with an age of 105-106 yr towards the clusters of VMR-D (Massi et al. 2000); ii) our Ks vs. Ks-[24] diagram suffers from missing two important categories of sources. One category is represented by the 450 objects detected at 24m, but without a Ks-2MASS counterpart (see Table 1). The sensitivity limits of our survey in terms of power density at a given wavelength are Fλ(2MASS) Fλ(24-MIPS) 6 10-16 W m-2. This implies that these 450 sources are objects whose SED is rising with wavelength and thus they could be additional young objects that tend even to increase the already anomalous percentage of Class I sources. The second category, however, is represented by the about 5 104 2MASS objects not having a MIPS 24m counterpart. Their SEDs are allowed to decrease with increasing wavelength, therefore, although many of them could be foreground or background objects unrelated with the VMR population, they undoubtly represent a potential reservoir of Class II and III objects. It should be sufficient that a very small fraction of them ( 1-2%) were genuine Class II/III sources to reduce significantly the relative excess of Class I in VMR, and then to increase the apparent age of the region. In this view the disagreement with other star forming regions could be reconciled, by considering that in those cases the lower background level implied by their location outside the Galactic plane has permitted to reach detection limits at 24m up to an order of magnitude fainter than in Vela, therefore allowing to trace the SED also for faint Ks sources that decline going from the near- to the far-infrared. In any case, we expect to provide a more certain answer to this issue in the next future, by means of forthcoming IRAC images covering the relevant spectral bands at more adequate sensitivity.
5.2 [24] vs. [24]-[70]
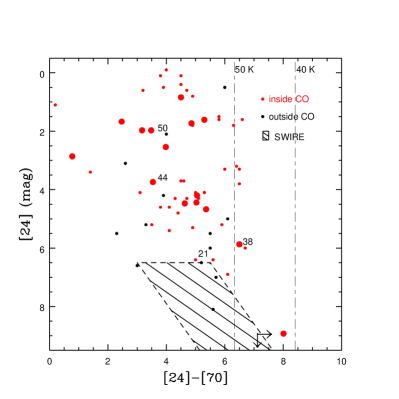
In Figure 8 the color-magnitude diagram based on MIPS fluxes alone is shown. Here the sources detected in both bands are plotted; the large majority of them are on-cloud, although there is no clear difference between sources associated or not associated with dust cores (large dots). Remarkably, all sources (except 3) are located to the right of [24]-[70]=2. This value pertains to SED’s that increase with wavelength in such a way that (Fλ)70 = 2(Fλ)24. These red objects are much more numerous than the 70 m detections depicted in Figure 7, since the majority of them lack a 2MASS counterpart. Forthcoming IRAC data will help us to reconstruct their SED’s more adequately, giving constraints on their luminosity and evolutionary stage. A few sources (6) lie in the locus corresponding to black-body temperatures ranging between 40 and 50 K. These are values theoretically predicted (Shu, Adams & Lizano, 1987) for a collapsing isothermal sphere, identified as Class 0 objects. These 6 sources are all located inside the CO cloud; two of them lie within a mm core and one (#38) is also associated to a compact H2 jet (see Sect. 6). Although at the moment a quantitative evaluation of their sub-mm vs. bolometric luminosity cannot be given, they still represent the best candidates for members of the youngest population within the cloud.
6 MIPS associations with H2 protostellar jets
MIPS offers a chance to identify, for the first time, very embedded compact exciting sources of molecular (H2) jets, found by D07, that have so far remained undetected even at the longest IRAS wavelengths. We recall once again that our completeness limits are significantly higher than the sensitivity limits, so that by scrutinizing our data-base for the weakest MIPS sources in selected areas, we have been able to discover new objects down to 0.7 mJy at 24 m. We used this technique to search for the sources driving a number of molecular jets that were previously found by narrow band imaging centered at the H2 (1-0)S(1) line (2.12m, see D07 for details). Although our H2 driving source survey is still incomplete, we here identify out some interesting cases in the VMR-D cloud.
The results of the correlation between H2 maps with our MIPS maps are given in Table 6; here we list each jet, the length and the dynamical time of the jet itself (having adopted d=700 pc); the total flux detected at 2.12 m and the corresponding H2 luminosity; the identification of the exciting source in our MIPS catalogue; the coincidence with a dust mm-peak, and finally an estimate of the source bolometric luminosity obtained by summing up all the contributions from the near-IR (if any) to the 1.2 mm flux, as derived by M07 SIMBA map. We identify several different morphologies among our sources, including discovering the driving sources for three of the jets (namely # 2, 4, 5), objects that were not detected in either near-IR (K band) or the far-IR (N-band, IRAS, MSX).
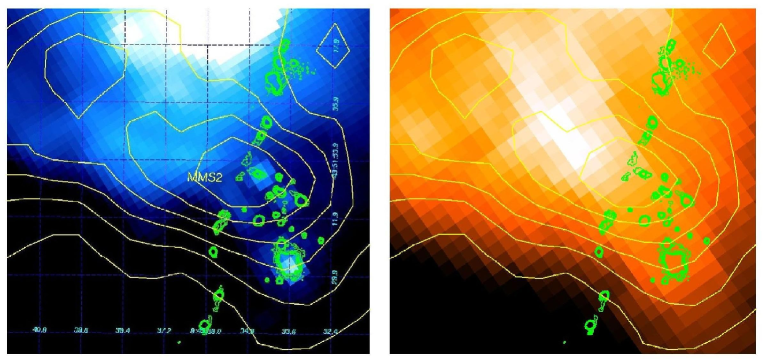
Jet 1 - The jet center lies towards a millimeter peak (MMS2), where no infrared source is detected down to K=17 mag. In the MIPS 24 m band, an emission peak is found, although not aligned with the jet axis. The lack of any aligned source suggests two possible alternative scenarios: (i) we are observing just one jet lobe or (ii), more reasonably, the exciting source is too faint to be detected even by MIPS (F(24) 0.7 mJy). Scheduled APEX observations will hopefully answer this question (Figure 9).
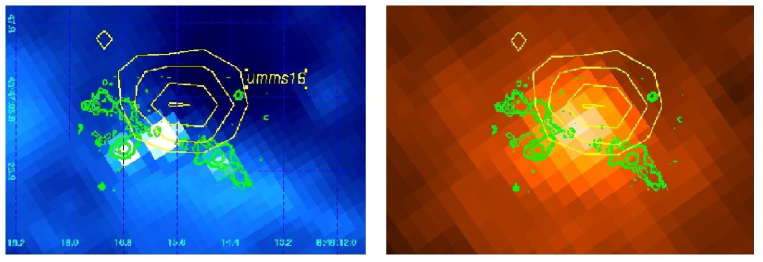
Jets 2 and 3 - Two small jets have been detected that correspond to faint dust peaks. The exciting sources, although not detected in the infrared (NIR bands, IRAS, MSX), are clearly recognizable in the MIPS images and one of them (#38) is a candidate Class 0 protostar. The compactness of these jets implies a very short dynamical age, if reasonable conditions for both shock velocity (vshock = 50 km s-1) and inclination angle (i = 45∘) are assumed (Figures 10 and 11).
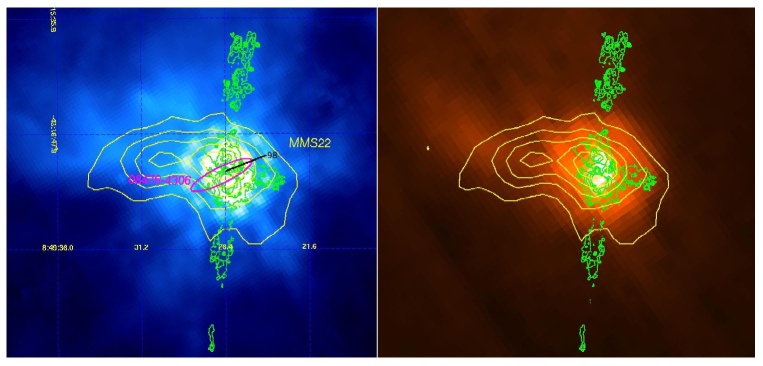
Jet 4 - A parsec scale jet emerges from a young near-infrared cluster centered on IRAS08476-4306. The proposed exciting source, detected in the near-IR bands is the IRS20-#98 according to the Massi et al. (1999) list (Figure 12).
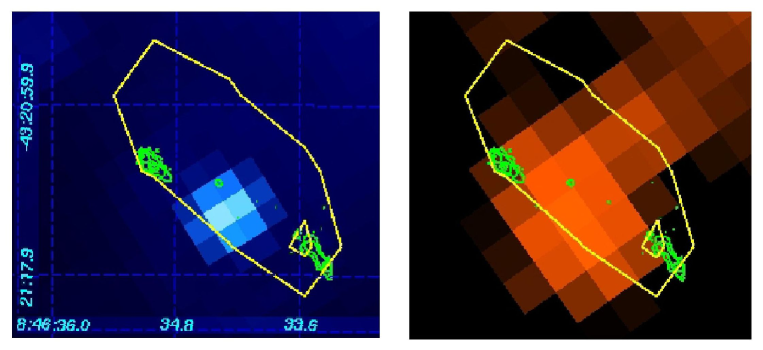
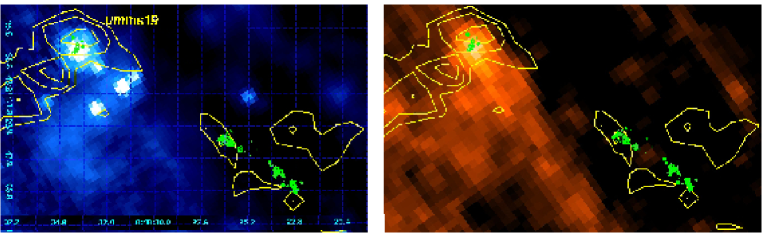
Jet 5 - A point-like 24/70 m source aligned with the jet and corresponding to a dust peak (umms19) is found about 2 arcmin away towards the NE. If this source is indeed driving the jet then we are observing just one jet lobe, being the counter-jet located outside the H2 investigated field. A NIR cluster is also found at the MIPS source position (Figure 13).
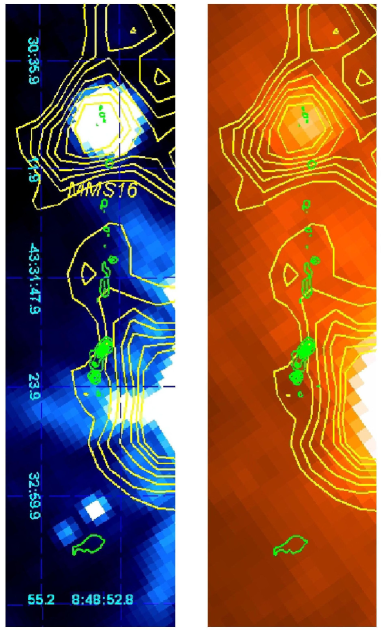
Jet 6 - A chain of H2 knots emerges from a MIPS source (not visible in the H2 band) centered at the dust emission peak MMS16. We do not observe a counter jet (Figure 14).
7 Conclusions
MIPS maps covering 1.8 square degrees across the Vela Molecular Cloud D at 24 and 70 m are presented. The data allowed us to derive the following results:
-
-
A total of 849 and 61 point sources at 24 and 70 m, respectively, have been detected at completeness limits of 5 and 250 mJy.
-
-
About half of the 24 m sources and two thirds of the 70 m ones are spatially located inside a region delimited by the 12CO contours (0.6 deg2). The implication is that the IR source density doubles (and is four times when considering sources at 70 m) inside the CO contours as compared to outside the molecular cloud. A quantitative analysis of the 24 and 70 m counts per deg2 confirms this result.
-
-
The maps allow us to correlate MIPS sources with the distribution of the dust cores found within VMR-D, and, when we extend the search of MIPS sources down to the instrumental sensitivity limit, we find that most of these cores result associated with red and cold objects.
-
-
The MIPS sensitivity has enabled us to identify many new starless cores; the result will prompt a revision of the relative percentages of young objects known so far in VMR-D.
-
-
IRAS-PSC detections of good quality (fqual=3,2) are also seen by MIPS, but only when the IRAS point-likeness confidence is high (correlation coefficient, cc, equal to A or B). This result may be adopted as a broad confidence prescription for finding genuine point sources in the IRAS catalogue.
-
-
About 400 MIPS sources have 2MASS Ks counterparts. Color-magnitude plots constructed with magnitudes at 2.2, 24 and 70 m in VMR-D show an excess of Class I objects in comparison with other well studied star formation regions. This excess could be biased by the sensitivity limits of the 2MASS and MIPS surveys, otherwise, it could reflect the short time elapsed since the first collapse of the cloud. From the MIPS colors, 6 objects appear as potential candidates Class 0 objects.
-
-
We have detected the driving source in five out of six H2 protostellar jets in VMR-D, four of them embedded in mm-cores. Such circumstance, along with the very low dynamical time estimated for the jets, indicates ages of 104-105 yr for these sources.
-
-
We note that, given the southern location of VMR-D, many of the newly detected MIPS sources will be excellent candidate targets for ALMA.
8 Acknowledgements
This paper is based on observations made with the Spitzer Space Telescope, which is operated by the Jet Propulsion Laboratory, California Institute of Techonology under a contract with NASA. HAS acknowledges partial support from NASA grant NAG5-10659.
References
- (1) De Luca, M., Giannini, T., Lorenzetti, D. et al. 2007 A&A, in press (arXiv:0704.1228, D07)
- (2) Djupvik, A. A., Andrè, P., Bontemps, S. et al. 2006, 458, 789
- (3) Dobashi,K., Uehara, H., Kandori, R. et al. 2005 PASJ, 57, S1
- (4) Elia, D., Massi, F., Strafella, F. et al. 2007 ApJ, 655, 316 (E07)
- (5) Evans N.J.,II, Allen, L.E., Blake, G.A. et al. 2003 PASP, 115, 965
- (6) Fazio, G.G., Hora, J.L., Allen, L.E. et al. 2004 ApJS, 154, 10
- (7) Giannini, T., Massi, F., Podio, L., et al. 2005 A&A, 433, 941
- (8) Giannini, T., Nisini, B., Vitali, F. & Lorenzetti, D. 2001 A&A, 379, L17
- (9) Greene, T.P., Wilking, B.A., Andrè, P., Young, E.T., Lada, C.J. 1994 ApJ, 434,614
- (10) Harvey, P.M., Rebull, L.M., Brooke, T. et al. 2007, ApJ, 663, 1139
- (11) Liseau, R., Lorenzetti, D., Nisini, B. Spinoglio, L. & Moneti, A. 1992 A&A, 265, 577
- (12) Lonsdale, C.J., Smith, H.E, Rowan-Robinson, M. et al. 2003 PASP, 115, 897
- (13) Lorenzetti, D., Giannini, T., Vitali, F., Massi, F. & Nisini B. 2002 ApJ, 564, 839
- (14) Lorenzetti, D., Spinoglio, L., & Liseau, R. 1993 A&A, 275, 489
- (15) Makovoz,D., & Marleau, F. 2005 PASP, 117, 1113
- (16) Massi, F., De Luca, M., Elia, D. et al. 2007 A&A, 466, 1013 (M07)
- (17) Massi, F., Lorenzetti, D. & Giannini, T. 2003 A&A, 399, 147
- (18) Massi, F., Lorenzetti, D., Giannini, T. & Vitali, F. 2000 A&A, 353, 598
- (19) Massi, F., Giannini, T., Lorenzetti, D., Liseau, R., Moneti, A., Andreani, P. 1999 A&AS, 136, 471 1025
- (20) Murphy, D.C. & May, J. 1991 A&A, 247, 202
- (21) Muzerolle, J., Megeath, S.T., Gutermuth, R.A. et al. 2004 ApJS, 154, 379
- (22) Muzerolle, J., Young, E., Megeath, S.T., Allen, L. 2005, on Star formation in the Era of Three Great Observatories, conference abstracts, p.41
- (23) Palla, F. & Stahler, S.W. 2000 ApJ, 540, 255
- (24) Reach, W.T., Rho, J., Young, E. et al. 2004 ApJS, 154, 385
- (25) Rebull, L.M., Stapelfeldt, K.R., Evans, N.J,II et al. 2007 ApJ, 171, 447 (R07)
- (26) Rieke, G.H., Young, E.T., Engelbracht, C.W. et al. 2004 ApJS, 154, 24
- (27) Schmeja, S., Klessen, R.S, & Froebrich D. 2005 A&A, 437, 911
- (28) Shu, F.H., Adams, F.C. & Lizano, S. 1987 ARAA, 25, 23
- (29) Werner, M.W., Roellig, T.L., Low, F.J. et al. 2004 ApJS, 154, 1
- (30) Yamaguchi, N., Mizuno, A., Saito H. et al. 1999 PASJ, 51, 775
- (31) Young, C.H., Jorgensen,J.K., Shirley, Y.L. et al. 2004 ApJS, 154, 396
- (32) Young, K.E., Harvey, P.M, Brooke, T.Y. et al. 2005 ApJ, 628, 283
| item | overall | inside CO contoursa | outside CO contoursb |
|---|---|---|---|
| 24m | 849 | 378 | 471 |
| 70m | 61 | 41 | 20 |
| 24m & 70mc | 52 | 40 | 12 |
| only 70m | 9 | 1 | 8 |
| 24m & 2MASS-Ksd | 401 | 180 | 221 |
| 24m & 70m & 2MASS-Ksd | 28c | 23 | 5 |
| 24m & dust peake | 58 | 55 | 3 |
| 70m & dust peake | 19 | 19 | 0 |
| Spitzer name | (2000.0) | (2000.0) | F24 | F24 | F70 | F70 | CO contours | dust core† |
|---|---|---|---|---|---|---|---|---|
| (h m s) | ( ) | (mJy) | (mJy) | (mJy) | (mJy) | |||
| SSTVMRD J084310.3-440052.7 | 8 43 10.3 | -44 00 52.7 | 4.5 | 0.2 | - | - | N | - |
| SSTVMRD J084332.8-440301.0 | 8 43 32.8 | -44 03 01.0 | 31.6 | 0.2 | - | - | N | - |
| SSTVMRD J084335.4-435539.0 | 8 43 35.4 | -43 55 39.0 | 8.2 | 0.1 | - | - | N | - |
| SSTVMRD J084342.4-440134.5 | 8 43 42.4 | -44 01 34.5 | 2.3 | 0.1 | - | - | N | - |
| SSTVMRD J084347.4-435946.3 | 8 43 47.4 | -43 59 46.3 | 42.0 | 0.1 | - | - | N | - |
[The complete version of this table is in the electronic edition of
the Journal. The printed edition contains only a sample.]
Notes to the table: †: following the nomenclature by M07 and E07, dust peaks
are called MMS# (umms# for under-resolved peaks).
| ID† | Spitzer name | (2000.0) | (2000.0) | (/)70 | (FF)24 | (FF)70 | CO contours | dust core†† | (/)mm |
|---|---|---|---|---|---|---|---|---|---|
| (h m s) | ( ) | (/) | (mJy) | (mJy) | /) | ||||
| 1a | SSTVMRD J084409.5-440018.3 | 08 44 09.5 | -44 00 18.3 | 1.2 | 753 | N | |||
| 2 | SSTVMRD J084431.7-435005.3 | 08 44 31.7 | -43 50 05.3 | 4.5/4.5 | 4.30.1 | 783 | N | ||
| 3 | SSTVMRD J084444.6-434214.2 | 08 44 44.6 | -43 42 14.2 | 12.0/1.7 | 44.60.1 | 413 | N | ||
| 4 | SSTVMRD J084444.9-434927.4 | 08 44 44.9 | -43 49 27.4 | 6.0/0.3 | 16.60.1 | 283 | N | ||
| 5 | SSTVMRD J084509.3-433802.7 | 08 45 09.3 | -43 38 02.7 | 16.5/1.2 | 18.60.2 | 2343 | N | ||
| 6 | SSTVMRD J084533.3-434952.8 | 08 45 33.3 | -43 49 52.8 | 0.0/18.0 | 33014 | 31882263 | Y | MMS1 | 0.9/27.2 |
| 7c | SSTVMRD J084535.5-435107.2 | 08 45 35.5 | -43 51 07.2d | 4000b | 22491449 | Y | |||
| 8e | SSTVMRD J084536.7-435155.4 | 08 45 36.7 | -43 51 55.4 | 0.0/ 16.5 | 30976 | 34414448 | Y | ||
| 9e | SSTVMRD J084537.0-435134.0 | 08 45 37.0 | -43 51 34.0 | 4.5/ 4.9 | 27406 | 34414448 | Y | ||
| 10 | SSTVMRD J084541.1-435146.9 | 08 45 41.1 | -43 51 46.9 | 3.0/ 2.4 | 161169 | 36680331 | Y | MMS3 | 15.3/14.9 |
| 11 | SSTVMRD J084544.0-432710.7 | 08 45 44.0 | -43 27 10.7 | 1.5/0.2 | 405.60.2 | 4654 | N | ||
| 12 | SSTVMRD J084546.7-432326.0 | 08 45 46.7 | -43 23 26.0 | 16.5/1.1 | 60.00.3 | 1394 | N | ||
| 13 | SSTVMRD J084604.4-433936.5 | 08 46 04.4 | -43 39 36.5 | 0.0/0.0 | 10414 | 464534 | N | ||
| 14a | SSTVMRD J084624.2-433415.6 | 08 46 24.2 | -43 34 15.6 | diffuse | 2175 | N | |||
| 15e | SSTVMRD J084626.4-434247.5 | 08 46 26.4 | -43 42 47.5 | 18.0/ 3.2 | 245.60.8 | 17125 | Y | umms1 | 9.4/20.9 |
| 16 | SSTVMRD J084626.7-434217.3 | 08 46 26.7 | -43 42 17.3 | 6.0/ 6.7 | 141.40.3 | 16127 | Y | umms1 | 13.9/9.3 |
| 17e | SSTVMRD J084627.3-434239.5 | 08 46 27.3 | -43 42 39.5 | 4.5/ 4.8 | 234.60.2 | 17125 | Y | umms1 | 22.9/12.9 |
| 18 | SSTVMRD J084631.4-435605.7 | 08 46 31.4 | -43 56 05.7 | 3.0/ 1.1 | 436610 | 1679091 | Y | ||
| 19e | SSTVMRD J084631.6-435532.2 | 08 46 31.6 | -43 55 32.2 | 7.5/ 7.2 | 3679 | 1493968 | Y | ||
| 20e | SSTVMRD J084633.1-435539.6 | 08 46 33.1 | -43 55 39.6 | 15.0/ 0.2 | 34911 | 1493968 | Y | ||
| 21 | SSTVMRD J084634.3-432115.1 | 08 46 34.3 | -43 21 15.1 | 3.0/ 0.4 | 18.90.1 | 2116 | Y | ||
| 22f | SSTVMRD J084634.9-435437.1 | 08 46 34.9 | -43 54 37.1d | 4000b | 78368173 | Y | MMS4 | 5.1/1.1 | |
| 23 | SSTVMRD J084637.4-435217.0 | 08 46 37.4 | -43 52 17.0 | 1.5/ 6.7 | 42929 | 902445 | Y | ||
| 24 | SSTVMRD J084637.5-435357.1 | 08 46 37.5 | -43 53 57.1 | 6.0/ 0.8 | 47588 | 31250180 | Y | ||
| 25e | SSTVMRD J084639.2-435254.1 | 08 46 39.2 | -43 52 54.1 | 3.0/ 12.4 | 3415 | 8975110 | Y | ||
| 26e | SSTVMRD J084639.5-435314.1 | 08 46 39.5 | -43 53 14.1 | 7.5/ 7.6 | 2156 | 8975110 | Y | ||
| 27 | SSTVMRD J084712.1-432250.6 | 08 47 12.1 | -43 22 50.6 | 1.5/ 1.9 | 102.10.3 | 3606 | Y | ||
| 28 | SSTVMRD J084714.4-431828.8 | 08 47 14.4 | -43 18 28.8 | 7.5/ 1.5 | 314.50.1 | 1275 | Y | ||
| 29 | SSTVMRD J084725.3-434900.1 | 08 47 25.3 | -43 49 0.1 | 6.0/ 0.5 | 511.70.4 | 1146 | Y | ||
| 30 | SSTVMRD J084731.2-435357.0 | 08 47 31.2 | -43 53 57.0 | 4.5/ 0.7 | 47.70.1 | 2294 | Y | ||
| 31 | SSTVMRD J084731.7-434555.7 | 08 47 31.7 | -43 45 55.7 | 7.5/ 4.4 | 26772 | 35910 | Y | ||
| 32a | SSTVMRD J084738.0-434255.3 | 08 47 38.0 | -43 42 55.3 | diffuse | 165316 | Y | |||
| 33 | SSTVMRD J084742.8-434352.4 | 08 47 42.8 | -43 43 52.4 | 13.5/ 1.7 | 1533.50.7 | 162912 | Y | umms11 | 4.8/13.4 |
| ID† | Spitzer name | (2000.0) | (2000.0) | (/)70 | (FF)24 | (FF)70 | CO contours | dust core†† | (/)mm |
|---|---|---|---|---|---|---|---|---|---|
| (h m s) | ( ) | (/) | (mJy) | (mJy) | /) | ||||
| 34 | SSTVMRD J084748.4-432536.4 | 08 47 48.4 | -43 25 36.4 | 9.0/ 5.9 | 1422 | 79611 | Y | umms12 | 24/19 |
| 35 | SSTVMRD J084751.7-432523.4 | 08 47 51.7 | -43 25 23.4 | 10.5/13.5 | 1373 | 11146 | Y | ||
| 36 | SSTVMRD J084755.7-441119.0 | 08 47 55.7 | -44 11 19.0 | 15.0/ 1.9 | 53.60.6 | 5185 | Y | ||
| 37 | SSTVMRD J084811.3-432056.0 | 08 48 11.3 | -43 20 56.0 | 15.0/ 0.6 | 83.40.3 | 5046 | Y | ||
| 38e | SSTVMRD J084815.8-434715.8 | 08 48 15.8 | -43 47 15.8 | 1.5/ 0.1 | 321 | 14107 | Y | umms16 | 1.2/8.0 |
| 39e | SSTVMRD J084816.7-434719.4 | 08 48 16.7 | -43 47 19.4 | 12.0/6.4 | 271 | 14107 | Y | umms16 | 14.7/11.6 |
| 40 | SSTVMRD J084826.5-431721.2 | 08 48 26.5 | -43 17 21.2 | 1.5/ 1.3 | 59.10.3 | 1626 | Y | ||
| 41a,g | SSTVMRD J084828.0-423630.8 | 08 48 28.0 | -42 36 30.8 | 953849 | N | ||||
| 42a,g | SSTVMRD J084829.3-423733.2 | 08 48 29.3 | -42 37 33.2 | 327946 | N | ||||
| 43a,g | SSTVMRD J084830.6-423559.9 | 08 48 30.6 | -42 35 59.9 | 1275963 | N | ||||
| 44 | SSTVMRD J084834.0-433051.3 | 08 48 34.0 | -43 30 51.3 | 1.5/ 2.9 | 2281 | 64517 | Y | umms19/20 | 13.6/7.4;22.1/8.5 |
| 45 | SSTVMRD J084841.6-433149.8 | 08 48 41.6 | -43 31 49.8 | 1.5/ 2.0 | 1162 | 9037 | Y | MMS9 | 20.4/1.8 |
| 46 | SSTVMRD J084844.2-431611.8 | 08 48 44.2 | -43 16 11.8 | 6.0/ 0.3 | 100.00.2 | 45510 | Y | ||
| 47 | SSTVMRD J084846.4-425055.6 | 08 48 46.4 | -42 50 55.6 | 12.0 13.6 | 451 | 77610 | N | ||
| 48h | SSTVMRD J084848.2-425420.2 | 08 48 48.2 | -42 54 20.2d | 4000b | 125200270 | N | |||
| 49i | SSTVMRD J084848.7-433230.7 | 08 48 48.7 | -43 32 30.7d | 4000b | 5064043 | Y | MMS12 | 3.9/2.7 | |
| 50 | SSTVMRD J084853.2-433057.1 | 08 48 53.2 | -43 30 57.1 | 0.0/ 2.6 | 11632 | 312630 | Y | MMS16 | 1.8/1.0 |
| 51 | SSTVMRD J084858.8-433825.1 | 08 48 58.8 | -43 38 25.1 | 10.5/ 2.0 | 1572 | 175818 | Y | MMS17 | 14.4/2.9 |
| 52 | SSTVMRD J084904.3-433805.0 | 08 49 04.3 | -43 38 05.0 | 3.0/ 4.9 | 1584 | 235928 | Y | MMS18 | 10.5/7.1 |
| 53 | SSTVMRD J084912.2-441636.5 | 08 49 12.2 | -44 16 36.5 | 4.5/ 4.4 | 281 | 48710 | N | ||
| 54a | SSTVMRD J084912.5-432953.3 | 08 49 12.5 | -43 29 53.3 | diffuse | 65010 | N | |||
| 55 | SSTVMRD J084913.1-433628.5 | 08 49 13.1 | -43 36 28.5 | 0.0/ 0.9 | 6851 | 291020 | Y | MMS21 | 1.5/0.4 |
| 56 | SSTVMRD J084914.3-430019.8 | 08 49 14.3 | -43 00 19.8 | 10.5/0.1 | 153.50.6 | 5979 | N | ||
| 57 | SSTVMRD J084915.3-433448.6 | 08 49 15.3 | -43 34 48.6 | 16.5/13.3 | 1582 | 221019 | Y | ||
| 58 | SSTVMRD J084917.0-435600.3 | 08 49 17.0 | -43 56 00.3 | 3.0/ 3.5 | 19.50.4 | 3756 | Y | ||
| 59 | SSTVMRD J084921.2-440159.5 | 08 49 21.2 | -44 01 59.5 | 1.5/ 6.7 | 158.30.1 | 2955 | Y | ||
| 60j | SSTVMRD J084926.2-431710.2 | 08 49 26.2 | -43 17 10.2d | 4000b | 3889086 | Y | MMS22 | 17.4/2.0 | |
| 61 | SSTVMRD J084928.6-440429.2 | 08 49 28.6 | -44 04 29.2 | 0.0/ 0.0 | 1.90.2 | 33910 | Y | MMS23 | 13.8/6.9 |
| 62k | SSTVMRD J084932.8-441050.0 | 08 49 32.8 | -44 10 50.0d | 4000b | 4430693 | Y | MMS26 | 15.6/9.9 | |
| 63 | SSTVMRD J084936.1-441200.2 | 08 49 36.1 | -44 12 0.2 | 7.5/ 2.5 | 14201 | 1359584 | Y | MMS27 | 23.1/4.2 |
| 64 | SSTVMRD J084959.5-432300.7 | 08 49 59.5 | -43 23 0.7 | 0.0/ 0.9 | 971 | 147213 | Y | umms26 | 6.9/5.1 |
| 65a | SSTVMRD J085038.9-434948.8 | 08 50 38.9 | -43 49 48.8 | diffuse | 3567 | N | |||
| 66 | SSTVMRD J085129.7-433124.0 | 08 51 29.7 | -43 31 24.0 | 16.5/ 2.2 | 74.10.2 | 22819 | N | ||
| 67a,g | SSTVMRD J085149.4-430540.2 | 08 51 49.4 | -43 05 40.2 | 665633 | N |
Notes to the table:†: this ID is used for simplicity throughout the paper ††:following the nomenclature by M07 and E07, dust peaks are called MMS# (umms# for under-resolved peaks), while gas peaks are called VMR#;a:detected only at 70m; b saturated; c IRS16 in the Liseau et al. (1992) list . ;d 70m coordinate; e associated with the same 70m source;f IRS17; g source outside the 24m map; h,i,j,kIRS18, IRS19, IRS20, IRS21 in the Liseau et al. (1992) list, respectively.
| PSC name | MIPS 24m | IRAS 25m | MIPS 70m | IRAS 60m | ||
|---|---|---|---|---|---|---|
| fquala | CCb | fqual | CC | |||
| 08441-4357 | diffuse | 1 | null | missing | 3 | E |
| 08475-4255 | diffuse | 3 | D | diffuse | 2 | D |
| 08475-4311 | diffuse | 3 | E | diffuse | 2 | C |
| 08478-4303 | intense knot | 3 | A | diffuse | 1 | null |
| 08479-4311 | diffuse | 3 | D | diffuse | 1 | L |
| 08487-4250 | diffuse (map edge) | 1 | C | diffuse | 3 | B |
| 08459-4338 | diffuse | 2 | D | missing | 3 | C |
| 08489-4241 | off edge | 3 | C | diffuse | 1 | D |
| 08457-4229 | off edge | 1 | E | diffuse | 2 | D |
| 08460-4223 | off edge | 2 | D | intense knot (map edge) | 2 | C |
| 08462-4235 | diffuse (map edge) | 1 | J | diffuse? | 3 | B |
| 08465-4230 | off edge | 2 | B | diffuse? (map edge) | 3 | C |
| 08471-4228 | off edge | 3 | G | intense knot (map edge) | 2 | D |
| 08473-4235 | off edge | 3 | E | diffuse (map edge) | 1 | null |
| 08437-4323 | diffuse | 1 | D | missing | 3 | B |
| 08468-4330 | diffuse | 3 | D | missing | 2 | D |
| 08488-4308 | diffuse | 2 | C | diffuse | 2 | E |
| 08490-4319 | diffuse | 1 | F | missing | 3 | C |
| 08491-4310 | diffuse | 3 | B | diffuse | 2 | C |
| 08491-4257 | diffuse? | 1 | E | missing | 3 | B |
| 08493-4331 | diffuse | 1 | H | missing | 3 | C |
| 08495-4306 | diffuse | 1 | C | diffuse | 3 | C |
| 08477-4329 | diffuse | 1 | H | diffuse | 3 | D |
| 08462-4400 | diffuse | 2 | D | diffuse | 1 | D |
| 08463-4343 | diffuse | 2 | B | diffuse | 3 | D |
| 08478-4403 | diffuse | 3 | C | off edge | 1 | J |
| 08478-4353 | diffuse | 1 | I | diffuse | 3 | D |
| item | inside CO map | outside CO map |
|---|---|---|
| photospheres | 42(23%) | 124(56%) |
| Class III | 5 (3%) | 11 (5%) |
| Class II | 51(28%) | 44 (20%) |
| flat spectrum | 40(22%) | 31 (14%) |
| Class I | 42(23%) | 11 (5%) |
| Class 0 | 6 | 1?a |
| Starless cores | 5 | 0 |
| Jet | length | Tdyna | F1-0S(1) | Lb | Exc. source | mm peakc | Lbol |
|---|---|---|---|---|---|---|---|
| (pc) | (103 yr) | (erg s-1 cm-2) | (10-2L☉) | (L☉) | |||
| 1 | 0.30 | 4.3 | 2.8 10-13 | 12 | - | MMS 2 | - |
| 2 | 0.13 | 1.7 | 1.5 10-13 | 6.6 | 38 | umms 16 | 0.3 |
| 3 | 0.08 | 1.1 | 1.6 10-14 | 0.7 | 21 | - | 0.07 |
| 4 | 0.68 | 93.5 | 1.7 10-12 | 73 | 60 | MMS 22 | 14 |
| 5d | 0.18 | 5.0 | 7.6 10-14 | 3.4 | 44 | umms 19/20 | 0.5 |
| 6d | 0.49 | 15.3 | 8.5 10-14 | 3.7 | 50 | MMS16 | 2.4 |