Emergent charge ordering in near half doped Na0.46CoO2
Abstract
We have utilized neutron powder diffraction to probe the crystal structure of layered NaxCoO2 near the half doping composition of 0.46 over the temperature range of 2 to 600K. Our measurements show evidence of a dynamic transition in the motion of Na-ions at 300K which coincides with the onset of a near zero thermal expansion in the in-plane lattice constants. The effect of the Na-ordering on the CoO2 layer is reflected in the octahedral distortion of the two crystallographically inequivalent Co-sites and is evident even at high temperatures. We find evidence of a weak charge separation into stripes of Co+3.5+ϵ and Co+3.5-ϵ, 0.06 below TCO=150K. We argue that changes in the Na(1)-O bond lengths observed at the magnetic transition at =88K reflect changes in the electronic state of the CoO2 layer.
pacs:
75.25.+z,71.45.Lr,71.30.+h,71.27.+aI Introduction
The alkali cobaltates NaxCoO2 have been the subject of intense interest as they are a rare example of competing interactions on a triangular lattice that can be easily tuned by chemical means. Varying the amount of Na () produces a rich phase diagram which exhibits spin dependent thermopower (0.75)Wang et al. (2003), metal-insulator transitions (0.5)Foo et al. (2004); Huang et al. (2004a), antiferromagnetism and 5K superconductivity at 0.3 for a hydrated compoundTakada et al. (2003) . More recently it has been realized both experimentally and theoretically that the role of the Na ions goes beyond providing a simple means to electronically dope the CoO2 layerRoger et al. (2007); Zhou and Wang (2007); Marianetti and Kotliar (2007). Rather, the ordering of Na-ions leads to a potential that perturbs the CoO2 layer to produce strong electronic correlationsRoger et al. (2007). The role of these correlations is still under investigation but it demonstrates that these materials can exhibit frustration in two different ways, one by the triangular topology of the CoO2 layer and the other by the Na induced potential.
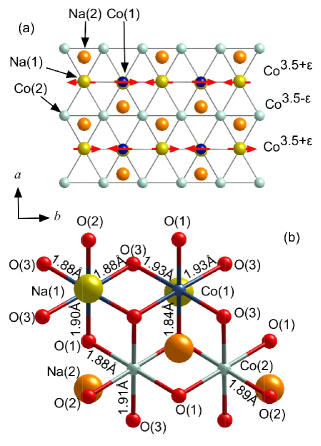
This double frustration is best exhibited at half-doping. Here the Na ordering results in a relatively simple orthorhombic distortion of the parent hexagonal phase in sharp contrast to the complex incommensurate structures found for higher compoundsRoger et al. (2007). For 0.5 Na-ions order as to form stripes as shown in fig.1 while the magnetic susceptibility shows two abrupt decreases (see for example inset in fig.2) at =88K and at =52KHuang et al. (2004a); Foo et al. (2004). The first transition is associated with the onset of a long range antiferromagnetic orderingHuang et al. (2004a); Foo et al. (2004); Gasparovic et al. (2006) while the second transition coincides with a sharp rise in the resistivityHuang et al. (2004a); Foo et al. (2004). This second transition has been ascribed to be driven by charge ordering (CO) of a electron to form distinct LS Co3+ () and LS Co4+ () ions Foo et al. (2004). Recent SR and neutron diffraction measurementsGasparovic et al. (2006); Mendels et al. (2005); Yokoi et al. (2005) propose a magnetic structure consistent with this picture, as the magnetic lattice comprises of stripes of magnetically inactive Co3+ and antiferromagnetic (AF) coupled Co4+ (see fig. 1(a)).
What is striking in this cobaltate is that the sequence of charge ordering and Nèel transitions is reversed (), compared to classic charge ordered systems such as the manganitesArgyriou et al. (2000) or magnetiteWright et al. (2001) and has brought the charge ordering picture into some doubt. To reconcile the fact that , Bobroff et al.Bobroff et al. (2006) propose on the basis of NMR measurements a scenario of a successive nesting of the Fermi surface (FS) that is coupled to a spin density wave in a way in which charge carriers are localized successively with decreasing temperature. However, this idea has been more recently disputed as the role of the Na-ions and the crystal potential that they impose on the CoO2 layer has been theoretically treated better. For example stripe Na ordering induces a weak incipient charge ordering on the CoO2 layerChoy et al. (2007); Zhou and Wang (2007); Marianetti and Kotliar (2007), however the mechanism of a progressive nesting of the FS with decreasing temperature arises directly from the Na-ordering as shown by a Hubbard model using the spatially unrestricted Gutzwiller approximationZhou and Wang (2007). Here the charge ordering is viewed to be driven by the ordering of Na above the antiferromagnetic ordering at =88K Choy et al. (2007); Zhou and Wang (2007). Nevertheless this model successfully predicts the correct antiferromagnetic orderingChoy et al. (2007) and suggests a charge separation into stripes of Co+3.5+ϵ and Co+3.5-ϵ, with 0.06Zhou and Wang (2007). This value represents a very weak charge ordering and is below the lower limit of detection for charge separation by NMRBobroff et al. (2006), but in agreement with powder diffraction measurements that suggest 0.12 at 10KWilliams et al. (2006).
In this paper we use neutron powder diffraction (NPD) over a wide temperature range (2-600K) to probe the crystal structure of layered NaxCoO2 near the half doping composition of 0.46 over the temperature range of 2 to 600K. Our NPD measurements show evidence of a dynamic transition in the motion of Na-ions at 300K which coincides with the onset of a near zero thermal expansion in the in-plane lattice constants of our Na0.46CoO2 sample. The effect of the Na-ordering on the CoO2 layer is reflected in the octahedral distortion of the two crystallographically inequivalent Co-sites and is evident even at high temperatures. We find evidence of a weak charge separation into stripes of Co+3.5+ϵ and Co+3.5-ϵ, 0.06 below TCO=150K, thus confirming a more physical sequence of charge ordering and magnetic transitions for this compound. We argue that changes in the Na(1)-O bond lengths observed at the magnetic transition at =88K reflect changes in the electronic state of the CoO2 layer.
The paper is structured in the following way. In section III we discuss the evidence for a weak charge ordering as determined from the temperature dependent NPD data. The dynamic behavior of Na-ions at high temperature and changes in Na-O bond lengths close to the magnetic transition are discussed in section IV, while the unusual temperature dependence of the lattice constants in section V. Discussion and summary are found in section VI and VII respectively.
II Experimental
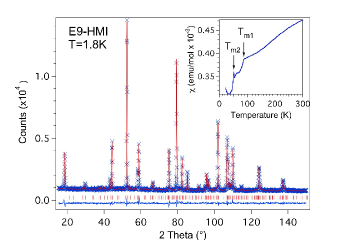
Polycrystalline samples were prepared using standard solid state synthesis techniques. The starting stoichiometry for these samples was Na0.75CoO2. In order to deintercalate Na from the lattice to achieve a 1/2 composition, a 5g portion of the 0.75 sample was immersed in a bromine-acetonitrile solution with a 1:1 Na to Br2 ratio, stirred in solution for 7-14 days and washed. The Na/Co ratio of the product was measured using neutron activation analysis (NAA) giving a composition 0.46(1). Magnetic susceptibility as a function of temperature () was measured using a Quantum design MPMS and was found to be identical to the published literature as shown in the inset of fig. 2 Foo et al. (2004); Huang et al. (2004a). Rapid measurements of high resolution neutron powder diffraction data were collected from the =0.46(1) sample using the HRPD diffractometer () at the ISIS-facility, Rutherford Appleton Laboaratory. Higher statistics data suitable for Rietveld refinement were measured between 2 to 600K using the high resolution powder diffractometer E9 (, =1.7973Å), located at the Berlin Neutron Scattering Center, at the Hahn-Meitner-Institut (HMI). Supplementary temperature dependent data were also measured from the 0.75 sample between 5-300K. All NPD data were analyzed using the Rietveld method which allowed us to measure lattice parameters, atomic positions and atomic displacement parameters as a function of temperature. A typical Rietveld refinement of the NPD data is shown in fig. 2.
III Evidence of Weak Charge Ordering
The validity of the reported orthorhombic P structure for Huang et al. (2004a); Williams et al. (2006) was tested by considering space groups that arise from distortions of the parent hexagonal structure P which are consistent with the reported orthorhombic unit cell. The program ISODISPLACE was used for this purposeCampbell (1991). This approach for the symmetry analysis resulted in space groups that were either centered or primitive monoclinic, in both cases incompatible with the diffraction data. Alternately, using as a starting point the reported space group P, and testing for related space groups that are compatible with the diffraction data resulted in primitive non-centrosymmetric solutions such as P or P. Rietvelds analysis on the basis of these space groups resulted in somewhat poorer fits than the reported structure. Our best modeling of the NPD data between 2-450K were obtained using the P model Huang et al. (2004a); Williams et al. (2006), producing refinements with of approximately 4% (between 2- 450K). Contrary to the observation for higher compositions, we find no evidence of incommensurability in the NPD dataRoger et al. (2007).
The crystallography of the P structure has been published elsewhereHuang et al. (2004a); Williams et al. (2006), however for clarity we illustrate it in fig. 1 and remind the reader that here there are two symmetry in-equivalent sites for Na (labeled Na(1) and Na(2)) and two for Co (labeled Co(1) and Co(2)). The local symmetry for the Co(1) and Co(2) sites differs in that the Na(1)-atom lies directly above or below the Co(1)-atom while the Na(2)-atom resides above a space formed between CoO6 octahedra as illustrated in fig. 1(b).
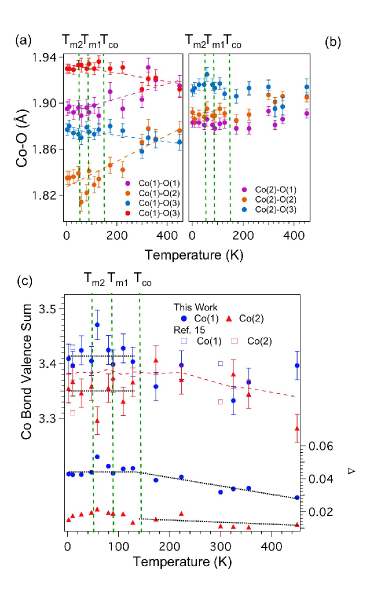
The effect of the Na-ion potential correlates with the distortion of the CoO6 octahedra. This distortion is shown in fig. 1(b) where we illustrated the difference on the CoO6-Na coordination and selected Co-O bond lengths. Here the Na-ion potential results in a distortion of the Co(1)O6 octahedron, so at 1.8K the six equal Co-O bonds found in metallic distort to form three long bonds (1.90-1.93 Å) and three shorter bonds (1.84-1.88 Å). In sharp contrast the Co(2)O6 octahedron is more regular with bond lengths varying between 1.88 to 1.91 Å. This indicates that the Co(1) ions experience essentially a different crystalline potential than the Co(2) ions, as a direct consequence of the Na ordering. In fig. 3(a,b) we show the temperature dependence of the Co-O bond lengths for the two Co sites. From these data it is evident that the larger distortion of the Co(1)O6 octahedron is maintained from low until high temperature, while the spread of bond lengths for the Co(2)O6 is smaller and relatively temperature invariant. These octahedral distortions can be quantified by the parameter , where , is the average Co-O bond length and the summation is done over the 6 Co-O bonds. Here would be zero for a regular octahedron with 6 equivalent Co-O bonds. We find that the Co(1)O6 octahedron is more distorted by a factor of 3 at high temperatures (see fig. 3(c)), compared to the octahedron centered on the Co(2) site. With decreasing temperature however this difference increases to a factor of 5 while the distortion saturates below 150K. As the data indicate on the same figure, the distortion of the Co(2) octahedron is much less sensitive to temperature.
At first sight, comparison of these bond lengths at 1.8K to the ideal LS Co3+ and Co4+-O bond lengths of 1.93 and 1.83Å respectively would suggest that there is no evidence for integer charge separation between Co(1) and Co(2) sites. The analysis of the experimentally determined Co-O bond lengths using the bond valence sum (BVS) method allows us to estimate the difference in the valance of the two Co-ions. For the calculation of the BVS we used 0.37 and 1.70 111These values correspond to Co3+-O bonds. Reliable values of Co4+-O bonds are not availableBrese and O’Keeffe (1991). The BVS as a function of temperature for the two Co sites is shown in fig. 3(c). For high temperatures we find that the BVS shows some scatter that reflects changes in the mobility and ordering of Na atoms between CoO2 sheets (see below) and possibly to geometrical differences that arises from the Na-ion potential imposed on the CoO2 sheet over the same temperature range.222Overall the validity of the BVS method may not hold in the case of dynamic effects. At high temperatures Na is mobile which is reflected in a large Debye-Waller factor () at around 300K which decrease smothly and rapidly to values similar as those found for Co and O () below 100K. However, below 150K we find a small but measurable and consistent difference of 0.06 in the BVS for the two Co atoms. Although the difference is comparably smaller than what is found in conventional charge ordered systems, the separation of the data into two values (one low and one high) below 150K is statistically significant. These data would suggest that below TCO=150K there is a separation of charge into Co3.5+ϵ and Co3.5-ϵ stripes running along the axis as shown in fig. 1(a). This charge ordered structure is in agreement with the magnetic neutron diffraction measurements, where the magnetically active Co-site would correspond to the Co(1) site with the slightly higher BVS and octahedral distortion. The values of the BVS obtained are in good agreement with both theoretical predictionsZhou and Wang (2007) and recently reported values at 10 and 300K respectivelyWilliams et al. (2006) which are also plotted on fig. 3(c) for comparison. The weak charge ordering found here is consistent with the relatively low resistivity of this material at low temperatures ( at 2K)Huang et al. (2004a); Foo et al. (2004); Gasparovic et al. (2006). That the average BVS is approximately 3.3 reflects the mixed valent nature of this compound.333The average BVS value lower than 3.5 reflect the absence of reliable parameters for Co4+. A similar BVS number are noted in ref. Williams et al., 2006.
IV Na Ordering and behavior of Na-O bond lengths
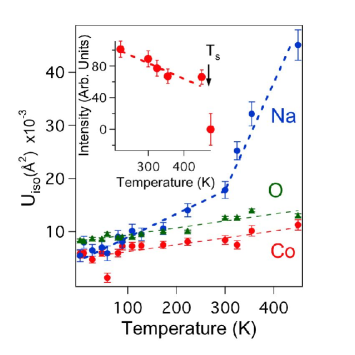
We now turn our attention to the behavior of the Na-layer for this composition. In fig. 4 we plot the temperature dependence of the atomic displacement parameters (Debye-Waller factor) determined from our Rietveld analysis. We find that the values of the O- and Co-atoms to be in general of the expected amplitude and show a linear behavior with temperature. The behavior of for the Na-ions however is unusual in that there is a clear change in slope at 300K separating a low and a high temperature behavior, while for T300K the values for Na become large. Such behavior is indicative of a dynamical transition occurring at 300K involving only the motion of Na-ions, as similar signatures are absent for the Co- and O-atomsHuang et al. (2004b). Indeed such large vales of suggest that Na-ions may become mobile between CoO2 layers above 300K.
For higher temperatures we find that our sample decomposes at 460K to NaxCoO2 and Co2O3. This transition is quantified by tracking the intensity of the (111) reflection as shown in the inset of fig. 4. This reflection is a superlattice reflection with respect to the parent P structure and arises from the ordering of Na-ions Huang et al. (2004a). Our neutron powder data measured at 475K indicate the loss of this and other superstructure reflections and a return to P symmetry with the addition of Co2O3 reflections.
Within this perspective we now look more closely to the temperature dependence of the Na-O bond lengths show in fig. 5(a,b). For both Na sites the Na-O bond lengths show a set of short bonds (2.36Å) and a set of long bonds (2.44Å). While the high temperature behavior is complicated by the high Na-ion motion as discussed above, on cooling below 300K the long bonds decrease, while the short bonds show an increase down to 150K. This correlated behavior in general indicates a displacement of Na-ions along the axis. At 150K we find that the small charge disproportionation in the CoO2 layer is not reflected in the Na-O bonds. Surprisingly however we find that at a decrease of 0.01Å of the long Na(1)-O bond and a correlated increase in the short Na(1)-O bond, while for the Na(2)-O bond lengths an opposite and less clear effect can be seen in the data.
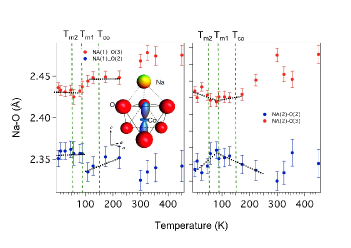
We interpret these changes in the Na-O bond lengths as reflecting changes in the electronic state of the CoO2 layer at . The nature of any coupling between changes in the electronic state of the CoO2 and Na can arises from the orbital configuration of the Co-ion itself. It is argued by Kroll et al.Kroll et al. (2006) that the edge-sharing Co4+O6 octahedra are compressed along the axis reduces the point group symmetry to . The orbital of the Co4+ is split in as = + , giving a fully occupied and a half filed . The latter orbital looks like a orbital and points along the axisKroll et al. (2006). For the case of the higher valent Co(1)-ion (nominally Co4+), this orbital would point in between the O-atoms and towards the Na(1)-atom as shown in the inset of fig. 5(a). Since the charge disproportionation here is small each Co ions will have a similar electronic and orbital configuration.
Therefore the orbital configuration of the Co-ions provides a means to couple electronically the CoO2 and Na layers. The nature of the coupling is electrostatic and would arise from the occupation of the orbital. We would expect that changes in the electronic configuration of the CoO2 sheet to be reflected also in the relative positions of the Na-ions as indicated by the Na-O bond lengths. More precisely changes in the electronic state of Co should be clearest for the Na(1)-O bonds as the Na(1)-ion sits directly above (or below) a Co(1)-ion. The same argument would suggest a less pronounced effect for the Na(2)-O bond lengths as the Na(2) ion resides above and between CoO6 octahedra. This is indeed reflected in the bond length data where a strong response is found in the Na(1)-O bonds and a less clear responce in the Na(2)-O bonds444The Na(2)-O response may arise from the repulsion of Na-ions. At we find no clear evidence of changes in the Na-O bond lengths. This is expected as the changes in charge separation at this lower transition are computed to be much smaller than those at Zhou and Wang (2007).
V Anomalous behavior of Lattice Constants
In fig. 6(a-b) we show the temperature dependence of the lattice constants determined from Rietveld refinement of the NPD data. These data show a positive thermal expansion (TE) for the axis between 2 and 450K, but for the and axis we find an almost constant TE between 2 and 300K; here for 300K linear TE expansion coefficients are /K and /K for and respectively. Such small TE was also discussed in ref. Williams et al., 2006 for a much more limited number of temperatures and smaller range in temperature. For K there is a return to positive TE for both in-plane parameters. This crossover coincides with the dynamic transition in the motion of the Na-ions as indicated by the behavior of for Na.
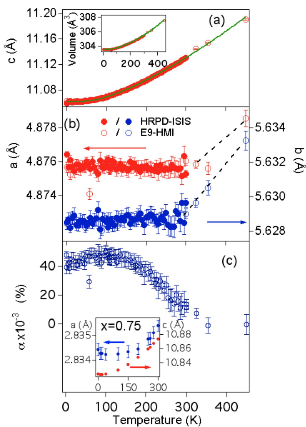
The behavior of the lattice constants for this 0.46 sample is in sharp contrast to our 0.75 sample (shown in the inset fig. 6), were we find a positive TE for both and axes between 5 and 300K. Assuming that TE is dominated by acoustic phonons below 300K for NaxCoO2 materials and whose frequency is relatively invariant between 0.75 to 0.46, the dependence of the lattice constants for the 0.75 sample (see inset in fig. 6(f)) can be used to quantify the difference in the in-plane TE between these two samples. Here we define the term where , and are the orthorhombic lattice constants of the 0.46 compound and is the hexagonal lattice constant of the compound.555Here was normalized to equal at 300K. For the higher temperature data (T300K) was assumed to vary linearly with temperature. Here represents an additional temperature dependent contribution to the expected in-plane lattice constants (as defined by ) and its temperature dependence in shown is fig 6(c). For T 300K is near zero, although the data in this region are more limited. However for T300K increases with decreasing temperature and reaches a value of at 1.8K. The maximum value of is at 150K, close to TCO. The decrease below this temperature is due to an increase in the for the 0.75 as seen in the inset of fig. 6(c). We speculate that the anomalous TE below 300K may be driven by electronic correlations induced by Na-ions.
VI Discussion
The measurement we present here suggest a picture of incipient charge ordering for near half doped NaxCoO2. At high temperatures the ordering of Na-ions defines two different CoO6 octahedra, one that is relatively undistorted and one that more distorted. On cooling the differences in octahedral distortions between these two different Co-sites becomes larger and may reflect an increasing influence of the Na-ion potential on the CoO2 sheet, as Na ions become more localized around their mean crystallographic positions. Indeed the near zero TE for the in-plane lattice constants coincides with a dynamical transition in the displacement parameter of the Na-ion. Further the physical meaning of can be interpreted as a measure of the Na-induced electronic correlations onto the CoO2 layer which in this view saturate at TCO=150K.
While our NPD work can correlate the distortion of the CoO6 octahedra and the Na-ordering even at high temperatures, it is not until TCO that we find evidence for a weak charge separation into stripes. Indeed it is possible that this pattern of charge ordering is present in the lattice from the onset as a direct result of the Na-ordering but it in effect is hidden by the dynamic behavior of the Na-ions. Therefore we argue that the charge ordering emerges at low temperatures as Na-motion becomes more confined.
More critically in terms of the physics of these materials we demonstrate that charge ordering occurs at a higher temperature that the magnetic ordering and electronic transitions at and respectively. This is consistent with recent theoretical models that suggest that the Na potential imposes a degree of charge ordering to the latticeChoy et al. (2007); Zhou and Wang (2007); Marianetti and Kotliar (2007). Indeed Zhou and Wang Zhou and Wang (2007), suggest that as much as half of the expected charge disproportionation would occur at a temperature above 666We compute these change by averaging over site 1 and site 3 in reference Zhou and Wang, 2007, consistent with our observations.
At lower temperature the changes in the CoO2 layer may be inferred indirectly by monitoring the Na(1)-O bonds. Here the orbital configuration of the Co provides for charge density pointing directly to the Na(1)-ions thus providing a sensitive parameter to electronic changes in the CoO2 layer. Indeed changes in the Na-O bond lengths may be more sensitive than changes in Co-O bonds as axial orbitals are empty. Our measurements find that that changes in the Na(1)-O bond lengths correlate with the magnetic transition at suggestive of further changes in the electronic state of the CoO2 layer. It is predicted that charge separation is enhanced gradually below Zhou and Wang (2007) but the changes here are overall again small and may fall outside the limits of our sensitivity. At we find no evidence of changes in the lattice or changes in the lattice symmetry. The prediction of a modulation of the amplitude of antiferromagnetically coupled spins as well as the charge within a Co+3.5+ϵ stripe is much smaller than our detection limit (0.02)Zhou and Wang (2007).
The structural observations at TCO we report here correlate with features in the charge dynamics. For example Quian et al. Qian et al. (2006) report from ARPES measurements that with increasing from the insulating region (were a clear gap is found) the size of the gap and the spectral weight around the gap decrease. Although the gap closes at the spectral weight does not completely vanish until approximately 120K, a behavior that is attributed to the formation of quasiparticles that gain significant weight due to coupling along the axis. For similar temperatures optical spectroscopy measurements find a broad feature that is associated with fluctuating charge ordering or a CDW in both anhydrousWang et al. (2004); Hwang et al. (2005) and hydrated superconducting samplesLemmens et al. (2006). These observation together with our structural measurements point towards a picture where at 150K an incipient charge ordering forms.
VII Summary
In summary this work establishes that the Na-ordering on the CoO2 layer is reflected in the octahedral distortion of the two crystallographically in-equivalent Co-sites and is evident even at high temperatures; The charge ordering occurs below TCO=150K, a temperature higher than the magnetic ordering found at =88K, consistent with theoretical models that suggest that the Na potential imposes a degree of charge ordering to the latticeChoy et al. (2007); Zhou and Wang (2007); Marianetti and Kotliar (2007); Below TCO we find a weak charge ordering into stripes of Co3.5+ϵ and Co3.5-ϵ with a 0.06 , a value in good agreement with that obtained from a Hubbard model using the Gutzwiller approximationZhou and Wang (2007); A dynamic transition in the motion of Na-ions occurs at 300K and coincides with the onset of a near zero thermal expansion for the in-plane lattice constants of our Na0.46CoO2 sample.
Acknowledgements.
The authors thank P.G. Radaelli, and L.C. Chapon for helpful discussions and W.S. Howells for assistance in the collection and reduction of the HRPD data.References
- Wang et al. (2003) Y. Wang, N. P. Ong, N. S. Rogado, and R. J. Cava, Nature 423, 425 (2003).
- Foo et al. (2004) M. L. Foo, S. Watauchi, R. J. Cava, Y. Wang, N. P. Ong, H. W. Zandbergen, and T. He, Phys. Rev. Lett. 92, 247001 (2004).
- Huang et al. (2004a) Q. Huang, J. W. Lynn, B. H. Toby, M. L. Foo, R. J. Cava, H. W. Zandbergen, G. Lawes, Y. Wang, N. P. Ong, and A. P. Ramirez, Journal of Physics Condensed Matter 16, 5803 (2004a),
- Takada et al. (2003) K. Takada, H. Sakurai, E. Takayama-Muromachi, F. Izumi, R. A. Dilanian, and T. Sasaki, Nature 422, 53 (2003).
- Roger et al. (2007) M. Roger, D. J. P. Morris, D. A. Tennant, M. J. Gutmann, J. P. Goff, J. U. Hoffmann, R. Feyerherm, E. Dudzik, D. Prabhakaran, A. T. Boothroyd, et al., Nature 445, 631 (2007),
- Zhou and Wang (2007) S. Zhou and Z. Wang, Phys. Rev. Lett. 98, 226402 (2007),
- Marianetti and Kotliar (2007) C. A. Marianetti and G. Kotliar, Phys. Rev. Lett. 98, 176405 (2007),
- Gasparovic et al. (2006) G. Gasparovic, R. A. Ott, J.-H. Cho, F. C. Chou, Y. Chu, J. W. Lynn, and Y. S. Lee, Phys. Rev. Lett. 96, 046403 (2006),
- Mendels et al. (2005) P. Mendels, D. Bono, J. Bobroff, N. Blanchard, H. Alloul, I. Mukhamedshin, F. Bert, G. Collin, D. Colson, A. Amato, et al., Phys. Rev. Lett. 94, 136403 (2005).
- Yokoi et al. (2005) M. Yokoi, T. Moyoshi, Y. Kobayashi, M. Soda, Y. Yasui, M. Sato, and K. Kakurai, Journal of the Physical Society of Japan 74, 3046 (2005),
- Argyriou et al. (2000) D. N. Argyriou, H. N. Bordallo, B. J. Campbell, A. K. Cheetham, A. Dos Santos, D. E. Cox, J. S. Gardner, K. Hanif, and G. F. Strouse, Phys. Rev. B 61, 15269 (2000).
- Wright et al. (2001) J. P. Wright, J. P. Attfield, and P. G. Radaelli, Phys. Rev. Lett. 87, 266401 (2001).
- Bobroff et al. (2006) J. Bobroff, G. Lang, H. Alloul, N. Blanchard, and G. Collin, Phys. Rev. Lett. 96, 107201 (2006),
- Choy et al. (2007) T.-P. Choy, D. Galanakis, and P. Phillips, Phys. Rev. B 75, 073103 (2007),
- Williams et al. (2006) A. J. Williams, J. P. Attfield, M. L. Foo, L. Viciu, and R. J. Cava, Phys. Rev. B 73, 134401 (2006),
- Brese and O’Keeffe (1991) N. E. Brese and M. O’Keeffe, Acta Crystallographica Section B 47, 192 (1991).
- Campbell (1991) B.J. Campbell H.T. Stokes D.E. Tanner and D.M. Hatch J. Appl. Cryst. 39, 607-614 (2006).
- Huang et al. (2004b) Q. Huang, B. Khaykovich, F. C. Chou, J. H. Cho, J. W. Lynn, , and Y. S. Lee, Physical Review B 70, 134115 (2004b),
- Kroll et al. (2006) T. Kroll, A. A. Aligia, and G. A. Sawatzky, Physical Review B (Condensed Matter and Materials Physics) 74, 115124 (2006),
- Qian et al. (2006) D. Qian, L. Wray, D. Hsieh, D. Wu, J. L. Luo, N. L. Wang, A. Kuprin, A. Fedorov, R. J. Cava, L. Viciu, et al., Phys. Rev. Lett. 96, 046407 (2006),
- Wang et al. (2004) N. L. Wang, D. Wu, G. Li, X. H. Chen, C. H. Wang, and X. G. Luo, Phys. Rev. Lett. 93, 147403 (2004),
- Hwang et al. (2005) J. Hwang, J. Yang, T. Timusk, and F. Chou, Phys. Rev. B 72, 024549 (2005).
- Lemmens et al. (2006) P. Lemmens, K. Y. Choi, V. Gnezdilov, E. Y. Sherman, D. P. Chen, C. T. Lin, F. C. Chou, and B. Keimer, Phys. Rev. Lett. 96, 167204 (2006),