Electron Energy Distributions at Relativistic Shock Sites: Observational Constraints from the Cygnus A Hotspots
Abstract
We report new detections of the hotspots in Cygnus A at 4.5 and 8.0 microns with the Spitzer Space Telescope. Together with detailed published radio observations and synchrotron self-Compton modeling of previous X-ray detections, we reconstruct the underlying electron energy spectra of the two brightest hotspots (A and D). The low-energy portion of the electron distributions have flat power-law slopes () up to the break energy which corresponds almost exactly to the mass ratio between protons and electrons; we argue that these features are most likely intrinsic rather than due to absorption effects. Beyond the break, the electron spectra continue to higher energies with very steep slopes 3. Thus, there is no evidence for the ‘canonical’ s=2 slope expected in 1st order Fermi-type shocks within the whole observable electron energy range. We discuss the significance of these observations and the insight offered into high-energy particle acceleration processes in mildly relativistic shocks.
Kavli Institute for Particle Astrophysics and Cosmology,
Stanford
University, Stanford, CA 94305, USA
Harvard-Smithsonian Center for Astrophysics,
60 Garden St.,
Cambridge, MA 02138, USA
Astronomical Observatory, Jagiellonian University,
ul. Orla 171,
30-244 Kraków, Poland
1. Introduction
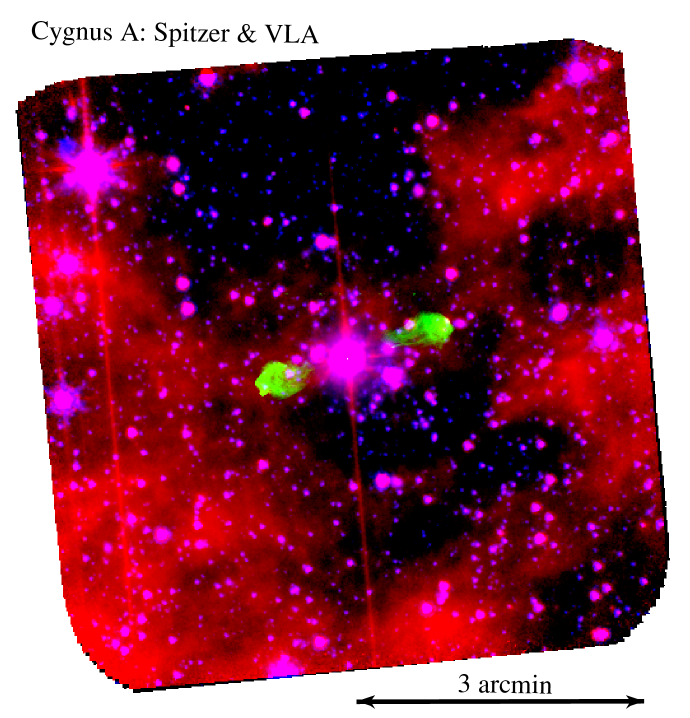
Cygnus A is the nearest example (=0.056) of a powerful Fanaroff-Riley type-II radio galaxy. As such, it contains some of the brightest radio hotspots to study these classical ‘working surfaces’ of relativistic jets (Hargrave & Ryle 1974; Blandford & Rees 1974). Although the hotspots are well-studied at radio and X-ray wavelengths (§ 2), Cygnus A is viewed through the galactic plane, making them difficult to study at optical wavelengths (1.26 mag of extinction at V-band; Meisenheimer et al. 1997). Additionally, it is well known that bright foreground stars lie in the direction of Cygnus A, and this has also hindered optical studies of the hotspots. To circumvent these obstacles, we obtained new Spitzer Space Telescope images (Figure 1) resulting in successful mid-infrared detections of the hotspots. These new data, together with a wealth of published high-quality measurements at other frequencies, give us some of the most complete hotspot SEDs for a powerful radio galaxy. This contribution is a summary of our recently published study (Stawarz et al. 2007).
2. Imaging and the Hotspot SEDs
We obtained new /IRAC (Fazio et al. 2004) observations simultaneously at 4.5 and 8.0 m for 3.6 hrs. Galactic extinction amounts to only 0.02–0.03 mag at these bands. A foreground star is known to lie within an arcsecond of the position of hotspot A – extrapolating its spectrum into the IRAC bands, its contamination to the hotspot IR fluxes is expected to be negligible (see Fig. 2g in Meisenheimer et al. 1997). Radio data were obtained from published VLA and BIMA measurements and maps (Carilli et al. 1991; Wright & Birkinshaw 2004; Lazio et al. 2006). We focus our discussion on the two brightest hotspots (A and D), whose spectral energy distributions (SEDs) are shown in Figure 2.

We modeled the synchrotron (radio-to-infrared) portion of the hotspot SEDs with a double power-law that decays exponentially at the higher frequencies:
| (1) |
The fitted parameters (, , , ) are (0.28, 1.2, 2.6109 Hz, 3.31013 Hz) for hotspot A, and (0.21, 1.1, 3.1109 Hz, 0.91013 Hz) for hotspot D. The minimum frequency, , can be extrapolated down to 74 MHz with the VLA detections of the hotspots by Lazio et al. (2006) at this frequency.
The hotspots emit strong X-ray emission by the synchrotron self-Compton (SSC) process as discovered with (Harris et al. 1994). Assuming this for the detection of the hotspots (Wilson et al. 2000; Wright & Birkinshaw 2004), we infer magnetic field strengths of 0.2–0.3 mG. The emitting plasma is close to equipartition with (Figure 3), consistent with the previous fits of the data. An optical measurement of hotspot D (Nilsson et al. 1997) lies near the low energy extrapolation of the SSC spectrum; this makes it one of the few hotspots with detected optical SSC emission (Brunetti 2004). Increasing the low energy spectral index () of hotspot D from its observed value to the ‘canonical’ value of 0.5 would overproduce the observed optical and IR emissions, so the observed flat spectra are likely intrinsic.
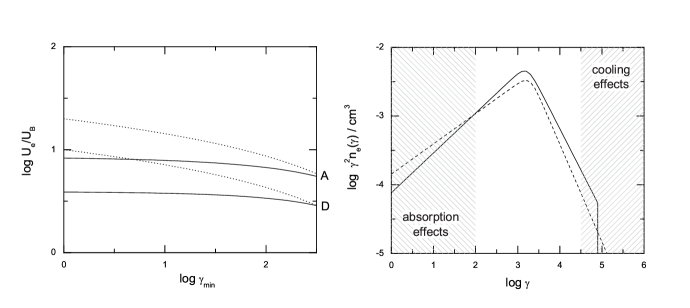
With the magnetic field and observed spectral fits, we can reconstruct the underlying electron energy spectra, (; Figure 3). They have the following features: (i) The critical break energy corresponds almost exactly to the ratio of the proton to electron masses, . (ii) The low-energy segment of the electron distributions continues down to at least 0.1 , with flat spectra; the power-law slopes are 1.4–1.6. (iii) The new IR data constrain the high-energy electron spectra, with indices 3 and maximum energies 50 . The “standard” electron spectrum expected from the diffusive (1st order Fermi) shock acceleration in the non-relativistic test-particle limit, , is not observed. The overall curved spectra are likely to be intrinsic rather than due to any absorption/cooling effects.
3. The Cygnus A Hotspots as Relativistic Shocks
Terminal shocks of powerful jets, like those in Cygnus A, are probably (mildly) relativistic, with an oblique magnetic field configuration. As such, it should not be surprising that the diffusive acceleration process known from the non-relativistic test-particle models are not directly applicable, i.e., the lack of a canonical shock-type spectrum – see Begelman & Kirk (1990) and Niemiec et al. (2006) for relevant discussions. The break frequency corresponding to the mass ratio preceded by a flat-spectrum power-law is also an interesting finding, which confirms some previous evidences for such in other powerful hotspots (see Leahy et al. 1989).
Our results, although inconsistent with the simplest modeling of terminal hotspots in radio galaxies as sites of the efficient 1st order Fermi acceleration, are instead in good agreement with our current understanding of relativistic shock waves. In particular, a flat power-law electron spectrum up to energies is consistent with the simple (1D) resonant acceleration model discussed by Amato & Arons (2006) for relativistic shocks. Their simulations show that as a result of resonant absorption of cyclotron emission produced by cold protons reflected from the shock front, a flat power-law electron energy distribution emerges between energies and , the latter possibly reduced by a factor of a few due to thermal dispersion in the upstream proton momenta ( is the bulk Lorentz factor of the upstream medium). The slope of this distribution is not well constrained by the simulations, but can be relatively flat and appears to depend on the plasma content (i.e., on the ratio of proton to electron number density). Although these particular simulations involve a large plasma, analogous processes are expected to take place also at mildly relativistic shocks considered in hotspots like Cygnus A ( few), so the model results can at least be applied qualitatively.
If such an association is correct, and if the results of Amato & Arons (2006) are applicable, then it would automatically imply that (i) the jets in powerful radio sources like Cygnus A are made of an electron-proton rather than electron-positron plasma, (ii) a significant fraction of the jet kinetic power is carried by cold protons, and (iii) the number density of protons within the jets is most likely lower than that of the electron-positron pairs (see the discussion in Stawarz et al. 2007). We note that these conclusions regarding the jet content would then be consistent with those presented for quasar jets (e.g., Sikora & Madejski 2000), which are widely regarded as beamed counterparts of FR II radio galaxies like Cygnus A.
Acknowledgments.
This work is based on observations made with the Spitzer Space Telescope, which is operated by the Jet Propulsion Laboratory, California Institute of Technology under a contract with NASA. The NRAO is operated by Associated Universities, Inc. under a cooperative agreement with the National Science Foundation. Ł. S. and M. O. were supported by MEiN through the research project 1-P03D-003-29 in years 2005-2008. The work at SAO was partially supported by Spitzer grant 1279229.
References
- Amato & Arons (2006) Amato, E., & Arons, J. 2006, ApJ, 653, 325
- Begelman & Kirk (1990) Begelman, M.C., & Kirk, J.G. 1990, ApJ, 353, 66
- Blandford & Rees (1974) Blandford, R.D., & Rees, M.J. 1974, MNRAS, 169, 395
- Brunetti (2004) Brunetti, G. 2004, in NATO Conf. Series 135, Eds. F. Mantovani & A.J. Kus, p. 29
- Carilli et al. (1991) Carilli, C.L., Perley, R.A., Dreher, J.W., & Leahy, J.P. 1991, ApJ, 383, 554
- Fazio et al. (2004) Fazio, G.G., et al. 2004, ApJS, 154, 10
- Hargrave & Ryle (1974) Hargrave, P.J., & Ryle, M. 1974, MNRAS, 166, 305
- Harris et al. (1994) Harris, D.E., Carilli, C.L., & Perley, R.A. 1994, Nature, 367, 713
- Lazio et al. (2006) Lazio, T.J.W., et al. 2006, ApJ, 642, L33
- Leahy et al. (1989) Leahy, J.P., Muxlow, T.W.B., & Stephens, P.W. 1989, MNRAS, 239, 401
- Meisenheimer et al. (1997) Meisenheimer, K., Yates, M.G., & Röser, H.-J. 1997, A&A, 325, 57
- Niemiec et al. (2006) Niemiec, J., Ostrowski, M., & Pohl, M. 2006, ApJ, 650, 1020
- Nilsson et al. (1997) Nilsson, K., et al. 1997, A&A, 324, 888
- Perley et al. (1984) Perley, R.A., Dreher, J.W., & Cowan, J.J. 1984, ApJ, 285, L35
- Sikora & Madejski (2000) Sikora, M., & Madejski, G. 2000, ApJ, 534, 109
- Stawarz et al. (2007) Stawarz, Ł., Cheung, C.C., Harris, D.E., & Ostrowski, M. 2007, ApJ, 662, 213
- Wilson et al. (2000) Wilson, A.S., Young, A.J., & Shopbell, P.L. 2000, ApJ, 544, 27
- Wright & Birkinshaw (2004) Wright, M.C.H. & Birkinshaw, M. 2004, ApJ, 614, 115