Characteristics of EGRET Blazars in the VLBA Imaging and Polarimetry Survey (VIPS)
Abstract
We examine the radio properties of EGRET-detected blazars observed as part of the VLBA Imaging and Polarimetry Survey (VIPS). VIPS has a flux limit roughly an order of magnitude below the MOJAVE survey and most other samples that have been used to study the properties of EGRET blazars. At lower flux levels, radio flux density does not directly correlate with gamma-ray flux density. We do find that the EGRET-detected blazars tend to have higher brightness temperatures, greater core fractions, and possibly larger than average jet opening angles. A weak correlation is also found with jet length and with polarization. All of the well-established trends can be explained by systematically larger Doppler factors in the -ray loud blazars, consistent with the measurements of higher apparent velocities found in monitoring programs carried out at radio frequencies above 10 GHz.
1 Introduction
At high galactic latitudes at least 70% of the sources seen by the Compton Gamma-Ray Observatory (CGRO; Hartman et al. 1999) EGRET instrument are identified with blazars (Sowards-Emmerd et al. 2003, 2004, 2005). These blazars exhibit flat radio spectra, rapid variability, compact cores with one-sided parsec-scale jets, and superluminal motion in the jets (Marscher 2006). At optical wavelengths blazars are characterized by broad or no emission lines, optically violently variable behavior, and relatively high linear polarization (Urry & Padovani 1995).
The identified EGRET blazars display a number of interesting radio properties. Based on 22 and 37 GHz monitoring of 43 sources, Lähteenmäki & Valtaoja (2003) suggest that the EGRET flares lagged behind mm flares. This is in direct contrast to other studies (e.g., Reich et al. 1993) that claimed enhanced radio emission following a high level of gamma-ray activity. Lister & Homan (2005) find that EGRET blazars have more strongly polarized jets than found in compact objects on average based on analysis of 26 EGRET sources overlapping with the Monitoring of Jets in Active galactic nuclei with VLBA Experiments (MOJAVE) VLBI survey. Kovalev et al. (2005) reported that EGRET blazars in the 15 GHz MOJAVE survey were more compact than non-EGRET blazars. EGRET blazars have also been claimed to have much higher superluminal speeds than other blazars, and to have gamma-ray flares associated with the ejection of superluminal radio knots (Jorstad et al. 2001a,b; Kellermann et al. 2004). However, in consideration of a larger sample (taken at 2 and 8 GHz) Piner et al. (2007) find no significant difference between the jet velocities of EGRET and non-EGRET blazars. In either case it still is unclear whether the radio flaring, or the ejection of new components, precedes or follows the gamma-ray flare, or whether there are in fact two classes of gamma-ray blazars (e.g., Sikora et al. 2001, 2002), one class with steep gamma-ray spectra and another class with flat gamma-ray spectra.
We have recently completed the 5 GHz VLBA Imaging and Polarimetry Survey (VIPS) of 1127 flat-spectrum sources stronger than 85 mJy in the Northern Cap region of the Sloan Digital Sky Survey (SDSS). VIPS (Taylor et al. 2005, Helmboldt et al. 2007a) was carried out between January and August of 2006 and includes 5 GHz, full polarization images of 958 sources as well as 147 total intensity images for sources previously observed as part of the Caltech Jodrell Bank Flat spectrum survey (CJF). The small remainder (22) were previously observed in the VIPS pilot survey and/or in the MOJAVE survey. Over 99% of the VIPS sources have been successfully imaged, with just under 1% being too weak to reliably self-calibrate and image.
The large, uniform sample provided by VIPS will have many uses, including enabling the intelligent follow-up of gamma-ray blazars as they flare and are detected by the Gamma-ray Large Area Space Telescope (GLAST; Gehrels et al. 2001). GLAST, to be launched in late 2007, will provide a dramatic increase in the resolution and energy range and over two orders of magnitude increase in sensitivity over CGRO-EGRET, thereby affording an unprecedented opportunity for the study of the centers of activity and jets in blazars in the gamma-ray energy range.
Here we make use of the VIPS survey to examine correlations in the parsec-scale jet properties of EGRET blazars.
2 Sample Definition
We have compared the latest EGRET catalog (Hartman et al. 1999) to the recently compiled Combined Radio All-sky Targeted Eight GHz Survey (CRATES; Healey et al. 2007a), and from the intersection compiled a sample of 173 candidate EGRET sources at . In Fig. 1 we plot the Gamma-ray mean and peak fluxes against the 8.4 GHz radio flux density from CRATES (Healey et al. 2007a) for 173 and 117 sources respectively. The VIPS sample (which covers only 14% of the sky), is derived from CLASS (Myers et al. 2003), but otherwise has similar radio flux limits and spectral selection as CRATES. Both CRATES and CLASS include A configuration VLA observations at 8.4 GHz. The full radio/-ray properties of the sample will be discussed in Healey et al. 2007b. Here we focus on the candidate EGRET sources within the 5700 square degree region of the sky covered by VIPS, which provides uniform quality VLBI imaging. The results are summarized in Table 1. This list contains 12 VIPS sources deemed likely candidates, and 19 VIPS sources deemed plausible candidates. Here “likely” and “plausible” refer to ranges in the Figure of Merit (FoM). The FoM is computed based on the 8.4 GHz flux density, the radio spectral index, the X-ray flux density, and the positional coincidence (Sowards-Emmerd et al. 2003). A source is considered “likely” if it has FoM 1, and “plausible” if it has 1.0 FoM 0.25.
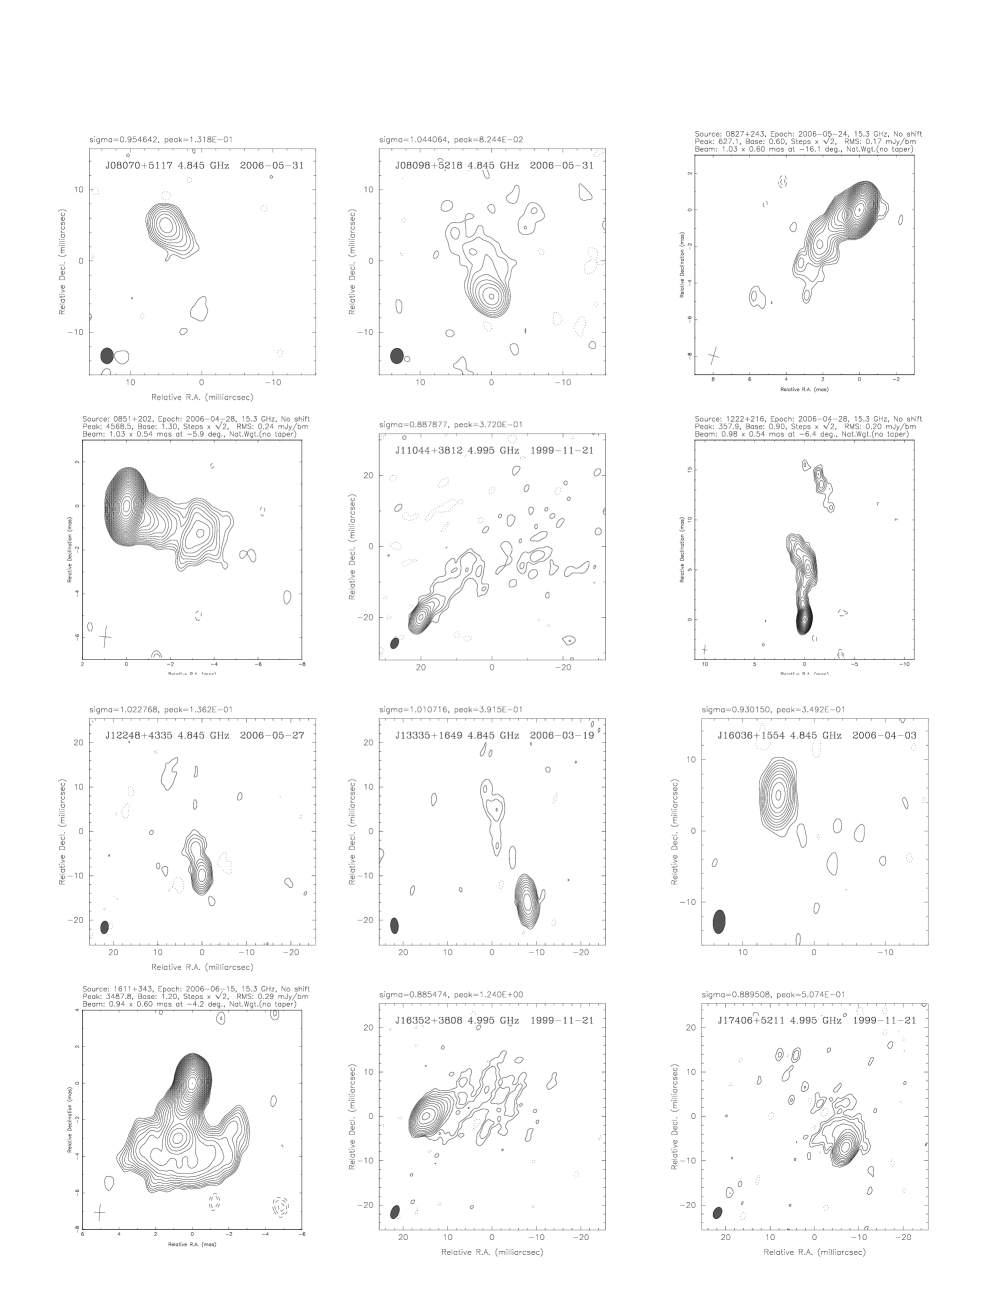
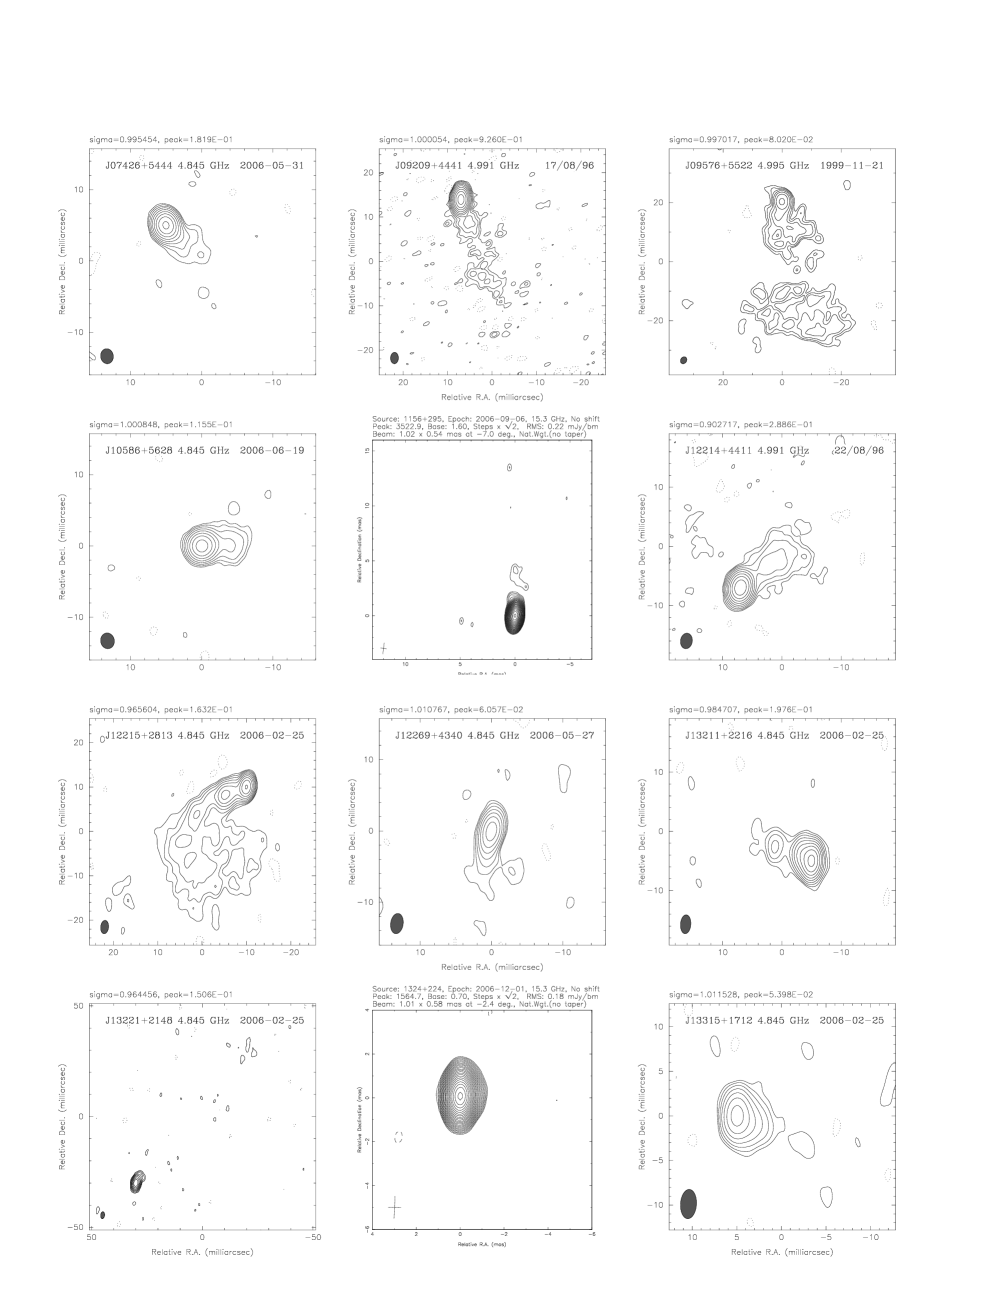
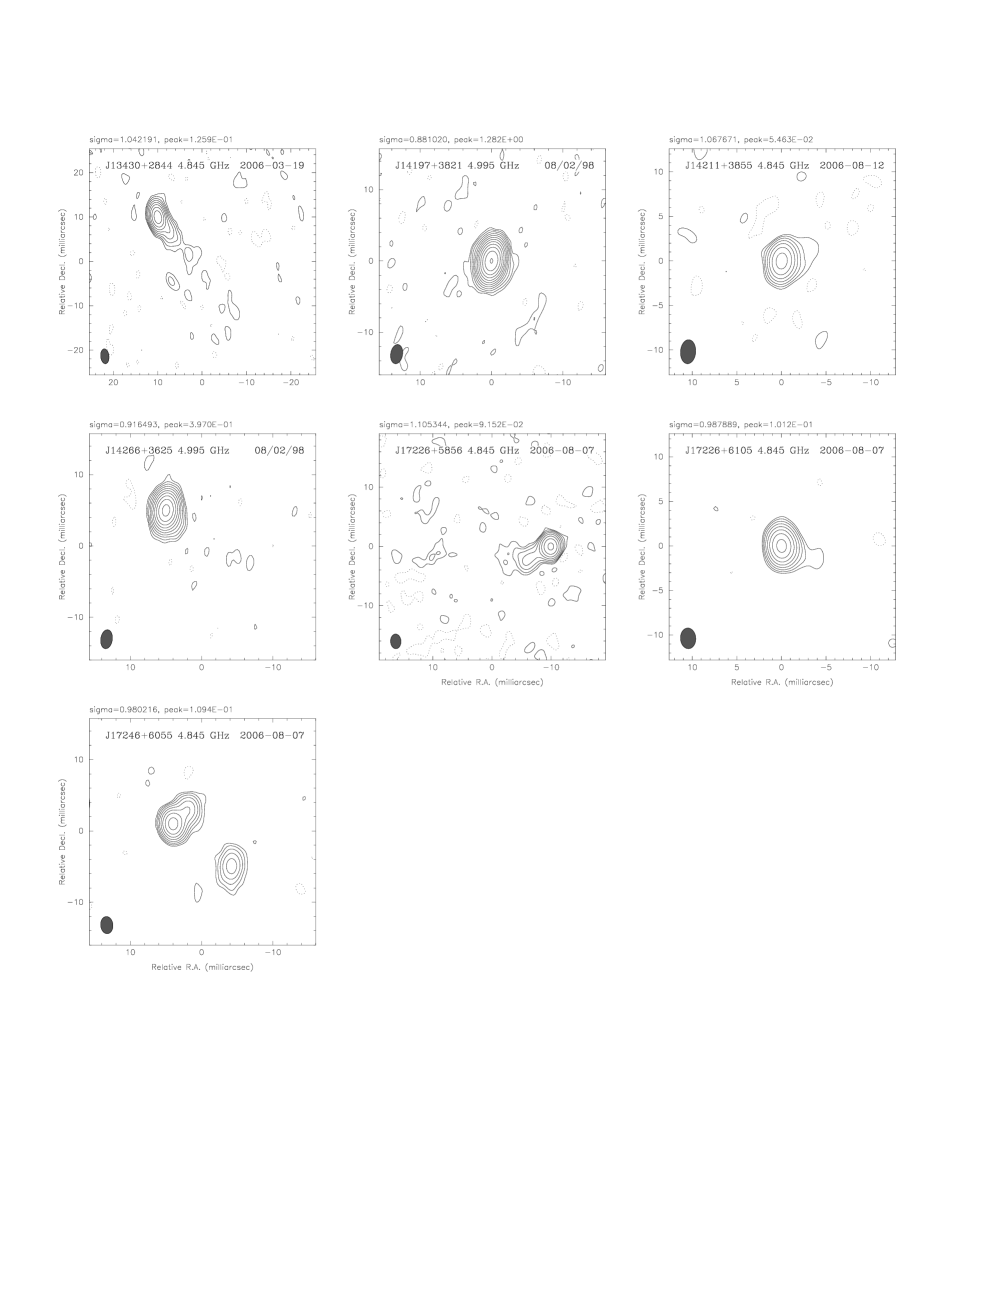
In some cases multiple VIPS sources are assigned to a single EGRET source. Since some EGRET sources may be in fact composites of multiple blazars we have not made any distinction between sources with multiple identifications and those with a single identification. For 6 bright sources otherwise meeting the VIPS source criteria, MOJAVE observations are available. In Fig. 2 we show the 5 GHz VIPS images or 15 GHz MOJAVE images for all 12 sources identified with EGRET blazars with high confidence (the “likely” candidates). In Figs. 3, and 4 we show the images for 19 sources identified as plausible counterparts. For completeness we include 15 GHz MOJAVE images (Kellermann et al. 2004) for those 6 VIPS sources that were not imaged at 5 GHz. One should remember that due to the large range in redshifts, the individual rest-frame emitted frequencies can range over a factor up to 3.2.
3 Morphological comparison
While a number of radio-bright EGRET sources distributed over the sky have been imaged with VLBI (see references discussed in §1), only in the VIPS region has the full EGRET candidate sample been uniformly imaged down to a flux density limit of 85 mJy at 8 GHz. In this section we examine the VLBI-scale properties of the 31 EGRET candidate blazars in this uniform sample, and for the 25 sources imaged as part of VIPS, we compare them to the properties of the VIPS survey of 1127 sources.
3.1 Source Classes
The classification of the EGRET candidates in VIPS is 8 PS (point sources), 3 SJET (short jets), and 14 LJET (long jets) according to the automatic classification scheme of Helmboldt et al. (2007a; see Table 2). There are no CSO (Compact Symmetric Object) candidates or CPLX (complex) sources. Applying the same classification rules to the 6 MOJAVE sources adds 5 LJET and 1 SJET for totals of 8 (25%) PS, 4 (13%) SJET, and 19 (61%) LJET. This can be compared to the population in VIPS as a whole which is 25% PS, 22% SJET, 43% LJET, 9% CSO and 2% CPLX. If EGRET candidates were drawn from the VIPS population at random then we would expect 8 3 PS, 7 3 SJET, 13 4 LJET, and 3 2 CSO and COMPLEX. While the number of PS and SJET sources are roughly as expected we find a marginally significant lack of CSOs, and a marginally significant excess of sources with long jets (LJET) on the parsec-scale.
3.2 Polarization
Polarization is detected from all 6 of the MOJAVE sources and from 9 of the 25 VIPS sources for a total of 48 12%. This is higher than the average of 36 4% in VIPS overall (Helmboldt et al. 2007a), and the 41 4% average for LJETs, though the numbers of sources involved are too small to make a definitive statment. Similarly a detailed examination of the polarization properties is handicapped by small number statistics and the fact that we have a mix of 5 GHz measurements for VIPS sources and 15 GHz measurements for MOJAVE sources. Lister & Homan (2005) found that that the jets (but not the cores) of EGRET blazars tended to have nearly twice the level of fractional polarization compared to MOJAVE sources not detected by EGRET, and are also more luminous. They attribute the difference to a higher mean Doppler factor for the EGRET blazars.
3.3 Core Fraction
In Fig. 5 we plot the distribution of core-to-jet ratio (defined as the ratio of flux density at 5 GHz in the VLBI core compared to the jet emission from the source at 5 GHz) for the EGRET candidates against the distribution for the VIPS survey as a whole. No k-corrections have been applied, even though the difference in spectral index between the core and the extended emission will result in a change in the ratio with source redshift. Given the similar range in redshifts, and the core dominated nature of the sources, the corrections should be modest and similar for both EGRET-detected blazars and VIPS sources as a whole. From the histograms, the EGRET sources appear to be biased toward more core-dominated systems. The K-S test probability that the two distributions were drawn from the same parent distribution is 4%. The core flux density for the EGRET blazars can be found in Table 3.
3.4 Brightness Temperature
We have obtained the brightness temperatures from automatic modelfits to source components as described in Helmboldt et al. (2007a). For sources with two or fewer components we have further refined the our modelfitting procedure by fitting to the visibility data directly. Only image plane modelfitting was carried out in Helmboldt et al. (2007a) due to the tendency for the automatic visibility modelfitting to go awry for complicated sources. The minimum observable size for each source was calculated using equation (2) from Kovalev et al. (2005), where we computed the SNR of each core using the core flux density, the rms measured from the 5 GHz image, and a beam FWHM of 3 mas, the largest dimension of our restoring beam. For those sources where the estimated core size is less than this minimum size (10% of all VIPS sources), we used the minimum size to compute . In Table 3 we provide the core sizes, core , brightest jet component , , and jet opening half angle for the VIPS blazars. For sources where the estimated core FWHM is less than the minimum, the core diameter is preceded by a ’’ and the core temperature is preceded by a ’’. In all cases we compute the observed brightness temperatures, without any correction to the source rest frame.
There is some indication that the brightness temperature for the cores of the EGRET candidates may be higher than average (see distributions in Fig. 6). The K-S test probability for these two distributions coming from the same parent population is 4%. For the jet components (formally, the brightest jet component) the two distributions look fairly similar, except that the spread in the EGRET distribution is smaller (see lower panel of Fig. 6); the K-S test for this pair of distributions is 11%.
3.5 Jet Opening Angle
We have measured a mean opening half-angle by the following procedure: We measure the separation of each jet component from the core along the jet axis (taken to be a linear fit to the component positions) and the distance of each component from the jet axis, i.e., x’ and y’ positions in a rotated coordinate system with the jet axis along the x’-axis. For each component, we measure its extent from its center along a line perpendicular to the jet axis using the parameters of its elliptical fit, and then deconvolve this using the extent of the Gaussian restoring beam along the same line. The opening half-angle measured from each component is then taken to be
where is the deconvolved Gaussian size perpendicular to the jet axis. After measuring this for each jet component, we average them to get one value. This is only done for sources with more than 2 total components, (i.e., at least 2 jet components). This means that as in the case of jet bending (see §3.6), we only have quantitative estimates for four of the EGRET/VIPS sources (see. Fig. 7). Though this is based on very small statistics there is a hint that EGRET/VIPS jets have unusually large opening angles. We find 3 sources have jet opening half-angles exceeding the VIPS median (18.9∘). Monte-Carlo simulations of opening angles using the VIPS sample suggests that 3 out of 4 of the randomly sampled values are greater than the median about 30% of the time. So, there’s less than a 1 in 3 chance that the EGRET blazars have the same distribution for the opening angle as the whole VIPS sample. Looking at the EGRET/MOJAVE and EGRET/VIPS sources by eye in Figures 2-4 strengthens this impression. We see in Figures 2-4 six sources (J08098+5218, J09576+5522, J12215+2813, 1611+343, J16352+3808, J17406+5211) that have opening angles larger than 20 degrees. This can be compared to the VIPS images for the survey as a whole which are online111See http://www.phys.unm.edu/gbtaylor/VIPS/. In a few of the blazars the emission is rather diffuse which is why they do not show up in the automatic opening angle calculation.
3.6 Jet Bending and Length
We can also compare the amount of bending in the jet on the parsec scale for the EGRET candidates compared to VIPS as a whole. The amount of bending was calculated by fitting a parabola to the centroids of Gaussian model components (Helmboldt et al. 2007b). Again we are limited to only 4 sources (Fig. 7), and the results are inconclusive. In fact the source with the largest reported bend, J09576+5522, could be much less bent depending on if the morphology is attributed to a twisting jet, or to a jet with a broad opening angle. Looking at the EGRET/MOJAVE and EGRET/VIPS sources by eye only increases the number of highly bent jets by one. We see in Figures 2-4 4 sources (J12215+2813, J17226+5856, J17246+6055, J17406+5211) that appear to bend through more than 20 degrees on the parsec scale.
Given the slight preponderance of sources with long jets, we compared the distribution of jet length in EGRET blazars with VIPS as a whole. There does not appear to be an appreciable difference between the two populations. The K-S probability that the two are drawn from the same distribution is 34%.
4 Notes on Individual Sources
J11044+3812 = Mrk 421 A well known BL Lac and also one of the first sources to be detected in TeV emission (Punch et al. 1992). Mrk 421 was included in both the CJF (Taylor et al. 1994) and 2cm surveys (Kellermann et al. 2004) and has also been recently imaged by Giroletti et al. (2006).
J16036+1554 This source is completely unresolved by the VLBA observations at 5 GHz (Helmboldt et al. 2007a), and can be well fit with a single component (the core) with size of mas. This results in a brightness temperature of K. Such completely unresolved sources without any jet components are quite rare - there are essentially no sources this compact in MOJAVE (Kovalev et al. 2005) or CJF (Taylor et al. 1994).
J17246+6055 The faint (r band magnitude 21.2) host galaxy does not yet have a known redshift or spectroscopic classification. The parsec-scale radio structure (see Fig. 4) is quite unusual with a core-jet and a fairly compact component to the southeast. It is possible that this source could be a compact supermassive binary black hole, and further VLBI observations are in progress to test this hypothesis. Another possible explanation is a jet with a sharp bend and wide opening angle, such as Mrk 501 (Giroletti et al. 2004) or Mrk 421 (Giroletti et al. 2006; and see Fig. 2).
5 Discussion
From an analysis of the properties of the EGRET candidates in §4, we find that candidates tend to have high core fractions and high brightness temperatures. These facts support models wherein the gamma-rays are produced in a jet oriented at a small angle to the line-of-sight (e.g., Dermer et al. 1992). The large opening angles seen in 6 out of the 31 sources could also indicate a sight-line close to or within the beaming cone of the radio emission. A selection effect of this sort would happen naturally if the gamma rays are more tightly beamed or collimated than the radio. In other words, gamma-ray selected sources have higher Doppler factors than the population of compact sources as a whole. This can also explain the observations of higher core fractions, higher brightness temperatures, and higher polarization in gamma-ray blazars compared to the population of AGN as a whole, as well as the reports of faster motions. An unbiased comparison of jet components between the EGRET blazars and the VIPS sample at large supports this, though only 4 of the EGRET/VIPS sources have enough jet components to permit the unbiased (automatic) analysis so the statistics are poor.
Somewhat more surprising is the evidence in support of long jets, though this is of marginal significance. Continuing the line of discussion above that EGRET blazars have higher Doppler factors due to small angles to the line-of-sight, the a priori prediction, assuming jets of a fixed length and modest velocity, would be for shorter jets due to projection. Obtaining longer jets might be possible if the jets of blazars have intrinsically greater surface brightness, or are highly Doppler boosted compared to sources in radio selected samples. Longer jets in blazars could also be obtained if there is a bias in the selection. The redshift distribution for the VIPS sample is still incomplete, so it is difficult to investigate possible selection bias at this time. Given the weakness of the evidence, especially when comparing the distributions of jet lengths (§3.6), further speculation on this topic is not yet warranted.
6 Conclusions
Sources selected on the basis of their -ray flux as determined by EGRET appear to have higher Doppler factors than the radio-selected population at large. In the VIPS survey this selection manifests itself in larger core fractions, higher core brightness temperatures, increased polarization, and possibly broader jets.
GLAST, which will launch in late 2007 or early 2008, will detect several thousand (Gehrels & Michelson 1999) of the tens of thousands of compact, radio-loud, flat-spectrum AGN currently known. Confirming the tighter beaming angle for the -rays should be easily achieved with the improved statistics. Greater advances in understanding are anticipated, though detailed studies including multi-wavelength flux monitoring, and multi-frequency, multi-epoch VLBI polarimetry will be possible only for a small subset of objects. As we have shown, the gamma-ray flux density is not simply related to the radio flux-density, so selecting the brightest radio sources for study may not maximize the chances of coincidence with strong gamma-ray emission. Therefore it may be advantageous to consider selecting sources with large core fractions, high central brightness temperatures, and large opening angles, as well as strong radio flux density. GLAST could also see new populations of AGN including Seyfert galaxies, and low power radio galaxies. For this reason it is important to provide contemporaneous ground-based monitoring of a range of source classes, powers, and morphologies. Comparisons between the parsec-scale radio structures as revealed by VLBI observations and the time variable -ray flux, could discriminate between various models describing the production of the -ray emission, or reveal that more than one mechanism is at work.
We thank an anonymous referee for constructive suggestions. The National Radio Astronomy Observatory is a facility of the National Science Foundation operated under cooperative agreement by Associated Universities, Inc.
References
- Condon et al. (1998) Condon, J. J., Cotton, W. D., Greisen, E. W., Yin, Q. F., Perley, R. A., Taylor, G. B., & Broderick, J. J. 1998, AJ, 115, 1693
- Dermer et al. (1992) Dermer, C. D., Schlickeiser, R., & Mastichiadis, A. 1992, A&A, 256, L27
- Gehrels & Michelson (1999) Gehrels, N. & Michelson, P. 1999, Astroparticle Physics, 11, 277
- (4) Gehrels, N. et al. 2001, in Astrophysics & Space Science Library, 267, 321
- Giroletti et al. (2004) Giroletti, M., et al. 2004, ApJ, 600, 127
- Giroletti et al. (2006) Giroletti, M., Giovannini, G., Taylor, G. B., & Falomo, R. 2006, ApJ, 646, 801
- Hartman et al. (1999) Hartman, R. C., et al. 1999, ApJS, 123, 79
- Healey et al. (2007a) Healey, S.E., et al. 2007, ApJ, in press
- Helmboldt et al. (2007a) Helmboldt, J.F., et al. 2007a, ApJ, 658, 203
- Helmboldt et al. (2007b) Helmboldt, J.F., Taylor, G.B., Blandford, R.D., & Walker, R.C. 2007b, ApJ, 658, 203
- Jorstad et al. (2001a) Jorstad, S. G., Marscher, A. P., Mattox, J. R., Wehrle, A. E., Bloom, S. D., & Yurchenko, A. V. 2001a, ApJS, 134, 181
- (12) Jorstad, S. G., et al. 2001b, ApJ, 556, 738
- Kellermann et al. (2004) Kellermann, K. I., et al. 2004, ApJ, 609, 539
- Kovalev et al. (2005) Kovalev, Y. Y., et al. 2005, AJ, 130, 2473
- Lähteenmäki & Valtaoja (2003) Lähteenmäki, A., & Valtaoja, E. 2003, ApJ, 590, 95
- Lister & Homan (2005) Lister, M. L. & Homan, D. C. 2005, AJ, 130, 1389
- Marscher (2006) Marscher, A. P. 2006, AIP Conf. Proc. 856: Relativistic Jets: The Common Physics of AGN, Microquasars, and Gamma-Ray Bursts, 856, 1
- Myers et al. (2003) Myers, S. T., et al. 2003, MNRAS, 341, 1
- Piner et al. (2007) Piner, B. G., Mahmud, M., Fey, A. L., & Gospodinova, K. 2007, ArXiv Astrophysics e-prints, arXiv:astro-ph/0702317
- Punch et al. (1992) Punch, M., et al. 1992, Nature, 358, 477
- (21) Reich, W., Steppe, H., Schlickeiser, R., Reich, P., Pohl, M., Reuter, H. P., Kanbach, G., & Schonfelder, V. 1993, A&A, 273, 65
- (22) Sikora, M., Blazejowski, M., Begelman, M. C., & Moderski, R. 2001, ApJ, 554, 1
- (23) Sikora, M., Blazejowski, M., Moderski, R., & Madejski, G. M. 2002, ApJ, 577, 78
- (24) Sowards-Emmerd, D., Romani, R. W., & Michelson, P. F. 2003, ApJ, 590, 109
- (25) Sowards-Emmerd, D., Romani, R. W., Michelson, P. F., & Ulvestad, J. S. 2004, ApJ, 609, 564
- (26) Sowards-Emmerd, D., et al. 2005, ApJ, 626, 95
- Taylor et al. (1994) Taylor, G. B., Vermeulen, R. C., Pearson, T. J., Readhead, A. C. S., Henstock, D. R., Browne, I. W. A., & Wilkinson, P. N. 1994, ApJS, 95, 345
- Taylor et al. (1996) Taylor, G. B., Vermeulen, R. C., Readhead, A. C. S., Pearson, T. J., Henstock, D. R., & Wilkinson, P. N. 1996, ApJS, 107, 37
- Taylor et al. (2005) Taylor, G. B., Fassnacht, C. D., Sjouwerman, L. O., Myers, S. T., Ulvestad, J. S., Walker, R. C., Fomalont, E. B., Pearson, T. J., Readhead, A. C. S., Gehrels, N., & Michelson, P. F. 2005, ApJS, 159, 27
- (30) Urry, C.M. & Padovani, P. 1995, PASP, 107, 803
- (31) Véron-Cetty, M.-P. & Véron, P. 2006, A&A, 455, 773
| 3EG name | VIPS name | S 8.4 | FoM | Code | Mag | z | Type | In CGRaBS? | ||
|---|---|---|---|---|---|---|---|---|---|---|
| (1) | (2) | (3) | (4) | (5) | (6) | (7) | (8) | (9) | (10) | (11) |
| J0743+5447 | J0742+5444 | 142.8 | -0.387 | 0.517 | 0.502 | ! | 17.3 | 0.723 | FSRQ | |
| J0808+5114 | J0807+5117 | 358.8 | 0.280 | 0.359 | 7.241 | !!! | 17.6 | 1.136 | FSRQ | CGRaBS |
| J0808+5114 | J0809+5218 | 154.2 | -0.103 | 2.398 | 1.186 | !!! | 14.5 | 0.138 | BLL | |
| J0829+2413 | J0830+2410 | 793.7 | 0.027 | 0.701 | 7.009 | !!! | 16.3 | 0.940 | FSRQ | CGRaBS |
| J0853+1941 | J0854+2006 | 3414.9 | 0.443 | 1.519 | 7.872 | !!! | 15.6 | 0.306 | BLL | CGRaBS |
| J0917+4427 | J0920+4441 | 1368.3 | 0.153 | 7.051 | 0.470 | ! | 16.5 | 2.190 | FSRQ | CGRaBS |
| J0952+5501 | J0957+5522 | 1498.9 | -0.410 | 3.839 | 0.427 | ! | 16.8 | 0.896 | FSRQ | |
| J1052+5718 | J1058+5628 | 189.8 | -0.115 | 5.490 | 0.387 | ! | 14.6 | 0.144 | BLL | CGRaBS |
| J1104+3809 | J1104+3812 | 631.6 | -0.109 | 1.126 | 6.582 | !!! | 13.0 | 0.031 | BLL | CGRaBS |
| J1200+2847 | J1159+2914 | 1233.3 | -0.286 | 4.034 | 0.829 | ! | 17.4 | 0.729 | FSRQ | CGRaBS |
| J1222+2841 | J1221+2813 | 1055.5 | 0.194 | 8.313 | 0.280 | ! | 14.2 | 0.102 | BLL | CGRaBS |
| J1224+2118 | J1224+2122 | 1073.9 | -0.383 | 1.445 | 1.522 | !!! | 16.0 | 0.435 | FSRQ | |
| J1227+4302 | J1221+4411 | 435.2 | -0.149 | 5.239 | 0.456 | ! | 17.8 | 1.344 | FSRQ | CGRaBS |
| J1227+4302 | J1224+4335 | 220.8 | -0.200 | 1.567 | 1.133 | !!! | 1.075 | FSRQ | ||
| J1227+4302 | J1226+4340 | 145.1 | -0.141 | 1.367 | 0.866 | ! | 18.5 | 1.999 | FSRQ | |
| J1323+2200 | J1321+2216 | 323.6 | 0.010 | 5.353 | 0.509 | ! | 19.4 | 0.943 | FSRQ | CGRaBS |
| J1323+2200 | J1322+2148 | 147.3 | -0.288 | 3.400 | 0.261 | ! | 19.1 | 1.680 | FSRQ | |
| J1323+2200 | J1327+2210 | 984.0 | 0.073 | 6.547 | 0.381 | ! | 18.8 | 1.400 | FSRQ | CGRaBS |
| J1329+1708 | J1331+1712 | 120.7 | -0.233 | 1.454 | 0.425 | ! | 17.2 | BLL | ||
| J1329+1708 | J1333+1649 | 483.8 | 0.106 | 3.072 | 1.982 | !!! | 16.4 | 2.097 | FSRQ | CGRaBS |
| J1347+2932 | J1343+2844 | 192.0 | -0.127 | 5.069 | 0.336 | ! | 16.5 | 0.908 | FSRQ | |
| J1424+3734 | J1419+3821 | 775.8 | 0.120 | 5.408 | 0.840 | ! | 19.2 | 1.831 | FSRQ | CGRaBS |
| J1424+3734 | J1421+3855 | 132.1 | 0.228 | 4.478 | 0.441 | ! | 17.4 | 0.489 | FSRQ | |
| J1424+3734 | J1426+3625 | 613.0 | 0.201 | 6.357 | 0.428 | ! | 20.3 | 1.091 | FSRQ | CGRaBS |
| J1605+1553 | J1603+1554 | 256.9 | 0.524 | 2.483 | 4.280 | !!! | 12.1 | 0.109 | FSRQ | CGRaBS |
| J1614+3424 | J1613+3412 | 3088.1 | -0.165 | 2.313 | 1.984 | !!! | 17.1 | 1.397 | FSRQ | CGRaBS |
| J1635+3813 | J1635+3808 | 2403.9 | -0.085 | 1.488 | 3.599 | !!! | 17.2 | 1.814 | FSRQ | CGRaBS |
| J1733+6017 | J1722+5856 | 328.0 | 0.189 | 6.953 | 0.264 | ! | 19.0 | 1.979 | FSRQ | CGRaBS |
| J1733+6017 | J1722+6105 | 203.2 | 0.141 | 3.932 | 0.911 | ! | 19.4 | 2.058 | FSRQ | CGRaBS |
| J1733+6017 | J1724+6055 | 166.0 | -0.042 | 2.340 | 0.827 | ! | ||||
| J1738+5203 | J1740+5211 | 1347.2 | 0.275 | 0.314 | 11.149 | !!! | 16.7 | 1.379 | FSRQ | CGRaBS |
Note. — Col. (1): 3EG name based on EGRET coordinates. Col. (2): VIPS source name based on CLASS coordinates. Col. (3): 8.4 GHz flux density from CLASS. Col. (4): is the spectral index () between NVSS (Condon et al. at 1.4 GHz and CLASS at 8.4 GHz, Col. (5): “TS” is a measure of the positional correspondence of the radio source to the peak of the gamma-ray flux. Lower values indicate a better positional correspondence (see Sowards-Emmerd et al. 2003). Col. (6): “FoM” is the figure of merit (Sowards-Emmerd et al. 2003). Col. (7): “Code” is a classification of the same type as in Sowards-Emmerd et al. 2003: sources with FoM 1.0 were deemed “likely” counterparts (denoted here by “!!!”) and sources with 0.25 FoM 1.0 were deemed plausible counterparts (denoted here by “!”). Col. (8): The optical magnitude of the host galaxy. Col. (9): The redshift from Véron-Cetty & Véron (2006). Col. (10): Source classification, where FSRQ = Flat Spectrum Radio Quasar, and BLL = BL Lac object. Col. (11): An indication if the source is included in the CBRaBS sample (Healey et al. 2007b, in prep).
| (J2000) | (J2000) | rms5 | ||||||||||||
|---|---|---|---|---|---|---|---|---|---|---|---|---|---|---|
| Name | () | () | UT Date | (mJy) | (mJy) | (mJy/beam) | (mJy/beam) | T | T | (mas) | (mas) | (∘) | ||
| (1) | (2) | (3) | (4) | (5) | (6) | (7) | (8) | (9) | (10) | (11) | (12) | (13) | (14) | (15) |
| 72 | J08070+5117 | 08:07:01.0133 | +51:17:38.670 | 2006-05-31 | 358.8 | 175.9 | 84.0 | 0.23 | 1 | PS | 1.3 | |||
| 78 | J08098+5218 | 08:09:49.1899 | +52:18:58.252 | 2006-05-31 | 154.2 | 125.6 | 56.1 | 0.25 | 2 | LJET | 3.4 | 6.7 | 20.2 | |
| 402 | J11044+3812 | 11:04:27.3145 | +38:12:31.794 | 1999-11-21 | 631.6 | 421.4 | 372.0 | 0.34 | 3 | LJET | 9.6 | 23.8 | 42.3 | |
| 554 | J12248+4335 | 12:24:51.5074 | +43:35:19.276 | 2006-05-27 | 220.8 | 173.5 | 98.2 | 0.21 | 2 | LJET | 4.0 | 8.0 | 13.0 | |
| 683 | J13335+1649 | 13:33:35.7819 | +16:49:04.027 | 2006-03-19 | 483.8 | 442.2 | 310.0 | 0.28 | 2 | LJET | 12.8 | 25.5 | 18.6 | |
| 937 | J16036+1554 | 16:03:38.0650 | +15:54:02.378 | 2006-04-03 | 256.9 | 348.3 | 347.5 | 0.20 | 1 | PS | 1.2 | |||
| 994 | J16352+3808 | 16:35:15.4931 | +38:08:04.497 | 1999-11-21 | 2423.3 | 2201.9 | 1240.0 | 0.46 | 2 | SJET | 2.4 | 4.8 | 86.2 | |
| 1102 | J17406+5211 | 17:40:36.9805 | +52:11:43.413 | 1999-11-21 | 1358.5 | 609.4 | 507.4 | 0.30 | 2 | LJET | 3.2 | 6.5 | 0.3 | |
| 27 | J07426+5444 | 07:42:39.7904 | +54:44:24.679 | 2006-05-31 | 142.8 | 207.0 | 163.4 | 0.23 | 1 | PS | 1.2 | |||
| 214 | J09209+4441 | 09:20:58.4599 | +44:41:53.988 | 1996-08-17 | 1368.3 | 1173.5 | 926.0 | 0.71 | 2 | LJET | 4.2 | 8.5 | 18.6 | |
| 282 | J09576+5522 | 09:57:38.1837 | +55:22:57.740 | 1999-11-21 | 1498.9 | 563.2 | 80.2 | 1.99 | 4 | LJET | 19.1 | 55.9 | 19.6 | |
| 387 | J10586+5628 | 10:58:37.7261 | +56:28:11.180 | 2006-06-19 | 189.8 | 149.4 | 86.1 | 0.22 | 2 | LJET | 3.5 | 7.0 | 86.6 | |
| 548 | J12214+4411 | 12:21:27.0450 | +44:11:29.667 | 1996-08-22 | 435.2 | 351.1 | 288.6 | 0.32 | 2 | LJET | 5.4 | 10.7 | 52.5 | |
| 550 | J12215+2813 | 12:21:31.6936 | +28:13:58.497 | 2006-02-25 | 893.1 | 401.2 | 149.4 | 0.24 | 6 | LJET | 9.5 | 25.5 | 44.3 | |
| 556 | J12269+4340 | 12:26:57.9051 | +43:40:58.438 | 2006-05-27 | 145.1 | 77.8 | 44.0 | 0.23 | 2 | LJET | 3.2 | 6.4 | 8.2 | |
| 655 | J13211+2216 | 13:21:11.2041 | +22:16:12.098 | 2006-02-25 | 323.6 | 253.1 | 160.9 | 0.19 | 2 | SJET | 2.3 | 4.7 | 58.2 | |
| 656 | J13221+2148 | 13:22:11.3989 | +21:48:12.268 | 2006-02-25 | 147.3 | 171.0 | 131.9 | 0.21 | 1 | PS | 1.2 | |||
| 679 | J13315+1712 | 13:31:33.4457 | +17:12:50.615 | 2006-02-25 | 120.7 | 66.3 | 41.6 | 0.21 | 2 | SJET | 2.5 | 5.0 | 113.4 | |
| 697 | J13430+2844 | 13:43:00.1805 | +28:44:07.492 | 2006-03-19 | 192.0 | 153.2 | 99.3 | 0.24 | 2 | LJET | 3.2 | 6.5 | 140.9 | |
| 754 | J14197+3821 | 14:19:46.6162 | +38:21:48.485 | 1998-02-08 | 775.8 | 1318.1 | 1282.0 | 0.23 | 1 | PS | 1.1 | |||
| 758 | J14211+3855 | 14:21:06.0337 | +38:55:22.829 | 2006-08-12 | 132.1 | 54.4 | 49.8 | 0.20 | 1 | PS | 1.1 | |||
| 769 | J14266+3625 | 14:26:37.0861 | +36:25:09.576 | 1998-02-08 | 613.0 | 432.9 | 397.0 | 0.22 | 1 | PS | 1.1 | |||
| 1073 | J17226+5856 | 17:22:36.7292 | +58:56:22.265 | 2006-08-07 | 328.0 | 111.9 | 66.3 | 0.27 | 2 | LJET | 3.5 | 6.9 | 60.8 | |
| 1074 | J17226+6105 | 17:22:40.0595 | +61:05:59.802 | 2006-08-07 | 203.2 | 105.8 | 96.6 | 0.19 | 1 | PS | 1.2 | |||
| 1082 | J17246+6055 | 17:24:41.4172 | +60:55:55.746 | 2006-08-07 | 166.0 | 157.4 | 91.7 | 0.28 | 3 | LJET | 5.8 | 12.7 | 131.2 | |
Note. — Col. (1): VIPS source number. Col. (2): VIPS source name. Col. (3): Right ascension (J2000). Col. (4): Declination (J2000). Col. (5): UT date of the observations. Col. (6): The flux density at 8.5 GHz from the CLASS survey. Col. (7): The total cleaned flux density from the 5 GHz VLBA map. Col. (8): The peak flux density from the 5 GHz VLBA map. Col. (9): The rms noise of the 5 GHz VLBA image. Col. (10): The number of dominant Gaussian components (i.e., that contain more than 95% of the total flux) fit to the 5 GHz VLBA map (see §2.3). Col. (11): The source type derived from the automated Gaussian component classification (see §2.3). Col. (12): The source type determined by visual inspection of the I image for sources where the “by-eye” and automatic classifications disagree. Col. (13): The mean radius (i.e., mean distances from the mean component position) for the ensemble of dominant Gaussian components. Col. (14): The maximum separation among the dominant Gaussian components. Col. (15): The jet position angle (measured from north through east).
| PA | |||||||
|---|---|---|---|---|---|---|---|
| Name | (mJy) | (mas) | (K) | (K) | |||
| (1) | (2) | (3) | (4) | (5) | (6) | (7) | (8) |
| 72 | J08070+5117 | 175.9 | 0.942 | 9.70 | |||
| 78 | J08098+5218 | 108.9 | 1.050 | 4.83 | 1.56 | ||
| 402 | J11044+3812 | 370.2 | 0.291 | 2.13 | 3.59 | -0.62 | 15.07 |
| 554 | J12248+4335 | 156.9 | 0.653 | 1.80 | 3.37 | ||
| 683 | J13335+1649 | 417.9 | 0.538 | 7.05 | 9.97 | ||
| 937 | J16036+1554 | 348.3 | 0.121 | 1.16 | |||
| 994 | J16352+3808 | 2013.7 | 1.999 | 2.47 | 2.74 | ||
| 1102 | J17406+5211 | 574.7 | 0.700 | 5.75 | 4.09 | ||
| 27 | J07426+5444 | 207.0 | 0.439 | 5.26 | |||
| 214 | J09209+4441 | 1080.4 | 0.785 | 8.58 | 5.19 | ||
| 282 | J09576+5522 | 127.3 | 7.206 | 1.20 | 7.96 | -32.94 | 60.29 |
| 387 | J10586+5628 | 129.6 | 0.817 | 9.49 | 2.10 | ||
| 548 | J12214+4411 | 303.6 | 0.528 | 5.33 | 2.63 | ||
| 550 | J12215+2813 | 177.5 | 0.614 | 2.30 | 1.62 | -11.50 | 27.45 |
| 556 | J12269+4340 | 72.9 | 0.578 | 1.07 | 1.54 | ||
| 655 | J13211+2216 | 227.7 | 0.780 | 1.83 | 6.51 | ||
| 656 | J13221+2148 | 171.0 | 0.465 | 3.87 | |||
| 679 | J13315+1712 | 61.0 | 0.788 | 4.80 | 1.86 | ||
| 697 | J13430+2844 | 137.3 | 0.602 | 1.85 | 3.20 | ||
| 754 | J14197+3821 | 1318.1 | 0.242 | 1.10 | |||
| 758 | J14211+3855 | 54.4 | 0.304 | 2.88 | |||
| 769 | J14266+3625 | 432.9 | 0.503 | 8.36 | |||
| 1073 | J17226+5856 | 97.2 | 0.574 | 1.44 | 2.26 | ||
| 1074 | J17226+6105 | 105.8 | 0.224 | 1.03 | |||
| 1082 | J17246+6055 | 121.5 | 0.604 | 1.63 | 6.71 | -89.59 | 30.91 |
Note. — Col. (1): VIPS source number. Col. (2): VIPS source name. Col. (3): The 5 GHz flux density of the core. Col. (4): The FWHM of the core component estimated using a circular Gaussian fit to the visibility data. Col. (5): The mean brightness temperature of the core. Col. (6): The mean brightness temperature of the brightest component outside the core. Col. (7): The difference between the outer and inner position angles of the jet for sources with more than 2 jet components. Col. (8): The jet opening half-angle for sources with more than 2 jet components.