Unification of the phonon mode behavior in semiconductor alloys:
Theory and ab initio calculations
Abstract
We demonstrate how to overcome serious problems in understanding and classification of vibration spectra in semiconductor alloys, following from traditional use of the virtual crystal approximation (VCA). We show that such different systems as InGaAs (1-bond1-mode behavior), InGaP (modified 2-mode) and ZnTeSe (2-bond1-mode) obey in fact the same phonon mode behavior – hence probably a universal one – of a percolation-type (1-bond2-mode). The change of paradigm from the ‘VCA insight’ (an averaged microscopic one) to the ‘percolation insight’ (a mesoscopic one) offers a promising link towards the understanding of alloy disorder. The discussion is supported by ab initio simulation of the phonon density of states at the zone-center of representative supercells at intermediary composition (ZnTeSe) and at the impurity-dilute limits (all systems). In particular, we propose a simple ab initio ‘protocol’ to estimate the basic input parameters of our semi-empirical ‘percolation’ model for the calculation of the 1-bond2-mode vibration spectra of zincblende alloys. With this, the model turns self-sufficient.
pacs:
63.10.+a, 78.30.FsI Introduction
When dealing with any kind of mixture the key issue is how to handle the substitutional disorder. This generic term covers topological disorder, mass disorder, disorder in the bond length, disorder in the bond force constant, etc. One can choose either a percolation-based approach, which is essentially a mesoscopic one, or a microscopically-averaged description. In the first case the central notion is the volume fraction of each constituent. Some criticality in the dependence of the physical properties on the composition of the mixture is then expected at the percolation thresholds, where the minor constituent coalesces into a continuum. Percolation approaches are typically used for molecular/natural mixtures, which are of a forbidding complexity at the microscopic scale (statistical arrangement of molecules or grains with a distribution of sizes and shapes), and follow thereby the impetus given in particular by De Gennes.01 This approach might seem sometimes over-complicated. When facing such kind of ‘ideally disordered’ mixtures as conventional semiconductor (SC) alloys AB1-xCx [simple atoms distributed at random on a quasi-regular lattice, that makes two interpenetrating A and (B,C) fcc sublattices], one is tempted to proceed as possibly far with microscopic averaging, corresponding then to the virtual crystal approximation (VCA). With this, each atom A is surrounded by four virtual B1-xCx atoms, i.e. the crystal is viewed at the macroscopic scale as a continuum. The physical properties are accordingly averaged. No singularity is expected in their dependence on . Actually the VCA provides, at first sight, a fairly good description of many properties in SC alloys.
In this work we focus on the bond force constant () in SC alloys. is sensitive to the overall bond distortion (bond length plus bond angles) required to accommodate the mismatch in the A–B and A–C bond lengths – a simple rule states ‘the closer the atoms, the larger ’, and as such provides a sort of integrated insight into the substitutional disorder. is routinely probed by Raman and Infrared (IR) spectroscopies via the frequency of the transverse optical (TO) phonon. We recall that a transverse (longitudinal) optical TO (LO) mode in the Raman/IR spectra corresponds to vibration of the rigid A sublattice against the rigid (B,C) sublattice perpendicular to (along) the direction of propagation. In a polar crystal a LO mode differs from a TO mode in that it carries a coulombian field due to the ionicity of the bond. In a pure crystal this is just responsible for an additional restoring force, with the result that a LO mode occurs at a higher frequency than a TO mode. In a multi-wave system, such as an alloy, the coulombian field is well-known to act as a carrier of coherence,02 that makes LO modes a much complicated issue. In fact, the individual LO modes with close frequencies do -couple, which results in a dramatic distortion of the original LO lineshapes.03 In contrast, the individual TO modes do remain unaltered,03 and thereby provide reliable insight into the nature (via the TO-frequency) and the population (via the TO-intensity) of the individual oscillators present in the crystal. So, in the present work we depart from a confusing habit to treat the TO and LO modes on an equal footing, and focus most of our attention on TO modes. Below, we emphasize accordingly the TO aspect in the different models and approaches used throughout the manuscript, to set up a consistent basis for the discussion.
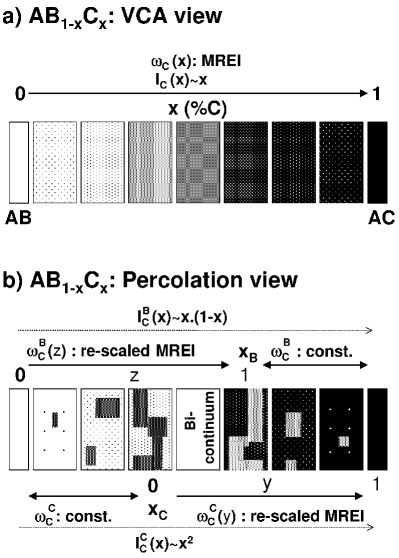
The VCA for a bond-related property in a AB1-xCx alloy, such as the bond force constant , comes to a picture where the bond is immersed into a continuum whose physical properties are smoothly dependent on the alloy composition , as schematically represented in Fig. 1a. With this, the bonds of like species are all equivalent in the alloy, thereby contributing to a unique TO mode in the Raman/IR spectra. The intensity scales as the corresponding fraction of bonds, and when x changes the mode shifts regularly between the natural frequency in the pure crystal and the impurity frequency. No singularity is expected. Such 1-bond1-mode TO behavior is well-accounted for by the modified-random-element-isodisplacement (MREI) model as worked out by Chang and Mitra in the sixties, based on the VCA.04 In order to grasp the whole behavior, one needs only the frequency of the impurity mode, referred to as below, the TO frequency in the pure crystal being normally well-known. Now, a short (long) impurity bond is tensed (compressed) in a matrix with a large (small) lattice constant, which reduces (enlarges) , with concomitant impact on (see the ‘rule’ in italics above). Still, generally remains close to the parent TO frequency, because each bond tends to retain its natural bond length in an alloy, as is well-known.05 So, the trend in a ‘TO-frequency vs. ’ plot should be that the A-B and A-C TO branches do remain quasi-parallel, with slight but finite slopes.
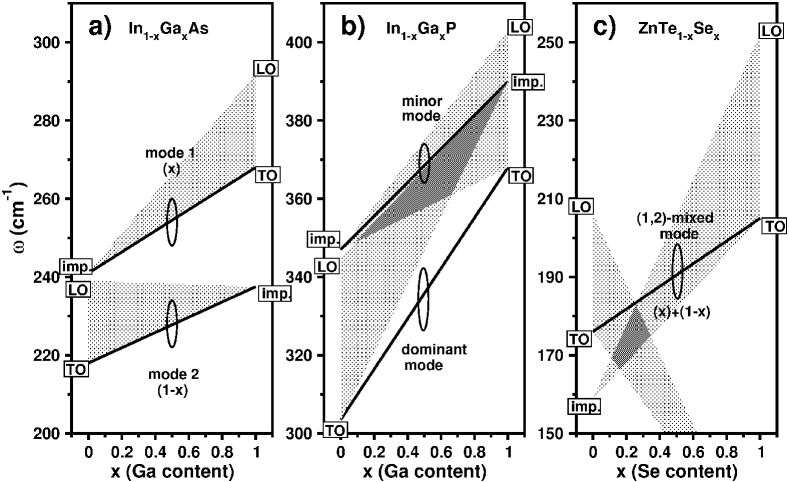
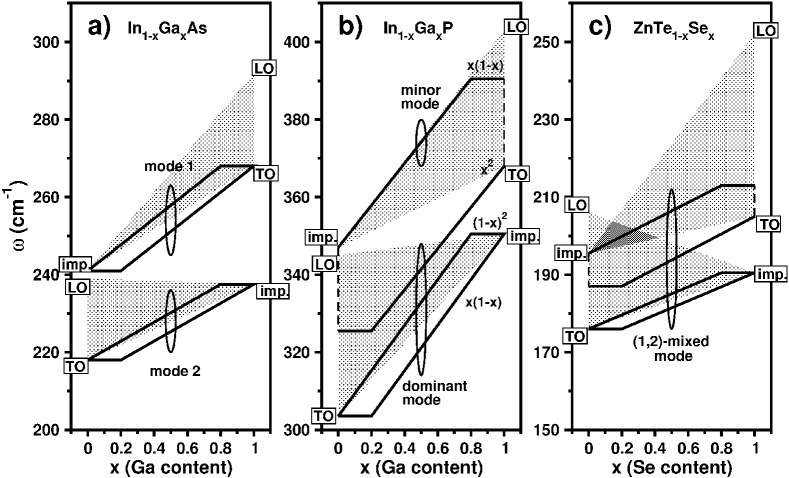
Two main types of TO mode behavior proceed from the MREI-VCA, supporting a corresponding classification of the Raman/IR TO data: () If the parent TO frequencies are much distinct, then the alloy exhibits two well-separated A–B and A–C TO branches, corresponding to a pure 1-bond1-mode (2-mode) behavior. () If the parent TO frequencies are close enough, the A–B and A–C TO branches merge into an apparent 2-bond1-mode (mixed-mode) behavior with a unique (A–B, A–C)-mixed TO mode that has quasi-stable intensity, and shifts regularly between the parent TO modes. There seems to exist a sort of intermediate-type behavior, the so-called () modified-two-mode behavior,06 with two (A–B, A–C)-mixed TO modes, i.e. a dominant one of type (), plus a minor one joining the impurity modes that does not allow to fully discard the type (). Note that while the MREI-VCA model fully accounts for types () and (), it fails to account for the type (), even qualitatively. Representative systems are In1-xGaxAs, ZnTe1-xSex and In1-xGaxP, respectively.07 The related MREI-VCA TO schemes are schematically represented in Fig. 2, while approximating the MREI branches to straight lines, for simplicity. The schemes were built up by using the traditional sets of impurity frequencies: InAs:Ga241 cm-1 and GaAs:In237 cm-1 (Ref.08, ), InP:Ga347 cm-1 and GaP:In390 cm-1 (Ref.09, ), and ZnTe:Se159 cm-1 and ZnSe:Te116 cm-1 (Ref.10, ), with the usual notation. In ZnTeSe it is commonly admitted that the impurity modes are screened by the disorder-induced phonon density of states, and thereby do not give rise to any observable feature in the Raman/IR spectra.10 Note that in the MREI–VCA schemes related to InGaP and ZnTeSe, the basic TO branches, as obtained simply by joining the corresponding parent and impurity modes, cross each other (not shown), which contradicts the expected trend of quasi-parallel TO branches.
Elliott et al.11 worked out a theoretical criterion within the coherent potential approximation (CPA) to distinguish between type () and type (). As the CPA is well-suited mainly for the treatment of low concentration of simple defects in otherwise perfect media, the Elliott-CPA criterion aims at deriving the whole phonon mode behavior of an alloy from its behavior at the dilute limits. The criterion predicts type () when the A–B and A–C TO–LO bands do overlap in the alloy, type () otherwise. Here the optical bands are simply built up by linear convergence of the parent TO and LO frequencies in the pure crystal onto the related impurity frequency.
Generally the MREI-VCA (experimental) and Elliott-CPA (theoretical) classifications were found to be remarkably consistent, and an exhaustive review of the phonon mode behavior of many ternary alloys in terms of types () and () was proposed by Taylor.12 A remarkable exception is InGaP, whose special Raman/IR behavior is not covered by the Elliott-CPA criterion. In fact, the Elliott-CPA criterion predicts a type () behavior for InGaP, in apparent contradiction with the experimental findings that seem to indicate a strong overlapping of the optical bands in GaInP (see the over-shaded area in Fig. 2b). However, careful analysis of the Raman/IR data reveals that even the representative alloys we discuss do not fit into the MREI-VCA/Elliott-CPA classification. Indeed, there are three features in the TO Raman spectra of InGaAs, rather than two (refer to Fig. 3 in Ref. 08, ). Also, the IR spectra of ZnTeSe exhibit two clear resonances, not only one (refer to Fig. 1 in Ref. 13, ). At last, the minor TO mode of InGaP was identified by ab initio calculations as a pure Ga–P mode, not as a (In–P, Ga–P)-mixed mode (refer to Fig. 3a in Ref. 14, ).
Our view is that the VCA misses the essence of the phonon behavior in alloys. Recognizing the local character of we conclude that the proper understanding of TO phonons requires detailed insight into the topologies of the (B,C)-substituting species, which falls into the scope of the percolation site theory.15 Precisely, the apparent anomalies in InGa(As,P) could be explained within a 1-bond2-mode percolation model,03 introducing a description of a random alloy at the mesoscopic scale, in terms of a composite made of the B-rich and C-rich regions, both resulting from natural fluctuations in the alloy composition at the local scale. The whole picture is summarized in Fig. 1b. For a given bond, each region brings a specific TO mode, the result of different local bond distortions. In a ‘TO-frequency vs. ’ plot, this leads to a splitting of each original MREI-like TO branch into a symmetrical double-branch attached at its two ends to the parent and impurity modes. The intensity of each ‘sub-mode’ scales as the total fractions of like bonds in the alloy, i.e. as for A–B and for A–C, weighted by the scattering volume of the corresponding B-rich () or C-rich () host region. In particular, singularities in the TO -frequency occur at the bond percolation thresholds, where the minor A–B (=0.19) and A–C (=0.81) bonds become connected throughout the crystal. This is absent with the MREI-VCA. Below the percolation threshold, the minor region consists of a dispersion of finite clusters with similar internal structures, which generates quasi-invariance in the TO -frequency (fractal-like regime). Above the percolation threshold, the finite clusters coalesce into a continuum whose local composition turns smoothly -dependent, as does the TO frequency (normal regime). There, a re-scaled MREI approach applies where the continuum is viewed as a pseudo-ternary alloy, and takes an apparent composition that varies from 0 to 1 over its domain of existence (refer to “y” and “z” in Fig. 1b). Basically, two adjustable parameters are required per bond to figure out the whole behavior, i.e. – as for the MREI model, plus the splitting between like TO modes on the onset of the 2-mode behavior just departing from the impurity limit.
In this work we investigate whether, among the usual SC alloys, the percolation scheme for InGa(As,P) is fortuitous, i.e. contingent upon the (Ga,In)-substituting species for some reason, or reflects a deeper – universal – reality by extending further to the representative system of the remaining class (), i.e. ZnTeSe. The perspective is a change of paradigm regarding the way to describe phonons in alloys in general.
The manuscript is organized as follows. In Sec. II we re-examine representative sets of optical phonon frequencies related to ZnTe1-xSex taken in the literature. We conclude to a three-oscillator type behavior in the Raman/IR spectra, that fits into the 1-bond2-mode percolation scheme. A suitable version of the percolation model is derived, supported by independent insight into the impurity modes via existing extended X-ray Absorption Fine Structure (EXAFS) measurements of the impurity bond lengths. The (TO, LO) Raman lineshapes are derived in Sec. III for a clear overview of the phonon mode behavior of ZnTeSe. Ab initio insight into the zone-center TO phonon density of states (ZC TO-DOS), that mimics the Raman signal, is produced at the stoichiometry (=0.5) for comparison. In Sec. IV, we present a unified description of the phonon mode behavior in SC alloys within the percolation scheme, and confront it with the previous MREI-VCA/Elliott-CPA classification. At last, in Sec. V, we propose a simple ab initio ‘protocol’ to estimate the input parameters (, ) of the semi-empirical percolation model.
II PERCOLATION PICTURE FOR ZnTe1-xSex
A priori the prerequisites for the detection of a possible 1-bond2-phonon behavior seem favorable in ZnTe1-xSex. Indeed the lattice mismatch in ZnTeSe is similar to that of InGa(As,P), i.e. 7%, so that similar lattice distortions can be expected, and thereby also similar phonon properties. Further, the dispersion of the TO mode is small both in ZnSe (6 cm-1) and ZnTe (8 cm-1),16 so that even small differences in the local bond distortions may generate fluctuations in the TO frequency greater than the dispersion, thereby giving rise to phonon localization, i.e. to well-separated TO modes in the Raman/IR spectra.17 In fact, already three decades ago Artamonov et al.18 mentioned an ‘evident analogy’ between the phonon behaviors of InGaP and ZnTeSe. Later on, Yang et al.19 proposed to reclassify ZnTeSe as a type () system, not as a type (). Altogether this suggests that a InGaP-like version of the percolation model should apply to ZnTeSe.
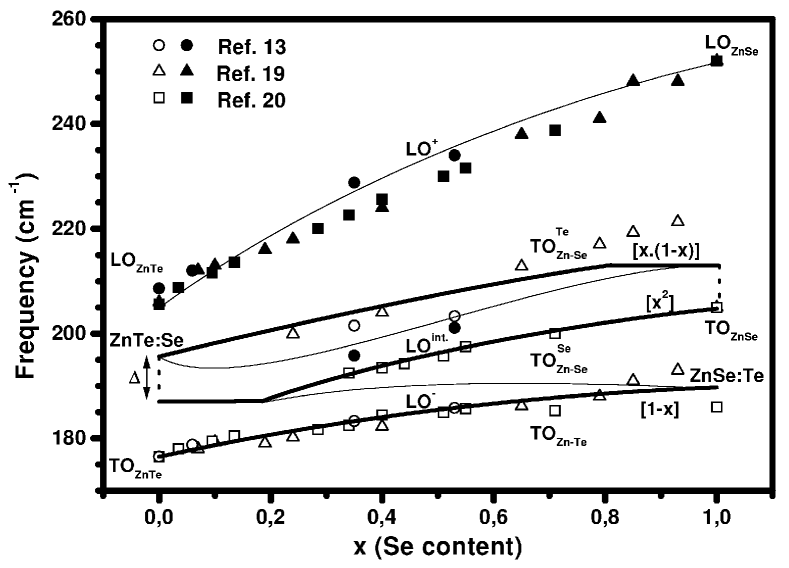
Representative sets of (TO, LO) frequencies in ZnTeSe obtained from Raman/IR analysis, as taken in the literature,13 ; 19 ; 20 are displayed in Fig. 3. As usual03 in the discussion of the phonon mode behavior, we focus on the TO modes, whereas the discussion on LO modes follows, among some additional details, in Sec. III. The data indicate three equally spaced TO modes in the range 175–215 cm-1. We propose a three-oscillator [1(Zn–Te), 2(Zn–Se)] version of the percolation model, with a unique TOZn-Te branch below a well-resolved Zn-Se TO double-branch. Detail is given further on. In particular the percolation scheme incorporates a general trend that bonds are longer (shorter) in environments rich of the shorter (longer) bond04 – as also evidenced by Silverman et al.21 in InGaP by using first-principles calculations – which reduces (enlarges) the TO frequency. So, the middle and upper TO branches in Fig. 3 are attributed to Zn–Se vibrations in the Se- and Te-rich regions, and are accordingly labeled as TO and TO. The (, ) values for the Zn–Te and Zn–Se bonds are estimated as (189 cm-1, 0 cm-1) and (195 cm-1, 8 cm-1), respectively, as explained hereafter.
The values were derived by relying on thorough EXAFS measurements of bond length in ZnTeSe.22 The shift in the square TO frequency of an impurity mode with respect to the corresponding TO mode in the pure crystal was inferred from the related difference in bond length via the TO mode Grüneisen parameter of the pure crystal, by using the simple relation08
| (1) |
Denominators refer to the pure crystal. For the and values related to the Zn–Se (Zn–Te) bond, we have taken 2.600–2.643 Å (2.480–2.452 Å) and 1.7 (1.4) according to Refs. 22, and 23, , respectively. For each bond species, the impurity bond length was determined by linear adjustment of the whole ‘bond length vs. ’ EXAFS dependence, and extrapolation to the dilute limit. The whole procedure was earlier tested with InGaP, with much success.03
Now we turn to . The lower TO-data set is attached to the limit (0,1) Zn–Te frequencies at its two ends, indicating an apparent 1-bond1-mode MREI behavior for the Zn–Te bond, which comes to 0 cm-1. The two remaining TO-data sets share quasi-symmetrically on each side of the limit Zn–Se frequencies, indicating a well-resolved 1-bond2-mode type behavior for the Zn-Se bond, i.e. a finite value. This was adjusted to 8 cm-1 by fitting a rescaled-MREI curve to the data in the continuum regime of the dominant TO branch at large Se content. In this composition range the TO mode shows up strongly in the Raman/IR spectra (see next Sec.), so that its frequency could be determined with high accuracy. The remaining pieces of the Zn–Se double-branch, i.e. the two dispersion regimes (fractal-like) plus the rescaled-MREI curve in the continuum regime (normal) of the TO branch, were directly inferred by symmetry.
In Fig. 3 both the TO (thick lines) and LO (thin lines) theoretical curves are in good agreement with the data, in spite of the simplicity of our model. Slight discrepancy exists with respect to the TO branch in the Te-dilute limit (less than 8 cm-1), where the mode becomes weak and hard to detect (see next Sec.).
III (TO, LO) Raman lineshapes
In Fig. 3 all the ingredients are there to calculate the TO and LO Raman lineshapes of random ZnTe1-xSex. We use the generic equation,03
| (2) |
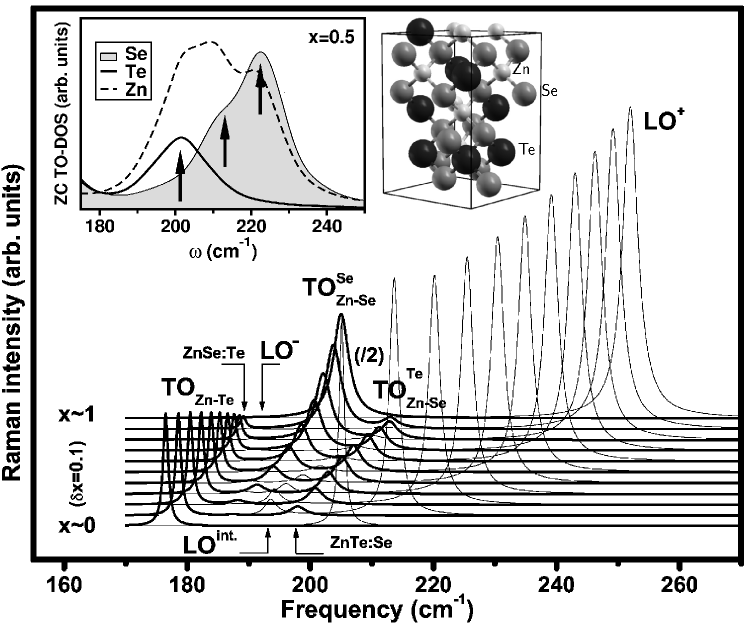
In a form restricted to the second member, Eq. (2) gives access to the TO modes, while in full it provides the LO modes. The summation runs over the complete collection of oscillators present in the crystal; is the relative dielectric function of the whole crystal. We use a classical form generalized to a discrete series of harmonic oscillators, i.e. three in the present case. , and are: the Faust–Henry coefficient (which measures the relative Raman efficiencies of the TO and LO modes), the TO-frequency squared, and the classical Lorentzian response of oscillator , respectively. is expressed according to the standard MREI terminology,04 and relates to the oscillator strength . Both and scale as the fraction of oscillator in the crystal. They are accordingly derived from the (, , TO–LO) values in the pure ZnSe and ZnTe crystals, taken as (0.56, 5.75, 206–252 cm-1) and (0.32, 7.20, 176–206 cm-1), respectively. For sake of consistency in the calculations, the Faust–Henry coefficients of pure ZnSe and ZnTe were taken from the same source, i.e. corresponding to the ratio of the ionic to electronic parts of the static electro-optic effect,24 as calculated by Shih et al.25 A damping term was introduced in so as to reproduce the finite linewidths of the experimental Raman/IR lines. Small dampings were used for the Zn–Se (3 cm-1) and Zn–Te (1 cm-1) modes – for a clear overview of the whole collection of individual oscillators. Care was taken that the latter dampings scale like in the pure crystals, i.e. in the ratio 3:1, as inferred from the full widths at half maximum of the Raman lines obtained in similar conditions with pure ZnSe and ZnTe crystals of the same generation (see Figs 1 in Refs 26, and 27, ). The resulting three-mode (TO, LO) Raman lineshapes of ZnTe1-xSex depending on the alloy composition are displayed in Fig. 4.
First we discuss the LO modes (thin lines in Figs 3 and 4). In ZnTeSe the individual LOZn-Te, LO and LO modes (not shown) do -couple strongly because the Zn–Se and Zn–Te oscillators are so close, which renders the LO situation especially complicated. Basically the available oscillator strength, independently of its origin, i.e. ZnSe- or ZnTe-like, is almost fully channeled into a ‘giant’ LO+ mode at high frequency that has quasi-stable intensity and shifts regularly between the LO modes of the pure ZnSe and ZnTe crystals when the alloy composition changes. If we abusively apply to LO modes the classification of TO -mode behavior outlined in Sec. I, we would say that the LO+ mode exhibits a model type () behavior. Certainly this is the origin of the MREI-VCA attribution of ZnTeSe to the type (). Residual LOint. and LO- modes, in the sense of decreasing frequencies, are driven back towards the TO modes.
Now we turn to the TO modes (thick lines in Figs 3 and 4). We re-assign the presumed unique TO mode in the Raman/IR spectra of ZnTeSe as the sum of close and TO modes. In fact the bi-modal character was already obvious in the Raman spectra recorded by Artamonov et al.20 The intensities of the two modes in Fig. 4 exhibit antagonist variations versus , and become equal at 0.7, consistently with experimental observations.20 An additional minor LO–TO inverted oscillator within the main TO–LO band, evidenced by IR reflectivity,13 is assigned as the LOint.–TO band. The LO–TO inverted splitting is large at intermediate values, and further increases with (1), as evidenced by Burlakov et al.13 Then it vanishes in the Te- and Se-dilute limits, as observed by Yang et al.19 In brief, all the ‘anomalous’ features in the Raman/IR spectra of ZnTeSe find a natural assignment within the percolation model, on a quantitative basis. Actually, in retrospect there is a quasi-perfect analogy between the phonon mode behaviors of ZnTeSe (this work) and InGaP (Ref. 03, ).
To secure a basis of our discussion on TO modes we provide independent ab initio insight into the TO density of states (TO-DOS) at the zone-center (ZC, =0). In principle this compares directly to the Raman signal, neglecting however polarisability-related variations of intensity of different modes. We used the following expression for the -projected TO-DOS,
| (3) |
where refers to the wavevector, stands for the cartesian coordinates, is the -component of the phonon eigenvector for atom at frequency , is the positional vector, and represents an arbitrarily chosen group of atoms (say, those of a given chemical species). We applied Eq. (3) to a fully-relaxed (lattice parameter and internal coordinates) 32-atom supercell at the representative alloy composition 0.5 (see a drawing in the inset of Fig. 4). Care was taken that the Se and Te atoms distribute in equal proportion over all substituting planes, as is expected in a random alloy. We apply the plane-wave pseudopotential method within the density functional theory and a linear response technique, using specifically the PWSCF method.28 The pseudopotentials included Zn, Se, Te as the deepest valence states; plane wave cutoff of 25 Ry, Brillouin zone summation done over 222 -points mesh of Monkhorst and Pack,29 and local density approximation (LDA) used for the exchange-correlation.
The ZC TO-DOS obtained per atom for uniformly-damped Zn, Se and Te oscillators (10 cm-1) are displayed in the inset of Fig. 4. As expected, three equidistant oscillators spaced by 10 cm-1, with similar intensities, show up, i.e. a ZnTe-like below two ZnSe-like ones (refer to the arrows). An overall blue-shift of the ZC TO-DOS with respect to the Raman signal (20 cm-1) is due to a well-known overbinding in LDA. We have checked that the interplay between the frequencies and intensities of the three oscillators in the ZC TO-DOS are consistent with the general trend in the TO symmetry as displayed in the body of Fig. 4, over the entire composition domain.
IV ‘PERCOLATION’ vs. ‘ELLIOTT-CPA’ and ‘MREI-VCA’
The percolation schemes for InGaAs, InGaP (see Ref. 03, ) and ZnTeSe are schematically reproduced in Fig. 5. These were built up from the experimental (, ) values reported in table 1. Only the TO branches are shown, for clarity, while simplifying the rescaled-MREI oblique segments to straight lines. There is an obvious analogy between the three schemes, indicating that the traditional MREI-VCA/Elliott-CPA classification has, in fact, no raison d’être.
| AB1-xCx: | In1-xGaxAs | In1-xGaxP | ZnTe1-xSex | |||||||
|---|---|---|---|---|---|---|---|---|---|---|
| Raman/IR | EXAFS | Ab initio | Raman/IR | Ab initio | Raman/IR | EXAFS | Ab initio | |||
| (Å) | 2.672–2.588111Ref. 03, , and Refs therein; | 2.637–2.584 | 2.540–2.485 | 2.643–2.600333Ref. 22, . | 2.630–2.545 | |||||
| (Å) | 2.450–2.488222Ref. 05, ; | 2.460–2.495 | 2.360–2.393 | 2.452–2.480333Ref. 22, . | 2.450–2.467 | |||||
| AC:B (cm-1) | 237111Ref. 03, , and Refs therein; | 241 | 234 | 350111Ref. 03, , and Refs therein; | 330 | 189 | 191 | 203 | ||
| AB:C (cm-1) | 241111Ref. 03, , and Refs therein; | 250 | 251 | 347111Ref. 03, , and Refs therein; | 350 | 195 | 196 | 200 | ||
| (cm-1) | 0111Ref. 03, , and Refs therein; | 3 | 22111Ref. 03, , and Refs therein; | 28 | 8 | 6 | ||||
| (cm-1) | 0111Ref. 03, , and Refs therein; | 0 | 0111Ref. 03, , and Refs therein; | 0 | 0 | 0 | ||||
Still, the percolation schemes must be consistent with the latter classification, which we discuss now. The Ga- and In-related TO–LO bands as derived according to the Elliott’s procedure (see Sec. I), do not overlap in InGa(As,P) (see the shaded areas in Figs 5a and 5b), while the Zn–Se and Zn–Te ones do overlap in ZnTeSe (see the over-shaded area in Fig. 5c). This is consistent with the Elliott-CPA classification of InGa(As,P) and ZnTeSe as types () and (), respectively. The percolation schemes are also consistent with the MREI-VCA classification. It is just a matter of regrouping close individual/double TO branches as shown by ovals in Fig. 5. The usual terminology of separate modes [type (), Fig. 5a], dominant-plus-minor modes [type (), Fig. 5b] and mixed-mode [type (), Fig. 5c] comes out naturally. Note that in the percolation schemes the individual TO branches all remain quasi-parallel, as ideally expected.
A probable reason why differences in the detail of the phonon behaviors of InGaAs, InGaP and ZnTeSe were previously mistaken for differences in the principles of the phonon mode behaviors lies in an implicit, but wrong, assumption that the TO and LO modes behave similarly in an alloy. In the LO symmetry a strong -coupling occurs in particular between the like LO modes that come from the same double-branch, because these refer to the same bond species and as such have close frequencies in general. The result is that the actual 1-bond2-mode behavior visible in the TO symmetry, supporting a description of the phonon mode behavior at the mesoscopic scale on a percolation basis, is literally rubbed out in the LO symmetry. What is left is an apparent 1-bond1-mode LO behavior, encouraging a more crude description at the macroscopic scale according to the MREI-VCA. Due to this TO vs. LO difference in nature, any attempt to explain the TO and LO modes in an alloy on the same intuitive basis is damned to fail. Simplicity arises by focusing on TO modes; LO modes follow.
V AB INITIO ‘PROTOCOL’ FOR A SELF-SUFFICIENT PERCOLATION MODEL
To complete the picture, we give in this section a simple ab initio ‘protocol’ to estimate the basic input parameters of our semi-empirical percolation model, i.e. (, ) per bond. The ‘protocol’ operates at the impurity-dilute limits, for two reasons. First, it is attractive conceptually to be in a position to derive the whole Raman/IR behavior of an alloy from its behavior in the dilute limits. Incidentally, the Elliott’s criterion proceeds from a similar ambition. Second, placing the analysis at the dilute limits brings in a decisive advantage that the number of motifs is much restricted for the impurity atoms. Then, it is just a matter to identify those motifs that are suitable for our purpose. Further, at the impurity limit a rather small-size supercell will do, in which case a full ab initio approach can be pursued. Beyond the impurity limit, we would face a necessity to incorporate the whole statistics of the alloy disorder, averaging over a big number of large-size supercells. Almost invariably that would mean employing a simplified (e.g. an empirical valence force field) method to perform structure relaxations. Such calculations have been done, e.g. in Refs 21, and 31, .
Our ‘protocol’ is based on ab initio bond length/phonon calculations in prototype 64-atom (222-replicated simple cubic) supercells of zincblende structure, with either one or two nearest cation (or anion) sites substituted by a different species. Calculation of zone-center phonons was preceded by unconstrained (lattice parameter and atom positions) relaxation for each supercell. In particular the sufficiency of the supercell size for our purpose of treating impurity pairs can be supported by the following arguments. First, some of us checked the falling down of interatomic force constants in semiconductor alloys with distance, and found that the interactions beyond the second neighbors can be safely discarded, without noticeable differences in the phonon spectra.32 In our supercell with an impurity pair, none of the second neighbors of an impurity is simultaneously a second neighbor to a spurious (translated) impurity. Second, even with the break of symmetry introduced by an impurity pair, the relaxed shape of the supercell remains remarkably cubic. Finally Teweldeberhan et al.33 who were confronted with a similar problem of ab initio (bond length) calculations related to chosen (In,N) motifs in the highly-dilute (In,N)-impurity limit of InyGa1-yAs1-xNx have observed that the 64-atom supercell calculation is well-converged in size for such purpose, i.e. the 64-atom supercell seems sufficient to reproduce the behavior of the considered motif as immersed in the infinite solid. The LDA calculations have been done in part (ZnTeSe) with the PWSCF method,28 as stated above, and in part (InGaAs, InGaP) with Siesta,34 which relies on norm-conserving pseudopotentials and strictly confined atom-centered numerical basis functions. The basis sets (from As, Ga upwards) were of ‘double-zeta with polarization orbitals’ quality. Brillouin zone integration demanded at least 222-mesh in the -space, in order to get convergence of phonon frequencies with respect to this parameter.
To access we use a supercell containing a single impurity (3% Imp.). This is the ultimate configuration that refers to an impurity in the region rich of the other substituting species, i.e. the dominant one. We search for the impurity bond length and estimate the difference with respect to the bond length in the pure crystal. Eventually is derived via by using Eq. (1). The directly calculated impurity frequency is not necessary at this stage as it might be subject to systematic shift, due to the effective overbinding caused by the LDA. The as-obtained values for InGaAs, InGaP and ZnTeSe fairly agree with the experimental ones, as shown in table 1, which validates this part of the ‘protocol’.
To access , we use a supercell containing two neighboring substitutional impurities. This pair forms the germ of the impurity-rich region, i.e. the ultimate configuration that refers to an impurity staying in its own environment. We search for the frequency of the softer impurity-related phonon mode (see detail further on), referred to as , and is estimated as . The systematic error due to LDA is thus eliminated.
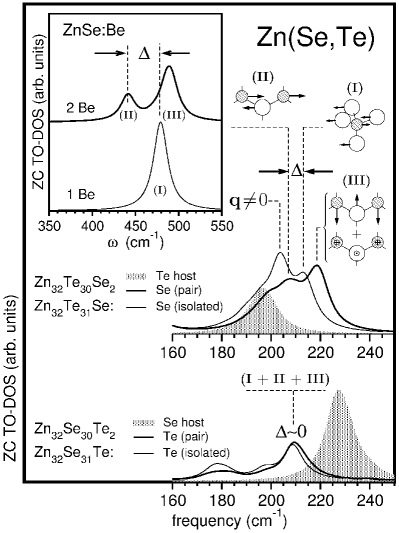
A choice system to test the ‘protocol’ with respect to is the random Zn1-xBexSe alloy, that exhibits an unequally well-resolved 1-bond2-mode Raman behavior in the Be–Se spectral range.03 We report in the inset of Fig. 6 the ZC TO-DOS curves per-atom related to the single Be impurity (lower curve) and to the Be impurity pair (upper curve). By forming the pair, the original triply degenerate impurity mode splits into two, a doubly-degenerate mode at a slightly higher frequency corresponding to anti-phase Be and Se vibrations transverse to the Be-Se chain (in-plane and out-of-plane ones), and a minor one, red-shifted by 40 cm-1 (the softer pair-related phonon mode mentioned above), due to similar vibrations but along the chain, i.e. longitudinal ones then. Somewhat ideally, a similar shift of 40 cm-1 is observed between the two like Be-Se Raman modes at small Be content.35 Only, the theoretical features are globally blue-shifted by 35 cm-1, due to the effective overbinding in LDA.
Now we apply the same procedure to ZnTeSe. The ZC TO-DOS due to the isolated impurity (thin lines) and to the impurity pair (thick lines) at both the Se- (upper curves) and Te-dilute (lower curves) limits are shown in the body of Fig. 6. The ZC TO-DOS due to the dominant substituting species (shaded areas) are added for complementary insight into the reference TO mode of the host lattice. Again, the theoretical curves are globally blue-shifted (by 20 cm-1) with respect to the Raman/IR features, due to the LDA. At the Se-dilute limit, two well-resolved pair-impurity (Se) modes show up with the isolated-impurity (Se) mode in-between, as in the reference ZnBeSe system. The host-lattice (Te) mode is situated just below. The low-frequency pair-impurity mode is red-shifted by 6 cm-1 with respect to the isolated-impurity mode. Note that the dominant contribution in the ZC TO-DOS of the isolated Se impurity does not refer to a pure ZC mode. Indeed we have checked that the impurity Se atom does not vibrate against the whole cage of its Zn first-neighbors, two out of four Zn atoms remain quasi-immobile. At the Te-dilute limit, the pair-impurity (Te) modes, transverse and longitudinal to the Te-Zn-Te chain, do nearly degenerate into a single mode situated at the same frequency as the isolated-impurity (Te) mode, corresponding to 0 cm-1. The host-lattice (Se) mode is located at a slightly higher frequency. These are precisely the limit (isolated impurity, impurity-pair, host lattice) configurations that we expect at (0,1) from Fig. 3. Similar insight into the values of In1-xGaxAs and In1-xGaxP is detailed in Ref. 35, .
The values obtained via the ‘protocol’ for InGaAs, InGaP and ZnTeSe are compared to the experimental ones in table 1. Again, the agreement is rather good, which validates the second part of the ‘protocol’.
For sake of completeness we mention also a similar procedure in the N-dilute limit of the non-random GaAs1-xNx alloy.36 Again the contrast in the bond length/stiffness of the two constituent species is large, even larger than in ZnBeSe, which provides a large value for the Ga-N bond. The theoretical estimate 50 cm-1 compares reasonably well to the experimental value of 40 cm-1, as inferred from the Raman spectra. Note that in this highly-contrasted system the fine structure of the ZC TO-DOS in the spectral region of the isolated N impurity and of the harder mode of the N-impurity pair is completely resolved, i.e. the in-plane and out-of-plane transverse modes of the impurity pair are no more degenerate.
Together with the ab initio ‘protocol’ our semi-empirical percolation model gives a self-sufficient tool for an insight into the vibration spectra of, in principle, any zincblende alloy.
VI CONCLUSION
In summary, by putting an emphasis on TO modes – as opposed to LO modes – as the proper way to get reliable insight into the whole complexity of the phonon mode behavior of an alloy, we show that ZnTeSe obeys the 1-bond2-phonon percolation model, as InGaAs and InGaP do. We propose a three-oscillator [1(Zn–Te), 2(Zn–Se)] version, independently supported by existing EXAFS data and home-made ab initio phonon/bond length calculations. This leads to unification of the traditional MREI-VCA/Elliott-CPA classification into a single class covered by the percolation model. Also, this work reveals that TO-based vibrational spectroscopies provide natural insight (non destructive and contactless) into the alloy disorder at the unusual mesoscopic scale, which is hardly achieved otherwise. In particular, this offers an attractive perspective for the study of the long scale (self) organization in alloys, be it local ordering03 or anti-clustering.36 At last we propose a simple ab initio ‘protocol’ at the dilute-impurity limits to estimate the input parameters of the semi-empirical percolation model for the calculation of the Raman/IR spectra of a random zincblende alloy. With this, the model becomes self-sufficient. More generally, what emerges is that SC alloys can not escape a description of some of their very basic physical properties via a percolation concept. As such, they do not differ fundamentally from the considerably more complex molecular/natural mixtures.
Acknowledgements.
The authors acknowledge support from the Indo-French Center for the Promotion of Advanced Research (IFCPAR project N∘ 3204-1) and from the Centre National Informatique de l’Enseignement Supérieur (CINES project N∘ pli2623).References
- (1) P.G. De Gennes, Scaling concepts in Polymer Physics (Cornell University Press, Ithaca and London, 1979).
- (2) U. Fano, Rev. Mod. Phys. 64, 313 (1992).
- (3) O. Pagès, A. Chafi, D. Fristot, and A.V. Postnikov, Phys. Rev. B 73, 165206 (2006).
- (4) I.F. Chang and S.S. Mitra, Adv. Phys. 20, 359 (1971).
- (5) J. C. Mikkelsen and J. B. Boyce, Phys. Rev. B 28, 7130 (1983).
- (6) B. Jusserand and S. Slempkes, Solid State Commun. 49, 95 (1984).
- (7) A. Mascarenhas, H. M. Cheong, M. J. Seong, and F. Alsina, in Spontaneous Ordering in Semiconductor Alloys, edited by A. Mascarenhas (Kluwer Academic/Plenum Publishers, New York, 2002), Chapter 14, p. 391.
- (8) J. Groenen, R. Carles, G. Landa, C. Guerret-Piécourt, C. Fontaine, and M. Gendry, Phys. Rev. B 58, 10452 (1998).
- (9) T. Kato, T. Matsumoto, and T. Ishida, Jpn. J. Appl. Phys.,Part 1 27, 983 (1988).
- (10) L. Genzel, T. P. Martin, and C. H. Perry, Phys. Stat. Sol. (b) 62, 83 (1974).
- (11) R.J. Elliott, J.A. Krumhansl and P.L. Leath, Rev. Mod. Phys. 46, 465 (1974).
- (12) D. W. Taylor, in Optical Properties of Mixed Crystals, edited by R. J. Elliott and I. P. Ipatova (Elsevier Science Publishers B.V., Amsterdam, 1988), p. 35.
- (13) V.M. Burlakov, A.P. Litvinchuk and V.N. Pyrkov, Sov. Phys. Solid State 27, 131 (1985).
- (14) V. Ozoliņš and A. Zunger, Phys. Rev. B 57, R9404 (1998).
- (15) D. Stauffer, Introduction to Percolation Theory (Taylor and Francis, London, 1985).
- (16) B. D. Rajput and D. A. Browne, Phys. Rev. B 53, 9052 (1996).
- (17) M. Cardona, P. Etchegoin, H. D. Fuchs, and P. Molinà-Mata, J. Phys.: Condens. Matter 5, A61 (1993).
- (18) V. V. Artamonov, M. Ya. Valakh and N.I. Vitrikhovskii, Sov. Phys. Solid State 21, 1015 (1979).
- (19) C. S. Yang, W.C. Chou, D.M. Chen, C. S. Ro, and J.L. Shen, Phys. Rev. B 59, 8128 (1999).
- (20) V. V. Artamonov, V.I. Sidorenko and A.M. Yaremko, Ukr. Plz. Zh. 28, 42 (1983).
- (21) A. Silverman, A. Zunger, R. Khalish, and J. Adler, Phys. Rev. B 51, 10795 (1995).
- (22) J. Pellicer-Porres, A. Polian, A. Segura, V. Muñoz-Sanjosé, A. Di Cicco, and A. Traverse, J. Appl. Phys. 96, 1491 (2004).
- (23) R. Trommer, H. Müller, M. Cardona, and P. Vogl, Phys. Rev. B 21, 4869 (1980).
- (24) A. Leitenstofer, S. Hunsche, J. Shah, M. C. Nuss, and W. H. Knox, Appl. Phys. Lett. 74, 1516 (1999).
- (25) C.C. Shih and A.A. Yariv, J. Phys. C: Solid State Phys. 15, 825 (1982).
- (26) O. Pagès, M. Ajjoun, J.P. Laurenti, D. Bormann, C. Chauvet, E. Tournié, and J.P. Faurie, Appl. Phys. Lett. 77, 519 (2000).
- (27) O. Pagès,T. Tite, D. Bormann, O. Maksimov, and M. C. Tamargo, Appl. Phys. Lett. 80, 3081 (2002).
- (28) P. Giannozzi, S. De Gironcoli, P. Pavone, and S. Baroni, Phys. Rev. B 43, 7231 (1991), http://www.pwscf.org.
- (29) H. J. Monkhorst and J. D. Pack, Phys. Rev. B 13, 5188 (1976).
- (30) K. Aoki, E. Anastassakis, and M. Cardona, Phys. Rev. B 30, 681 (1984).
- (31) Y. Zhang, A. Mascarenhas, and L.-W. Wang, Phys. Rev. B 64, 125207 (2001).
- (32) A. Nassour, J. Hugel, and A.V. Postnikov, J. Phys.: Conf. Series 92, 012139 (2007).
- (33) A. M. Teweldeberhan and S. Fahy, Phys. Rev. B 73, 245215 (2006).
- (34) J. M. Soler, E. Artacho, J. D. Gale, A. García, J. Junquera, P. Ordejón, and D. Sánchez-Portal, J. Phys.: Condens. Matter 14, 2745 (2002), http://www.uam.es/siesta.
- (35) A. V. Postnikov, O. Pagès, A. Nassour, J. Hugel, Proceedings of NAMES 2007, 3rd France-Russia ARCUS Seminar (7-9 nov. 2007, Metz, France), e-print available at http://arxiv.org/abs/0801.3419.
- (36) A. Chafi, O. Pagès, A.V. Postnikov, J. Gleize, V. Sallet, E. Rzepka, L. H. Li, B. Jusserand, and J. C. Harmand, Appl. Phys. Lett. 91, 51910 (2007).