WATER IN COMET C/2003 K4 (LINEAR) WITH SPITZER
Abstract
We present sensitive 5.5–7.6 µm spectra of comet C/2003 K4 (LINEAR) obtained on 16 July 2004 ( AU, AU, phase angle 35.4°) with the Spitzer Space Telescope. The vibrational band of water is detected with a high signal-to-noise ratio (50). Model fitting to the best spectrum yields a water ortho-to-para ratio of , which corresponds to a spin temperature of K. Spectra acquired at different offset positions show that the rotational temperature decreases with increasing distance from the nucleus, which is consistent with evolution from thermal to fluorescence equilibrium. The inferred water production rate is molec. s-1. The spectra do not show any evidence for emission from PAHs and carbonate minerals, in contrast to results reported for comets 9P/Tempel 1 and C/1995 O1 (Hale-Bopp). However, residual emission is observed near 7.3 µm the origin of which remains unidentified.
1 INTRODUCTION
The composition of cometary nuclei probes the physical conditions in the early solar nebula, the survival of materials from the interstellar medium (ISM), and the cold dense molecular cloud core in which the solar system formed (Wooden et al., 2004; Ehrenfreund et al., 2004; Mumma et al., 2003). Comet nuclei are highly porous agglomerates of ice and dust grains, perhaps with highly stratified, inhomogeneous layers of varied density, porosity, and composition (Harker et al., 2007; Belton et al., 2006; Oró et al., 2006; A’Hearn et al., 2005; Prialnik et al., 2004). The nucleus composition is dominated by ices (primarily water), organic refractory materials, silicates, and carbonaceous materials. When comets are within heliocentric distances of AU, solar insolation triggers sublimation and the release of volatile gases, sometimes sporadically, forming observable comae (Meech & Sovern, 2004).
In the nucleus of a comet, volatiles are frozen as ices or trapped as gases in amorphous water ice (Capria, 2002; Prialnik, 2002). Cometary activity occurs when gases are released through sublimation or through the exoergic crystallization of amorphous water ice. Between to 5 AU, when nuclear surface temperatures reach K, CO ice sublimes from the nucleus (Capria et al., 2000; Prialnik, 2002), possibly from near the surface (Gunnarsson et al., 2003), and triggers activity and intermittent outbursts. Between to AU, a dramatic increase occurs in gas production and grain entrainment and signals the coma onset stage. At nuclear surface temperatures of K (Prialnik et al., 2004), the water ice phase transition (amorphous to crystalline) releases a fraction of the trapped volatile gases. Strong erosion maintains the CO-ice sublimation and phase transition fronts relatively close to the surface (Capria et al., 2000). At to AU, the near-surface crystalline water ice layer, with its remaining trapped gases, begins to sublime. Water sublimation drives this vigorous activity stage that is often characterized by discrete active areas or jets.
Water is the dominate ice in comet nuclei and the production rate of water is correlated with comet activity. It influences the thermal balance of the coma as a strong coolant. At some wavelengths µm emission from ro-vibrational transitions of water can dominate the spectral energy distribution (Crovisier et al., 1997b); water can also be observed from its rotational transitions at submillimeter wavelengths (see review of Bockelée-Morvan et al., 2004). Probed through spectroscopic observations of coma species, the water production rate, coma temperature, and the nuclear spin temperatures derived from ortho-to-para ratios (OPR) are of particular interest in the study of cometary atmospheres and cometary physics. These physical characteristics, complemented by knowledge of the nucleus refractory and ice composition, provide constraints on solar nebula models (Mumma et al., 2003; Markwick & Charnley, 2005), and restrict the formation zones within the protoplanetary disk where cometary nuclei could conglomerate. In particular, the nuclear spin temperature of water measured in comet comae may be indicative of the chemical formation temperature of water (Dello Russo et al., 2005; Mumma et al., 1993) therefore identifying the environment where pre-cometary ices condensed.
Here we present longslit Spitzer Space Telescope spectroscopic observations of the 6 µm vibrational band of water detected in comet C/2003 K4 (LINEAR) at AU. The high signal-to-noise and the Infrared Spectrograph (IRS) longslit enable us to extract spatially resolved spectra in the coma and to measure the water production rate, (H2O), and the rotational temperature, , and the OPR variation in the coma. Space observations of the strong fundamental bands near 6 µm present a potentially more advantageous method for constraining water production rates and in comets than the more common ground-based measurement of the weaker non-resonance fluorescent “hot-bands” near 2.9 µm as the complex corrections for telluric extinction, slit-loss due to seeing, and consideration of whether the local radiative pump in the coma is optically thick are minimized (Bonev et al., 2007, 2006; Dello Russo et al., 2004; Bockelée-Morvan, 1987). In addition, accurate laboratory measurements of the absorption line strengths used to compute Einstein coefficients, (s-1), for the pump from the ground-state (000) are extant (Barber et al., 2006; Dello Russo et al., 2004; Partridge & Schwenke, 1997) while those for the hot bands are more challenging, leading to some uncertainty in estimates of the spontaneous emission rates, (s-1).
The infrared band of water was first detected with the Short Wavelength Spectrometer (SWS) of the Infrared Space Observatory (ISO) in the exceptional comet C/1995 O1 (Hale-Bopp) at AU (Crovisier et al., 1997a). The SWS spectral resolution of 1000 resulted in the detection of several individual ro-vibrational lines. However, the low signal-to-noise ratio prevented detailed analysis of their relative intensities. We discuss the Spitzer observations and data reduction techniques in § 2. Section 3.1 discusses the modeling of the water band. Section 3.2 through § 3.5 present the results, followed in § 4 by a discussion of residual emission features, including a comparison with the band of water detected in other comets with Spitzer. Section 5 presents a summary of our study of comet C/2004 K4 (LINEAR).
2 OBSERVATIONS AND REDUCTION
First identified as an asteroidal object in the LINEAR survey, C/2003 K4 (LINEAR) was discovered to have an extended spherical coma by Young & McGaha (2004) with parabolic orbital elements consistent with that of a dynamically new Oort Cloud comet. The following year upon perihelion approach ( AU, 2004 Oct 13.5 UT), C/2003 K4 (LINEAR) was bright in the optical (V 7 mag) and was noted to exhibit a primarily featureless 10 µm spectral energy distribution with emission from large amorphous carbon and silicate grains (grain radii µm) dominating the coma (Woodward et al., 2004). The 10 µm silicate feature-to-continuum ratio was observed to be near unity (Sitko et al., 2004; Russell et al., 2004), with little evidence for structure near 11.2 µm attributable to Mg-rich crystalline olivine grains (Sitko et al., 2004; Woodward et al., 2004). Schulz, Stüwe, & Erd (2005) observed a single broad coma feature in broadband images, perpendicular to the sunward direction in C/2003 K4 (LINEAR) during the 2004 May through 2004 July period with an increase in the amount of inferred gas-contamination in the B and V coma surface brightness with decreasing heliocentric distance. During the epoch of our Spitzer observations (§ 2.1), the comet produced a considerable amount of dust ( cm; Schulz, Stüwe, & Erd, 2005).
2.1 Spitzer IRS
Spectra of comet C/2003 K4 (LINEAR) were obtained with the Infrared Spectrograph (IRS) instrument (Houck et al., 2004) on the Spitzer Space Telescope (Gehrz et al., 2007; Werner et al., 2004). The comet was observed in the second order of the short-wavelength, low-resolution module (SL2) on 2004 Jul 16 at 04:56 UT as part of a Spitzer Guaranteed Time Observation (GTO) program (PI: R.D. Gehrz), program identification (PID) 131, astronomical observation request (AOR) key 0008525056 (catalog ADS/Sa.Spitzer#0008525056), and processed with IRS reduction pipeline S15.3.0. The SL2 slit is 3.7″ wide and provides 57″ of spatially resolved spectra (1.8″ pixel-1) with a spectral dispersion of 0.06 µm. Six spectra (14 s 3 cycles) at 5.2–7.6 µm were recorded in a spectral map, with steps (perpendicular parallel to the long slit dimension). The comet was at a heliocentric distance () of 1.760 AU, a Spitzer-comet distance of 1.409 AU, and a phase angle of 35.4°.
At the time of acquisition, we attempted to acquire the comet nucleus with the Spitzer IRS 15 µm peak-up array. However, the bright inner coma saturated a ellipse in the peak-up array preventing the spacecraft from computing a centroid on the comet. Thus, the telescope pointed to the comet’s nominal ephemeris position derived from orbital elements uploaded to the spacecraft prior to the execution of the AOR. On the date of observation, 2004 Jul 16 UT, the nominal position of the comet derived from these elements was 28″ from the actual position calculated with revised elements from JPL ephemeris #96 (computed 2006 Dec 14 with a data-arc spanning from 2003 May 28 through 2006 Nov 17). However, comet C/2003 K4 (LINEAR) had an extensive coma (′ in diameter) at the epoch of our Spitzer observation and thus error in the position of the nucleus did not affect our ability to obtain spectra of the comet coma. Our discussion of the IRS slit positions within the coma of the comet are referenced to the actual position as computed from the most recent JPL ephemeris. Figure 1 shows the blue peak-up image (saturated core), the slit positions, and the position of the nucleus (cross).
Coma emission (including the spectral signature from water lines) is present in all portions of our slits to varying degrees. Therefore, a robust estimate of the background emission is difficult to accurately assess (to the level of a few percent) using the Spitzer longslit observations of comet C/2003 K4 (LINEAR) alone. However, in the same IRS campaign (#10) an observation with the same IRS AOR parameters toward a similar ecliptic latitude () was available. The background derived from this IRS observation (AOR key 0004733952 (catalog ADS/Sa.Spitzer#0004733952) obtained from the Spitzer archive) was two-dimensionally subtracted from the basic calibrated data products (BCDs) of comet C/2003 K4 (LINEAR).
After background subtraction, we corrected the world coordinate system of the two-dimensional spectral frames for the motion of the comet, then combined each source observation into data cubes with the CUbe Builder for IRS Spectra Maps (CUBISM, Smith et al., 2007) program (v1.5)111Available at http://ssc.spitzer.caltech.edu/archanaly/contributed/cubism/. CUBISM combines each cycle and each slit position into a data cube where two axes contain the spatial information (1.85″ pixel-1 grid), and the remaining axis contains the spectral information. A separate cube is created for the pipeline errors derived from the individual BCDs. The program photometrically calibrates the data, including a correction for diffraction losses at the entrance slit (the so-called slit-loss correction factor; Kelley et al., 2006; Spitzer Science Center, 2006).
IRS spectra extracted from SL2 module have weak fringing artifacts (2% of the source flux, , at a given wavelength) that are difficult to completely remove using a sinusoidal function, as they are not spectrally resolved and vary with position in the slit (Spitzer Science Center, 2006). Thus, to account for any potential residual fringe contamination we compute the flux uncertainty in our extracted spectra at a given wavelength from the quadrature sum of the photometric error arising from the pipeline processing of individual BCDs plus a contribution due to SL2 fringing signal equal to . This latter term is an upper limit to the fringe uncertainty.
We extracted spectra from nine locations in the coma, as shown in Fig. 1. The extraction apertures are rectangles (subtending 1890 km 7560 km within the coma). We restricted our nine source extractions and subsequent analysis to locations where the coma is brightest, from 0″ to ″ offset from the nucleus (Fig. 1).
2.2 Wavelength Calibration
The water lines are unresolved and blended in the IRS spectra. Furthermore, the Spitzer IRS spectra are calibrated with standards measured near the center of the slit and three of our extractions occur near the slit edge. Analysis of the wavelength calibration and unresolved line widths is critical for identifying and fitting the water lines in the IRS spectra. To verify the wavelength calibration at the slit edge, we reduced IRS calibration observations of NGC 7027 at the center and edge of the SL2 slit. The NGC 7027 observations (AOR key 0010066432 (catalog ADS/Sa.Spitzer#0010066432), Spitzer PID 1410, IRS pipeline S13.2.0) were taken during the same IRS observing campaign (IRS#10) as the C/2003 K4 (LINEAR) spectra. We fit Gaussians to the [Mg V] 5.61 µm line (Bernard Salas et al., 2001) with the nebula at the center and edge positions. The width of the [Mg V] line in NGC 7027 at the center position agrees with the spectral resolution solution provided by the Spitzer Science Center (0.0605 µm). At the edge position, the line width increases to µm. The [Mg V] line was observed at a central wavelength of µm. Accounting for Doppler shift, the observed wavelength is µm from the vacuum rest wavelength of µm. The IRS SL2 wavelength calibration is µm (r.m.s.), indicating the [Mg V] shift is 2.3- from the expected central wavelength. The Gaussian fits show no significant difference in central wavelength between the center and edge positions. We compare the wavelength positions of the water lines to the expected central wavelengths in § 3.
3 THE WATER BAND IN COMET C/2003 K4 (LINEAR)
3.1 Model Fitting
At the resolution of the SL2 Spitzer spectrometer (), the water band shows ro-vibrational structure from which information on the rotational temperature, , in the ground vibrational state can be obtained. Though the spectral resolution is not high enough to separate individual ro-vibrational lines, and therefore ortho from para water lines, it is still possible to assess whether our Spitzer spectra can provide some constraints on the OPR. Previous determinations of the OPR in cometary water were based on water infrared spectra obtained with resolving powers between 1500 and 25000 (e.g., Mumma et al., 1993; Crovisier et al., 1997b; Dello Russo et al., 2005; Kawakita et al., 2006; Bonev et al., 2007).
Vibrational emission from cometary parent molecules results from radiative excitation by solar infrared radiation followed by fluorescence. For the fundamental vibrational bands of water, including , emission is not pure resonant fluorescence, as these bands are significantly populated by radiative decay from higher excited vibrational states. The vibrational fluorescence scheme of cometary water is presented by Bockelée-Morvan & Crovisier (1989). The band is significantly populated by decay of the band. The resulting emission rate of is 2.41 10-4 s-1 at AU from the Sun. The hot band has an emission rate of s-1 and therefore does not contribute significantly to the emission observed between 6 and 7 µm. Other hot bands (e.g., ) are even weaker.
We used the model of fluorescence water emission presented by Bockelée-Morvan & Crovisier (1989) for analyzing the Spitzer data. This model considers five excited vibrational states and their subsequent radiative cascades, and is an improvement of that presented in detail in Bockelée-Morvan (1987), where only the and bands are considered. Einstein coefficients for ro-vibrational transitions are computed using the 2003 edition of the GEISA spectroscopic database (Jacquinet-Husson et al., 2005), which includes all significant routes leading to excitation, including via hot bands. Comparison of the line strengths given in GEISA with those resulting from the ab-initio calculations of Partridge & Schwenke (1997) verified that the line-by-line relative intensities are insensitive (within 3–4%) to the choice of water line lists.
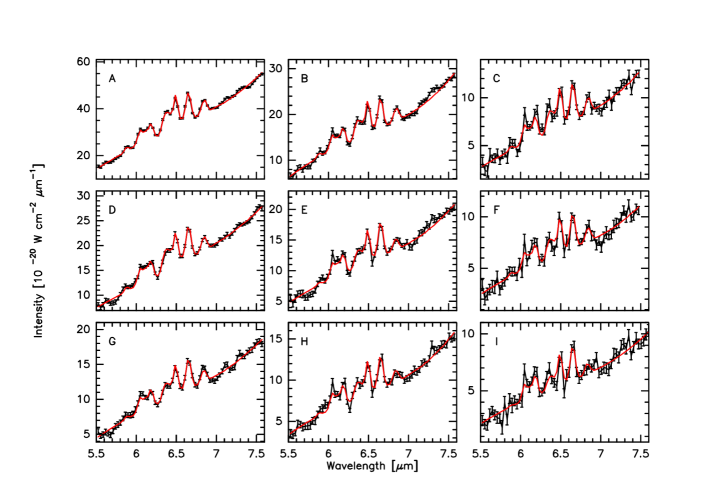
Our water model takes into account opacity effects in vibrational excitation and emission, using the escape probability formalism. For computing the line-by-line fluorescence, we considered 32 ortho and 32 para rotational levels in each vibrational state. The rotational populations in the ground vibrational state can be described by a Boltzmann distribution at a temperature , or the populations can be computed using an excitation model that considers the evolving excitation conditions experienced by the water molecules as they expand in the coma (§ 3.3). In this detailed model, ro-vibrational line intensities are computed for a circular aperture centered on the nucleus. We do not expect the results to be significantly sensitive to the shape of the aperture, providing the aperture area is conserved. From the model output, synthetic Spitzer spectra were generated by convolving the intensity of the individual ro-vibrational lines with the instrumental spectral response of the spectrometer, described by a Gaussian. Figure 2 shows examples of synthetic spectra obtained for the spectral resolution of SL2 and a 15 times higher resolving power. At first glance, the position and relative intensities of the peaks in the water modeled spectrum match approximately those in the C/2003 K4 (LINEAR) Spitzer spectra shown in Fig. 3, thereby demonstrating that these spectra are dominated by water emission.
For fitting the observed spectra, we assumed that the rotational populations of the ground vibrational state follow a Boltzmann distribution. The gas expansion velocity, , was fixed to 0.8 km s-1. The water photodissociation rate was taken equal to s-1 ( AU). This rate takes into account the solar activity at the time of the observations following the formalism described by Crovisier (1989). The only free parameters of the model are the water production rate (H2O), , and the OPR.
Overall, opacity effects are small. We computed that they affect the total intensity of the band by 6% for the spectrum of C/2003 K4 (LINEAR) acquired closest to the nucleus (7.2″ offset, Fig. 1). In addition, if opacity effects are not properly taken into account in the calculations, then the derived OPR also can be underestimated (on the order of %).
The water band emission is in excess of the dust continuum emission (Fig. 3). In the first analyses, the underlying continuum was determined using a 5-th order polynomial fit, and the residual (continuum-subtracted) spectra were fit with the water model, applying a least-squares method that uses the gradient-search algorithm of Marquardt. Continuum subtraction was not completely satisfactory, as excess continuum emission remained near 6.26 µm, while the band is almost free of lines at this wavelength (Fig. 2). More robust fits could be obtained by fitting simultaneously the underlying continuum and the water emission. Thus, we fit the original spectra with a composite curve consisting of the modeled water spectrum superimposed on a polynomial. Polynomials of or degree were used. However, final results were not found to be significantly sensitive to the choice of the polynomial degree between 3 and 6.
The nominal spectral resolution of SL2 is 0.060 µm near 6 µm. Model fits to the best C/2003 K4 (LINEAR) spectrum (7.2″ offset) with the spectral resolution left as a free parameter yielded µm, agreeing with the edge observation of NGC 7027 (§ 2.2). Results of model fits given in Table 1 were obtained with fixed to 0.065 µm. However, almost identical results (within the error) are returned with = 0.060 µm. For example, for the highest signal-to-noise ratio spectrum (Fig. 3, box A), the retrieved OPR is changed from to . We also found that the frequency calibration in SL2 spectra is likely incorrect by a tenth of the resolving power. The central wavelengths of band structures in C/2003 K4 (LINEAR) spectra are better matched by shifting the observed spectra by 0.0032 to 0.0062 µm, within the errors discussed in § 2. For example, for the 7.2″ offset spectrum, the between 5.8 and 7.1 µm is decreased by a factor 2.8 when applying a 0.0062 µm offset. The spectra of comet C/2003 K4 were shifted by 0.0032 to 0.0062 µm for the model fits shown in Table 1 and the corresponding figures (Figs. 3 and 4).
3.2 Water Modeling Results
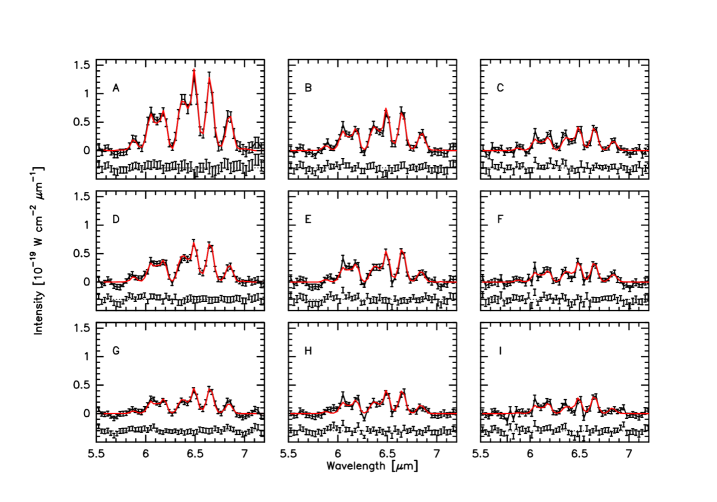
The best-fit modeled spectra for comet C/2003 K4 (LINEAR) are shown in Figs. 3 and 4, where in the latter figure the continuum has been subtracted. Residuals with respect to observed spectra are shown in the bottom of Fig. 4. Retrieved model parameters are given in Table 1. The agreement between our models and the Spitzer spectra is rather good for slit extractions A, D, and G, with reduced less than 1 (Table 1).
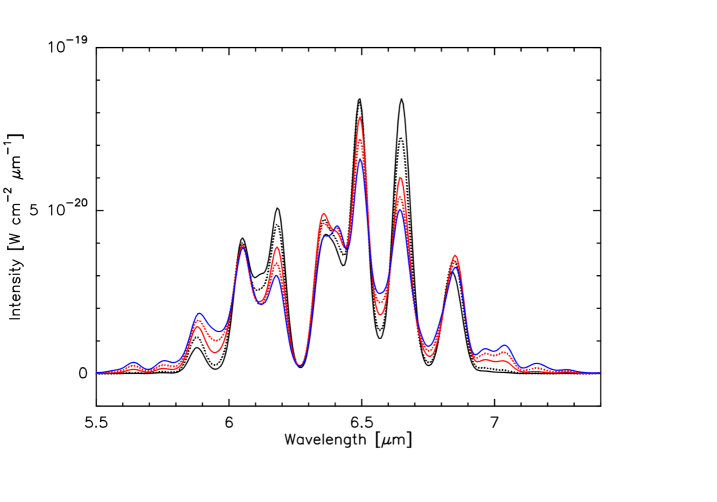
Some excess emission ( 3- deviation) is noticeable at 6.05 µm in most of the spectra at offset 18″. Models that incorporate values of higher than those determined from model fitting (Table 1) reduce the residual continuum emission near 6.05 µm but are inconsistent with the relative water line intensities arising from intrinsically stronger lines (Fig. 2) measured longward 6.3 µm. The variation in emergent water line intensities for which produce the broad emission feature from 5.5 to 7.0 µm when the models are convolved to the resolution of the Spitzer IRS SL2 are shown in Fig. 5. The 6.05 µm peak (mainly ortho –101 line) is more intense than the 6.18 µm (mainly –101 line) peak only for high ( 60 K). At low , these two lines result essentially from IR pumping from the 101 ground state rotational level: the ratio of their intensities (6.18 m)/ (6.05 m) then depends uniquely on ro-vibrational Einstein -coefficients and is predicted to be 1.5.
Weak residual emission (2- deviation) is also observed at 5.90–5.95 µm (see B, E, H extractions in Fig. 3). This excess emission does not coincide in wavelength to the position of the 5.88 µm peak of the water band, and may be related to flaws in background subtraction.
Our derived values of and OPR could be affected by the residual emission present between 5.90–6.1 µm. This emission (in excess of fringe artifact contamination) may arise from sources of weak line and continuum emission other than water not accounted for in our models. To quantify such effects, we derived estimates of and OPR by independently fitting two partial subsections of the spectra (5.85–6.3 µm and 6.3–7.0 µm) and any continua shortward of 5.8 µm and longward of 7.0 µm for the brightest slit extractions. These independent model fits, including those derived from the best reduced -squared fit of the entire spectra, are summarized in Table 2. Consistent OPR values are obtained from the independent model fits. The derived values are higher as a result of the 5.90–6.1 µm excess flux only when the 5.85–6.3 µm part of the spectrum is considered. Table 1 provides model parameters for all slit extractions retrieved by fitting the 6.3–7.0 µm part of the water spectrum. However, these latter fit parameters are not significantly different from those derived by fitting the entire spectrum.
3.3 Rotational Temperature
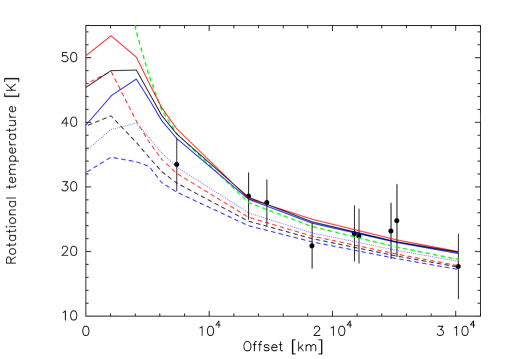
The inferred rotational temperatures are between 18 and 34 K and tend to decrease with increasing distance from the nucleus (Fig. 6). The rotational temperatures are not constant with respect to cometocentric distance out to km within the uncertainties. A linear least squares fit to in Table 1, as a function of distance to nucleus, gives a slope of 10-4 K km-1. Such behavior is expected. In the inner coma, collisions are important and the rotational levels of the fundamental vibrational state are thermalized at the local temperature. However, in the outer coma radiative pumping prevails and the rotational population of the water molecules reaches a cold fluorescence equilibrium (e.g., Bockelée-Morvan, 1987). How the populations evolve from thermal to fluorescence equilibrium depends of the density of the collisional partners, and related collisional cross-sections. Other attempts to examine the variation in water rotational temperature with cometocentric distance (Bonev et al., 2007) are restricted to the inner ( km) collision-dominated coma.
Water excitation models currently developed by various investigators include both H2O-H2O and H2O-e- collisions (Biver, 1997; Bensch & Bergin, 2004; Zakharov et al., 2007). For our analysis, we use the excitation model of Biver (1997), which differs from the models of Bensch & Bergin (2004) and Zakharov et al. (2007) by the method used to solve radiation trapping effects, but yields almost similar results (Zakharov et al., 2007). The electron density and radial temperature distribution is based on the measurements of 1P/Halley made by the Giotto mass spectrometers (e.g., Eberhardt & Krankowsky, 1995), to which scaling factors are applied to account for variations with water production rate and heliocentric distance. The parameter is a multiplying factor to the electron density, normalized to the 1P/Halley Giotto measurements (). The output of the model is the rotational populations in the ground vibrational state as a function of distance to nucleus. The populations are included in the water infrared fluorescence model to simulate water spectra at offset positions. For direct comparison with the observations, rotational temperatures are derived by fitting the synthetic spectra, as was done for the observed spectra.
Figure 6 shows the evolution of predicted for values of 0.2, 0.5, and 1.0, and inner coma kinetic temperatures of 30, 40, 50, and 100 K. These values of the parameter were selected because the electron density is rather uncertain and mapping of the 557 GHz H2O line favors 0.2 (Biver et al., 2007). The predicted increase in at 2000 km offset is due to thermal excitation by hot electrons. In the electron density model, this distance corresponds to the contact surface, , where the electron temperature and density undergo a steep increase (Xie & Mumma, 1992). Beyond 2, decreases because the effect of excitation by electronic collisions become less efficient with respect to radiative decay and the fluorescence equilibrium of the ground vibrational state is cold. In the 7000–15000 km region, the model predicts a decrease in of = 6 to 11 K for the considered parameters, in contrast to the observed decrease of 5 to 6 K. If one considers uncertainties associated with derived from the Spitzer spectra, models with K and are satisfactory. A value of 1.0 does not fit the data obtained at 7.2″ offset (Fig. 6), in agreement with Biver et al. (2007). The kinetic temperature is poorly constrained at the sampled cometocentric distances because, retains little memory of excitation conditions prevailing in the collisional region.
3.4 Ortho-to-Para Ratio
Though the spectral resolution of the SL2 spectra is low (), model fitting provides an accurate measurement of the OPR in comet C/2003 K4 (LINEAR) for the high signal-to-noise spectra (Tables 1 and 2). The OPR can be retrieved from band spectra obtained at low resolving power because several para lines are well separated in wavelength from strong ortho lines (Fig. 2). The band regions most sensitive to the OPR lie at 6.12 and 6.4 µm. At 6.12 µm, emission is dominated by the – para line, and three other significant para lines (Fig. 2). Since the nearby 6.05 and 6.18 µm peaks are mainly due to ortho lines (– and –, respectively), the intensity ratios (6.12)/(6.18) and (6.12)/(6.05) increase with decreasing OPR. Similarly, at 6.4 µm, the contributions from para lines (– and –) dominate the spectrum and the intensity ratio (6.4)/(6.5) is a function of the OPR. The variation in water band features with OPR, for K, at the Spitzer IRS spectral resolution is illustrated in Fig. 7. From the models depicted in this figure, the peak intensities of the 6.05 µm, 6.18 µm, and the 6.50 µm features increase by %, %, and % respectively as the OPR changes from values of 2 to 3. The intensity at 6.12 and 6.4 µm decreases in turn by %. However, the 6.64 and 6.85 µm water features remain constant and their intensity ratio only depends upon . The different behaviors of the intensity of the features with and OPR make the accurate measurement of these two parameters possible.
For the comet C/2003 K4 (LINEAR) spectrum at position A, 7.2″ offset from the nucleus position (Fig. 1), we obtain an OPR = when fitting the entire water spectrum (Table 2). The other spectra yield OPRs consistent with this value (Tables 1, 2). Conversions between ortho to para states by radiative transitions or by collisions in the coma have very low probability. The constancy of the OPR in the coma also has been convincingly demonstrated in comet C/2004 Q2 (Machholz) by Bonev et al. (2007). The weighted mean of all OPR values in comet C/2003 K4 (LINEAR) given in Table 2 (fits to 5.8–7.0 µm region) is . The OPR value derived for the aperture slit closest to the nucleus (labeled A), , corresponds to a spin temperature K.
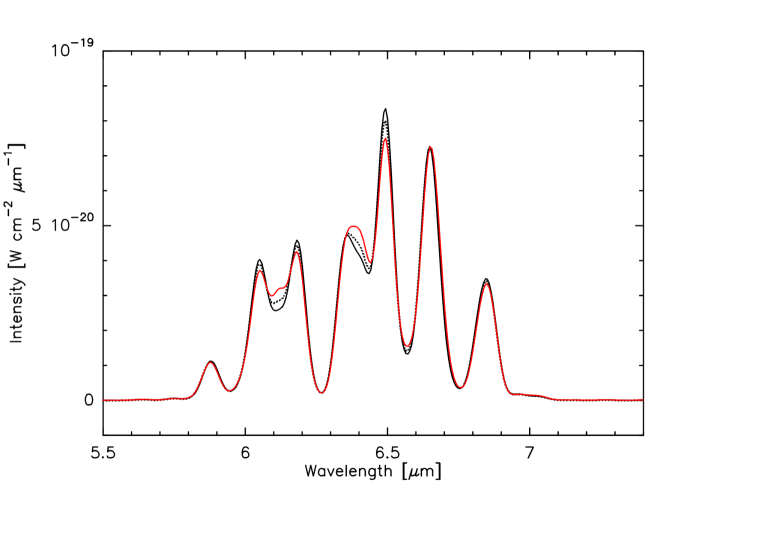
The reduced between 5.8 and 7.1 µm obtained for the spectrum at 7.2″ offset is 0.5. When the OPR is fixed to OPR = 3, the reduced is % higher (45% higher when fitting 6.3–7 µm partial spectrum). Figure 8 shows the model fit obtained in this case which yields K, a value close to that obtained with OPR = 2.47 (Table 2). There is significantly higher discrepancy between 6.3 and 6.4 µm in the two models.
The OPR (and ) determination relies on the assumption that water emission dominates the 5.8–7.2 µm C/2003 K4 (LINEAR) spectrum. Misleading results can be obtained when extra emission from other constituents is present. In addition to the 6 µm residual emission discussed in § 3.2, PAH emission peaks (e.g., Peeters et al., 2002) near 6.2 µm, i.e., in the region where the shape of H2O band depends on the OPR (Fig. 8). Because the independent model fits of partial subsections of the spectra provide consistent OPR values (Table 2), our OPR determinations are likely not affected by unaccounted species. We also conclude that the dominant source of emission in the SL2 wavelength regime for comet C/2003 K4 (LINEAR) is the water band.
Our derived water OPR for C/2003 K4 (LINEAR) is comparable to to values derived for Oort Cloud (nearly-isotropic) comets such as C/1995 O1 (Hale-Bopp), C/1999 H1 (Lee), C/1999 S4 (LINEAR), C/2001 Q1 (NEAT), and C/2001 A2 (LINEAR), although lower ( 15-20%) than that reported for Jupiter-family (ecliptic) comets, for example 103P/Hartley 2 or 1P/Halley (Crovisier et al., 2000; Dello Russo et al., 2005; Kawakita et al., 2006) or C/2004 Q2 (Machholz) (Bonev et al., 2007). The value of K for C/2003 K4 (LINEAR) is suggestive of precometary ice formation in a cold molecular cloud environment devoid of secondary processing in a warm solar nebula (Kawakita et al., 2006), although the precise interpretation of the OPR as a probe of the primordial formation zones of comets in the protosolar nebula remains vexing (Crovisier, 2007). We also do not have spectroscopic measurements of other common cometary ices such as ammonia or methane in coma of C/2003 K4 (LINEAR). Thus we are unable to ascertain whether the ices incorporated into the nucleus of C/2003 K4 (LINEAR) share the same chemical composition and homogeneity of as that found for other comets of diverse dynamical classes (Crovisier, 2007).
3.5 Water Production Rate
The intensity of the band measured for C/2003 K4 along the nine slit extractions is given in Table 1, and is plotted as a function of offset in Fig. 9. The evolution with distance to nucleus is consistent with that computed using a Haser distribution for the water density and (H2O) = molec. s-1, where the error includes a 10% uncertainty in the IRS absolute calibration (Spitzer Science Center, 2006). Some deviations are observed, which may be related to asymmetries in the density distribution and/or (for the noisy spectra) incorrect background subtraction.
The derived pre-perihelion ( = 1.76 AU) water production rate is consistent with OH 18-cm observations performed with the Nançay radio telescope which yield (H2O) 2 1029 molec. s-1 at the epoch of the Spitzer observations (Crovisier et al., personal communication). Post-perihelion measurements obtained from H2O 557 GHz line observations using the Odin satellite give a (H2O) about a factor of two lower at AU (Biver et al., 2007), which suggests a pre/post-perihelion asymmetry in the gaseous activity of the comet. Similar asymmetrical perihelion production rates of water and other volatiles has been observed in other comets, including C/1995 O1 (Hale-Bopp) (e.g., Fig. 3 of Biver et al., 1997) and possibly 1P/Halley (e.g., Fig. 6 of Gehrz et al., 2005).
4 Residual Emission Between 5.5 and 7.6 µm
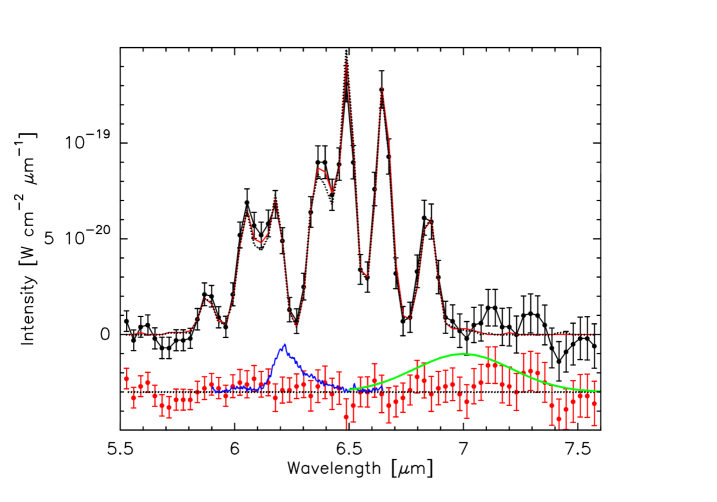
Lisse et al. (2006) report emission from carbonate minerals at 6.5–7.2 µm and organic (PAH) emission at 6.2 µm in the spectrum of comet 9P/Tempel after collision with the Deep Impact impactor. In a subsequent paper, Lisse et al. (2007) claim the detection of these emission features in the ISO spectrum of comet C/1995 O1 (Hale-Bopp) published by Crovisier et al. (1997b). However, a re-analysis of the ISO observations of comet Hale-Bopp by Crovisier & Bockelée-Morvan (2007) does not confirm the detection of PAHs reported by Lisse et al. (2007). Furthermore, Crovisier & Bockelée-Morvan (2007) demonstrate that carbonate emission at 7 µm, though possibly marginally present, is fainter by a factor 2 to 3 than asserted by Lisse et al. (2007). Figure 8 shows representative spectra of PAHs and carbonate minerals compared to the best Spitzer spectrum of comet C/2004 K4 (LINEAR). Our synthetic water spectrum wholly accounts for any emission in-excess of the continuum at the wavelengths of PAHs and carbonate emission. As discussed in § 3.1 and § 3.2, residual emission is only marginally present in some spectra near 5.9 and 6.05 µm in various apertures in the C/2003 K4 (LINEAR). Since PAH features are narrow ( 0.15 µm) and peak near the water 6.18 µm pattern, a significant contribution of PAHs in the spectrum would have resulted in an intensity ratio (6.18 m)/(6.05 m) higher than observed. Similarly, carbonate emission, if present, would have been seen directly on the original spectra (continuum background included, Fig. 3) longward of 7 µm. Indeed the 3- upper limit to the peak intensity of any carbonate or PAH emission, computed from the residual emission between 6.15 to 6.30 µm and 6.75 to 7.25 µm using the representative PAH and carbonate spectra shown in Fig. 8, does not exceed 7 to W cm-2 µm-1 ( Jy) in the C/2003 K4 (LINEAR) spectrum at 7.2″ offset position.
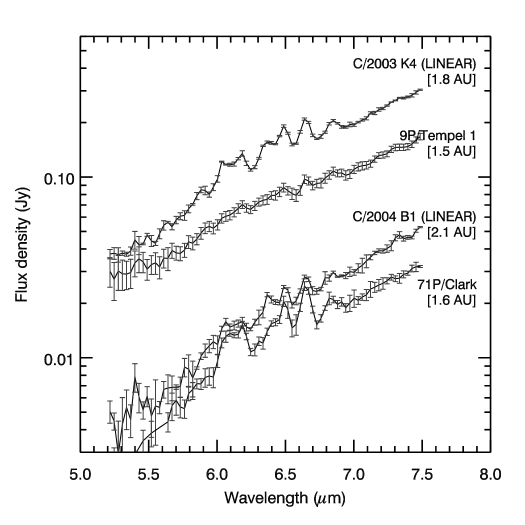
As depicted in Fig. 10, Spitzer spectra of comets C/2004 B1 (LINEAR), 71P/Clark, and 9P/Tempel 1 show evidence for water emission arising from sublimating ices in their comae. A detailed study, similar to that presented in this paper, is required to investigate whether emission from other compounds is present in these spectra (Woodward et al., 2007).
From Fig. 8, we see that a narrow ( 0.1 µm) residual emission feature is present near 7.3 µm (1370 cm-1). A small spectral segment of the Spitzer IRS data near 7.3 µm, shown in Fig. 11, provides detailed, close-up view of this emission feature. The origin of this feature is unclear. The peak flux and integrated feature flux is in excess of that anticipated from spurious fringe signal power. A possible candidate is emission from the SO2 band at 7.34 µm that has a fluorescence emission rate at 1 AU from the Sun of s-1 (Crovisier, 2002). Synthetic spectra of SO2 band obtained using the HITRAN database (Rothman et al., 2004) approximately match the width of the feature, but the central wavelengths do not coincide. In addition, the measured intensity in the spectrum obtained at 7.2″ offset in the coma of comet C/2003 K4 (LINEAR), W cm-2, would imply a SO2/H2O production rate ratio of 2.5%, a factor 10 times higher than measured in comet C/1995 O1 (Hale-Bopp) (Bockelée-Morvan et al., 2000). Therefore, it seems unlikely that the observed 7.3 µm feature is due to SO2. The NIST database222http://webbook.nist.gov/chemistry/ provides band positions of a number of gas phase species, including organics. No satisfactory candidate could be found. For example, methyl formate HCOOCH3, identified in cometary atmospheres (Bockelée-Morvan et al., 2000), has a band of medium strength at 1371 cm-1, but also a much stronger band at 1754 cm-1 (5.7 µm) which is not seen in the Spitzer spectra. Acetic acid exhibits a strong band at 1375 cm-1, but a still stronger one at 1248 cm-1 (6.94 µm). If the feature is originating from a gas phase species, then the abundance of this molecule relative to water should be on the order of 1% or more, based on the measured intensity and typical fluorescence emission rates in cometary environment.
The 7.3 µm wavelength corresponds to the characteristic vibrational frequency of the CH3 “umbrella” deformation mode (1375 cm-1). A 7.3 µm absorption feature has been detected in some galactic and extragalactic sources (e.g., Chiar et al., 2000; Spoon et al., 2000), and assigned to aliphatic hydrocarbons. However, an absorption signature at 6.85 µm is also observed, corresponding to CH2 bending vibrations. Spectra of various carbonaceous refractory materials, including chondritic material, that contain aliphatic chains show that these two features are present as a doublet with intensity ratio m/m 1 (Pendleton & Allamandola, 2002). In contrast, no residual emission is observed at 6.8 µm in the comet C/2003 K4 (LINEAR) spectrum. Therefore, aliphatic hydrocarbons are not likely the source of the cometary 7.3 µm feature, although such compounds have been identified in the material captured from comet 81P/Wild 2 by the Stardust spacecraft (Keller et al., 2006).
A few galactic and extragalactic sources exhibit a weak emission feature at 7.3–7.4 µm (with no 6.85 µm counterpart) that shows up on the wing of the well known strong 7.7 µm complex attributed to CC stretching/CH in plane bending vibrations of aromatics (likely PAHs) compounds (Peeters et al., 2002). Based on theoretical calculations of expected CC stretching band positions of PAHs of various complexity (see Peeters et al., 2002), this weak component is likely a PAH signature. However, the comet feature may have a different origin as no strong 6.8 and 7.7 µm PAH emission is evident in the Spitzer spectra of C/2003 K4 (LINEAR).
5 CONCLUSIONS
We have observed the vibrational band of water in comet C/2003 K4 (LINEAR) within 5.5 to 7.6 µm Spitzer IRS spectra, deriving a water production rate of molec. s-1 when the comet was at a pre-perihelion heliocentric distance of 1.760 AU. Although the IRS spectra are of moderate resolution, modeling of the observed emission in the 5.7 to 6.8 µm region constrained the water spin temperature to be K. The measured is comparable to that of other Oort cloud comets and suggestive of a common formation zone for the precometary water ices that eventually agglomerated into the nuclei, though the precise interpretation of the OPR as a probe of the primordial formation zones of comets in the protosolar nebula remains controversial (Crovisier, 2007). The observed decrease (at 3- confidence level) of the water rotational temperature with cometocentric distance is compatible with evolution from thermal to fluorescence equilibrium and constrains somewhat the role of electron collisions in water excitation. The kinetic temperature of the gas is poorly constrained.
Neither emission from carbonates nor PAHs was necessary to account for any emission in excess of the continuum at wavelengths between 5 to 7 µm, suggesting that these species are not present in the coma of C/2003 K4 (LINEAR) at the abundance levels measured by Lisse et al. (2006) in comet 9P/Tempel 1. However, an emission feature at µm is observed that remains unidentified, as potential emission candidates, the SO2 band or CH3 deformation modes, can be discounted.
References
- A’Hearn et al. (2005) A’Hearn, M. F., et al. 2005, Science, 310, 258
- Barber et al. (2006) Barber, R. J., Tennyson, J., Harris, G. J., & Tolchenov, R. N. 2006, MNRAS, 368, 1087
- Belton et al. (2006) Belton, M. J. S., et al. 2006, Icarus in press
- Bensch & Bergin (2004) Bensch, F., & Bergin, E. A., 2004, ApJ, 615, 531
- Bernard Salas et al. (2001) Bernard Salas, J., Pottasch, S. R., Beintema, D. A., & Wesselius, P. R. 2001, A&A, 367, 949
- Biver (1997) Biver, N., 1997, PhD thesis, University of Paris 7
- Biver et al. (2007) Biver, N., et al. 2007, P&SS, in press
- Biver et al. (1997) Biver, N., et al. 2007, Earth, Moon, & Planets, 78, 5
- Bockelée-Morvan (1987) Bockelée-Morvan, D., 1987, A&A, 181, 169
- Bockelée-Morvan & Crovisier (1989) Bockelée-Morvan, D., & Crovisier, J. 1989, A&A, 216, 278
- Bockelée-Morvan et al. (2000) Bockelée-Morvan, D., et al. 2000, A&A, 353, 1101
- Bockelée-Morvan et al. (2004) Bockelée-Morvan, D., Crovisier, J., Mumma, M. J., & Weaver, H. A. 2004, in Comets II, eds. M. Festou, H. U. Keller, and H. A. Weaver, (University of Arizona Press: Tucson), p.391
- Bonev et al. (2007) Bonev, B. P., Mumma, M. J., Villanueva, G. L., Disanti, M. A., Ellis, R. S., Magee-Sauer, K., & Dello Russo, N. 2007, ApJ, 661, L97
- Bonev et al. (2006) Bonev, B. P., Mumma, M. J., Disanti, M. A., Dello Russo, N., Magee-Sauer, K., Ellis, R. S., & Stark, D. P. 2006, ApJ, 653, 774
- Capria (2002) Capria, M. T. 2002, Earth, Moon, & Planets, 89, 161
- Capria et al. (2000) Capria, M. T., et al. 2000, A&A, 357, 359
- Chiar et al. (2000) Chiar, J. E., Tielens, A. G. G. M., Whittet, D. C. B., Schutte, W. A., Boogert, A. C. A., Lutz, D., van Dishoeck, E. F., & Bernstein, M. P. 2000, ApJ, 537, 749
- Crovisier (1989) Crovisier, J., 1989, A&A, 213, 459
- Crovisier (2002) Crovisier, J. 2002, Constants for molecules of astrophysical interest in the gas phase: photodissociation, microwave and infrared spectra. http://www.lesia.obspm.fr/~crovisier/basemole
- Crovisier (2007) Crovisier, J. 2007, arXiv:astro-ph/0703785
- Crovisier & Bockelée-Morvan (2007) Crovisier, J., & Bockelée-Morvan D. 2007, Icarus (in press)
- Crovisier et al. (2000) Crovisier, J., et al. 2002, in Thermal Emission Spectroscopy and Analysis of Dust, ASP Conf. Ser. 196, eds. Y. Pendelton, D. Cruikshank [ASP: San Francisco], 109
- Crovisier et al. (1997a) Crovisier, J., et al. 1997a, First ISO Workshop on Analytical Spectroscopy, ESA SP 419, 137
- Crovisier et al. (1997b) Crovisier, J., et al. 1997b, Science 275, 1904
- Dello Russo et al. (2005) Dello Russo, N., Bonev, B. P., DiSanti, M. A., Mumma, M. J., Gibb, E. L., Magee-Sauer, K., Barber, R. J., & Tennyson, J. 2005, ApJ, 621, 537
- Dello Russo et al. (2004) Dello Russo, N., DiSanti, M. A., Magee-Sauer, K., Gibb, E. L., Mumma, M. J., Barber, R. J., & Tennyson, J. 2004, Icarus, 168, 186
- Eberhardt & Krankowsky (1995) Eberhardt, P., & Krankowsky, D. 1995, A&A, 295, 795
- Ehrenfreund et al. (2004) Ehrenfreund, P., et al. 2004, in Comets II, eds. M. Festou, H. U. Keller, and H. A. Weaver, (University of Arizona Press: Tucson), p.115
- Gehrz et al. (2007) Gehrz, R. D., Roellig, T. L., Werner, M. W., Fazio, G. G., Houck, J. R., Low, F. J., Rieke, G. H., Soifer, B. T., Levine, D. A., & Romana, E. A. 2007, Rev. Sci. Instr., 78, 011302
- Gehrz et al. (2005) Gehrz, R. D., Hanner, M. S., Homich, A. A., & Tokunaga, A. T. 2005, AJ, 130, 2383
- Gunnarsson et al. (2003) Gunnarsson, D., et al. 2003, A&A, 402, 383
- Harker et al. (2007) Harker, D. E., Woodward, C. E., Wooden, D. H., Trujillio, C., & Fisher, S. 2007, Icarus, in press
- Jacquinet-Husson et al. (2005) Jacquinet-Husson, N., et al. 2005, JQRST, 95, 429
- Houck et al. (2004) Houck, J. R., et al. 2004, ApJS, 154, 18
- Kawakita et al. (2006) Kawakita, H., et al. 2006, ApJ, 643, 1337
- Keller et al. (2006) Keller, L. P., et al. 2006, Science, 314, 1728
- Kelley et al. (2006) Kelley, M. S., et al. 2006, ApJ, 651, 1256
- Lisse et al. (2007) Lisse, C. M., Kraemer, K. E., Nuth, J. A., Li, A., & Joswiak, D. 2007, Icarus 187, 69
- Lisse et al. (2006) Lisse, C. M., et al. 2006, Science, 313, 635
- Markwick & Charnley (2005) Markwick, A. J. & Charnley, S. B. 2005, in Highlights of Astronomy, Vol. 13, eds. O. Engvold, (Astron. Soc. Pacific: San Francisco) p.518
- Meech & Sovern (2004) Meech, K. & Svoren, J. 2004, in Comets II, eds. M. Festou, H. U. Keller, and H. A. Weaver, (University of Arizona Press: Tucson), p.317
- Mumma et al. (2003) Mumma, M. J., et al. 2003, Adv. Space Res., 31, 2563
- Mumma et al. (1993) Mumma, M. J., Weissman, P. R., & Stern, S. A. 1993, Protostars and Planets III, eds. M. H. Levy and J. I. Lunine, (University of Arizona Press: Tucson), p.1177
- Oró et al. (2006) Oró, J., Lazcano, A., & Ehrenfreund, P. 2006, in Comets and the Origin and Evolution of Life, eds. P. J. Thomas, R. D. Hicks, C. F. Chyba, C. P. McKay (Springer: New York), p.1
- Partridge & Schwenke (1997) Partridge, H., & Schwenke, D. W. 1997, J. Chem. Phys., 109, 4618
- Peeters et al. (2002) Peeters, E., Hony, S., Van Kerckhoven, C., Tielens, A. G. G. M., Allamandola, L. J., Hudgins, D. M., & Bauschlicher, C. W. 2002, A&A, 390, 1089
- Pendleton & Allamandola (2002) Pendleton, Y. J., & Allamandola, L. J. 2002, ApJS, 138, 75
- Prialnik et al. (2004) Prialnik, D., Benkhoff, J., & Podolak, M. 2004, in Comets II, eds. M. Festou, H. U. Keller, and H. A. Weaver, (University of Arizona Press: Tucson), p.359
- Prialnik (2002) Prialnik, D. 2002, Earth, Moon, & Planets, 89, 27
- Rothman et al. (2004) Rothman, L.S., et al. 2005, JQSRT, 96, 139
- Russell et al. (2004) Russell, R. W., Lim, D. L., Sitko, M. L., & Carpenter, W. J. 2004, IAUC, 8361
- Schulz, Stüwe, & Erd (2005) Schulz, R., Stüwe, J. A., & Erd, C. 2005, Earth, Moon, & Planets, 97, 387
- Sitko et al. (2004) Sitko, M. L., Russell, R. W., Lynch, D. K., & Lim, D. L. 2004, IAUC, 8391
- Smith et al. (2007) Smith, J. D. et al. 2007, PASP, submitted
- Spitzer Science Center (2006) Spitzer Science Center 2006, Infrared Spectrograph Data Handbook (Pasadena: SSC) http://ssc.spitzer.caltech.edu/irs/dh/dh30_v1.pdf/
- Spoon et al. (2000) Spoon, H. W. W., Koornneef, J., Moorwood, A. F. M., Lutz, D., & Tielens, A. G. G. M. 2000, A&A, 357, 898
- Werner et al. (2004) Werner, M. W., et al. 2004, ApJS, 154, 1
- Wooden et al. (2004) Wooden, D. H., et al. 2005, in Comets II, eds. M. Festou, H. U. Keller, and H. A. Weaver, (University of Arizona Press: Tucson), p.33
- Woodward et al. (2007) Woodward, C.E., Kelley, M. S., Bockelée-Morvan, D., et al. 2007, in preparation
- Woodward et al. (2004) Woodward, C. E., Kelley, M. S., & Wooden, D. H. 2004, IAUC, 8131
- Xie & Mumma (1992) Xie, X., & Mumma, M.J., 1992, ApJ, 386,720
- Young & McGaha (2004) Young, J. & McGaha, J. 2004, IAUC, 8131
- Zakharov et al. (2007) Zakharov,V., et al., 2007, A&A, in press
| Extraction | OffsetaaRelative to the comet C/2003 K4 (LINEAR) ephemeris position derived from JPL #96. | OffsetaaRelative to the comet C/2003 K4 (LINEAR) ephemeris position derived from JPL #96. | Band IntensitybbBand intensity above fitted continuum between 5.8 and 7.1 µm. | ccFits to the 6.3–7.0 µm region. | OPRccFits to the 6.3–7.0 µm region. | c,dc,dfootnotemark: |
|---|---|---|---|---|---|---|
| Slit ID | (″) | (km) | (10-20 W cm-2) | () | ||
| A 0-27 | 7.2 | 7377 | 5.51 0.16 | 33.5 4.0 | 2.47 0.30 | 0.5 |
| B 0-22 | 12.9 | 13198 | 2.67 0.10 | 28.6 3.6 | 2.47 0.34 | 1.0 |
| C 0-17 | 21.3 | 21785 | 1.62 0.09 | 22.8 4.3 | 2.5eeAssumed value. | 1.6 |
| D 1-27 | 14.4 | 14682 | 2.88 0.10 | 27.6 3.5 | 2.13 0.31 | 0.5 |
| E 1-22 | 18.0 | 18348 | 1.93 0.09 | 20.9 3.5 | 2.56 0.47 | 1.5 |
| F 1-17 | 24.7 | 25229 | 1.19 0.09 | 24.8 5.6 | 2.5eeAssumed value. | 1.6 |
| G 2-27 | 21.7 | 22154 | 1.68 0.08 | 22.4 4.2 | 2.61 0.31 | 0.9 |
| H 2-22 | 24.2 | 24750 | 1.46 0.08 | 23.2 4.3 | 2.38 0.48 | 1.5 |
| I 2-17 | 29.6 | 30209 | 1.02 0.09 | 17.7 5.0 | 2.5eeAssumed value. | 2.4 |
| Extraction | Regions Fit | OPR | |
|---|---|---|---|
| Slit ID | (µm) | () | |
| A 0-27 | 5.85 – 7.00 | 30.7 3.2 | 2.47 0.27 |
| A 0-27 | 5.85 – 6.30 | 36.5 5.8 | 2.03 0.40 |
| A 0-27 | 6.30 – 7.00 | 33.5 4.0 | 2.47 0.30 |
| B 0-22 | 5.85 – 7.00 | 26.5 3.3 | 2.95 0.40 |
| B 0-22 | 5.85 – 6.30 | 59.5 8.8 | 2.83 0.68 |
| B 0-22 | 6.30 – 7.00 | 28.6 3.6 | 2.47 0.34 |
| D 1-27 | 5.85 – 7.00 | 27.0 2.9 | 2.07 0.24 |
| D 1-27 | 5.85 – 6.30 | 42.7 7.6 | 1.55 0.30 |
| D 1-27 | 6.30 – 7.00 | 27.6 3.5 | 2.13 0.31 |
| G 2-27 | 5.85 – 7.00 | 21.4 3.2 | 2.67 0.41 |
| G 2-27 | 5.85 – 6.30 | 54 12 | 2.16 0.57 |
| G 2-27 | 6.30 – 7.00 | 22.4 4.2 | 2.61 0.31 |