Infrared phonon dynamics of multiferroic BiFeO3 single crystal
Abstract
We discuss the first infrared reflectivity measurement on a BiFeO3 single crystal between 5 K and room temperature. The 9 predicted ab-plane phonon modes are fully and unambiguously determined. The frequencies of the 4 c-axis phonons are found. These results settle issues between theory and data on ceramics. Our findings show that the softening of the lowest frequency mode is responsible for the temperature dependence of the dielectric constant, indicating that the ferroelectric transition in BiFeO3 is soft-mode driven.
pacs:
78.30.-j, 77.84.-s, 77.22.-dThe interplay between magnetic and dielectric properties is an intriguing subject that was already discussed by Pierre Curie in 1894 Curie . Such, magnetoelectric effects were subject of extensive studies during the 1960s Freeman ; Smith ; Moreau . More recently, the ability of controlling the dielectric properties through a magnetic field and vice-versa renewed the interest in these materials Huang ; Katsufuji ; Kimura . Coupling between electrical and magnetic properties are particularly interesting in multiferroic materials, which present simultaneously two or more ferroic or antiferroic order parameters. The ferroelectric Smith and antiferromagnetic properties of BiFeO3 based systems, showing K Lebeugle2007 and K Moreau , have been known for a long time but the possibility of making devices operating at room temperature Zhao gave a new burst to bismuth ferrite. The coexistence of ferroelectricity and antiferromagnetism at room temperature, makes BiFeO3 one of the most interesting multiferroic materials.
Optical spectroscopy is a very powerful tool to understand the driving mechanism of the ferroelectric transition and, eventually, its coupling to magnetic ordering Souchkov ; Litvinchuk . Nevertheless, only a few Raman Haumont ; Fukumura ; Cazayous and infrared (IR) Kaczmarek ; Kamba studies on BiFeO3 are known to date. Surprisingly none of the IR measurements were carried out on single crystals. There are two important open questions concerning the electrodynamics of BiFeO3: (i) the phonon modes symmetry; and (ii) the role (or absence of thereof) of phonon softening in the ferroelectric transition.
In its ferroelectric phase, BiFeO3 belongs to the () space group, which derives from the ideal (paraelectric) () cubic perovskite group by a small distortion along the cubic directions. Its magnetic structure is a spiral-cycloidal incommensurate phase. Group theory analysis for the ferroelectric group predicts optical phonon modes Kamba . The modes are infrared active along the c-axis, the modes are infrared active on the ab-plane and the modes are silent. Early Raman data Haumont found at least 11 modes at room temperature. Kamba et al. Kamba proposed to fit the infrared data on ceramics using 13 Lorentz oscillators. Although these results found the proper number of modes, they cannot clarify the symmetry of the phonons. Some extra insight on the phonon assignment was obtained on more recent Raman data Fukumura ; Cazayous but some inconsistencies in phonon assignment remain. In addition, Haumont et al.Haumont argued that because the frequency of the lowest mode did not vanish smoothly at the Curie temperature, the ferroelectric transition in BiFeO3 would not be soft-mode driven. This picture was later revised to propose that the incomplete phonon softening could rather be a sign of a first order transition Kamba ; Hermet . However, both scenarios remain speculative.
In this paper, we show the polarized infrared response from 5 K to room temperature of a BiFeO3 single crystal. Our crystal geometry allows us to unambiguously determine the ab-plane phonons and to infer the frequencies of the c-axis phonons. Moreover, we show that the temperature variation of the dc dielectric function is completely governed by the softening of the lowest frequency mode giving a strong evidence for a soft-mode driven transition.
High quality and purity BiFeO3 crystals were obtained by flux growth Lebeugle ; Lebeugle2007b . We measured a thin BiFeO3 plate measuring mm3. Near normal incidence infrared reflectivity was recorded from 25 to 4000 in a Bruker IFS66v interferometer. Below 650 we utilized a Ge coated Mylar beamsplitter and a 4 K Si bolometer. Above 500 a Ge:KBr beamsplitter and a MCT detector were used. In the overlapping region, the spectra agreed within 1 %. The sample was mounted on the cold finger of an ARS Helitran open cycle cryostat equipped with polyethylene and KRS-5 windows. The spectra were collected on the as-grown mm2 flat face of the sample. To obtain the infrared reflectivity on such a small sample, an overfill technique with a in-situ gold evaporation was performed Homes . The measured surface, corresponding to the plane, is reminiscent of the high temperature cubic phase []. X-ray analysis on similar crystals, showed that the axis perpendicular to the sample flat surface makes an angle of with the c-axis Lebeugle . Using polarized light we could isolate the contribution from the ab-plane. Our crystal geometry does not allow to isolate the c-axis response which is heavily contaminated by the ab-plane phonons.
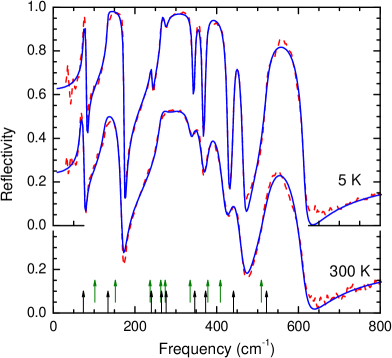
Figure 1 shows the infrared reflectivity at 5 K and at room temperature for the electric field polarization lying in the ab-plane. The dashed lines are the data and the solid lines are fits using a dielectric function of the form
| (1) |
where , and are, respectively, the transverse optical (TO) frequency, damping and oscillator strength for the -th mode. is the permittivity due to high frequency electronic excitations. The near normal incidence reflectivity is obtained from the Fresnel formula . The fitting parameters for these two temperatures are shown in Table 1.
| 300 K | 5 K | |||||
|---|---|---|---|---|---|---|
| Mode | ||||||
| E(1) | ||||||
| E(2) | ||||||
| E(3) | ||||||
| E(4) | ||||||
| E(5) | ||||||
| E(6) | ||||||
| E(7) | ||||||
| E(8) | ||||||
| E(9) |
The 5 K spectrum in Fig. 1 clearly shows the 9 modes predicted by group theory. At room temperature, two of these phonons [ and ] are strongly damped but keeping them improves the fit quality. Hermet et al. Hermet calculated the phonon frequencies expected for BiFeO3 using density functional theory. The lower arrows (black) at the bottom of Fig. 1 show the TO frequencies obtained from our fit at 5 K. The upper arrows (green) indicate the values calculated in Ref. Hermet, . For most modes, the agreement is excellent (better than 5 %). Modes and , however, are found at frequencies 20–30% smaller than the calculated values. Conversingly, mode is found at an energy 8 % higher than the theoretical value. Compared to the data reported by Kamba et al. in a ceramic material Kamba , our obtained frequencies are slightly upshifted, but the most important result concerns the modes assignment, once we only agree in the case of five modes, E(1), E(4), E(6), E(7) and E(9). The use of polarized light allowed us to correctly assign the other modes.
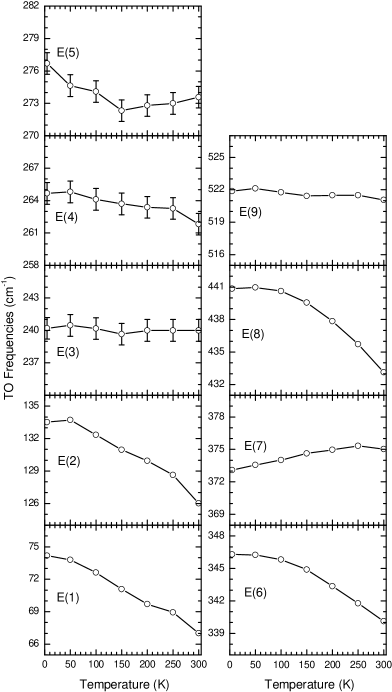
Figure 2 shows the temperature evolution of the TO frequencies for the 9 phonon modes. The mode softens strongly from 5 K to room temperature. High temperature infrared Kamba and Raman Haumont ; Fukumura measurements indicate that this mode continues to soften but instead of smoothly decreasing to zero frequency it drops rather abruptly at the transition. Modes , and show the same behavior as mode . Interestingly, mode hardens with increasing temperature. The frequencies of the remaining modes have little or no temperature dependence. According to the calculated phonon frequencies Hermet , and are related to vibrations involving the Bi atoms. and should be dominated by oxygen motion. Because of their softening, it is reasonable to think that these modes also involve motion of Bi atoms. Concerning E(7) — also dominated by oxygen motion — its hardening with increasing temperature shows that this mode has a particular dependence on the structural evolution, i.e., it is more sensitive to the decreasing rhombohedral elastic distortion than to the unit cell volume expansion, upon heating.
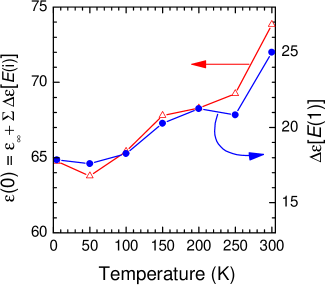
More insight on the mode can be obtained from an analysis of its oscillator strength. One can calculate the dielectric constant from the optical contributions as
| (2) |
This calculation, for our results, is shown as open triangles in Fig. 3. Our values are twice the values obtained by Kamba et al. Kamba . This is a consequence of the higher reflectivity and absence of microstructure (porosity, grain boundaries) in our sample. The values in Fig. 3 are a bit smaller (10 %) than those obtained by dielectric measurements at 1 GHz on ceramics solid solutions of BiFeO3 with Pb(Ti,Zr)O3 Smith . We also plotted in this figure the temperature dependence of the mode oscillator strength (solid circles). It becomes clear that the temperature increase in is explained by the softening of the mode alone. Indeed the f-sum rule states that the sum of plasma frequencies squared () should be a constant independent of temperature Wooten . An even more stringent condition is that, in the absence of phonon coupling, each individual plasma frequency should remain constant. Indeed, within , the plasma frequency for the mode respects this condition. Therefore, the softening of the phonon induces an increase in its oscillator strength which can fully account for the increase in the dielectric constant. This is a strong indication that this phonon participates actively as the soft mode driving the ferroelectric transition. As this mode dies sharply at the Curie temperature instead of vanishing smoothly Haumont ; Kamba , it was first considered that the transition was not soft-mode driven Haumont . This picture was later revised to propose that the transition was displacive and did have a soft mode which incomplete softening could be a sign of a first order transtion Kamba ; Hermet . Figure 3, gives a strong support for this latter proposition.
An important point arises when we look at the theoretically obtained oscillator strengths and our experimentally determined values. Hermet et al. Hermet calculated the phonons TO and longitudinal optical (LO) frequencies and found and for mode and and for mode . We can use the TO-LO splitting to calculate each mode oscillator strength Gervais . The TO-LO splittings calculated by Hermet et al., yields theoretical oscillator strengths of and . This is strikingly different from the values we determined experimentally (see Table 1). We find that the oscillator strengths for the and modes are of the same order of magnitude and, more important, the oscillator strenght of mode is large enough (by a factor 10 with respect to the calculation) to drive the changes in the dielectric constant. Our results, opposite to Hermet et al. and in agreement with Kamba et al., show that the mode is the soft mode in BiFeO3.
Although we cannot measure directly the c-axis response we can choose a polarization direction in our measurement crystal face that minimizes the ab-plane contribution. We can thus infer the phonon locations along the c-axis.
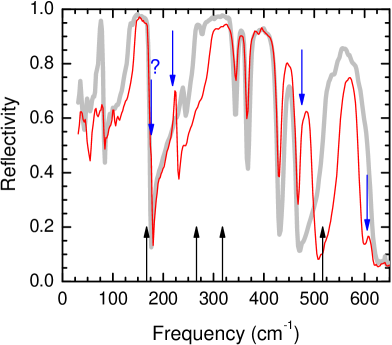
In Fig. 4 we compare the ab-plane response (thick gray line) to the mixed spectrum (thin red line) obtained at 5 K, temperature at which the phonons are sharp and well defined. There are three phonon modes that are very clearly present in the mixed response and absent from the ab-plane spectrum. They are indicated by the down pointing arrows. The forth mode is very likely appearing as a broader shoulder just above the mode () indicated by the arrow with a question mark. We assign these features to the 4 modes. The upward pointing arrows at the bottom of the figure indicate the frequencies for the modes calculated from first principles Hermet . The first two phonons found in our spectra (180 and 215) agree relatively well with the predicted values. However, the phonon expected around 320 is found closer to 475. The phonon expected at 520 appears above 600. The disagreement for the latter phonon can be understood in terms of the strong phonon contamination in our mixed response spectra. Because of this large mode, the mode may appear as a dip at its LO frequency, rather than a peak close the TO energy. The calculated LO frequency for the mode is , closer to our finding but still a poorer agreement than the first two modes. We also remark that the assignment of the and modes differ substantially from previous propositions Haumont ; Kamba , although agrees with recent Raman results Cazayous .
We measured the low temperature polarized infrared response of a BiFeO3 single crystal. We determined clearly all the ab-plane phonon parameters. Our findings agree very well with calculated phonon frequencies and solve the phonon symmetry assignment issues. The c-axis phonons could not be completely determined from our crystal geometry but their frequencies are inferred from a mixed polarization measurement. We show that the softening of the phonon explains completely the temperature dependence of the dielectric constant. Our results are a clear evidence that the phonon is undoubtedly the soft mode driving the ferroelectric transition.
Acknowledgements.
This work was partially supported by the MIIAT proposal “Matériaux à Propriétés Remarquables”. RLM acknowledges support from the Brazilian agencies CNPq and FAPEMIG. During this work RLM was an invited professor at ESPCI on a “Chaire Joliot” appointment.References
- (1) P. Curie, J. Phys. 3, 393 (1894).
- (2) A.J. Freeman and H. Schmid, Magnetoelectric Interaction Phenomena in Crystals, Gordon and Breach, London (1975).
- (3) R.T. Smith, G.D. Archenbach, R. Gerson, and W.J. James, J. Appl. Phys 39, 70 (1968).
- (4) J.M. Moreau, C. Michel, R. Gerson, and W.J. James, J. Phys. Chem. Solids 32, 1315 (1971).
- (5) D. Lebeugle and D. Colson, X-ray diffraction and DSC measurements (unpublished).
- (6) Z.J. Huang, Y. Cao, Y.Y. Sun, Y.Y. Xue, and C.W. Chu, Phys. Rev. B 56, 2623 (1997).
- (7) T. Katsufuji, S. Mori, M. Masaki, Y. Moritomo, N. Yamamoto, and H. Takagi, Phys. Rev. B 64, 104419 (2001).
- (8) T. Kimura, S. Kawamoto, I. Yamada, M. Azuma, M. Takano, and Y. Tokura, Phys. Rev. B 67, 180401(R) (2003).
- (9) T. Zhao, A. Scholl, F. Zavaliche, K. Lee, M. Barry, A. Doran, M.P. Cruz, Y.H. Chu, C. Edereer, N.A. Spaldin, R.R. Das, D.M. Kim, S.H. Baek, C.B. Eom, and R. Ramesh, Nature Mat. 5, 823 (2006).
- (10) A.B. Souchkov, J.R. Simpson, M. Quijada, H. Ishibashi, N. Hur, J.S. Ahn, S.W. Cheong, A.J. Millis, and H.D. Drew, Phys. Rev. Lett. 91, 027203 (2003).
- (11) A.P. Litvinchuk, M.N. iliev, V.N. Popov, and M.M. Gospodinov, J. Phys.: Condens. Matter 16, 809 (2004).
- (12) R. Haumont, J. Kreisel, P. Bouvier, and F. Hippert, Phys. Rev. B 73, 132101 (2006).
- (13) H. Fukumura, H. Harima, K. Kisoda, M. Tamada, Y. Noguchi, and M. Miyayama, J. Magn. Magn. Mater 310 e367 (2007).
- (14) M. Cazayous, D. Malka, D. Lebeugle, and D. Colson, Appl. Phys. Lett. 91, 071910 (2007).
- (15) W. Kaczmarek and A. Granja, Solid State Commun. 17, 851 (1975).
- (16) S. Kamba, D. Nuzhnyy, M. Savinov, J. Sebek, J. Petzelt, J. Prokleska, R. Haumont, and J. Kreisel, Phys. Rev. B 75, 024403 (2007).
- (17) D. Lebeugle, D. Colson, A. Forget, M. Viret, P. Bonville, J.F. Marucco, and S. Fusil, Phys. Rev. B 76, 024116 (2007).
- (18) D. Lebeugle, D. Colson, A. Forget, and M. Viret, Appl. Phys. Lett. 91, 022907 (2007).
- (19) C.C. Homes, M. Reedyk, D. A. Cradles, and T. Timusk, Appl. Optics 32, 2976 (1993).
- (20) P. Hermet, M. Goffinet, J. Kreisel, and P. Ghosez, Phys. Rev. B 75, 220102(R) (2007).
- (21) F. Wooten, Optical Properties of Solids, Academic Press, New York (1972).
- (22) F. Gervais, J.L. Servoin, A. Baratoff, J.G. Bednorz, and G. Binnig, Phys. Rev. B 47, 8187 (1993).