A Morphological and Statistical Analysis of Ansae in Barred Galaxies
Abstract
Many barred galaxies show a set of symmetric enhancements at the ends of the stellar bar, called ansae, or the “handles” of the bar. The ansa bars have been in the literature for some decades, but their origin has still not been specifically addressed, although, they could be related to the growth process of bars. But even though ansae have been known for a long time, no statistical analysis of their relative frequency of occurrence has been performed yet. Similarly, there has been no study of the varieties in morphology of ansae even though significant morphological variations are known to characterise the features. In this paper, we make a quantitative analysis of the occurrence of ansae in barred galaxies, making use of The de Vaucouleurs Atlas of Galaxies by Buta and coworkers. We find that of SB0’s show ansae in their bars, thus confirming that ansae are common features in barred lenticulars. The ansa frequency decreases dramatically with later types, and hardly any ansae are found in galaxies of type Sb or later. The bars in galaxies with ansae are stronger in the median than those in galaxies without ansae, but the presence of inner and outer rings is not related to the presence of ansae. Implications of these results and theories for the possible origin of ansae are discussed briefly.
1 Introduction
Bars in disk galaxies are both common and long-lived. Studies based on optical images have established that about of all disk galaxies are strongly barred, and an additional are moderately barred (e.g., Sandage 1961, Sellwood & Wilkinson 1993). When using near-infrared (NIR) imaging, which is more sensitive to the older stellar populations that predominate in bars, the fraction of barred galaxies rises to close to of local disk galaxies (Knapen, Shlosman & Peletier 2000; Eskridge et al. 2000; Grosbøl et al. 2002; Marinova & Jogee 2006; Menéndez-Delmestre et al.2007). From studies of images obtained with the Hubble Space Telescope, it has recently been determined that the fraction of strong bars remains essentially unchanged from intermediate redshifts, of , to the present day (e.g., Sheth et al. 2003; Jogee et al. 2004; Elmegreen et al. 2004; Zheng et al.2005). This agrees with numerical simulations, which show that bars are indeed long-lived phenomena (e.g., Debattista & Sellwood 2000; Athanassoula & Misiriotis 2002; Valenzuela & Klypin 2003; Shen & Sellwood 2004; Debattista et al. 2004; Martinez-Valpuesta, Shlosman & Heller 2006).
An early approach to the shapes of stellar bars considered them, in principle, to be ellipsoidal features in disk galaxies. Consequently, the isodensity contours of bars have traditionally been fitted with ellipses. Parameters to account for the boxiness of observed stellar bars were later introduced by Nieto & Bender (1990), who considered the elliptical fits unsatisfactory. The departure of bar shapes from strictly elliptical has also been noticed in numerical simulations (e.g., Sparke & Sellwood 1987). An improved method, based on generalised ellipses, has been tested successfully and applied to both numerical and observed bars (Athanassoula et al. 1990).
The existence of an important diversity in the shapes and structure of observed and simulated bars is widely acknowledged today (Ohta, Hamabe & Wakamatsu 1990; Regan & Elmegreen 1997; Aguerri, Beckman & Prieto 1998, 2000; Odewahn et al. 2002). The deviations from pure elliptical shapes vary from mild (and generally weak) oval distortions dominated mainly by the =2 Fourier term to highly elongated and rectangular bars (which are generally stronger) showing significant higher order terms. Not all the morphological features in observed barred galaxies are, however, easy to identify and classify. We are specifically interested here in the outer regions of stellar bars, which give rise to their pronounced shapes. This is the region where stellar bars in spirals connect to the spiral arms. Physically, this region could lie between the inner 4:1 ultraharmonic resonance (UHR) and the corotation resonance (CR) radius of the bar (e.g., Aguerri, Debattista & Corsini 2003, and references therein) . Various families of exotic orbits are found here, which are frequently unstable, and so their actual particle population is unknown. Different features, such as the ansae we concentrate on here, frequently appear in this region.
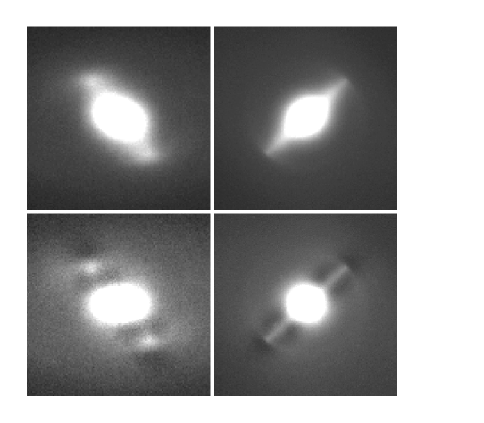
Ansae can be described as a pair of density enhancements at the ends of the bar (Fig. 1, Fig. 2, Fig. 3), sometimes also referred to as “condensations” in older work (e.g., Danby 1965) or symmetric density knots. A more scientific definition could be, a local maximun before the end of the bar along its main axis absent on its minor axis. Ansae have been known in the literature for decades, and they appear to be rather frequent in early-type disk galaxies (e.g., NGC 4262, NGC 2859 and NGC 2950; Sandage 1961; Athanasoula 1984). No statistical information on the prevalence of ansae has ever been published, a situation we aim to remedy with this short paper. Ansae were discussed by Danby (1965) in the context of an “outflow” from the bar into the associated spiral arms. In -body numerical simulations, ansae are seen on both ends of a bar as characteristic density enhancements in face-on or edge-on disks (Martinez-Valpuesta, Shlosman & Heller 2006). Athanassoula (2001) related the appearance of ansae to initial conditions in the models (e.g., the halo-to-disk mass ratio). In general, ansae in simulated galaxies appear after some Gyrs of evolution. The dynamical significance of ansae remains unclear. Are they regions of trapped disk or bar particles? Do they reflect any underlying dynamics? Do they appear in a particular stage of the bar evolution? We will try to answer these questions in a future paper based on numerical simulations (I. Martinez-Valpuesta et al. 2007, in preparation, hereafter Paper II), but first we need to stablish how frequent ansae are and in which host galaxies they occur.
In this paper, we derive some statistics of barred galaxies with ansae. We present the statistics in Section 2, discuss observed characteristics of ansae and their host galaxies in Section 3, and discuss our results in the context of bar dynamics and evolution in Section 4, before summarising our conclusions in Section 5. Ansae will be considered from a dynamical point of view by means of simulations in Paper II.
2 Observational data and Statistics
Our primary data source is The de Vaucouleurs Atlas of Galaxies (Buta, Corwin & Odewahn 2007; hereafter called the Atlas), from which we select all the barred galaxies, as classified in the Atlas. We assume that the sample of galaxies collected in the Atlas is random in the sense that the presence or absence of ansae did not influence the selection process of galaxies in the catalogue. Based on the detailed description for each galaxy as given in the Atlas, we then separated all galaxies with and without ansae, and collected the statistics as a function of morphological type. The results of this exercise are shown in Table 1.
As a consistency check, we also use the detailed study of 26 early-type barred galaxies by Buta et al. (2006), who study the bar strengths, bulges, disks, and bar parameters in a statistically well-defined sample of S0-Sa galaxies. Most important for our present paper, the authors also list whether a galaxy has ansae, as based on deep NIR images.
We estimate the uncertainties in all our derived fractions by using Poisson statistics(see Laine et al. 2002).
In Table 1 we show the results of the analysis of the sample of barred galaxies described in the Atlas. This sample consists of barred galaxies, of which just are of ansa type (). There is, however, a very strong dependence of the ansa fraction on morphological type, and of ansae galaxies occur in the galaxies of type Sab or earlier (). Even within this group of early-type galaxies we see that the highest fraction of ansae occurs in S0 galaxies, with out of (). And among the lenticular galaxies, ansae are especially prevalent among those classified as ’SB’, or strongly barred, with of the SB0’s having ansae. Only five of the Sab galaxies (), three of the Sb, one of the Sbc galaxies, and none of the barred galaxies in the Atlas with later morphological types have ansae.
In Table 2, we show the statistics for the much smaller sample from Buta et al.(2006), which we use as a consistency check of the presumably unbiased sample selection in the Atlas. Buta et al. (2006) find that ten of the barred S0-Sa galaxies in their sample have ansae (). When considering the ansa fraction in SB and in SAB bars, we see that (six out of 14) of the bars in the SB0 galaxies and (one out of five) of those in the SAB0’s have ansae. Considering galaxies of types SB and SAB combined, we find that of the barred S0 and of the barred Sa galaxies have ansae. Within the large uncertainties, these results are entirely consistent with those derived, above, for the Atlas galaxies, thus confirming the validity of the use of the Atlas for our purpose.
The histogram presented in Fig. 4 shows the main conclusion we reach on the basis of the analysis described above, namely that ansae are very common among barred lenticulars, but that their fraction decreases very rapidly with morphological type. Ansae hardly occur at all in galaxies of type Sb or later. We have carefully reviewed the images of the Atlas and still no late-types galaxies present ansae. We can conclude that the missing fraction of ansae in late-types is real.
| Type | Total | Ansae | No ansae | Ansa fraction |
|---|---|---|---|---|
| SB0 | ||||
| SAB0 | ||||
| SBa | ||||
| SABa | ||||
| SBab | ||||
| SABab | ||||
| SBb | ||||
| SABb | ||||
| SBbc | ||||
| SABbc | ||||
| SBc | ||||
| SABc | ||||
| SBcd | ||||
| SABcd | ||||
| SBd | ||||
| SABd | ||||
| SBdm, | ||||
| IBm | ||||
| SABdm, | ||||
| Im | ||||
| S0 | ||||
| Sa | ||||
| Sab | ||||
| Sb | ||||
| Sbc | ||||
| Sc | ||||
| Scd | ||||
| Sd | ||||
| Sdm, Im | ||||
| Total |
| Type | Total | Ansae | No Ansae | Ansa fraction |
|---|---|---|---|---|
| SB0 | ||||
| SAB0 | ||||
| SBa | ||||
| SABa | ||||
| SBab | ||||
| SABab | ||||
| S0 | ||||
| Sa | ||||
| Total |

3 Characteristics of bars with ansae
Having established that ansae preferentially occur in barred lenticular and Sa galaxies and, in the case of the former where the number statistics are best, more in bars of SB type than in those of SAB type, in this Section we will explore relations with the strength of the bar and with the presence of rings in the host galaxies, and describe further characteristics of the ansa regions.
3.1 Bar strength
The strength of bars can be measured by deriving the gravitational bar torque, indicated by the parameter (Sanders & Tubbs 1980; Combes & Sanders 1981; Buta & Block 2001; Laurikainen et al. 2004). This parameter describes the maximum gravitational bar torque per unit mass per unit square of the circular speed as inferred from near-IR images under the assumption of a constant mass-to-light ratio. In intermediate to late-type spirals it is essential to correct the total non axisymmetric strength for spiral arm torques in order to derive , while for early-type galaxies one can set (Buta et al. 2005). can be affected by the strong axisymmetric background in early-type barred galaxies, and may be significantly diluted by a bulge or inner disk component.
Buta et al. (2006) list for all the 26 galaxies in their sample, as derived from 2.15m -band images (no sufficient measurements are available in the literature to perform a similar analysis for all the galaxies in the Atlas sample). The median value of for the early-type barred galaxies with ansae is (), compared to a median of () for those without ansae. We have performed the Kolmogorov-Smirnov test, and the difference between ansaed barred galaxies and the non ansaed barred galaxies is statistically significant with . The ansa bars are thus stronger than non-ansa bars, in the median.
3.2 Rings
We have also studied the ansae in relation to the occurrence of inner and outer rings in their host galaxies. Based on the morphological classification of each galaxy, we collected the statistics for the early-type galaxies (SB0,SB0/a,SAB0,SAB0/a, where we find the ansae) in both of our samples. We find similar fractions of ringed galaxies among those that host ansae and those that do not. This indicates that the ansae are related purely to the bar, and presumably to its strength (see above), and that the mechanism producing the ansae is unrelated to the mechanism producing the inner or outer rings. So although both ansae and rings (see the review by Buta & Combes 1996) are intimately related to the bars of the galaxies that host them, our findings show that the two phenomena are not related among them. Ansae and rings trace different consequences of bar evolution and dynamics, which can coincide in some galaxies.
3.3 Properties of ansae regions
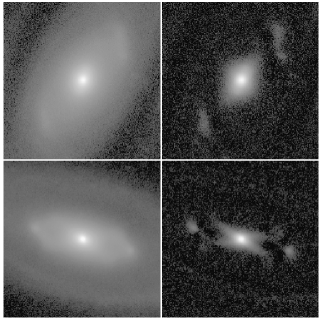
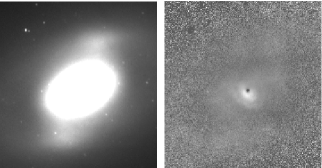
By carefully looking at the data of our galaxy sample, we are able to give an overview of the characteristics of ansae. In Fig. 3, we present examples of different barred galaxies showing clear density enhancements at the end of the bar, using in some cases the technique of unsharp-masking (low pass filtering) to make the features more obvious. The standard examples of ansae are represented by Figs. 2. Figure 1 shows a non-ansae (regular) bar (NGC 4643) for comparison with a typical ansae bar (NGC 936) to highlight that a real distinction is present. Figure 3 shows two special cases that are not necessarily unique but which are clearly unusual. In addition to two round ansae, NGC 7020 has an X-shaped feature in its unsharp-masked image, while NGC 7098 shows two elongated ansae with a clear wavy appearance.
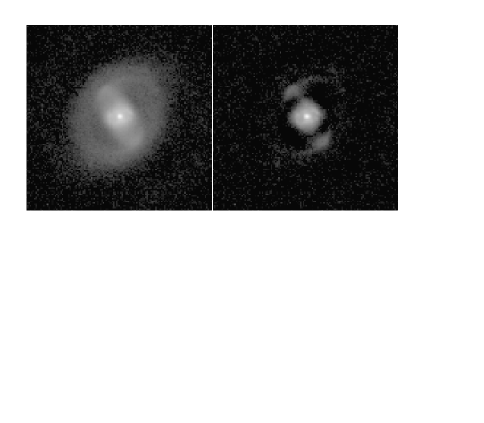
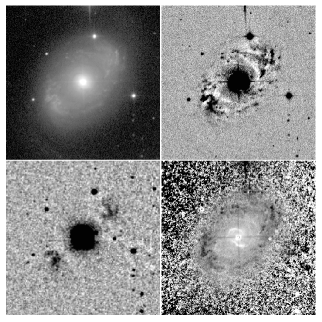
An interesting characteristic of ansae is that the majority of our galaxies do not present signs of star formation in these regions (Buta et al 2007). In colour index maps such as those shown in the Atlas, ansae typically show no colour enhancement, indicating they must be largely stellar dynamical phenomena (e.g., NGC 2787, Fig. 5). The only exception we know of is the well-known Seyfert 1 galaxy NGC 4151 (Fig. 6), where the ansae appear in blue light to be collections of star-forming regions. The -band image of NGC 4151 also shows a significant stellar component to its ansae. Both the - and -band unsharp-masked images show the associated groups of star-forming regions, but the ansae themselves do not stand out strongly in the colour index map. Instead, this map suggests that the star formation is related to an elliptical inner ring where the HII regions concentrate around the bar ends (Crocker, Baugus, and Buta 1996).
4 Discussion
Danby (1965) published the first explanation of ansae, namely as an outflow from the bar into the spirals. Since Danby’s paper, hardly any work has been published on this kind of bar feature. In recent years, simulations have clearly shown ansae in modeled barred galaxies (Athanassoula 2001; Athanassoula Misiriotis 2002; Martinez-Valpuesta et al.2006; Martinez-Valpuesta 2006, especially her Fig. 5.3).
Unlike in any kind of observations, in numerical simulations the position and velocity of a single particle can be traced at different times. This technique allows the modeller to visualise the stellar orbit of a particle which is currently located in the ansae region, leading to an insight into where it comes from and where it will go. Martinez-Valpuesta (2006) found that particles get trapped in the region of the ansae, but, later on, continue to form part of the bar. A more detailed study of these orbits and the implications will be presented in Paper II. There, we will give a statistical analysis of the ansa region and quantify the amount of particles (and hence the stellar mass) that populate the ansa region.
Above, we have seen that ansae appear mainly in lenticulars, exclusively in early-type galaxies and not at all in the later types. This dependence on morphological type will be explored in more detail in Paper II. The observational results, as outlined above, also show that the bar strength, as measured through the gravitational bar torque, is higher in the median for ansa bars than for non-ansa bars.
The fact that ansae are preferentially found in strongly barred early-type galaxies is reproduced in the simulations (Paper II), and the inference drawn there is that ansae are present when the bar is both strong and growing. In paper II, we will attempt to present a theoretical and numerical explanation of the ansae. The use of hundreds of simulation runs allows us, firstly, to produce statistics on the bars and the ranges of model parameters which lead to the occurrence of ansae. Secondly, we will perform a study of the dynamics of the stellar orbits in the ansa region, yielding statistical information on the amount of particles (tracing the mass) that is trapped in the ansae at any given moment, or that passes through the ansae before becoming part of the bar.
Debattista & Sellwood (2000) and later, Athanassoula & Misiriotis (2002) showed that bars formed in galaxies with more concentrated halos are stronger than those that formed in less concentrated ones. This was explained by Athanassoula (2003), who showed that a more concentrated halo has more mass at the relative resonances (particularly CR) and thus leads to more angular momentum exchange within the galaxy, and thus to a stronger bar. If we extrapolate this, we could state that the galaxies presenting ansae are those that are in the process of secular evolution due to the dynamics of the bar. It would be worthwhile to investigate this proposition further observationally, for instance by analysing the relative contributions of disk and bulge components in the inner parts of radial surface brightness profiles. This is beyond the scope of the present paper.
5 Conclusions
We have assessed the frequency of occurrence of ansae, or the “handles” of the bar, in barred galaxies of various morphological types. Although such ansae have been described in the literature for decades, there is as yet no information at all on how common they are. We base our analysis on classifications given by Buta et al. (2006) for a sample of 26 early-type barred galaxies, and in the Atlas for a much larger sample of 267 barred galaxies, but of all types.
Our main conclusion is that ansae never occur in late-type galaxies (types Sc or later) and only very rarely in intermediate (Sab-Sbc) types, but that they are very much concentrated in early-type galaxies. The highest fraction of ansae is found in strongly barred lenticulars, with of SB0 galaxies showing ansae. The overall fraction among S0 and Sa galaxies is around a third.
We also find that the median bar strength, as based on literature measurements of the gravitational bar torque, is significantly higher among barred galaxies with ansae than among those without. The fraction of inner and outer rings among ansa and non-ansa bars is not different, so although both ansae and rings are related to bars they are not related through the same mechanism.
We conclude that ansae are common in early-type, but absent from late-type barred galaxies, and tend to occur in galaxies with strong bars. In our subsequent Paper II, we will explore the origin and properties of ansae, and relate them to the evolution of the host galaxy and bar through numerical simulations.
Acknowledgements
We thank Drs. H. Salo and E. Laurikainen for the use of their multicomponent decomposition code. We thank E. Athanassoula for comments on an earlier version of this manuscript. This work has been partially supported by the Peter Gruber Foundation Fellowship. RB acknowledges the support of NSF grant AST050-7140. Funding for the creation and distribution of the SDSS Archive has been provided by the Alfred P. Sloan Foundation, the Participating Institutions, NASA, NSF, the U.S. Department of Energy, the Japanese Monbukagakusho, and Max Planck Society.
References
- (1) Athanassoula, E. 1984, Phys. Rep., 114, 321
- (2) Athanassoula, E. 2001, New Horizons of Computational Science, (Eds.) T. Ebisuzaki & J. Makino (Dordrecht: Kluwer Acad. Publ.), 69
- (3) Aguerri, J. A. L., Debattista, V. P., & Corsini, E. M. 2003, MNRAS, 338, 465
- (4) Aguerri, J. A. L., Beckman, J. E., & Prieto, M. 1998, AJ, 116, 2136
- (5) Aguerri, J. A. L., Muñoz-Tuñon, C., Varela, A. M., & Prieto, M. 2000, A&A, 361, 841
- (6) Athanassoula, E. 2003, MNRAS, 341, 1179
- Athanassoula & Misiriotis (2002) Athanassoula, E., & Misiriotis, A. 2002, MNRAS, 330, 35
- (8) Athanassoula, E., Morin, S., Wozniak, H., Pierce, M. J. et al, 1990, MNRAS, 245, 130
- (9) Buta, R. 1995, ApJS, 96, 39
- (10) Buta, R., & Crocker, D. A. 1991, AJ, 102, 1715
- (11) Buta, R., & Combes, F., 1996, Fundamentals of Cosmic Physics, 17, 95
- (12) Buta, R., & Block, D. L., 2001, ApJ, 550,243
- (13) Buta, R., Crocker, D. A., & Byrd, G. 1999, AJ, 118, 2071
- (14) Buta, R., Corwin, H., & Odewahn, S. 2007, The de Vaucouleurs Atlas of Galaxies (Cambridge: Cambridge University Press), in press (the Atlas)
- Buta et al. (2006) Buta, R., Laurikainen, E., Salo, H., Block, D. L., & Knapen, J. H. 2006, AJ, 132, 1859
- (16) Combes, F., & Sanders, R. H., 1981, A&A, 96, 164
- (17) Crocker, D. A., Baugus, P. D., & Buta, R. 1996, ApJS, 105, 353
- (18) Danby, J. M. A. 1965, AJ, 70, 501
- (19) Debattista, V. P., & Sellwood, J. A. 2000, ApJ, 543, 704
- (20) Debattista, V., Carollo, C. M.; Mayer, L, & Moore, B. 2004, ApJ, 604, L93
- (21) Elmegreen, B. G., Elmegreen, D. M., & Hirst, A. C. 2004, ApJ, 612, 191
- (22) Eskridge, P.B., Frogel, J.A., Pogee, R.W., Quillen, A.C., et al. 2000, AJ, 119, 536
- (23) Eskridge, P. B., et al. 2002, ApJS, 143, 73
- (24) Grosbøl, P., Pompei, E., & Patsis, P. A. 2002, ASP Conf. Ser. 275: Disks of Galaxies: Kinematics, Dynamics and Perturbations, 305
- (25) Jogee, S., Barazza, F.D., Rix, H.W., Shlosman, I. et al., 2004, ApJ, 615, L105
- (26) Knapen, J.H., Shlosman, I., & Peletier, R.F. 2000, ApJ, 529, 93
- (27) Laine, S., Shlosman, I., Knapen, J.H., & Peletier, R.F. 2002 ApJ, 567, 97
- (28) Laurikainen, E., Salo, H., & Buta, R. 2005, MNRAS, 362, 1319
- (29) Laurikainen, E., Salo, H., Buta, R., & Vasylyev, S. 2004, MNRAS, 355, 1251
- (30) Marinova, I., & Jogee, S. 2006, ApJ accepted
- (31) Menéndez-Delmestre, K., Sheth, K., Schinnerer, E., Jarrett, T. H., & Scoville, N. Z. 2007, ApJ, 657, 790
- (32) Martinez-Valpuesta, I. PhD Thesis, 2006
- (33) Martinez-Valpuesta, I., Shlosman, I., & Heller, C. 2006, ApJ, 637, 214
- (34) Martinez-Valpuesta, I., et al. 2007, in preparation (Paper II)
- (35) Nieto, J. L., & Bender, R. 1990, A&A, 215, 266
- (36) Odewahn, S. C., Cohen, S. H., Windhorst, R. A., & Philip, N. S. 2002, ApJ, 568, 539
- (37) Ohta, K., Hamabe, M. & Wakamatsu, K. 1990, ApJ, 357, 71
- (38) Regan, M. W., & Elmegreen, D. M. 1997, AJ, 114, 965
- (39) Sandage, A. 1961, The Hubble Atlas of Galaxies (Washington, DC: Carnegie Inst.)
- (40) Sanders, R. H., & Tubbs, A. D., 1980, ApJ, 235, 803
- (41) Sellwood, J. A., & Wilkinson, A. 1993, Rep. Prog. Phys., 56, 173
- (42) Shen & Sellwood, J. A., 2004, ApJ, 604, 614
- (43) Sheth, K., Regan, M. W., Scoville, N. Z., & Strubbe, L. E. 2003, ApJ, 592, L13
- (44) Sparke, L. S., & Sellwood, J. A., 1987, MNRAS, 225, 653
- (45) Valenzuela, O., & Klypin, A. 2003, MNRAS, 345, 406
- (46) Zheng, X. Z., Hammer, F., Flores, H., Assémat, F., & Rawat, A. 2005, A&A, 435, 507