![[Uncaptioned image]](/html/0709.0451/assets/covers/SuperB_CDR_Front_Cover.png)
Super
A High-Luminosity
Heavy Flavour Factory
Conceptual Design Report
Presented to INFN
March, 2007
Available on the World Wide Web, with figures in full color, athttp://www.pi.infn.it/SuperB/?q=CDR
INFN/AE - 07/2, SLAC-R-856, LAL 07-15
March, 2007
Available from INFN Publishing Services, INFN-Pisa, L.go Pontecorvo, 3, I-56127 Pisa, Italy.
The people on the following list have indicated interest in and support for the Super project. It includes a subset who have been directly involved with the preparation of this document, as well as individuals who have contributed in other ways or plan on future involvement.
M. Bona
Laboratoire d’Annecy-le-Vieux de Physique des Particules,
Université de Savoie, IN2P3/CNRS, F-74941 Annecy-Le-Vieux, France
J. Garra Ticó, E. Graugés Pous
Universitat de Barcelona,
Facultat de Fisica, Departament ECM,
E-08028 Barcelona, Spain
P. Colangelo, F. De Fazio, A. Palano
Università di Bari,
Dipartimento di Fisica and INFN,
I-70126 Bari, Italy
M. Manghisoni, V. Re, G. Traversi
Università di Bergamo, Dipartimento di Ingegneria Industriale, I-24129 Bergamo, Italy
G. Eigen
University of Bergen, Institute of Physics, N-5007 Bergen, Norway
M. Venturini
Lawrence Berkeley National Laboratory, University of California, Berkeley, California 94720, USA
N. Soni
University of Birmingham, Birmingham, B15 2TT, United Kingdom
M. Bruschi, S. De Castro, P. Faccioli, A. Gabrielli, B. Giacobbe, N. Semprini Cesari, R. Spighi, M. Villa, A. Zoccoli
Università di Bologna, Dipartimento di Fisica and INFN, I-40127 Bologna, Italy
C. Hearty, J. McKenna
University of British Columbia, Vancouver, British Columbia, Canada V6T 1Z1
A. Soni
Brookhaven National Laboratory,
Department of Physics, Upton,
NY 11973-5000, USA
A. Khan
Brunel University, Uxbridge, Middlesex UB8 3PH, United Kingdom
A.Y. Barniakov, M.Y. Barniakov, V.E. Blinov, V.P. Druzhinin, V.B. Golubev, S.A. Kononov, I.A. Koop, E.A. Kravchenko, E.B. Levichev, S.A. Nikitin, A.P. Onuchin, P.A. Piminov, S.I. Serednyakov, D.N. Shatilov, Y.M. Shatunov, Y.I. Skovpen, E.P. Solodov
Budker Institute of Nuclear Physics, Novosibirsk 630090, Russia
C.-H. Cheng, B. Echenard, F. Fang, D.G. Hitlin, F.C. Porter
California Institute of Technology, Pasadena, California 91125, USA
D.M. Asner
Carleton University, Ottawa, Ontario, Canada K1S 5B6
T.N. Pham
Centre de Physique Théorique,
CNRS/MP, Ecole Politechnique,
F- 91128 Palaiseau, France
R. Fleischer, G.F. Giudice, T. Hurth, M. Mangano
CERN, TH-Division, CH-1211 Geneva 23, Switzerland
G. Mancinelli, B.T. Meadows, A.J. Schwartz, M.D. Sokoloff
University of Cincinnati, Cincinnati, Ohio 45221, USA
A. Soffer
Colorado State University, Fort Collins, Colorado 80523, USA
C.D. Beard
ASTeC, Daresbury Laboratory, Daresbury Warrington, Cheshire, WA4 4AD, United Kingdom
T. Haas, R. Mankel
DESY, D-22607 Hamburg, Germany
G. Hiller
Universität Dortmund, Institut für Physik, D-44221 Dortmund, Germany
P. Ball, M. Pappagallo, M.R. Pennington
Durham University, IPPP, Physics Department, Durham DH1 3LE, United Kingdom
W. Gradl, S. Playfer
University of Edinburgh, Edinburgh EH9 3JZ, United Kingdom
A. Abada, D. Becirevic, S. Descotes-Genon, O. Pène
Laboratoire de Physique Théorique, CNRS/MP Université Paris Sud, F-91405 Orsay, France
D. Andreotti, M. Andreotti, D. Bettoni, C. Bozzi, R. Calabrese, A. Cecchi, G. Cibinetto, P. Franchini, E. Luppi, M. Negrini, A. Petrella, L. Piemontese, E. Prencipe, V. Santoro, G. Stancari
Università di Ferrara, Dipartimento di Fisica and INFN, I-44100 Ferrara, Italy
F. Anulli, R. Baldini-Ferroli, M.E. Biagini, M. Boscolo, A. Calcaterra, A. Drago, G. Finocchiaro, S. Guiducci, G. Isidori, S. Pacetti, P. Patteri, I.M. Peruzzi, M. Piccolo, M.A. Preger, P. Raimondi, M. Rama, C. Vaccarezza, A. Zallo, M. Zobov, R. de Sangro
Laboratori Nazionali di Frascati dell’INFN, I-00044 Frascati, Italy
A. Buzzo, M. Lo Vetere, M. Macrí, M.R. Monge, S. Passaggio, C. Patrignani, E. Robutti, S. Tosi
Università di Genova, Dipartimento di Fisica and INFN, I-16146 Genova, Italy
J. Matias
IFAE, Universitat Autonoma de Barcelona, E-08193 Bellaterra, Barcelona, Spain
W. Panduro Vazquez
Imperial College London, London, SW7 2AZ, United Kingdom
F. Borzumati
International Centre for Theoretical Physics ICTP, I-34014 Trieste, Italy
V. Eyges, S.A. Prell
Iowa State University, Ames, Iowa 50011-3160, USA
T.K. Pedlar
Luther College, Department of Physics, Decorah, Iowa 52101, USA
S. Korpar, R. Pestotnik, M. Starič
J. Stefan Institute, SI-1000 Ljubljana, Slovenia
M. Neubert
Johannes Gutenberg-Universität, Institut für Physik (ThEP), D-55099 Mainz, Germany
A.G. Denig, U. Nierste
Karlsruhe Institut für Technologie (KIT), D-76131 Karlsruhe, Germany
T. Agoh, K. Ohmi, Y. Ohnishi
KEK, High Energy Accelerator Research Organization, 1-1 Oho, Tsukuba, Ibaraki 305-0801 Japan
J.R. Fry, C. Touramanis
University of Liverpool, Liverpool L69 7ZE, United Kingdom
A. Wolski
University of Liverpool, Liverpool L69 7ZE and Cockcroft Institute, Daresbury Science and Innovation Campus, Warrington, WA4 4AD, United Kingdom
B. Golob, P. Križan
University of Ljubljana and J. Stefan Institute, SI-1000 Ljubljana, Slovenia
H. Flaecher
University of London, Royal Holloway and Bedford New College, Egham, Surrey TW20 0EX, United Kingdom
A.J. Bevan, F. Di Lodovico, K.A. George
Queen Mary, University of London, London E1 4NS, United Kingdom
R. Barlow, G. Lafferty
University of Manchester, Manchester M13 9PL, United Kingdom
A. Jawahery, D.A. Roberts, G. Simi
University of Maryland, College Park, Maryland 20742, USA
P.M. Patel, S.H. Robertson
McGill University, Montréal, Québec, Canada H3A 2T8
A. Lazzaro, F. Palombo
Università di Milano, Dipartimento di Fisica and INFN, I-20133 Milano, Italy
A. Kaidalov
ITEP, Institute for Theoretical and Experimental Physics, RU-117218 Moscow, Russia
A.J. Buras, C. Tarantino
Technische Universität München, Physik Department, D-85748 Garching, Germany
G. Buchalla
Ludwig-Maximilians-Universität München, Arnold Sommerfeld Center for Theoretical Physics, D-80333 München, Germany
A.I. Sanda
Nagoya University, Department of Physics, Nagoya 464-8602, Japan
G. D’Ambrosio, G. Ricciardi
Università di Napoli Federico II, Dipartimento di Scienze Fisiche and INFN, I-80126, Napoli, Italy
I. Bigi, C.P. Jessop,
J.M. Losecco
University of Notre Dame, Notre Dame, Indiana 46556, USA
K. Honscheid
Ohio State University, Columbus, Ohio 43210, USA
N. Arnaud, R. Chehab, Y. Fedala, F. Polci, P. Roudeau, V. Sordini, V. Soskov, A. Stocchi, A. Variola, A. Vivoli, G. Wormser, F. Zomer
Laboratoire de l’Accélérateur Linéaire, Université Paris-Sud 11, IN2P3/CNRS, F-91898 Orsay, France
A. Bertolin, R. Brugnera, N. Gagliardi, A. Gaz, M. Margoni, M. Morandin, M. Posocco, M. Rotondo, F. Simonetto, R. Stroili
Università di Padova, Dipartimento di Fisica and INFN, I-35131 Padova, Italy
G.R. Bonneaud, V. Lombardo
Laboratoire Leprince-Ringuet,
CNRS/IN2P3, Ecole Polytechnique,
F-91128 Palaiseau, France
G. Calderini
Laboratoire de Physique Nucléaire et de Hautes Energies,
IN2P3/CNRS, Université Pierre et Marie Curie-Paris6, F-75252 Paris, France
and
Università di Pisa, Dipartimento di Fisica, and INFN, I-56127 Pisa, Italy
L. Ratti, V. Speziali
Università di Pavia, Dipartimento di Elettronica, I-27100 Pavia, Italy
M. Biasini, R. Covarelli, E. Manoni, L. Servoli
Università di Perugia, Dipartimento di Fisica and INFN, I-06123 Perugia, Italy
C. Angelini, G. Batignani, S. Bettarini, F. Bosi, M. Carpinelli, R. Cenci, A. Cervelli, M. Dell’Orso, F. Forti, P. Giannetti, M. Giorgi, A. Lusiani, G. Marchiori, M. Massa, M.A. Mazur, F. Morsani, N. Neri, E. Paoloni, F. Raffaelli, G. Rizzo, J. Walsh
Università di Pisa, Dipartimento di Fisica, Scuola Normale Superiore and INFN, I-56127 Pisa, Italy
V. Braun, A. Lenz
Universität Regensburg, Fakultät für Physik, D-93040 Regensburg, Germany
G.S. Adams, I.Z. Danko
Rensselaer Polytechnic Institute (RPI), Physics, Applied Physics & Astronomy Department, Troy, NY 12180, USA
E. Baracchini, F. Bellini, G. Cavoto, A. D’Orazio, D. Del Re, E. Di Marco, R. Faccini, F. Ferrarotto, M. Gaspero, P. Jackson, G. Martinelli, M.A. Mazzoni, S. Morganti, G. Piredda, F. Renga, L. Silvestrini, C. Voena
Università di Roma La Sapienza,
Dipartimento di Fisica and INFN,
I-00185 Roma, Italy
L. Catani, A. Di Ciaccio, R. Messi, E. Santovetti, A. Satta
Università di Roma Tor Vergata,
Dipartimento di Fisica and INFN,
I-00133 Roma, Italy
M. Ciuchini, V. Lubicz
Università di Roma Tre,
Dipartimento di Fisica and INFN,
I-00146 Roma, Italy
F.F. Wilson
Rutherford Appleton Laboratory, Chilton, Didcot, Oxon, OX11 0QX, United Kingdom
R. Godang
University of South Alabama, Department of Physics, Mobile, Alabama 36688 and University of Mississippi, University, Mississippi 38677, USA
X. Chen, H. Liu, W. Park, M. Purohit, A. Trivedi, R.M. White, J.R. Wilson
University of South Carolina, Columbia, South Carolina 29208, USA
M.T. Allen, D. Aston, R. Bartoldus, S.J. Brodsky, Y. Cai, J. Coleman, M.R. Convery, S. DeBarger, J.C. Dingfelder, G.P. Dubois-Felsmann, S. Ecklund, A.S. Fisher, G. Haller, S.A. Heifets, J. Kaminski, M.H. Kelsey, M.L. Kocian, D.W.G.S. Leith, N. Li, S. Luitz, V. Luth, D. MacFarlane, R. Messner, D.R. Muller, Y. Nosochkov, A. Novokhatski, M. Pivi, B.N. Ratcliff, A. Roodman, J. Schwiening, J. Seeman, A. Snyder, M. Sullivan, J. Va’Vra, U. Wienands, W. Wisniewski
Stanford Linear Accelerator Center, Stanford, California 94309, USA
H. Stoeck
University of Sydney, School of Physics, Sydney, NSW 2006, Australia
H.-Y. Cheng, H.-N. Li
Academia Sinica, Institute of Physics, Nankang, Taipei Taiwan 11529, Republic of China (R.O.C.)
Y.-Y. Keum
National Taiwan University, Department of Physics, Taipei Taiwan 10617, Republic of China (R.O.C.)
M. Gronau, Y. Grossman
Technion - Israel Institute of Technology, Haifa 32000, Israel
F. Bianchi, D. Gamba, P. Gambino, F. Marchetto, E. Menichetti, R. Mussa, M. Pelliccioni
Università di Torino,
Dipartimento di Fisica Sperimentale and INFN,
I-10125 Torino, Italy
G.F. Dalla Betta
Università di Trento, ICT Department, I-38050 Trento, Italy
M. Bomben, L. Bosisio, C. Cartaro, L. Lanceri, L. Vitale
Università di Trieste, Dipartimento di Fisica and INFN, I-34127 Trieste, Italy
V. Azzolini, J. Bernabeu, N. Lopez-March, F. Martinez-Vidal, D.A. Milanes, A. Oyanguren, P. Paradisi, A. Pich, M.A. Sanchis-Lozano
IFIC, Universitat de Valencia-CSIC, E-46071 Valencia, Spain
R. Kowalewski, J.M. Roney
University of Victoria, Victoria, British Columbia, Canada V8W 3P6
J. Back, T.J. Gershon, P.F. Harrison, T.E. Latham, G.B. Mohanty
University of Warwick, Department of Physics, Coventry CV4 7AL, United Kingdom
A.A. Petrov
Wayne State University, Department of Physics and Astronomy, Detroit, Michigan 48202, USA
M. Pierini
University of Wisconsin, Madison, Wisconsin 53706, USA
Chapter 0 Introduction
Elementary particle physics in the next decade will be focused on the investigation of the origin of electroweak symmetry breaking and the search for extensions of the Standard Model (SM) at the TeV scale. The discovery of New Physics will likely produce a period of excitement and progress recalling the years following the discovery of the . In this new world, attention will be riveted on the detailed elucidation of new phenomena uncovered at the LHC; these discoveries will also provide strong motivation for the construction of the ILC. High statistics studies of heavy quarks and leptons will have a crucial role to play in this new world.
The two asymmetric Factories, PEP-II [1] and KEKB[2], and their companion detectors, BABAR [3] and Belle[4], have over the last seven years produced a wealth of flavour physics results, subjecting the quark and lepton sectors of the Standard Model to a series of stringent tests, all of which have been passed. With the much larger data sample made possible by a Super Factory, qualitatively new studies will be possible. These studies will provide a uniquely important source of information about the details of the New Physics uncovered at hadron colliders in the coming decade.
We thus believe that continued detailed studies of heavy quark and heavy lepton (henceforth heavy flavour) physics will not only be pertinent in the next decade; they will be central to understanding the flavour sector of New Physics phenomena. A Super Flavour Factory such as Super will, perforce, be a partner, together with LHC, and eventually, ILC, experiments, in ascertaining exactly what kind of New Physics has been found. The capabilities of Super in measuring -violating asymmetries in very rare and quark decays, accessing branching fractions of heavy quark and heavy lepton decays in processes that are either extremely rare or forbidden in the Standard Model, and making detailed investigations of complex kinematic distributions will provide unique and important constraints in, for example, ascertaining the type of supersymmetry breaking or the kind of extra dimension model behind the new phenomena that many expect to be manifest at the LHC.
This Super Conceptual Design Report is the founding document of a nascent international enterprise aimed at the construction of a very high luminosity asymmetric Flavour Factory. A possible location for Super is the campus of the University of Rome “Tor Vergata”, near the INFN National Laboratory of Frascati. This report has been prepared by an international study group set up by the President of INFN at the end of 2005, with the charge of studying the physics motivation and the feasibility of constructing a Super Flavour Factory that would come into operation in the first half of the next decade with a peak luminosity in excess of cm-2 s-1 at the resonance. This report is the response to that charge.
We discuss herein the exciting physics program that can be accomplished with a very large sample of heavy quark and heavy lepton decays produced in the very clean environment of an collider; a program complementary to that of an experiment such as LHC at a hadronic machine. It then presents the conceptual design of a new type of collider that produces a nearly two-order-of-magnitude increase in luminosity over the current generation of asymmetric Factories. The key idea is the use of low emittance beams produced in an accelerator lattice derived from the ILC Damping Ring Design, together with a new collision region, again with roots in the ILC final focus design, but with important new concepts developed in this design effort. Remarkably, Super produces this very large improvement in luminosity with circulating currents and wallplug power similar to those of the current Factories. There is clear synergy with ILC R&D; design efforts have already influenced one another, and many aspects of the ILC Damping Rings and Final Focus would be operationally tested at Super . Finally, the design of an appropriate detector, based on an upgrade of BABAR as an example, is discussed in some detail. A preliminary cost estimate is presented, as is an example construction timeline.
1 The Physics
By measuring mixing-dependent -violating asymmetries in the meson system for the first time, PEP-II/BABAR and KEKB/Belle have shown that the CKM phase accounts for all observed -violating phenomena in decays. The Unitarity Triangle construction provides a set of unique overconstrained precision tests of the self-consistency of the three generation Standard Model. Figure 2 shows the status of knowledge of the Unitarity Triangle in 1998, before the new series of tests made possible by the measurement of -violating asymmetries in decay at the Factories. Figure 2 shows the current status of the Unitarity Triangle construction, incorporating measurements from BABAR and Belle, as well as the mixing measurement of CDF; the addition of asymmetry measurements, together with the improvement in the precision of -conserving measurements, has made this uniquely precise set of Standard Model tests possible.
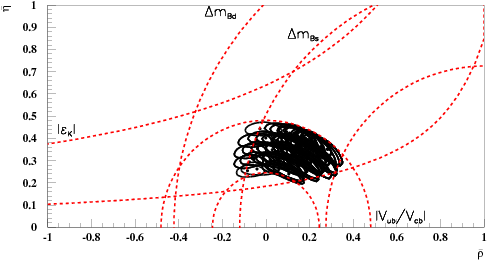
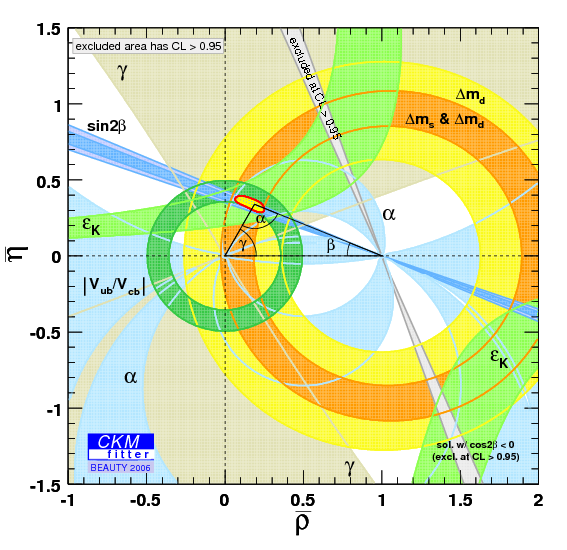
The fact that the CKM phase has now been shown to be consistent with all observed -violating phenomena is both a triumph and an opportunity. In completing the experimentally-verified Standard Model ansatz (except, of course, for the Higgs), it intensifies the mystery of the creation of the baryon-antibaryon asymmetry of the universe: the observed -violation is too small for the Standard Model to account for electroweak baryogenesis. This intriguing result opens the door to two possibilities: the matter antimatter asymmetry is produced by another mechanism, such as leptogenesis, or baryogenesis proceeds through the additional -violating phases that naturally arise in many extensions of the Standard Model. These extra phases produce measurable effects in the weak decays of heavy flavour particles. The detailed pattern of these effects, as well as of rare decay branching fractions and kinematic distributions, is, in fact, diagnostic of the characteristics of New Physics at or below the TeV scale,
By the end of this decade, the two Factories will have accumulated a total of ab-1. Even at this level, most important measurements pertinent to the Unitarity Triangle construction will still be statistics limited: an even larger data sample would provide increasingly stringent tests of three-generation CKM unitarity. There are two main thrusts here. The first is the substantial remaining improvement that can still be made in the Unitarity Triangle construction. Here measurements in , and decay play an important role, as do improvements in lattice QCD calculations of hadronic matrix elements. This important physics goal is NOT, however, the sole, or even the primary, motivation for a Super Factory. The precision of our knowledge of the Unitarity Triangle will perforce improve to the limit allowed by theoretical uncertainties as we pursue the primary goal: improving the precision of the measurement of asymmetries, rare decay branching fractions, and rare decay kinematic distributions in penguin-dominated transitions, to a level where there is substantial sensitivity to New Physics effects. This requires data samples substantially larger than the current Factories will provide. Some of these measurements are accessible at the LHC [9], but the most promising approach to this physics is Super , a very high luminosity asymmetric Factory, which is also, of course, a Super Flavour Factory, providing large samples of and quark and lepton decays.
Super , having an initial luminosity of cm-2s-1, will collect 15 ab-1 in a New Snowmass Year [10], or 75 ab-1 in five years. A data sample this large will make the Unitarity Triangle tests, in their manifold versions, the ultimate precision test of the flavour sector of the Standard Model, and open up the world of New Physics effects in very rare , , and decays
A primary tool for isolating new physics is the time-dependent asymmetry in decay channels that proceed through penguin diagrams, such as the processes and or similar transitions such as , , , , , and . The dominant contribution to these decays is the combination of CKM elements ; these amplitudes have the same phase as the charmonium channels , up to a small phase shift of with respect to . New heavy particles contribute new loop amplitudes, with new phases that can contribute to the asymmetry and the coefficient of the time-dependent analysis, so that the measured violation parameter could be substantially different from .
Physics beyond the Standard Model can affect rare decay modes, through observables such as branching fractions, -violating asymmetries and kinematic distributions. These decays do not typically occur at tree level, and thus their rates are strongly suppressed in the Standard Model. Substantial enhancements in the rates and/or variations in angular distributions of final state particles could result from the presence of new heavy particles in loop diagrams, resulting in clear evidence of New Physics. Moreover, because the pattern of observable effects is highly model-dependent, measurements of several rare decay modes can provide information regarding the source of the New Physics. An extended run at the is also contemplated; such a run would yield a wealth of interesting new decay results.
The Super data sample will also contain unprecedented numbers of charm quark and lepton decays. This data is also of great interest, both for its capacity to improve the precision of existing measurements and for its sensitivity to New Physics. This interest extends beyond weak decays; the detailed exploration of new charmonium states is also an important objective. Limits on rare decays, particularly lepton-flavour-violating decays, already provide important constraints on New Physics models. Super may have the sensitivity to actually observe such decays. The accelerator design will allow for longitudinal polarization of the beam, making possible uniquely sensitive searches for a electric dipole moment, as well as for -violating decays.
Some measurements in charm and physics are best done near threshold. Super also has the capability of running in the 4 region. Short runs at specific center-of-mass energies in this region, representing perhaps 10% of data taking time, would produce data samples substantially larger than those currently envisioned to exist in the next decade.
2 The Super Design
Given the strong physics motivation, there has been a great deal of activity over the past few years aimed at designing an Factory that can produce samples of mesons 50 to 100 times larger than will exist when the current Factory programs end. Several approaches were tried before the design presented here was developed.
Upgrades of PEP-II [11] and KEKB [12] to Super Factories that accomplish this goal have been proposed at SLAC and at KEK. These machines are extrapolations of the existing Factories, with higher currents, more bunches, and smaller functions (1.5 to 3 mm). They also use a great deal of power ( MW), and the high currents (as much as 10A) pose significant challenges for detectors. To minimize the substantial wallplug power, the SuperPEP-II design doubled the current RF frequency, to 958 MHz. In the case of SuperKEKB, a factor of two increase in luminosity is assumed for the use of crab crossing, which will soon be tested at KEKB.
SLAC has no current plans for an on-site accelerator-based high energy physics program, so the SuperPEP-II proposal is moribund. As of this writing, no decision has been made on SuperKEKB. In the interim, the problematic power consumption and background issues associated with the SLAC and KEK-based Super Factory designs stimulated a new approach, using low emittance beams, to constructing a Super Factory with a luminosity of , but with reduced power consumption [13].
We first turned to a colliding linac approach, but this proved to be a difficult design that also had high power consumption. We then developed the current concept, which has roots in ILC R&D: a very low emittance storage ring, based on the ILC damping ring minimum emittance growth lattice and final focus, that incorporates several novel accelerator concepts and appears capable of meeting all design criteria, while reducing the power consumption, which dominates the operating costs of the facility, to a level similar to that of the current Factories. Due to similarities in the design of the low emittance rings and the final focus, operation of Super can serve as a system test for these linear collider components
By utilizing concepts developed for the ILC damping rings and final focus in the design of the Super collider, it is possible to produce a two-order-of-magnitude increase in luminosity with beam currents that are comparable to those in the existing asymmetric Factories. Background rates and radiation levels associated with the circulating currents are comparable to current values; luminosity-related backgrounds such as those due to radiative Bhabhas, increase substantially. With careful design of the interaction region, including appropriate local shielding, and straightforward revisions of detector components, upgraded detectors based on BABAR or Belle are a good match to the machine environment: in this discussion, we use BABAR as a specific example. Required detector upgrades include: reduction of the radius of the beam pipe, allowing a first measurement of track position closer to the vertex and improving the vertex resolution (this allows the energy asymmetry of the collider to be reduced to 7 on 4 GeV); replacement of the drift chamber, as the current chamber will have exceeded its design lifetime; replacement of the endcap calorimeter, with faster crystals having a smaller Molière radius, since there is a large increase in Bhabha electrons in this region.
The Super design has been undertaken subject to two important constraints: 1) the lattice is closely related to the ILC Damping Ring lattice, and 2) as many PEP-II components as possible have been incorporated into the design. A large number of PEP-II components can, in fact, be reused: The majority of the HER and LER magnets, the magnet power supplies, the RF system, the digital feedback system, and many vacuum components. This will reduce the cost and engineering effort needed to bring the project to fruition.
The Super concept is a breakthrough in collider design. The invention of the “crabbed waist” final focus can, in fact, have impact even on the current generation of colliders. A test of the crabbed waist concept is planned to take place at Frascati in 2007; a positive result of this test would be an important milestone as the Super design progresses. The low emittance lattice, fundamental as well to the ILC damping ring design, allow high luminosity with modest power consumption and demands on the detector.
Super appears to be the most promising approach to producing the very high luminosity asymmetric Factory that is required to observe and explore the contributions of physics beyond the Standard Model to heavy quark and decays.
3 The Opportunity
There is substantial international interest in both the experimental and theoretical communities in studying heavy flavour physics with a very large data sample. This is reflected in the large number of Super Factory workshops that have been held by the PEP-II/BABAR and KEK /Belle groups, jointly and separately, as well as by workshops specifically oriented to the study of the physics capabilities, such as the Workshop on the Discovery Potential of a Super Factory [16] and the Workshop on Flavour Physics in the LHC Era. These workshops have clearly demonstrated the importance of heavy flavour studies to arriving at an understanding of New Physics beyond the Standard Model.
The Factories, building on more than thirty years of work in heavy flavour studies, have developed an extraordinarily vibrant and productive physics community. They have produced more than four hundred refereed publications on mixing-induced and direct violation, improved the measurements of leptonic, semileptonic and hadronic decays and discovered a series of surprising charmonium states. The Factories have also been an excellent training ground for hundreds of graduate students and postdoctoral fellows. Super will no doubt be similarly productive.
INFN has formed an International Review Committee to critically examine this Super Conceptual Design Report and give advice as to further steps, which include submission of this CDR to the CERN Strategy Group, requests for funding to the Italian government, and application for European Union funds.
Should the proposal process move forward, it is expected that the collider and detector projects will be realized as an international collaborative effort. Members of the Super community will apply to their respective funding agencies for support, which will ultimately be recognized in Memoranda of Understanding. A cadre of accelerator experiments must be assembled to detail the design of Super , while an international detector/physics collaboration is formed. The prospect of the reuse of substantial portions of PEP-II and BABAR raises the prospect of a major in-kind contribution from the US DOE and/or other agencies that contributed to BABAR construction; support of the project with other appropriate in-kind contributions is also conceivable. It is anticipated that the bulk of the US DOE contribution would be in kind, in the form of PEP-II components made available with the termination of the SLAC heavy flavour program. These include the HER and LER magnets, the RF and digital feedback systems, power supplies and vacuum components and the BABAR detector as the basis for an upgraded Super detector.
BABAR is generally recognized as a successful example of an international collaboration formed to design, build and operate an HEP detector and to produce physics. The BABAR model was based on experience gained at CERN and other major laboratories in building and managing international collaborations over the past several decades; it is expected to serve as a model for the Super effort [17]. The funding agencies of the participating countries will have a role, together with the host agency and host laboratory, in the management of the enterprise, as well as a fiscal role through an International Finance Committee and various review committees. As with BABAR, the international character of the enterprise will be reflected in the governance of the collaboration and in participation in the operating expenses of the experiment, which include the substantial offline computing required.
4 Conclusions
The two first generation asymmetric Factories, PEP-II and KEKB, were built after consideration of a wide variety (more than twenty) of technical options for achieving very high luminosity with asymmetric energies. Both Factories have been very successful, exceeding design luminosity in a short time, and performing very reliably.
The associated detectors, BABAR and Belle have utilized the very large data samples provided by PEP-II and KEKB to provide a cornucopia of new heavy quark and heavy lepton physics measurements. These have subjected the Standard Model to new and stringent tests, all of which have thus far been passed.
With much larger data samples of 50-100 ab-1, new physics effects in , , and decays should be readily measurable, and will play a crucial and complementary role with the LHC and ILC in deciphering the details of, for example, supersymmetry breaking. Samples of this size require the construction of a machine like Super to provide data at a rate exceeding 15 ab-1 per year.
References
- [1] PEP-II Conceptual Design Report, SLAC-372, LBL-PUB-5303, CALT-68-1715, UCRL-ID-106426, UC-IIRPA-91-01 (1991); J. Seeman et al., SLAC-PUB-12023, Contributed to European Particle Accelerator Conference (EPAC 06), Edinburgh, Scotland, 26-30 Jun 2006.
- [2] S. Kurokawa and E. Kikutani, Nucl. Instrum. Meth. A 499, 1 (2003), and other papers that volume.
- [3] B. Aubert et al., BABAR Collaboration, Nucl. Instrum. Methods A 479, 1 (2002).
- [4] A. Abashian et al., (Belle Collaboration), Nucl. Instrum. Meth. A 479, 117 (2002).
- [5] Differences in the treatment of theoretical uncertainties in fits to extract Unitarity Triangle parameters have led to several distinct approaches. There is a Bayesian contingent [6] that treats theoretical uncertainties as if they followed a probability distribution. There are also frequentist treatments [7],[8] that make no assumptions about the distribution of theoretical uncertainties.
- [6] A.Ali and D. London, Eur.Phys.J. C9 687 (1999); M. Ciuchini et al., Nucl.Phys.B573, 201 (2000); M. Bona et al., JHEP 0610, 081, (2006).
- [7] J. Charles et al., Eur.Phys.J. C41, 1 (2005)
- [8] The BABAR Physics Book: Physics at an asymmetric factory. BABAR Collaboration, P.F. Harrison and H. Quinn, eds.). SLAC-R-0504 (1998).
- [9] The Physics Performance of LHC. N. Harnew et al. 5th International Workshop on Physics in Hadron Machines (Beauty 97), Santa Monica. Nucl. Instrum. Meth. A 408, 137, (1998).
- [10] The New Snowmass Year is an updating of the convention that multiplying peak luminosity by a “year” containing seconds provides a good measure of actual running time, the effects of accelerator and detector down time, dead time effects and the difference between peak and average luminosity. PEP-II/BABAR experience has shown that a “New Snowmass Year” with seconds is a more precise estimator of actual performance at a Factory.
- [11] Design for a Super Factory at PEP-II. J. Seeman et al. Proceedings of the 9th European Particle Accelerator Conference (EPAC 2004), Lucerne (2004).
- [12] Letter of Intent for KEK Super Factory. S. Hashimoto ed., KEK-REPORT-2004-4 (2004).
- [13] The starting point of this effort was an attempt to leverage the active development effort in support of a high energy linear collider that has been going on for the past two decades. The idea, which has antecedents dating to the mid 1980’s [14], was to achieve the high luminosity by using very low emittance beams with high disruption, and to recapture at least the positron beam and recirculate it, to minimize power consumption. It is, however, a substantial challenge to produce luminosities of the order of cm-2s-1 while having center-of-mass energy spread less than 10 MeV and keeping the power consumption to a tolerable level. This proved to be a difficult problem [15].
- [14] A Beauty Factory Using an SRF Linac and a Storage Ring. J.J. Bisognano, J.R. Boyce., D. Douglas., S. Heifetz, J. Kewisch., G. Krafft. and R. Rossmanith. CEBAF-PR-89-017 (1989). Conceptual Design of a Multipurpose Beauty Factory Based on Superconducting Cavities. U. Amaldi and G. Coignet Nucl. Instr. Meth. A260, 7 (1987). Proceedings of the Workshop on Heavy-Quark Factory and Nuclear-Physics Facility with Superconducting Linacs. E. De Sanctis, M. Greco, M. Piccolo. and S. Tazzari eds., Courmayeur (1987). A High-Luminosity Factory Linear Collider Using Positron Recirculation and Recovery. D. Cline and C. Pellegrini Nucl. Instr. Meth. A290, 297 (1990).
- [15] Super : a linear high-luminosity Factory. J. Albert et al. INFN-AE 05-08 (2005).
- [16] The Discovery potential of a Super Factory. Proceedings of the 2003 SLAC Workshops, Stanford, USA, 2003. J. Hewett and D. Hitlin, eds. SLAC-R-709, (2004), [arXiv:hep-ph/0503261], and references therein.
- [17] The URL for the Super web site is http://www.pi.infn.it/SuperB/
Chapter 1 The Physics
The search for evidence of physics beyond the Standard Model will be the main objective of elementary particle physics in the coming decade. The LHC at CERN will soon commence a search for the Higgs boson, the missing building block of the Standard Model. It will also begin an intensive search for New Physics beyond the Standard Model, a search motivated by the expectation that a new scale is expected make an appearance at energies around 1 TeV, which will be accessible to the LHC.
The production and observation of new particles is not, however, the only way to look for New Physics. New particles can reveal themselves through virtual effects in decays of Standard Model particles such as and mesons and leptons. Since quantum effects typically become smaller as the mass of the virtual particles increases, high-precision measurements are required to have an extended mass reach. In some instances, in fact, high-precision measurements of heavy flavour decays allow us to probe New Physics energy scales inaccessible at present and next-generation colliders.
Flavour physics is fertile ground for indirect New Physics searches for several reasons. Flavour Changing Neutral Currents (FCNC), neutral meson-antimeson mixing and violation occur only at the loop level in the Standard Model and are therefore potentially subject to New Physics virtual corrections. In addition, quark flavour violation in the Standard Model is governed by the weak interaction and suppressed by the small Cabibbo-Kobayashi-Maskawa (CKM) mixing angles. These features are not necessarily shared by New Physics, which could, therefore, produce very large effects in particular cases. Indeed, the inclusion in the Standard Model of generic New Physics flavour-violating terms with natural couplings is known to violate present experimental constraints unless the New Physics scale is pushed up to – TeV, depending on the flavour sector. The difference between the New Physics scale emerging from flavour physics and that suggested by Higgs physics could be a problem for model builders, but it clearly indicates that flavour physics has either the potential to push the explored New Physics scale in the TeV region or, if the New Physics scale is indeed close to TeV, that the flavour structure of New Physics is non-trivial and the experimental determination of the flavour-violating couplings is particularly interesting.
On quite general grounds, indirect New Physics searches in flavour-changing processes explore a parameter space including the New Physics scale and the New Physics flavour- and -violating couplings. In specific models, these are related to fundamental parameters, such as the masses and couplings of new particles. In particular, an observable New Physics effect could be generated by small New Physics scales and/or large couplings. Conversely, small effects in the flavour sector could be due to large New Physics scales and/or small couplings. The question of whether or not New Physics is flavour-blind is therefore crucial; if so, New Physics searches in flavour physics would be unfeasible. Fortunately, the concept of Minimal Flavour Violation (MFV) provides a negative answer: even if New Physics did not contain new sources of flavour and violation, the flavour-violating couplings present in the Standard Model are enough to produce a new phenomenology that makes flavour processes sensitive to the presence of new particles. In other words, MFV puts a lower bound on the flavour effects generated by New Physics at a given mass scale, a sort of “worst case” scenario for the flavour-violating couplings. Thus the MFV concept is extremely useful to exclude New Physics flavour-blindness and to assess the “minimum” performance of flavour physics in searching for New Physics, keeping in mind that larger effects are quite possible and easily produced in many scenarios beyond MFV.
The effectiveness of flavour physics in constraining New Physics has already been demonstrated by the Factories, whose superb performance in measuring the parameters of the CKM matrix, together with new results from the Tevatron on physics, already allow interesting bounds on New Physics. A few discrepancies exist in the current data, although several measurements alone do not approach accuracy. One lesson from the Factories is that precision is crucial in these kind of studies, as are redundant measurements of the same underlying quantity. In Fig. 1 we show the regions on the - plane selected by different constraints assuming the current measurement precision, and that expected at Super. With the precision reached at Super, the current discrepancies would clearly indicate the presence of New Physics in the flavour sector!
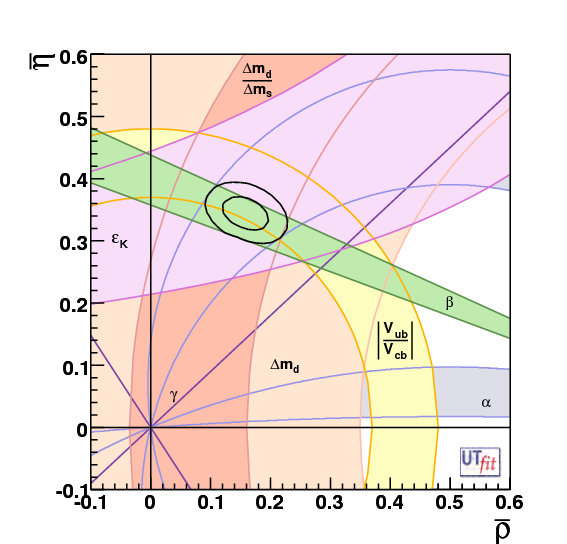
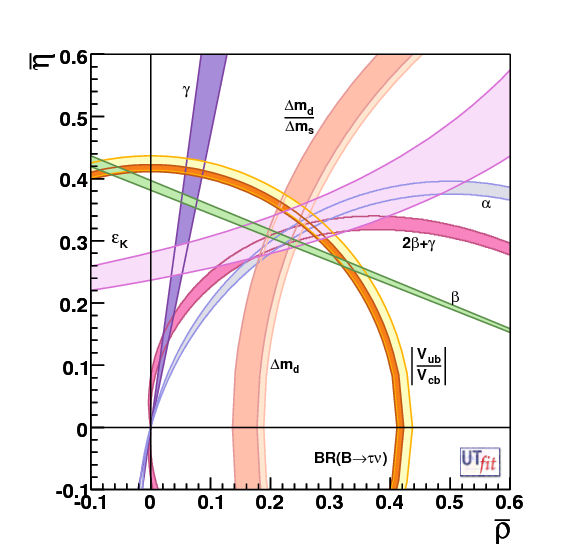
In light of these considerations, it is clear that a Super Flavour Factory can provide unique evidence for New Physics in the heavy flavour sector by searching for virtual effects that induce deviations from Standard Model predictions at the percent level, and for processes that are highly suppressed, or even forbidden, in the Standard Model, but can be enhanced by New Physics. Two features of the Super Flavour Factory are appealing from an experimental point of view: the possibility of measuring dozens of New Physics-sensitive observables with unprecedented precision, thanks to the high luminosity and the very clean experimental environment; and the ability to change the center-of-mass energy to produce well-defined particle-antiparticle pairs of , , , , , mesons and leptons, exploiting the quantum-coherence inherent in production via resonances annihilation.
Physics at Super could begin around 2012. An obvious question is then how the Super Flavour Factory physics program fits into the program of particle physics early in the next decade? Several scenarios are conceivable, but the most pertinent is whether the LHC will have produced non-standard (possibly flavoured) particles with masses below 1 to 2 TeV or not.
If New Physics has been found elsewhere, the importance of flavour physics studies becomes twofold: not only could the open window on much larger scales extend the New Physics mass spectrum found at the LHC, but a detailed study of the flavour- and -violating couplings of newly discovered particles could be carried out even in the unfavourable MFV case, taking advantage of the crucial information on the New Physics scale provided by the LHC. Although LHC, ATLAS or CMS could be the first to observe flavour-related effects in new particle production or decay, only with the Super Flavour Factory would we be able to perform a systematic analysis of their flavour- and -violating couplings in processes involving the second and third generations of quarks and leptons. These studies have a unique capability to reconstruct the New Physics Lagrangian from the observed phenomenology. A typical example is supersymmetry (SUSY): most of the couplings appearing in the soft SUSY-breaking sector of the Lagrangian could be measured at the Super Flavour Factory. In this scenario, high and flavour physics observations would both be required to understand the nature of New Physics.
If physics beyond the Standard Model is not found at the LHC, indirect searches in flavour-changing processes become of the utmost importance to probe New Physics scales in the – TeV region. After all, the TeV New Physics scale naturally required in order to stabilize the Fermi scale could be somewhat higher, without invalidating the concept of naturalness. Yet an acceptable upward shift of the New Physics scale would put LHC out of the game, and leave the task of discovering New Physics to indirect searches. Flavour physics would be able to probe the interesting mass range, giving naturalness a second chance before discarding it in favour of more exotic explanations of the Fermi scale. Unfortunately, given the presence of the unknown flavour couplings, there is no guarantee that the virtual effects of a new particle with a mass of TeV are observable even at the Super Flavour Factory Ṡtill, values of the New Physics scale in the – TeV range can be naturally reached in most New Physics models, including, for example, the Minimal Supersymmetric Standard Model, and even models with MFV are sensitive to scales larger than TeV in the large regime. Notice that LHC and the Super Flavour Factory, which find their strengths in measuring different decay processes, are complementary in the effort to observe New Physics effects from large scales.
In any case, regardless of whether or not New Physics has already been found, it is crucial to exploit the full richness of the phenomenology accessible at the Super Flavour Factory in order to increase the chances of observing New Physics flavour effects and to study the New Physics flavour structure.
Another anticipated result related to Super Flavour Factory physics is the search for lepton flavour violation (LFV) in the decay by the MEG collaboration. Indeed, searches for LFV in the transitions between the second and third generations, the golden mode being , are a centerpiece of the Super Flavour Factory physics program. The observation of with a branching ratio around , an unmistakable signal of New Physics, is accessible at Super. Super will probe values of an order of magnitude smaller than previous experiments; this is the range predicted by most New Physics models. For example, within Grand-Unified models, MEG and Super sensitivities are such that the pattern of LFV observations (and non-observation) can identify the dominant source of LFV and distinguish whether it is governed by the CKM or the PNMS matrix. Other topics in physics can be studied at the Super Flavour Factory as well, in particular, the precise determination of production and decay properties, including -violating observables, such as the -odd triple products which benefit from the polarized leptons that Super can produce with a polarized electron beam.
New Physics searches with and decays proceed along the lines already begun at the Factories. The full set of Factory measurements can be addressed, improving the accuracy of several observables, e.g. CKM angles, penguin transitions, , etc. down to . Additional New Physics-sensitive measurements such as the asymmetry in or the forward-backward asymmetry in become possible with the Super dataset. Any of these measurements could show a clear deviation from the Standard Model or be used to feed more sophisticated New Physics analyses. Notice that, in this sector, the overlap with the LHC physics program is rather limited and the Super Flavour Factory performance is, typically, superior.
It is worth noting that while some New Physics analyses depend only on measured quantities, others require theoretical information on hadronic parameters. The only approach that can, in principle, achieve the required theoretical accuracy is lattice QCD, where the limiting factor is likely to be uncontrolled systematic uncertainties. From this point of view, it is reassuring that lattice simulations have already begun to go beyond the quenched approximation. Extrapolations based on computing power foreseen in 2015, taking into account different sources of systematics (chiral extrapolation, heavy mass extrapolation, continuum limit, finite-size effects, etc.), indicate that an accuracy of is achievable on the hadronic parameters of interest for the Super Flavour Factory physics program, even without considering progress in theory and in algorithms, which are likely to occur, but difficult to anticipate.
The case of studies is somewhat different. The high oscillation frequency makes it impossible to perform fully time-dependent measurements at Super. In addition, most of the interesting observables, such as the phase of the mixing amplitude or ), will have been measured with high precision by LHC (and possibly by Belle running at the ) before Super begins. Nevertheless, a short run at the would suffice to accurately measure New Physics-sensitive quantities, such as the semileptonic asymmetry , which cannot be observed at hadronic colliders. It is interesting to note that, thanks to the quantum coherence of the pairs and the (limited) time sensitivity achievable at Super, it would be possible to measure violating phases through terms in the time-dependent decay rates that depend on . That is, the same quantities that can be extracted from the full time-dependent analysis can still be determined. Using this method and the full Super statistics, it should be possible not only to measure with an accuracy competitive with LHC, but also to access other CKM angles with decays. A similar consideration applies to , where, with the full statistics, one could hope to probe the Standard Model value of this branching ratio. However, gains in physics would be paid for with statistics potentially available for / physics. It is not clear at this point whether this would be worthwhile in the first few years of operation of Super. Nevertheless, it seems prudent to maintain this unique capability.
Finally, it is important to note that a large numbers of charmed particles are produced at the Super while running on the resonances; this sample would be times the statistics of existing charm factories and would still be much larger than samples at future dedicated facilities. It is clear that the next generation physics program of a charm factory could be carried out at Super. Some studies, for instance those related to the calibration of lattice QCD, could benefit from a short run at the threshold. Others, such as mixing studies based on quantum coherence, can only be done at threshold. In any case, a run of 1 to 2 months at threshold would produce a sample ten times larger than that available at the conclusion of running at the new charm factories. With these statistics, interesting New Physics-related measurements in the sector become possible, in particular violation in decay and improved measurements of oscillation parameters.
In this chapter we will identify those measurements that can be performed at Super which constitute clear motivation for its construction. In Section 1 we discuss physics with and mesons, that is physics at the resonance; in Section 2 we discuss physics, with particular emphasis on searches for lepton flavour violation; in Section 3 we discuss measurements in the sector that can be made at the resonance; in Section 4 we discuss the charm physics reach, including a discussion of the case for running at charm threshold. We briefly mention some of the other physics topics that can be tackled at Super in Section 5, before summarizing the physics potential in Section 6. We also include an Appendix on the expected improvement in lattice QCD calculations, and how these can affect the Super program.
The discussions in this chapter take as their starting point the results from the current generation of asymmetric Factory experiments, BABAR and Belle. We emphasize those measurements that are unique to the Super program, and which cannot be accessed at hadronic machines. For each measurement, we consider the current precision, the precision at the end of the Factory programs with of integrated luminosity, and results with , the integrated luminosity that would be collected in five years of data taking at a peak luminosity of . Note that the integrated luminosity profiles shown in Section 1 are based on more detailed scenarios for the progress of peak luminosity with time. We take particular care to consider potentially limiting systematic or theoretical uncertainties, and how these may be reduced. We also consider how changes in the detector and operating conditions (energy asymmetry, acceptance (hermeticity), vertex resolution, etc.) may affect the precision.
1 Physics at the
1 The Angles of the Unitarity Triangle
The Unitarity Triangle (UT), shown in Fig. 2, is a convenient graphical representation of one of the unitarity conditions of the CKM matrix [1, 2] given by
| (1) |
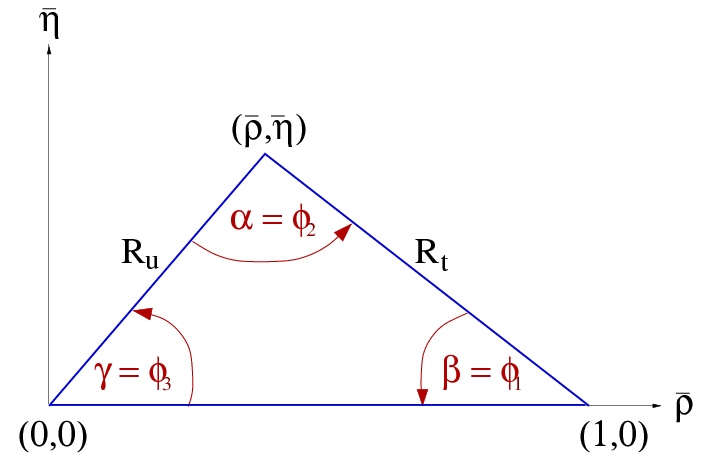
Two popular naming conventions for the UT angles exist in the literature:
We use the convention.
A significant fraction of physics is centered on measuring the properties of this triangle and, by overconstraining it, searching for New Physics effects. This will continue to be a prominent part of the physics program of Super.
Interpreting measurements in terms of properties of the UT is not always completely straightforward. In order to estimate Super measurement sensitivities, we have used the results of the UTfit Collaboration [3, 4, 5, 6]. For a different approach producing similar results, see [7].
Measurement of
in charmonium-kaon final states
The measurement of through mixing-induced violation in the decay , one of the theoretically cleanest measurements that can be made in flavour physics [8, 9], was the raison d’être of the current generation of Factories. The most recent measurements give a world average [12, 10, 11]
| (2) |
yielding a solution consistent with the Standard Model of (alternative solutions for are strongly disfavoured by other measurements). This result provides one of the tightest constraints on the Standard Model parameters in the - plane.
Further reduction of the error is straightforward, since the statistical error is almost twice the systematic uncertainty. However, beyond an integrated luminosity of a few the measurements approach the systematics-dominated regime. The systematic error budget of both BABAR and Belle analyses suggest that the limit due to systematic uncertainties (in vertexing algorithms, beam spot position and tag-side interference [13]) is about . The statistical precision will reach this limit with about . Nevertheless, this channel is an important benchmark for any physics experiment, and improved understanding of detector-related systematic effects will have benefits for all analyses. Using the very high statistics control samples that will be available at Super to improve the understanding of the detector, it may be possible to reduce this error to .
This level of precision is still above the size of the expected theoretical uncertainty [14, 15, 16]. At Super, it is possible to control the the possible penguin contribution using a data-driven approach that employs the experimental measurement of time-dependent asymmetry in [16]. Although experiments in a hadronic environment should be able to measure from to the same level of accuracy as Super, they would not be able to perform this kind of cross-check, nor can they check the consistency of the values obtained with different final states such as , , etc. [17].
Decays with charmonium-kaon final states offer a number of additional important observables. Direct violation in would be a clear New Physics signal [18]; Super can probe for this effect to the limit of detector systematics, expected to be . Furthermore, time-dependent studies of , with , provide sensitivity to [19, 20, 21, 22], which could be measured to a precision of 0.05 at Super.
Complementary measurements of
The value of can also be measured from mixing-induced asymmetries in several other decays, and the consistency of these results with those obtained from transitions provides a powerful test of New Physics effects. Foremost among these are decays dominated by the penguin amplitude, discussed below, but there are also others. Decays such as and are expected to be dominated by the tree diagram, although contributions from the penguin amplitude are also allowed. Sizeable deviations from the Standard Model predictions may suggest New Physics enhancements in the penguin topology. Decays such as , where the meson is reconstructed in a final state accessible to both and decay, such as a eigenstate (e.g. ) or a multibody final state (e.g. ), are dominated by the tree diagram, with negligible Standard Model backgrounds [23, 24, 25, 26]. The channel also allows to be cleanly determined [27]. With , these channels will yield measurements of and with precision of about and respectively. Experiments in hadronic environments are not competitive for these measurements.
Measurement of with penguins
Perhaps the most interesting channels to search for New Physics effects in mixing-induced violation are those dominated by the penguin transition [23, 28, 29]. In the Standard Model, these decays should measure , up to small corrections. New Physics particles in the loops can cause deviations from Standard Model predictions. The potential of this approach to search for New Physics depends on the precision of the Standard Model predictions for individual channels; estimates of these hadronic uncertainties necessarily rely on models or symmetries. Recent calculations indicate that the modes with the smallest theoretical uncertainties are , and (the latter reconstructed as ) and that these have uncertainties of – on (see, for example, [30, 31, 32, 33, 34, 35, 36, 37, 38, 39], and references therein). Model-independent data-driven analyses find larger uncertainties [40, 41] but these will decrease as data become more precise.
The current world averages of measured using , and have uncertainties of , and respectively [12, 11, 42, 43, 44]; see Fig. 3. By the end of this decade, these errors will be reduced by a factor of ; 111Note however that the relative sizes of the errors in differ between BABAR and Belle, due to different treatment of the -wave under the peak. If this contribution is large, as suggested by the BABAR results, the uncertainty on the average will be larger than expected. the precision will still be much worse than most estimates of the theoretical uncertainties.
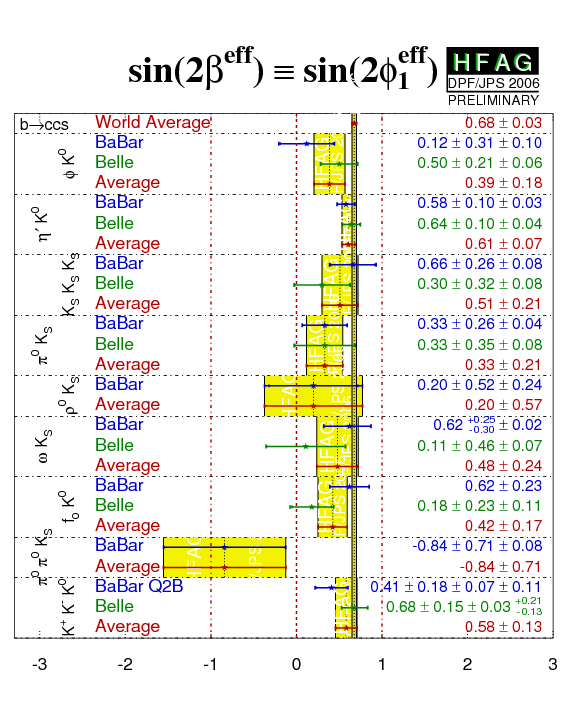
A number of studies [45, 46, 47] have shown that approximately are necessary to reduce the experimental error to the level of the theoretical precision in the channels , and . For , the results will become theory-dominated much earlier. However, in this case (and indeed in others) it may be possible to use data-driven techniques to gain better control over the theoretical errors [30, 32, 39]. These analyses obtain constraints on the hadronic parameters by using as input a large number of branching fractions of charmless hadronic decays. The complete set of these measurements can only be obtained at a Super Factory. Indeed, experiments at hadronic machines have limited capability in measuring time-dependent asymmetries in decays dominated by the penguin amplitudes, whereas Super can study not only the channels discussed above, but also , , , , etc. [48, 49, 50, 51, 52, 53]. While hadronic machines are well-suited to the study of time-dependent asymmetries in decay, Superrunning at the can complement these results with measurements of related channels such as , . For more details on the physics opportunities at the , see Section 3.
Measurement of
Many different processes are sensitive to the UT angle ; consequently a large number of techniques have been proposed to measure . While the majority of these methods suffer from hard-to-quantify hadronic uncertainties, there is a method that provides a theoretically clean measurement. Using decays, this method exploits the fact that the neutral meson decay product can be either a (from a transition), or a (from a transition; or vice versa for decays). If the final state is chosen such that both and can contribute, the interference between these amplitudes is sensitive to the phase , allowing to be determined with essentially no theoretical assumptions. Choices for the final state include meson decays to eigenstates [54, 55], doubly-Cabibbo suppressed states [56, 57] or self-conjugate multibody states [58]. The sensitivity to for each depends on the (unknown) ratio of the magnitudes of the and decay amplitudes, denoted , as well as on the structure of the decay. Both and decays can be employed in addition to ; both neutral and charged decays can be used [59]. In the case of , it is particularly important to distinguish and decays [60], which may be difficult in a hadronic environment. The value of must, in general, be measured, for each decay channel.
Both BABAR and Belle have made measurements for each of the decays cited above [61, 62, 63, 64, 65, 66, 67, 68, 69, 70, 71]. No statistically significant -violating effect has yet been observed in decays. The most precise constraints on :
| (3) |
currently come from analyses of the multibody decay [69, 70].
The three sources of error are statistical, systematic and uncertainty related to the hadronic structure of the Dalitz plot. The smaller statistical error of the Belle result is a consequence of the larger central value obtained for .
Combining all the available measurements provides a determination of with an error of about 20∘. The central values of (for each decay) are found to be around 0.08 [4], slightly smaller than the expectation.
As we extrapolate to high luminosity, we find that the decay model uncertainty can become a limiting factor for the multibody analysis. Recent studies [72] have shown that with , assuming a Dalitz plot model error of and , the uncertainty on can be reduced to . This can in principle be reduced with a better understanding of the model describing the resonance substructure. A model-independent approach, using -tagged neutral mesons collected at an machine operating at the [73], can also reduce the uncertainty (see Section 4). Different multibody final states can also be used (e.g. , ); these channels have model uncertainties that are, in general, uncorrelated. With very high luminosity, it should be possible to use a large number of states, including singly-Cabibbo suppressed decays such as [74], and even four-body decays such as and [75]. Finally, note that approaches using decays to eigenstates and doubly-Cabibbo suppressed final states do not suffer from this error. These methods contribute significantly to the overall constraint at high luminosities, with the latter particularly important when is small. Self-tagging meson decays, such as [76] can also be used; this mode may have a larger value of (), and thus could contribute significantly to a precise determination of at high luminosity.
With , it should be possible to determine with an uncertainty of – using decays to eigenstates and doubly-Cabibbo suppressed states alone. Assuming that decay model uncertainties can be tamed, and exploiting the large variety of decays that can be reconstructed at Super, an uncertainty of may be possible.
Note that this discussion has neglected the possibility of mixing and violation in the neutral meson system. It is, however, straightforward to take these effects into account in the analysis, if necessary [77]. Finally, it is interesting to observe that the determination of discussed in this section is not affected by New Physics under the assumption that the New Physics does not change tree-level processes. This assumption is expected to be valid at the subpercent level in most models, and, in any case, would produce observable effects in the decay branching ratios. Thus, together with the measurement of , a precise measurement of provides a significant constraint on the – plane that must be met by any New Physics model.
Measurement of
Interference effects between and decay amplitudes in decays to and final states allow the determination of the combination of UT angles . From this analysis the quantities can be determined, where is the absolute ratio of the and decay amplitudes and is their strong phase difference. Since there are two observables and three unknowns (, and ), additional information is needed to extract the weak phase. Measurements have been performed by both BABAR [78, 79] and Belle [80] in the channels , (the two experiments using both full and partial reconstruction techniques) and (BABAR only). The most precise constraint is provided by the measurement of [12]. Using flavour SU(3) symmetry to estimate the size of the parameters, allowing for breaking effects as large as 100%, and combining measurements in the three modes, the current world average is [4].
A simple extrapolation of these numbers suggests that precise constraints on can be obtained with Super luminosities. However, there are two complications. The first is that the experimental measurements, while still dominated by statistical errors, are already rather precise; reduction of the systematic errors much below the level will be challenging. Secondly, the theoretical uncertainty related to SU(3) breaking in the estimation of the parameters does not allow to extrapolate the error simply scaling with the statistics. Such effects are hard to quantify, although there are means to address them using data.
Both problems can be circumvented by using a channel in which the value of is much larger (and hence can be determined directly from the data). A good example is [81, 82], for which the ratio is expected to be of order 0.4. It has been shown [83, 84] that all the amplitudes and the strong phases of the intermediate states contributing to this decay can be determined using a time-dependent Dalitz plot analysis, together with . The uncertainty on from this mode, with the statistics available at Super, could be better than . The channel with reconstructed into and three-body final states should also allow a comparable precision in the determination of .
Measurement of
Experimental information on the angle derives from the interference between mixing and decays dominated by the amplitude (), e.g., from the charmless decays , and . In the absence of contributions from top-penguin diagrams, the asymmetries in these decays provide a measurement of . Penguin diagrams introduce an additional amplitude () with a different weak phase. In this case, the experimentally measured quantity is , which is a function of but also of unknown hadronic parameters. Several strategies have been proposed to remove this so-called “penguin pollution”. Note that, generically, the uncertainty on due to the penguin pollution depends on the ratio .
The archetypal method to extract uses an isospin analysis of [85]; the same method can also be employed for decays. This method makes use of the fact that, due to Bose-Einstein statistics, the two pions produced in decay can only have isospin or . Since mesons have , the physical amplitudes can be decomposed in terms of isospin amplitudes with . On the other hand, the weak effective Hamiltonian only contains operators that contribute to and transitions. It follows that the physical amplitudes for the , and decays can be written respectively as:
| (4) |
yielding the relation . An equivalent expression holds for the decay amplitudes. These relations can be represented in terms of isospin triangles, as shown in Fig. 4. In writing the above relations, we have used the fact that penguin operators mediate only transitions (since the gluon has ), and have thus assumed that receives contributions only from tree operators. Hence , and the triangles can be rotated to be drawn with a common base.
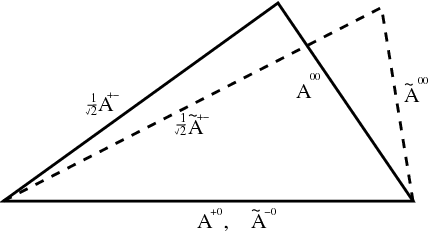
Construction of the isospin triangles allows the penguin contribution to be isolated, and therefore can be extracted [85] from the measured asymmetry. The experimental inputs required are the -averaged branching fractions for the three modes (, and ), the direct asymmetries for neutral decays, together with the mixing-induced asymmetry parameter . Measurements of all of these quantities have been made in both the and systems [86, 87, 88, 89]. The latter is a vector-vector final state; contributions from different helicity amplitudes could, in principle, complicate matters. However, measurements show that the decay is almost completely longitudinally polarized, and the analysis is performed on that component only. Note that when and if measurements of become available, they can be included in the analysis.
The situation for is more complicated. Since the Bose-Einstein statistics argument no longer applies, five amplitudes can contribute to the decays and the triangle becomes an isospin pentagon. There is, however, alternative approach that exploits the interference of the , and amplitudes in the Dalitz plot [90]. Interference between resonances on the Dalitz plot provides additional information, so that isospin is only needed to relate the penguin contributions. Results for this analysis are available from both BABAR [91] and Belle [92, 93].
By combining all the available analyses, can determined quite precisely. Considering the solution which is compatible with the Standard Model value, the current data give [4]. Several extrapolations into the multi regime exist [72, 45, 46, 94], showing that the precision on could reach a few degrees. To improve the precision to or below the degree level, one must understand the size of the genuine isospin breaking effects and the effect of a penguin amplitude in , since electroweak penguins (EWP), which are usually neglected, contribute to transitions. The consequence is that the middle relation of Eq. 4 receives an additional contribution containing two additional parameters. In this case the SU(2) triangular relations still hold true, but the condition could be invalid. However it has been shown that the effect of the dominant EWP operators can be included in the isospin analysis [95]. Their effect has recently been estimated to produce a shift in the extracted value of equal to , where the first error is experimental and the second comes from neglected subdominant EWP operators [6, 96]. Note that the uncertainty on induced by the EWP correction to the isospin analysis can be reduced at Super.
The second important ingredient in the isospin analysis is that the effective Hamiltonian does not mediate transitions. Nevertheless amplitudes can be generated by genuine isospin-breaking effects such as the - quark mass difference, -- mixing, or by electromagnetic interactions [97]. All these effects break the triangular relation, causing the number of free parameters to exceed the number of observables. Some of these contributions have been estimated and found to induce an uncertainty on of about [96]. The presence of a amplitude can be tested by measuring the asymmetry in (which can also possibly be generated by subdominant EWP operators) and experimentally testing the triangular relation [98].
There is an additional complication in the system, where the non-negligible width of the allows final states to contribute [99]. The effect of amplitudes can be tested by measuring as a function of mass. Estimates of the size of the isospin breaking effects are generally around –.
We note that once again the strength of the Super program is that multiple approaches are possible. Since the size of is quite different in the , and systems, the consistency between the results for obtained in the different channels will allow to test with high statistics the theoretical assumptions used to extract . Finally, note that since all measurements of require reconstruction of modes containing neutral particles, it is extremely unlikely that experiments in a hadronic environment will provide competitive measurements.
2 Measurement of the CKM Elements and
The determination of the magnitude of the CKM matrix elements and from inclusive and exclusive semileptonic meson decays requires knowledge of the absolute branching fractions as well as an absolute prediction of QCD corrections that relate quark level processes to meson decays. Improvements in the measured branching fractions can only be realized by improved understanding of the impact of the detector on the detection of both signal and backgrounds. Since all semileptonic decays involve an undetected neutrino, improvements to the detector acceptance and detection efficiency for charged and neutral particles are very important. The reduced beam-energy asymmetry at Super leads to an increase in solid-angle coverage. Detailed studies of detection efficiencies and misidentification rates with large control samples selected from data, which will become available at Super, will be critical to achieving simulations accurate to better than one percent. This includes production rates of kaons in meson decays and continuum events, as well as the interactions of neutral kaons in the detector. For the study of Cabibbo-suppressed decays, improved understanding of the background from exclusive decays is becoming critical. Likewise, background contributions from decays involving higher-mass mesons, or mesons with strangeness, limit the current precision.
Theoretical understanding of QCD effects for both inclusive and exclusive meson decays is expected to improve with time, since experimental errors are in many cases smaller than uncertainties in form factor normalization and Operator Product Expansion (OPE) and Heavy Quark Symmetry (HQS) corrections to the inclusive decay rates. The impact of effects such as weak annihilation must also be assessed, both experimentally and theoretically.
Perspectives on Exclusive Semileptonic Measurements
Measurements of exclusive decays such as can yield a very precise determination of , provided that the theoretical precision in the determination of the form factor has a comparable accuracy (see Section 5). From the experimental point of view, we should provide precise measurements of , where is the invariant mass-squared of the lepton-neutrino pair. Different tagging techniques have been developed, using full or partial reconstruction of one of the two mesons in the event to reduce background and improve the determination of kinematic quantities, but untagged events are also employed, and at present still provide the most precise results. The study of exclusive charmless decays, making use of tagging techniques, will become more powerful with significantly larger data samples. The various methods have quite different efficiencies and background contamination. Analyses using full-reconstruction techniques select about 130 events per while those using untagged events select about 22,000 events per . The signal-to-background ratio is about 20 times higher for the tagged approach than for the untagged approach. Recent BABAR studies show that full-reconstruction technique yields an error on the branching fraction of , dominated by the statistical uncertainty. In the untagged analysis the precision has reached and the systematic and statistical uncertainties are of comparable size. In this case the dominant systematic uncertainties come from neutrino reconstruction (due to missing particles, unidentified mesons, etc.), non- background, and from contributions of other decays. These systematic uncertainties could be reduced by improving the reconstruction of charged and neutral particles, and by performing more measurements of resonant and non-resonant decays. At Super, the branching fraction can be measured with a precision of a few percent. The large data samples will also allow a similarly precise determination of the dependence of the form factor through measurements of partial branching fractions in many different intervals. Similar analyses could be performed by reconstructing , , , , and higher-mass mesons in the final state. Final states with a vector meson, or , will especially benefit from the large Super data samples. Here three form factors are used to describe the decay kinematics, which requires a detailed study of angular distributions. The contribution to the uncertainty on from the partial branching fraction measurements could reach a level of –. The crucial point is that the form factors must be determined at the same level of precision (see Appendix 5). A total error of – on from exclusive analyses appears possible with Super data samples.
Estimates for improvements on from measurements of are given in Table 2. The experimental and theoretical uncertainties are currently of comparable size ( 3%). It will be difficult to improve the experimental uncertainties, which are mainly due to detector effects, such as the reconstruction of the low-momentum pion from the decay of the meson, below the – level. A simultaneous measurement of and decays would be useful to better control the background due to feed-down from decays for the analysis of the mode. The form-factor calculations for these decays could reach a precision of better than 1% (see Appendix 5). Thus a total error on of – from exclusive analyses can be expected at Super . In addition, a much improved understanding of semileptonic decays with higher-mass () and non-resonant () states, which are curently not well-understood, will become feasible.
Perspectives on Inclusive Semileptonic Measurements
The total decay rate and lepton spectra for inclusive semileptonic meson decays to charmed final states have been measured with great accuracy at the current generation of Factories, allowing the determination of with a precision of . Theoretical uncertainties already dominate this error. These are mostly uncalculated perturbative corrections, of and , to the Wilson coefficients of the OPE used to compute the rate. Though difficult, the required calculations are feasible with present techniques, and are likely to be available by the start of Super, where can be expected to be determined inclusively with a total error below 1. Theoretical rate calculations for these decays also include non-perturbative OPE parameters, which are obtained from a fit to the moments of the electron energy or hadronic mass spectra in decays, or from the photon-energy spectrum in decays. With this method, a determination of and with a precision of less than 30 and 50 MeV, respectively, and of and with better than 10 precision should be possible. These measurements allow crosschecks of lattice calculations of, for instance, quark masses, and are important inputs for the determination of , as outlined below, or for studies of rare meson decays.
The situation is more complicated in the case of charmless inclusive semileptonic decays which play a crucial role in the determination of . Experimentally, the separation of the signal from the overwhelming background, the most challenging task, requires harsh kinematical cuts. Even with current statistics, the theoretical error has begun to dominate here as well. The kinematical cuts needed to suppress the background make the measurements particularly sensitive to non-perturbative effects, and spoil the convergence of the OPE. A resummation of the non-perturbative contributions into a so-called shape function becomes necessary. The non-perturbative dynamics relevant to these decays cannot be simulated on the lattice. For future inclusive determinations of , it is important to minimize the dependence on the shape function by avoiding overly stringent kinematical cuts at the expense of higher backgrounds. Here the large data samples available at Super will help, because they allow an improved determination of the backgrounds. In the case of the lepton-endpoint analysis, the lepton momenta could be extended well below the currently used minimum momentum of 2 GeV, which will significantly reduce the shape function and resummation effects, or even make them irrelevant. The most important remaining source of theoretical error on from inclusive measurements would then be the mass of the bottom quark. An inclusive determination of with a precision of about might then be possible. New measurements, such as precise measurements of kinematic spectra in decays, will also become feasible at Super. These will yield significant information on the leading and subleading shape functions, as well as on contributions from weak annihilation, and will thus reduce the theoretical uncertainties and test the validity of the theoretical framework. Some of these studies are possible at the current Factories, but they will become far more stringent at Super. Recent efforts aim at the elimination of the dependence on the shape function (to first order), using theoretical calculations that relate the differential rate for charmless semileptonic decays to the photon-energy spectrum measured in decays through weighting functions. These studies will also benefit from much larger samples of both and decays.
Measurement of )
The decays and are sensitive to New Physics through virtual exchange of charged Higgs bosons. The branching fractions are expected to be of the order of in the Standard Model. Because of the presence of at least two neutrinos in the final state, the reconstruction of these modes requires the reconstruction of the other meson in the event, and hence requires a larger data sample with respect to that used to measure and . Simulations show that by combining the hadronic and leptonic decays in final states containing a meson, a relative precision of can be reached with . In the hadronic analysis, the most important backgrounds are the decays with a missing and a soft pion from and with misidentification of as and missing slow pion. There is cross-feed between these decays, and the channels with a decaying into leptons can be considered as backgrounds. The background situation in the leptonic channel shows similar patterns. The systematics uncertainties attached to this measurement are of quasi-statistical origin: the efficiency and the purity of the recoil sample, the particle identification and the reconstruction efficiency for slow pions. For this reason, the precision of this measurement can be improved to using Super statistics. It is clear that improvement of detector hermiticity and PID can improve the sensitivity of the analysis. Final states containing a have also been studied. In this case, the efficiency is lower; a precision of about () can be reached with (or the statistics available at Super). To fully exploit the experimental precision in this channel the form factors must be known at the percent level. It should be stressed that, while and depend on a single form factor, is also sensitive to a second form factor, since the lepton mass is not negligible compared to the meson mass.
3 Rare Decays
Rare decays provide a powerful window into New Physics. Decays that are highly suppressed within the Standard Model may not suffer the same constraints when New Physics is introduced, and hence significant effects can be observed. Due to the clean environment and excellent particle identification capabilities of Super, a large number of rare decay channels can be studied, with rates covering several orders of magnitude, down to as low as for the cleanest channels. We provide herein a brief summary of the reach for some of the most interesting channels. A key strength of the Super program is that the abundance of New Physics-sensitive measurements allows the diagnosis of the origin of the New Physics.
Leptonic Decays : and
Leptonic decay processes are described by annihilation diagrams. The rates of leptonic decays of the meson are therefore proportional to , where is the same pseudoscalar constant that enters the determination of (assuming isospin symmetry). Leptonic decay rates are helicity suppressed; the branching fraction is given by:
| (5) |
where is the Fermi constant, and and are the masses of the meson and the lepton respectively. The branching fractions are expected to be about for , for and for . Evidence for the mode has recently been reported [100] (see Fig. 5). The world average for the branching ratio is [12, 101]. The upper limits on the muonic decay are approaching the Standard Model expectation [102], while those for the highly suppressed decay are still far away from the Standard Model value.
The measurements of leptonic decay branching fractions can be interpreted in various ways. If the value of is taken from lattice QCD calculations, then a determination of can be obtained from the branching fraction, allowing a consistency check with other approaches used to measure this quantity, as described in Section 2. Alternatively, one can take the value of and use the leptonic decay rate to check the consistency of the lattice calculations. Finally, if one takes known values of and , the Standard Model expectation can be compared to the branching fraction measurement. This is particularly interesting, since the leptonic decay processes are sensitive to New Physics, in particular to charged Higgs exchange in a scenario with large . For example, in the two Higgs doublet model (2HDM), the effect of the charged Higgs is that the branching fraction is scaled by a factor [103], where is the mass of the charged Higgs boson, and is the ratio of Higgs expectation values, and is not related to the UT angle. Considering the leading corrections in the large limit, the charged Higgs contribution in the MSSM is rather similar, the scaling factor becoming where [104].
We discuss the potential of Super to measure these leptonic modes in turn. While we focus our attention on the precision with which the branching ratios can be measured, it is worth mentioning that any direct violation in these channels would be an unmistakable signal of New Physics.
Since the decay of the lepton necessarily involves at least one neutrino, there are multiple sources of missing energy in the decay, rendering conventional reconstruction techniques impossible. However, the signal can be isolated by taking advantage of production at the resonance. The analysis technique proceeds by reconstructing either exclusively or partially one meson in the event (the tag), and then compares the remainder of the event with the signature for the signal decay. The distribution of the variable , defined as peaks near zero for the signal, while the backgrounds tend to take higher values, as shown in Fig. 5. This analysis is clearly highly sensitive to quantities that depend on neutral particle detection. Therefore, a detailed simulation of the calorimeter response and knowledge of the beam backgrounds are important for a realistic estimate of the sensitivity at Super. It is important to reduce and understand background sources, such as unreconstructed tracks and undetected mesons. The current analyses assign total systematic errors of more than . With , the statistical error will be of the order of –, so systematic effects will have to be much better controlled to match this statistical precision.
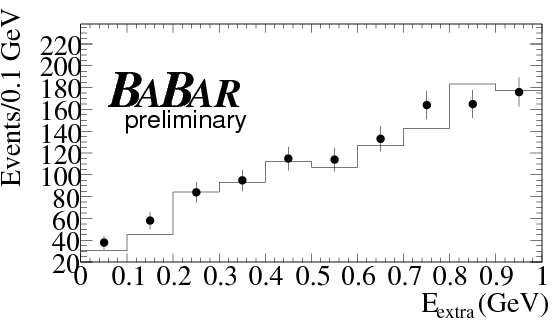
|
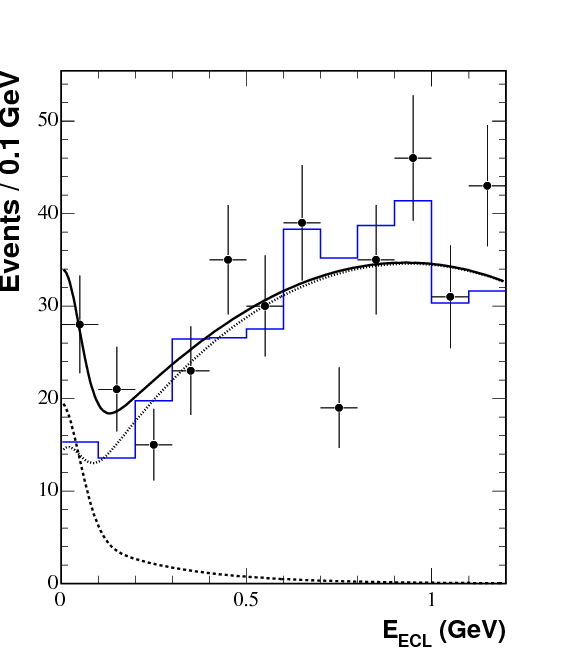
|
Many of the systematic effects can, in fact, be reduced by careful studies of control samples (such as ), and further reduction of the error may be possible if the detector performance can be improved. The reduced energy asymmetry of Super will improve the detector solid angle coverage, and hence the hermeticity, leading to better control of backgrounds. Studies also show that the contemplated addition of more iron in the flux return leads to an improved meson detection efficiency (see Section 8), which will directly benefit this analysis. We conclude, therefore, that the branching fraction can be measured with a total error of with .
In contrast to the tauonic decay, the muonic decay mode has a very distinctive signature: a high transverse momentum muon and a missing energy vector that balances the momentum of the lepton. Kinematic constraints on the companion in the event allow the mono-energetic final state lepton to be reconstructed with little or no background. Due to this clean signature, we expect a statistical error of about on the measured branching fraction at the Standard Model value. Since backgrounds are small, it should be possible to control systematic uncertainties to a similar level.
The case when the lepton in the decay is an electron is as clean as the muonic mode, but due to the small electron mass, the helicity suppression is severe, and the Standard Model rate is below the sensitivity of Super. The expected upper limit would be at the level of .
and
The radiative leptonic decays do not suffer the same degree of helicity suppression as the purely leptonic decays. Super has excellent sensitivity for, e.g., [105]. The theoretical branching ratio for this mode is model-dependent [106], but, if a value for is taken from other measurements, this mode can be used to determine , the first inverse moment of the light-cone distribution amplitude, a quantity that enters into calculations of the branching fraction of hadronic decays such as .
Finally, the neutrinoless leptonic decays , and can also be studied at Super, together with their lepton flavour-violating counterparts [107, 108] (see the discussion of leptonic decays in Section 4). With , the sensitivity would reach the level for the and final states, which is close to the Standard Model expectation for the muon mode. The very clean experimental signatures of these channels make them well-suited for experiments in a hadronic environment, in stark contrast to channels involving leptons, or neutrinos, or both. The decay can only be studied at a Super Factory, although the sensitivity will still be far above the Standard Model expectation. For New Physics searches, lepton flavour-violating decays such as may, however, reach an interesting level of precision.
Radiative Decays : and
The radiative FCNC decays and are very sensitive probes of New Physics. Since these decays occur only at loop level, and furthermore are CKM-suppressed in the Standard Model, the rates for these transitions alone provide severe constraints for New Physics model builders. Indeed, early measurements of the rate of the decay [109] have been very highly cited, due to their phenomenological impact. To fully take advantage of these decays, however, several other observables, such as asymmetries and the polarization of the photon, must be measured. These measurements, which can be performed at Super also provide clean tests of the Standard Model, It is important to note that Super can make these measurements in the theoretically cleaner inclusive modes, and is not restricted only to exclusive channels.
: Exclusive
The primary focus of exclusive measurements is on asymmetries, which have comparatively small theoretical uncertainties, in contrast to the rates. Indeed, studies of direct asymmetries in radiative penguin decays are among the golden modes for Super. Direct violation in these decays is expected to be in the Standard Model, but could be an order of magnitude larger if there are New Physics contributions in the penguin loops. Experimentally, the most accessible channel is . One can also make an average with the decay, and search for isospin violation, which could be caused by New Physics, in the rates and asymmetries. The current experimental average is [110, 111, 12].
With , the limiting factor in this measurement will be systematic uncertainty due to asymmetries in the detector response to positive and negative kaons. Such effects are under study at the Factories, with the residual errors already below the level. Further reduction of the uncertainty should be possible, but will require highly detailed studies of both Monte Carlo simulation and data control samples. We estimate the ultimate precision to be .
: Exclusive
The ratio of rates of and decays can give a precise determination of , complementing the information obtained from the ratio of oscillation frequencies . In the ratio of exclusive decay branching fractions many theoretical uncertainties cancel, allowing a measurement of the same combination of CKM matrix elements.
The theoretically cleanest case is for the neutral modes, since in the charged modes there is the possibility of non-negligible weak annihilation contributions [112, 113]. We therefore concentrate on the neutral modes in the following.
which contains a factor due to isospin (), a kinematic factor, the ratio of the CKM matrix elements squared, the ratio of form factors squared () and a term containing additional hadronic effects ( contains non-factorizable SU(3)-breaking effects and also accounts for annihilation contributions).
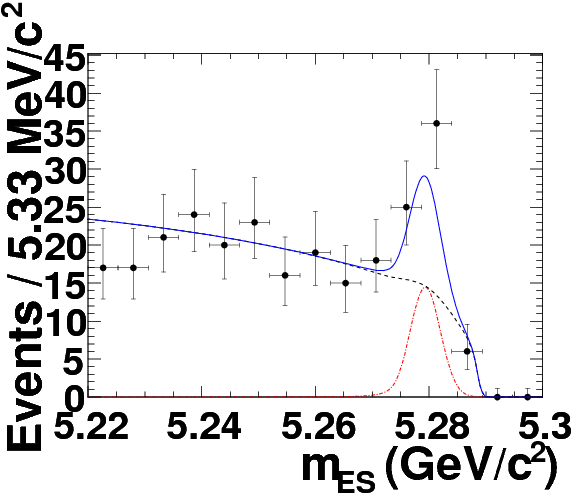
|
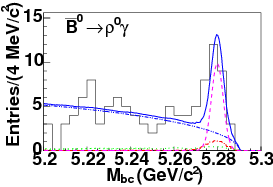
|
The current experimental world averages are [116, 117, 12] and [110, 111, 12]. The signals for are shown in Fig. 6. The limiting factor is currently the statistical precision on . With Super statistics of this can be reduced to a level of about . Systematic uncertainties will not be negligible at that scale. In particular, good control of the particle identification performance will be necessary to understand possible feed-across from with a misidentified kaon. Nonetheless, even without any improvements in analysis techniques and detector performances, the experimental precision should reach about . It is then crucial to control the form factors and the SU(3)-breaking terms at a similar level of accuracy to extract the ratio with uncertainty (see discussion in Section 1).
Super will also be able to measure direct asymmetries in processes, which have not been seen at the current Factories, to precision, which is the Standard Model expectation for this asymmetry.
: Inclusive
Measurements of the inclusive branching fraction of provide powerful, theoretically clean constraints on New Physics. Theoretical calculations of the Standard Model prediction have recently been advanced to next-to-next-to-leading order (NNLO), giving the value , [118] (see also [119, 120, 121]), which is in good agreement with the latest experimental determination, [122, 123, 132, 12]. Although further reduction of the theoretical error will be difficult, improved measurements of the total rate with larger statistics will greatly improve our knowledge of the photon energy spectrum, and will allow the minimum energy requirement to be moved to smaller values. Consequently, the theoretical error associated with the extrapolation required to obtain the total branching fraction will be reduced. This approach also provides the most accurate determination of .
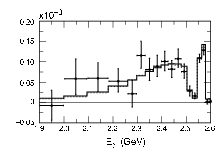
|
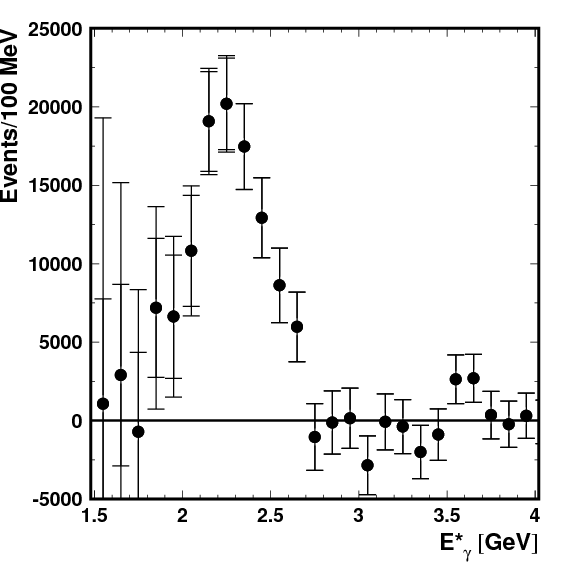
|
As in the exclusive case, the inclusive asymmetry has less theoretical uncertainty than the rate [133]. The current world average is [12], using results in which both BABAR [134] and Belle [135] reconstruct the system as a sum of exclusive final states and correct for the missing fraction. Such analyses suffer from the same source of systematic error in particle identification as the exclusive modes. Therefore, with , the level of precision is likely to be limited at the same level as the exclusive modes, about .
: Inclusive
Inclusive studies of the transition have not yet been carried out at the Factories. The analysis, using a sum of exclusive final states, is quite challenging, since the amplitude becomes a background that can only be reduced using particle identification. Nonetheless, preliminary studies show that such an analysis can be done with around ; the results would clearly become very interesting with the full Super statistics.
It is interesting to note that, in the Standard Model, the partial width differences in and should cancel, so that is predicted to be zero. This prediction is exact in the -spin limit [136], and flavour-breaking effects have been calculated to be small [137, 138, 139], giving a very precise null test [47]. A fully inclusive approach can be used; particle identification systematics do not then contribute. The price, however, is a very large background that must be controlled. With Super statistics it will be possible to do so using full reconstruction of the other meson in the event. A first measurement of has already been carried out by BABAR [140], suggesting that this asymmetry can also be measured to subpercent precision at Super.
Photon polarization measurements
Within the Standard Model, photons emitted in radiative decay are predominantly left-handed, while those emitted in decay are predominantly right-handed. Based on the leading order effective Hamiltonian, the amplitude for the emission of wrong-helicity photons is suppressed by a factor [141], where for transitions and for transitions. More detailed treatments, including QCD corrections, give a suppression as [142].
New Physics can modify this suppression without introducing any new violating phase. Measurements of the photon polarization therefore provide an approach to search for New Physics that is complementary to those based on rates and asymmetries.
Several different methods of measuring the photon polarization have been suggested. The only approach that has been attempted to date uses mixing-induced asymmetries to probe the level of interference between and decays [141, 143]. Even with the inclusion of the QCD corrections discussed above (see also [144]), recent calculations show that the Standard Model prediction is below [145, 146, 147]. The current experimental world average is [148, 149, 12]. The statistical uncertainty dominates the error.
Some care is required to extrapolate this result to Super luminosities. The critical feature is that the location of the decay vertex is reconstructed from the (decaying via ) using constraints on the beam spot position. This is only effective if the decay occurs inside the vertex detector, a larger silicon detector therefore results in better precision and efficiency. This effect, already clearly visible in a comparison of the BABAR [148] and Belle [149] results, should also be taken into account when considering other modes from which time-dependent information is extracted in a similar manner, particularly and .
Since the Super vertex detector is likely to have a similar radius to the current BABAR detector (see Section 4), we estimate the precision that will be reached by extrapolating the most recent BABAR results (, obtained from [148]). This suggests that a precision of can be reached with , close to the expected systematic limit, and also at a level where theoretical uncertainties become important. It is interesting to note that a data-driven method to control the theoretical errors exists [143].
It will also be possible to apply the same approach with different final states. Measurements of the mixing-induced violation parameters will be done with additional exclusive channels, such as [150, 151] and [152, 153]. In addition, the exclusive channels and can be used. Note that these channels do not rely on the vertexing discussed above. Estimates are that a precision of on can be achieved with . This quantity is predicted to be unobservably small in the Standard Model, since it is suppressed not only by the photon polarization, but also by the cancellation of the weak phase in mixing with that in the decay. A measurement of a non-zero would be an unmistakable sign of New Physics.
There are also other techniques to probe photon polarization with Super luminosity. These include approaches in which interference between different resonances [154, 155, 156] or different helicity states [157] of the hadronic recoil system provide sensitivity to the polarization, and also those in which the photon converts to an pair [158, 159]. Although the current Factory data has not yet yielded results using these approaches, various studies indicate that these methods will provide competitive and complementary measurements of the photon polarization with Super luminosity [45, 46, 160].
Radiative Decays : and
The electroweak penguin decays and are also highly sensitive to New Physics. The phenomenology is different, however, since different operators contribute to the decay amplitude. Furthermore, different observables are available: in addition to the rates and direct asymmetries, the forward-backward asymmetry () is known to be particularly sensitive to the presence of new particles in the loops [161, 162, 163]. Within the Standard Model, is caused by electroweak effects, and its shape as a function of the dilepton invariant mass-squared is predicted with quite small theoretical uncertainty, particularly at low values of . Notably, is expected to have a zero at , while in Standard Model extensions this zero can be at a different position or even absent [164, 165, 166, 167, 168]. As for the case, theoretical calculations for have recently been advanced to NNLO [169, 170, 171, 172, 173, 174] (see [175] for a recent review).
Considering first the exclusive channels with charged lepton pairs, the current situation is that the exclusive modes and (for ) have been used to study rates, direct asymmetries and the forward-backward asymmetry (which is zero for ). The results from BABAR [176] and Belle [177] on are shown in Fig. 8. The current results show some enticing hints of New Physics effects, but the precision of the Factories is not sufficient to make the required stringent tests. The first limit on an exclusive mode was recently announced by BABAR [178]. If the rates are at the Standard Model level, detailed studies of these channels can be made at Super.
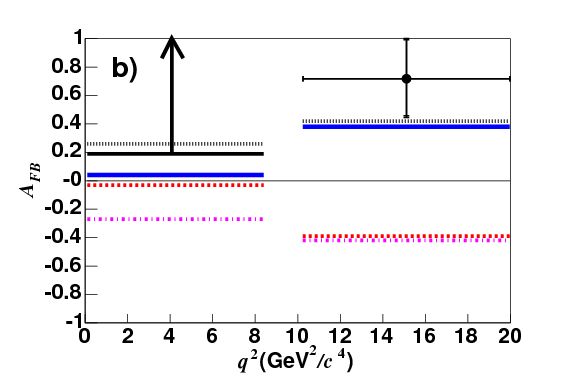
|
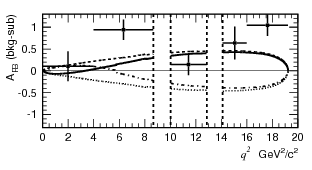
|
The expected precision on observables of interest is shown in Table 2. It should be noted that the decays and are among the modes that can be studied at a hadron machine (with ). Again, Super can study a larger set of interesting channels, and can also measure the parameters for the inclusive decays, which have smaller theoretical uncertainties. Initial studies of the exclusive process carried out at the Factories [179, 180], indicate that Super will be able to probe the asymmetries down to the phenomenologically interesting percent level.
Radiative decay :
It is also interesting to study channels in which the emitted leptons are neutrinos – modes closely related to the oft-cited and decays [181, 182, 183, 184, 185, 186, 187]. Since there are two neutrinos in the final state, studies of these decays are extremely challenging: they can only be done at a Super Flavour Factory. Branching fractions measurements can be done using the technique described for above. Both BABAR [188] and Belle [189] have used this strategy to obtain limits of at the level of , about an order of magnitude above the Standard Model expectation. As is the case for other analyses using a similar reconstruction technique, there are significant backgrounds from events with undetected soft particles or mesons. Improvements in detector hermeticity and in the ability to better veto events containing mesons can improve the sensitivity. We therefore expect that with Super statistics, the branching fraction can be measured with about relative error. A cut on the momentum of the kaon would significantly reduce the background, but could complicate the interpretation of the results.
Other exclusive channels, such as , can also be studied at Super; the sensitivity is such that it should also be possible to observe . However, it is worth noting that these channels suffer irreducible backgrounds from with hadronic decays of the lepton.
It will also be interesting to pursue the analysis of , where the observation of a signal would be a clear sign of New Physics (see also Section 2).
Charmless Hadronic Decays
Studies of charmless hadronic decays are in principle highly sensitive to New Physics contributions, yet in practice many effects, both in rates and in direct asymmetries, are obscured by theoretical uncertainties.
A notable class of measurements are the sum rules between rates and asymmetries in and decays to final states [190, 191, 192, 193, 194, 195]. These are sensitive to New Physics effects, in, for example, the EWP sector. The complete set of measurements necessary for this kind of test can only be performed at a Super Factory. With , the precision of these tests can reach – [47]. Yet, for these, as well for other hadronic decays, the meaningful extraction of information on fundamental Standard Model and New Physics parameters requires a model-independent check, preferably on data, of the approximations on which theoretical predictions are based. To this end, general parameterizations of the hadronic amplitudes [196, 197, 198], together with the full set of measurements of non-leptonic decays performed at Super, may prove useful.
Decays to multibody final states contain additional information in the distribution of the final state particles. Measurements of vector-vector final states can probe the Standard Model predictions for the polarization [200, 201, 202]. Although there may, in general, still be significant hadronic uncertainties, there are classes of observables that are relatively clean, such as -odd triple product asymmetries [203, 204, 205, 206]. Studies of the Dalitz plot distributions of three-body charmless decays allow the relative phases between the interfering resonant intermediate states to be determined, allowing measurements that cannot be achieved for the equivalent two-body decays [207, 208, 209].
Finally, it should be pointed out that measurements of rates and asymmetries in charmless hadronic decays provide an excellent testing ground for theoretical models [210, 211, 212, 213, 214, 215, 216, 199]. The comprehensive measurements that can be performed at a Super Factory will be essential for efforts to improve our understanding of various theoretical issues related to hadronic amplitudes (factorization, power corrections, flavour-symmetry breaking, etc.) and reduce the associated theoretical uncertainties.
4 Other Measurements
We will not attempt to describe all the measurements that can be performed by a Super Flavour Factory running at the , but several important modes have not yet been mentioned.
Semileptonic Asymmetry
The semileptonic asymmetry probes violation in mixing, giving the system equivalent of the kaonic violation parameter . Within the Standard Model is expected to be [217, 218, 219, 220]. A larger value would be indicative of New Physics. Since this measurement directly probes violation in transitions, it has a large phenomenological impact.
Two different methods have been exploited to measure at the current Factories. In the first, events with two high momentum leptons are selected, to obtain a sample in which both mesons decayed semileptonically. The background from charged pairs can be separated using the vertex information of the two leptons to evaluate the proper time difference between the decays of the two mesons. Corrections for other background events, typically from misidentification of hadronic tracks, or from events in which one lepton originates from a charm decay, can be made based on Monte Carlo and data control samples. After further corrections for possible differences in efficiencies for reconstruction of positive and negative leptons, the semileptonic asymmetry is obtained from the difference in the numbers of events with two like-charged leptons:
| (7) |
Measurement of allows the extraction of the mixing parameters and :
| (8) |
The second method is similar, but requires one of the leptons to originate from a partially or fully reconstructed semileptonic or hadronic decay. This reduces the backgrounds, and in principle allows finer modelling of detector and background charge asymmetries, resulting in a reduced systematic error, at some cost to the statistics. However, it must be noted that highly detailed studies on large data and Monte Carlo samples are necessary in order to control systematic effects. Moreover, with the Super data set, a similar analysis could be performed where both decays are partially or fully reconstructed. This approach would carry a lower efficiency, but also a reduced background and a potentially smaller systematic uncertainty.
Clearly, controlling the systematic uncertainties will be the most difficult issue for this measurement at Super. However, the capability to use different experimental approaches provides a significant handle on systematic effects. It may be possible to push the precision to the or below, potentially allowing the Standard Model violation in mixing to be seen. This would be an impressive achievement that would constrain many New Physics models [224].
Tests of Fundamental Symmetries
The analyses described above for the measurement of violation in mixing can be extended to include additional free parameters. These can lead to precise constraints on the neutral meson lifetime difference parameter , and can further be used to search for violation effects [225]. The precision achieved by the current Factories [222, 226] could be improved by an order of magnitude assuming a slight improvement in the systematic uncertainties. Other fundamental tests of quantum mechanics, such as the Bell inequality [227, 228] test of the Einstein-Podolsky-Rosen locality principle [229] are also possible [230, 231].
5 Summary of Experimental Reach
As described in this section, Super, with an expected integrated luminosity of can perform a wide range of important measurements and dramatically improve upon the results from the current generation of Factories. The expected sensitivities for some of the most important measurements are summarized in Tables 1 and 2. Many of these measurement cannot be made in a hadronic environment, and are unique to Super.
| Observable | Factories () | Super () |
|---|---|---|
| () | 0.018 | 0.005 () |
| () | 0.30 | 0.05 |
| () | 0.10 | 0.02 |
| () | 0.20 | 0.04 |
| 0.10 | 0.02 | |
| 0.20 | 0.03 | |
| 0.13 | 0.02 () | |
| 0.05 | 0.01 () | |
| 0.15 | 0.02 () | |
| 0.15 | 0.02 () | |
| 0.17 | 0.03 () | |
| 0.12 | 0.02 () | |
| (, eigenstates) | ||
| (, suppressed states) | ||
| (, multibody states) | ||
| (, combined) | – | |
| () | ||
| ( | – () | |
| ( | ||
| (combined) | – () | |
| (, ) |
| Observable | Factories () | Super () |
|---|---|---|
| (exclusive) | () | () |
| (inclusive) | () | () |
| (exclusive) | () | () |
| (inclusive) | () | () |
| () | ||
| visible | ||
| ) | () | |
| ) | ||
| () | ( ) | |
| 0.05 | ||
| () | () | |
| () | ||
| 0.15 | () | |
| possible | ||
| visible | ||
| – | possible |
It can be useful to schematically classify the various results in two categories:
-
•
Searching for New Physics
Many of the measurements that can be made at Super are highly sensitive to New Physics effects, and those with precise Standard Model predictions are potential discovery channels. As an example: the mixing-induced asymmetry parameter for decays can be measured to a precision of , as can equivalent parameters for numerous hadronic decay channels dominated by the penguin transition. These constitute very stringent tests of any New Physics scenario which introduces new violation sources, beyond the Standard Model. Similarly, direct asymmetries can be measured to the fraction of a percent level in decays, using both inclusive and exclusive channels, and can be equally thoroughly explored. At the same time, Super can access channels that are sensitive to New Physics even when there are no new sources of violation phases, such as the photon polarization in , and the branching fractions of , the latter being sensitive probes of New Physics in MFV scenarios with large . Any of these measurements constitutes clear motivation for Super. -
•
Future metrology of the CKM matrix
As discussed further in Section 6 below, there are several measurements which are unaffected by New Physics in many likely scenarios, and which allow the extraction of the CKM parameters even in the presence of such New Physics effects. Among these, the angle can be measured with a precision of –, where the precision is limited only by statistics, not by systematics or by theoretical errors. By contrast, the determination of the elements and will be limited by theory, but the large data sample of Super will allow many of the theoretical errors to be much improved. With anticipated improvements in lattice QCD calculations (as discussed in Section 5), the precision on and can be driven down to the percent level, and to a fraction of a percent, respectively. These measurements could allow tests of the consistency of the Standard Model at a few per mille level and provide the New Physics phenomenological analyses with a determination of the CKM matrix at the percent level.
Comparison with LHC
Since Super will take data in the LHC era, it is reasonable to ask how the physics reach compares with the physics potential of the LHC experiments, most notably LHC. By 2014, the LHC experiment is expected to have accumulated of data from collisions at a luminosity of . We use the most recent estimates of LHC sensitivity with that data set [232] in the following.
The most striking outcome of any comparison between Super and LHC is that the strengths of the two experiments are largely complementary. For example, the large boost of the hadrons produced at LHC allows studies of the oscillations of mesons (see the discussion in Section 3). It is particularly important to stress that many of the measurements that constitute the primary physics motivation for Super cannot be performed in the hadronic environment. For example, modes with missing energy, such as and , measurements of the CKM matrix elements and , and inclusive analyses of processes such as are unique to Super. LHC has limited capability for channels containing neutral particles, or in studies where the analysis requires that the decay vertex be determined from a meson, precluding measurements of photon polarization via mixing-induced violation in . Furthermore, the sensitivity of LHC to possible New Physics effects in hadronic penguin decays is seriously compromised, since none of , , or can be well studied. Super, on the other hand, can measure the asymmetries in all of these modes and more.
Where there is overlap, the strength of the Super program in its ability to use multiple approaches to reach the objective becomes apparent. For example, LHC may potentially be able to measure to about precision using , but would not be able to access the full information in the and channels, which is necessary to drive the uncertainty down to the – level of Super. Similarly, LHC can certainly measure through mixing-induced violation in decay to high accuracy (about 0.01), but will not be able to make the complementary measurements (e.g., in and ) that help to ensure that the theoretical uncertainty is under control. Super is likely to have an advantage of a factor of two to three in the precision for the angle with respect to LHC, with further improvements possible.
LHC can make a precise measurement of the zero of the forward-backward asymmetry in , but Super can also measure the equivalent mode for charged decay, as well as the corresponding mode with an pair, and the inclusive channel . The broader program of Super thus provides a more comprehensive set of measurements. As discussed in more detail below, this will be of great importance for the study of flavour physics in the LHC era.
The comparison with LHC for some specific topics on physics is given in Section 3 which discusses the physics case for running at the .
6 Phenomenological Impact
Determination of UT Parameters at Super
In this section we discuss the determination of the CKM parameters – at Super.
We start by assuming the validity of the Standard Model. Most of the measurements described in the previous section can be used to select a region in the – plane as shown in Fig. 9. The corresponding numerical results are given in Table 3.
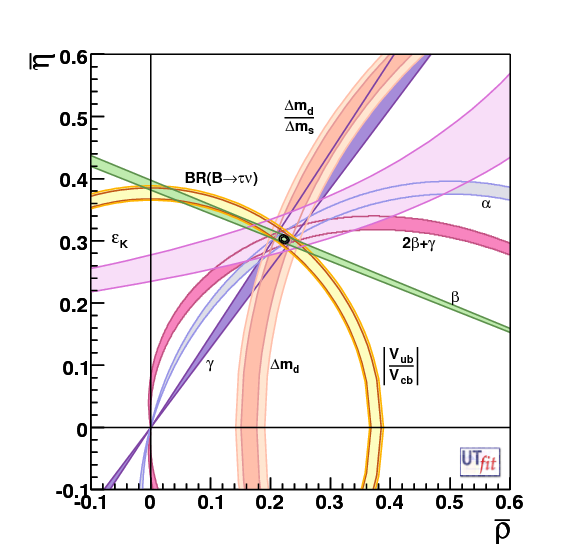
| Parameter | SM Fit today | SM Fit at Super |
|---|---|---|
| (∘) | ||
| (∘) | ||
| (∘) |
The results shown in Fig. 9 and in Table 3 indicate that a precision of a fraction of a percent can be reached, significantly improving the current situation, and providing a generic test of the presence of New Physics at that level of precision.
This is done assuming the validity of the Standard Model. Many of the measurements used for the Standard Model determination of – can, however, be affected by the presence of New Physics. Unambiguous New Physics searches require a determination of and in the presence of arbitrary New Physics contributions.
It is straightforward to generalize the Standard Model analysis including generic New Physics effects in processes. In fact, those processes can be described by a single amplitude and parameterized, without loss of generality, in terms of two New Physics parameters, that quantify the ratio of the full amplitude to the Standard Model amplitude [233, 234, 235, 236, 237]. Thus, for instance, in the case of – mixing we define
| (9) |
where includes the Standard Model box diagrams only, while includes also the New Physics contributions. In the absence of New Physics effects, by definition and . A subset of the Super measurements, those of tree level and mixing-related processes, can be used.
For instance, the experimental quantities determined from – mixing are related to their Standard Model counterparts and the New Physics parameters by the following relations:
| (10) |
The use of in this context deserves explanation. In principle, the extraction of from decays is affected by New Physics effects in transitions. However, New Physics effects can be reabsorbed in a redefinition of the hadronic parameters, as long as they induce only transitions. In this case they do not prevent the extraction of [238, 239]. Thus, information on can be used to constrain and independently of New Physics contributions [5]. In the case of large New Physics contributions, however, such as large EWP-like New Physics, the measurement of cannot be used as a New Physics-independent constraint.
The numerical results are given in Table 4. The precision of the CKM parameters obtained in the presence of generic New Physics is not drastically worse than that of the Standard Model fit (Table 3), and remains at the subpercent level. This is a good starting point for New Physics analyses, which require the model-independent determination of the CKM parameters as an input.
| Parameter | New Physics fit today | New Physics fit at Super |
|---|---|---|
| (∘) | ||
| (∘) | ||
| (∘) |
New Physics Contributions in Processes
The fit using amplitudes with generic New Physics contributions also allows us to obtain constraints on the New Physics parameters and , which in turn provide information on the extent to which the experimental data allow for New Physics in amplitudes [5]. The numerical results are given in Table 5. To illustrate the impact of the measurements at Super, in Fig. 10 we show the allowed regions in the – plane, as compared to the current situation.
| Parameter | New Physics fit today | New Physics fit at Super |
|---|---|---|
| (∘) |
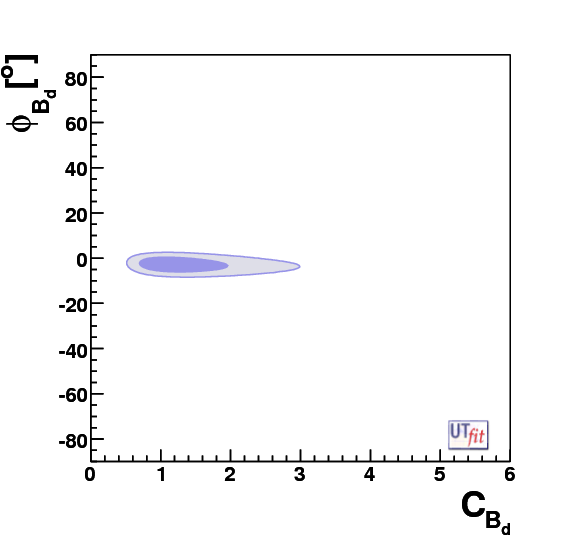 |
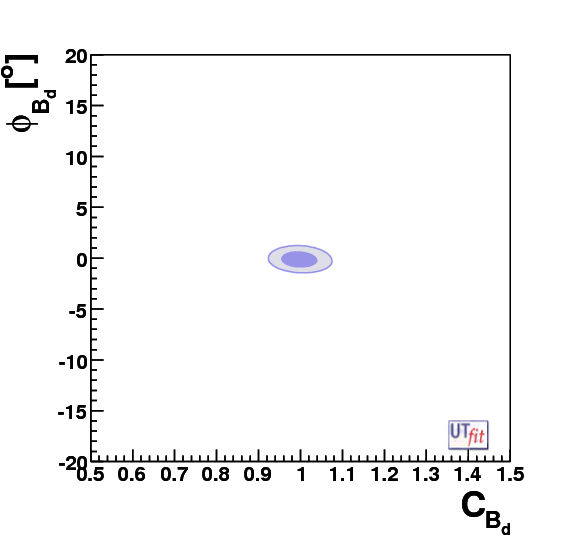 |
It is important to note that the reduction of the uncertainty on the parameter is largely due to the expected improvement of lattice calculations discussed in the Section 1. By contrast, the impressive progress in the determination of is due to the improved precision of the experimental quantities measured at Super.
New Physics in Models with Minimal Flavour Violation
We now specialize to the case of Minimal Flavour Violation (MFV) [240, 241, 242]. The basic assumption of MFV is that New Physics does not introduce new sources of flavour and violation. Hence the only flavour-violating couplings are the Standard Model Yukawa couplings. In the simplest case with one Higgs doublet (or two Higgs doublets with small ), one can safely assume that the top Yukawa coupling is dominant, so that all New Physics effects amount to a real contribution added to the Standard Model loop function generated by virtual top exchange. In particular, considering the amplitude, MFV New Physics can be parameterized as
where the function represents the top contribution in the box diagrams and is the New Physics contribution. Therefore, in this class of MFV models, the New Physics contribution to all processes is universal, and the effective Hamiltonian retains the Standard Model structure.
Following ref. [242], this value can be converted into a New Physics scale using
| (11) |
where is the Standard Model scale, is the top Yukawa coupling, is the New Physics scale and is an unknown (but real) Wilson coefficient of .
The UT analysis can constrain the value of the New Physics parameter together with and . In the absence of a New Physics signal, is distributed around zero. From this distribution, we can obtain a lower bound on the New Physics scale .
For the 1HDM and 2HDM in the low regime, the combination of Super measurements and the improved lattice results gives
| (12) |
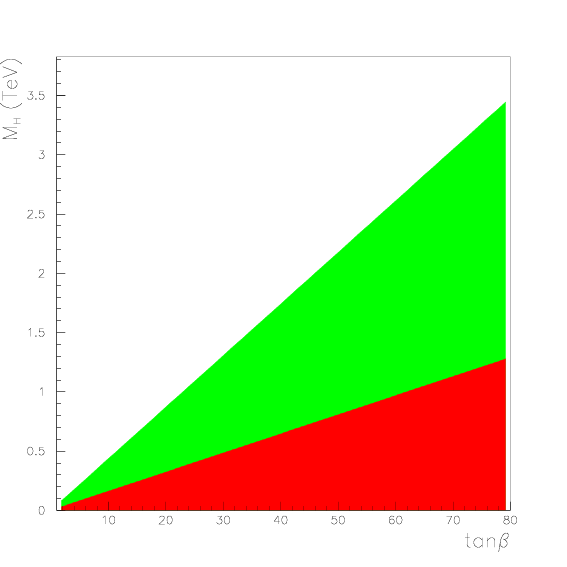 |
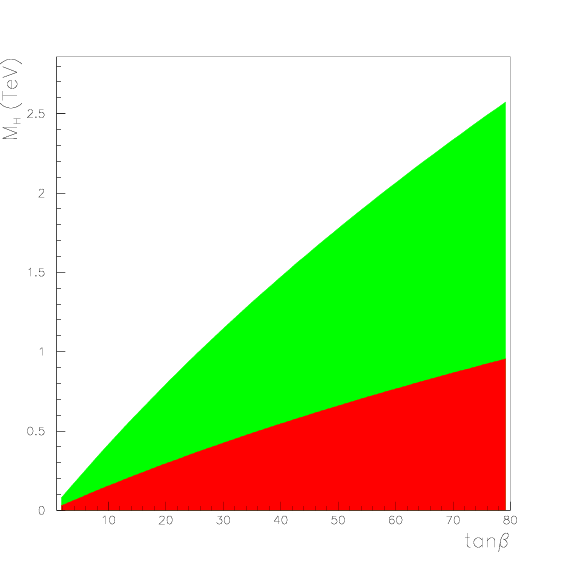 |
These bounds are a factor of three larger than those available today [5]. This means that even in the “worst case” scenario, i.e., in models with MFV at small , the sensitivity of flavour-violating processes to New Physics is strong enough to allow for the study of the flavour-violating couplings of new particles with masses up to GeV. This conversion to a New Physics scale in the MFV case deserves explanation. We should consider that the Standard Model reference scale corresponds to virtual -exchange in the loops. As MFV has the same flavour violating couplings as the Standard Model, the MFV-New Physics scale is simply translated in a new virtual particle mass as . It must be noted, however, that as soon as one considers large , or relaxes the MFV assumption in this kind of analysis, the New Physics scale is raised by at least a factor of , covering the whole range of masses accessible at the LHC. In fact the RGE-enhanced contribution of the scalar operators (absent in the small MFV case) typically sets bounds an order of magnitude stronger than that on the Standard Model current-current operator, correspondingly increasing the lower bound on the New Physics scale. This is the case, for instance, of the NMFV models discussed in ref. [243] as described in the analysis of ref. [244].
The large scenario offers additional opportunities to reveal New Physics by enhancing flavour-violating couplings in processes with virtual Higgs exchange. This can be the case in decays such as or whose branching ratios are strongly affected by a charged Higgs for large values of . In Fig. 11 we show the region excluded in the – plane by the measurement of with the precision expected at the end of the current Factories and at Super, assuming the central value given by the Standard Model. It is apparent that Super pushes the lower bound on , corresponding, for example, to from the hundreds of GeV region up to about 2 TeV, both in the 2HDM-II and in the MSSM. Another interesting possibility is looking at LFV by measuring the ratio , which could have a deviation from its Standard Model value at large [245, 246], whereas the relative error on the individual branching fraction measurements at Super is expected to be or less, see Table 2.
MSSM with Generic Squark Mass Matrices
We now discuss the impact of Super on the parameters of the MSSM with generic squark mass matrices parameterized using the mass insertion (MI) approximation [247]. In this framework, the New Physics flavour-violating couplings are the complex MIs. For simplicity, we consider only the dominant gluino contribution. The relevant parameters are therefore the gluino mass , the average squark mass and the MIs , where are generation indices and refer to the helicity of the SUSY partner quarks. For example, the parameters relevant to transitions are the two SUSY masses and the four MIs . To simplify the analysis, we consider the contribution of one MI at a time. This is justified to some extent by the hierarchy of the present bounds on the MIs. Barring accidental cancelations, the contributions from two or more MIs would produce larger New Physics effects and thus make the detection of New Physics easier, while simultaneously making the phenomenological analysis more involved. The analysis presented here profits from results and techniques developed in Refs. [248, 249, 250].
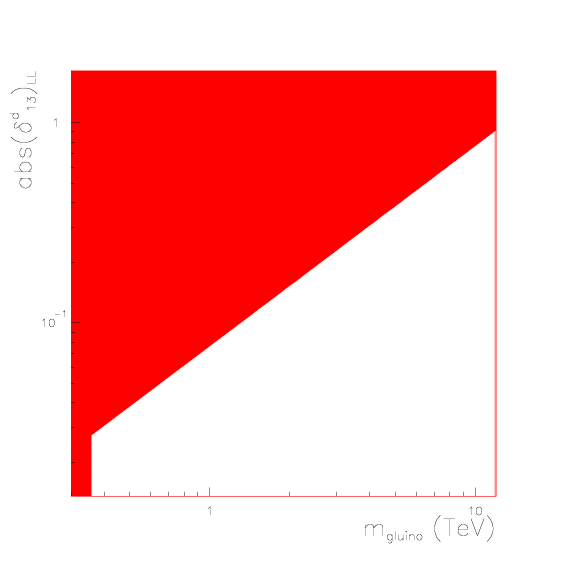 |
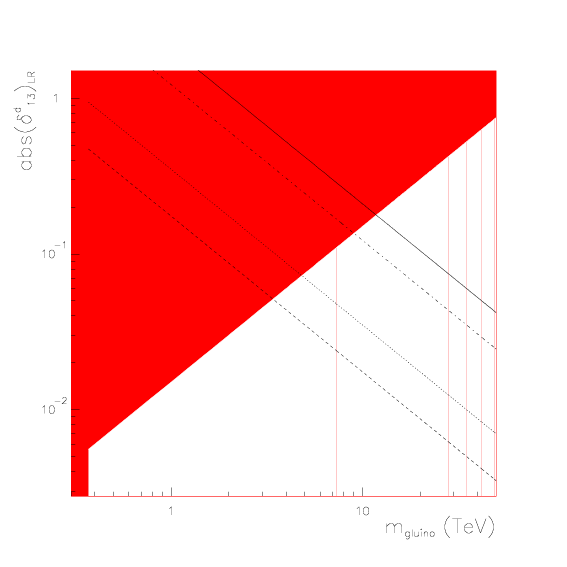 |
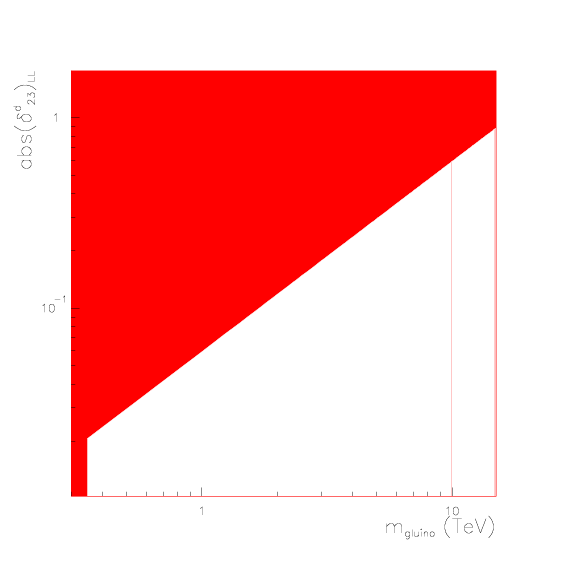 |
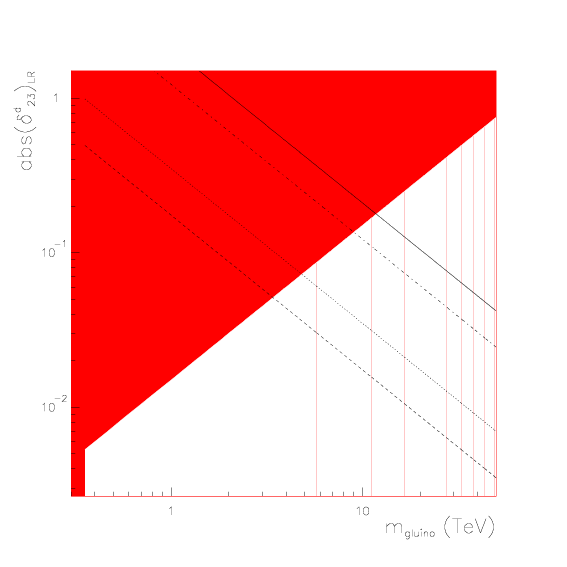 |
The aim of this analysis is twofold. On the one hand, we want to show the bounds on the MSSM parameter space as they would appear at Super. For this purpose, we first simulate the signals produced by the MSSM for a given value of one MI. Then we check how well we are able to determine this value using the constraints coming from Super. In particular, we are interested in ascertaining the range of masses and MIs for which clear New Physics evidence, indicated by a non-vanishing value of the extracted MI, can be obtained. In Fig. 12 we show for some of the different MIs, the observation region in the plane – obtained by requiring that the absolute value of the reconstructed MI is more than away from zero. For simplicity we have taken . From these plots, one can see that Super could detect New Physics effects caused by SUSY masses up to – TeV, corresponding to . Even larger scales could be reached by MIs, although overly large LR MIs are known to produce charge- and colour-breaking minima in the MSSM potential [251]. This can be avoided by imposing the bounds shown in the LR plots of Fig. 12. These bounds decrease as and increase linearly with . Taking them into account, we can see that LR MIs are still sensitive to gluino masses up to – TeV for between 5 and 60.
Fig. 12 shows the values of the MI that can be reconstructed if SUSY masses are below TeV. In the cases considered we find –, –, – and –. These value are typically one order of magnitude smaller than the present upper bounds on the MIs [252].
Figures 13 and 14 display examples of the allowed region in the plane – with a value of allowed from the present upper bound, TeV and using the Super measurements as constraints. In particular, Fig. 13 shows the selected region in the – using the measurements of , and as constraints, together with the distributions of the reconstructed value of the modulus and the phase of the MI. In this case, the CKM angle and the mass difference are the crucial constraints, although accurate determination of the CKM parameters and is crucial in order to separate New Physics contributions.
The plots for the case are shown in Fig. 14. Here the relevant constraints come from , , , , and . It is apparent the key role of together with the branching ratios of and . The zero of the forward-backward asymmetry in , missing in the present analysis, is expected to give an additional strong constraint, further improving the already excellent extraction of shown in Fig. 14.
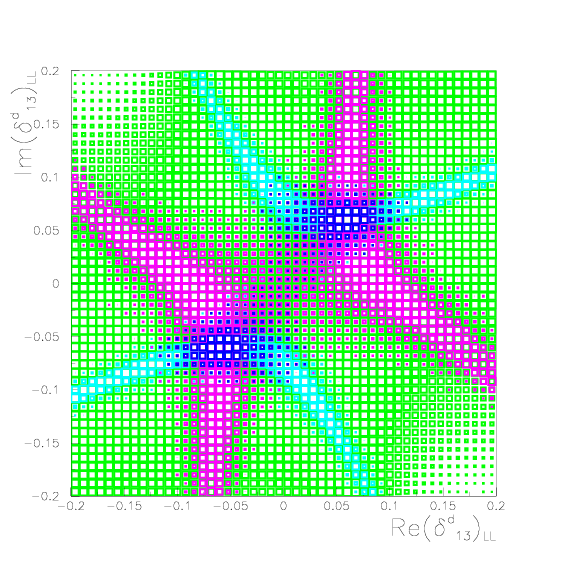
|
|
|---|---|
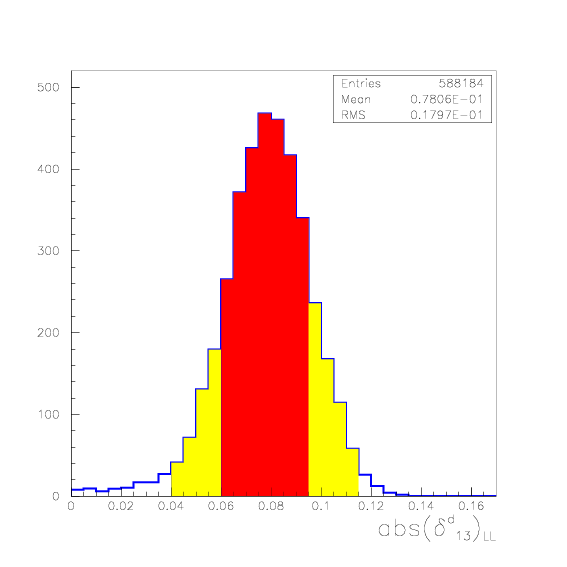 |
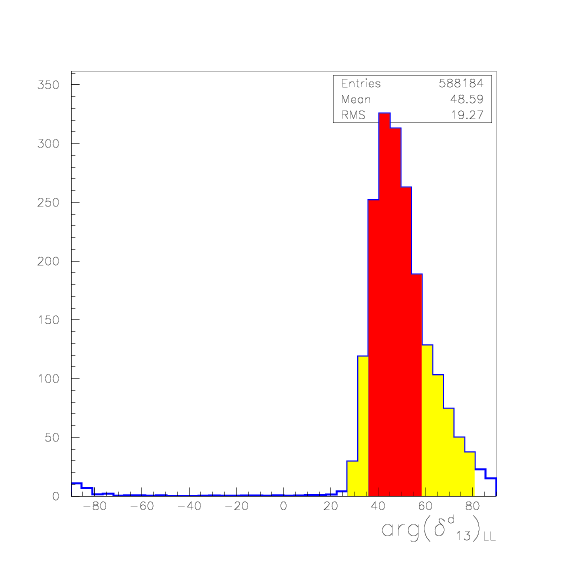 |
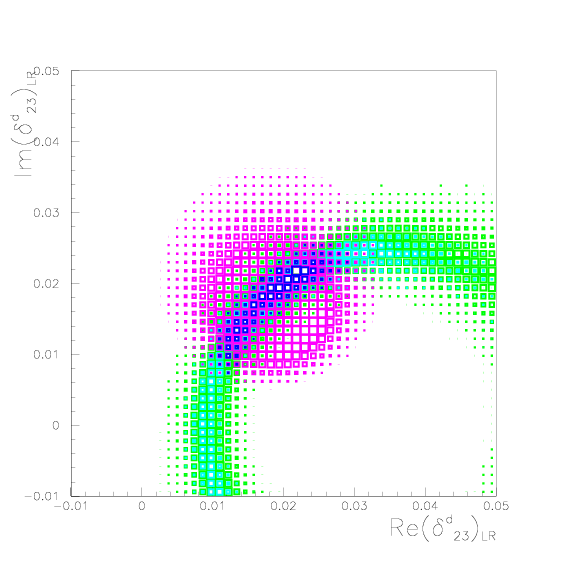
|
|
|---|---|
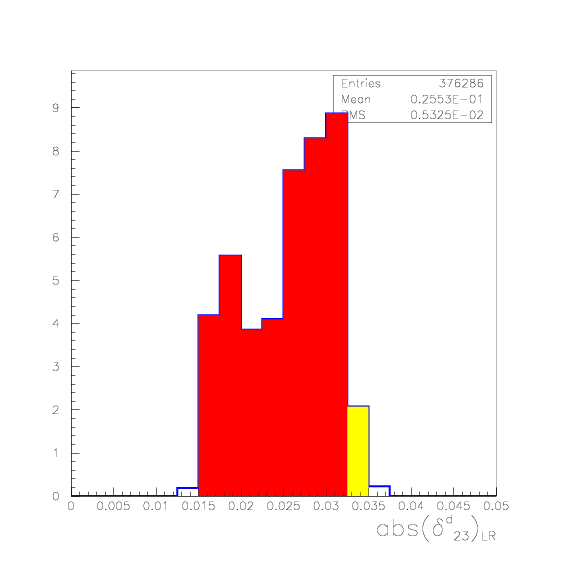 |
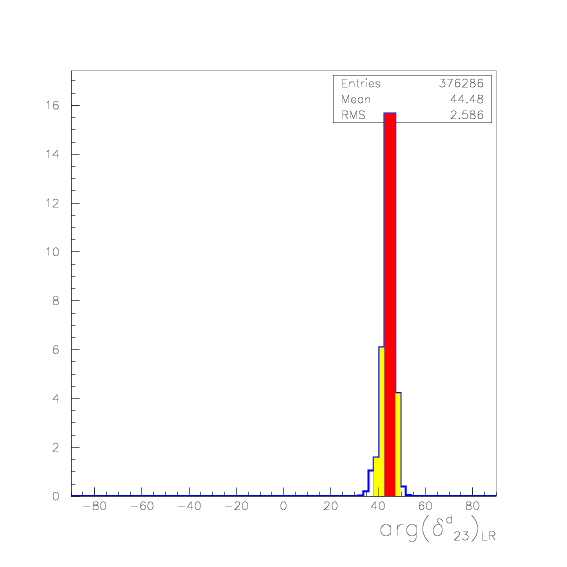 |
2 Physics
1 Lepton Flavour Violation in Decays
The search for FCNC transitions of charged leptons is one of the most promising directions to search for physics beyond the Standard Model. Neutrino physics has provided unambiguous evidence for non-conservation of lepton flavour. We therefore expect this phenomenon to also occur in the charged lepton sector, although, if the light neutrino mass matrix () is the only source of lepton flavour violation (LFV), FCNC transitions of charged leptons occur well below any realistic experimental sensitivity. However, in many realistic extensions of the Standard Model this is not the case. In particular, the small value of is naturally explained by a strong suppression associated with the breaking of total lepton number (LN), which is not directly related to the size of LFV interactions. As a result, there exist various well-motivated scenarios where LFV decays of charged leptons occur just below the present experimental bounds (given in Table 6).
Rare FCNC decays of the lepton are particularly interesting since LFV sources involving the third generation are naturally the largest. In particular, searches for at the level or below are extremely interesting, even taking into account the present stringent bounds on . In the following we will illustrate this point both within the explicit example of the MSSM with right-handed neutrinos, and by means of a general effective-theory approach. In all cases, the comparison of experimental results on with those for and other LFV rare decays provides a unique tool to identify in detail the nature of the New Physics model.
Low-energy Supersymmetry
A generic low-energy SUSY model with arbitrary mixing in the soft-breaking parameters would induce unacceptably large flavour-violating effects. Limits on departures from Standard Model expectations in quark FCNC transitions motivate the assumption of flavour-universality of the SUSY breaking mechanism. Even with this assumption, however, sizable flavour-mixing effects can be generated at the weak scale by the running of the soft-breaking parameters from the (presumably high) scale of SUSY-breaking mediation. In the leptonic sector, the relevance of such effects strongly depends on the assumptions about the neutrino sector. If the light neutrino masses are obtained via a see-saw mechanism, then the induced flavour-mixing coupling relevant to LFV rates are naturally large [253].
Assuming a see-saw mechanism with three heavy right-handed neutrinos, the effective light-neutrino mass matrix obtained by integrating out the heavy fields is:
| (13) |
where is the right-handed neutrino mass matrix (which breaks LN), are the Yukawa couplings between left- and right-handed neutrinos (the potentially large sources of LFV), and is the vacuum expectation value of the up-type Higgs boson. The LFV effects on charged leptons originate from any misalignment between fermion and sfermion mass eigenstates. Taking into account the renormalization-group evolution (RGE), the slepton mass matrix acquires LFV entries given by
| (14) |
where denotes the scale of SUSY-breaking mediation and the universal SUSY breaking scalar mass. Since the see-saw equation 13 allows large entries, sizable effects can result from this running.
A complete determination of would require a complete knowledge of the neutrino Yukawa matrix , which is not possible using only low-energy observables from the neutrino sector. This is in contrast with the quark sector, where similar RGE contributions are completely determined in terms of quark masses and CKM matrix elements. As a result, the predictions of FCNC effects in the lepton sector usually have sizable uncertainties.
More stable predictions can be obtained by embedding the SUSY model within a Grand Unified Theory (GUT), such as , where the see-saw mechanism can naturally arise. In this case, the GUT symmetry allows us to obtain some hints about the unknown neutrino Yukawa matrix . Moreover, in GUT scenarios there are other contributions stemming from the quark sector [254, 255]. These effects are completely independent of the structure of and can be regarded as new irreducible LFV contributions within SUSY GUTs. For instance, within , as both and are hosted in the 10 representation, the CKM matrix mixing of the left handed quarks gives rise to off-diagonal entries in the running of the right-handed slepton soft masses [254, 255].
| Process | Present bound |
|---|---|
| ) | [256] |
| ) | [257] |
| ) | [258] |
| ) | [259] |
| ) | [260] |
| ) | [261] |
| CR( in Ti) | [262] |

Once non-vanishing LFV entries in the slepton mass matrices are generated, LFV rare decays are naturally induced by one-loop diagrams with the exchange of gauginos and sleptons (gauge-mediated LFV amplitudes). An order-of-magnitude approximation for is
| (15) |
where is a typical SUSY mass running in the loop, and, as usual, denotes the ratio of the two MSSM Higgs vacuum expectation values. Besides , there are also other promising LFV channels, such as , that could be measured with the upcoming experimental sensitivities. However, in the case of gauge-mediated LFV amplitudes the decays are dominated by the dipole transition, which leads to the unambiguous prediction:
| (16) |
In Fig. 15, we show the prediction for within a SUSY SO(10) framework for the accessible LHC SUSY parameter space , and [264]. Note that the scenarios where and where can be distinguished by the measurement of at Super.
An independent (and potentially large) class of LFV contributions to rare decays comes from the Higgs sector: if the slepton mass matrices have LFV entries and the effective Yukawa interaction includes non-holomorphic couplings, Higgs-mediated LFV amplitudes are necessarily induced [265]. Interestingly enough, gauge- and Higgs-mediated LFV amplitudes lead to very different correlations among LFV processes [266, 267]. In particular, the relation (Eq. 16) does not hold for Higgs-mediated LFV amplitudes. Thus, if several LFV transitions are observed, a correlated analysis could shed light on the underlying mechanism of LFV [266, 267, 268].
Effective-theory Approaches
All Standard Model extensions having new degrees of freedom at the TeV scale and carrying flavour quantum numbers face severe constraints from low-energy FCNC measurements. An economical and elegant solution to this flavour problem is provided by the MFV hypothesis, namely by the assumption that the irreducible sources of flavour symmetry breaking are minimally linked to the fermion mass matrices observed at low energy. This hypothesis guarantees the suppression of FCNC rates to a level consistent with experimental constraints, without resorting to unnaturally high scales of New Physics, and allows the description of New Physics effects in low-energy observables by means of a general and falsifiable effective theory approach.
The MFV hypothesis has a strong motivation and a unique realization in the quark sector [269, 270, 242]: the Standard Model Yukawa couplings are the only sources of breaking of the quark-flavour symmetry group (see Section 6 for tests of MFV in the quark sector). Apart from arguments based on the analogy with quarks, the introduction of a Minimal Lepton Flavour Violation (MLFV) principle [271] is motivated by a severe fine-tuning problem in the lepton sector: within a generic effective theory approach, the non-observation of implies an effective New Physics scale above unless the LFV coupling of the corresponding operator is suppressed by some symmetry principle.
The implementation of a MFV principle in the lepton sector is not as simple as in the quark sector, since the neutrino mass matrix itself cannot be accommodated within the renormalizable part of the Standard Model Lagrangian. This implies that we need to employ an additional hypothesis to identify the irreducible flavour-symmetry breaking structures. The resulting effective theory can be viewed as a general tool to exploit the observable consequences of a specific (minimal) hypothesis about the irreducible sources of lepton-flavour symmetry breaking.
The most interesting MLFV ansatz is based on a see-saw mechanism with three heavy right-handed neutrinos and flavour symmetry. The latter forces to be proportional to the identity matrix in flavour space. As a result, the irreducible LFV sources are only Yukawa couplings (similar to the quark sector) and their structure can be determined by the lepton and neutrino mass matrices. The general consequences of this hypothesis can be summarized as follows [271]:
-
•
The overall normalization of LFV decay rates is largely unknown, being proportional to . Results close to the present exclusion bounds (Table 6) could arise in the presence of a large hierarchy between the scale of the new flavour degrees of freedom () and the scale of lepton number violation: .
-
•
Ratios of similar LFV decay rates are free from the normalization ambiguity and can be predicted in terms of neutrino masses and PMNS angles: violations of these predictions would unambiguously signal the presence of additional sources of lepton-flavour symmetry breaking. One of these predictions is the ratio (with dependence on the PMNS mixing angle and -violating phase ) Given the present bounds on , this implies within the MLFV framework.
Once we accept the idea that flavour dynamics obeys a MFV principle, both in the quark and in the lepton sector, it is interesting to ask whether and how this is compatible with a grand-unified theory (GUT), where quarks and leptons are in the same representations of a unified gauge group. This question has recently been addressed in ref. [272], considering the case of as an example. Within this framework, the largest group of flavour transformations commuting with the gauge group is , which is smaller than the direct product of the quark- and lepton-flavour groups allowed in a non-GUT framework [242]. We should therefore expect some violations of the MFV+MLFV predictions, either in the quark or in the lepton sector or in both. As far as LFV rates are concerned, the following phenomenological conclusions can be drawn [272]:
-
•
Contrary to the non-GUT MFV framework, the rate of LFV decays cannot be arbitrarily suppressed by lowering the average mass of the heavy . This fact can easily be understood by looking at the flavour structure of the relevant effective couplings. For transitions, the following combination appears:
(17) where the are couplings. In addition to the terms involving , already present in the non-unified case, the GUT group allows also -independent terms involving the quark Yukawa couplings. The latter become competitive for GeV and their contribution is such that for TeV the rate is above (i.e. within the reach of MEG [273]).
-
•
Improved experimental information on and is a key tool. Their comparison with is the best way to compare the relative size of the MLFV contributions with respect to the GUT-MFV contributions. In particular, if the quark-induced terms turn out to be dominant, then and , where . This implies a ratio of ), which allows to be just below the present exclusion bounds.
Little Higgs Models
Little Higgs Models address the tension between the naturalness of the electroweak scale and the precision electroweak measurements showing no eveidence for new physics up to TeV.
The Littlest Higgs model [274] is based on a non-linear sigma model. It is strongly constrained by the electroweak precision data due to tree-level contributions of the new particles.
Implementing an additional discrete symmetry, the so-called T-parity [275], makes the new particles contributing at the loop-level only and allows for a new-physics scale around GeV. It also calls for additional (mirror) fermions providing an interesting flavour phenomenology.
The high sensitivity for lepton flavour violation serves as an important tool to test the littlest Higgs model with T-parity (LHT), in particular to distinguish it from the MSSM [268]. Upper bounds on the branching ratio of lepton flavour violating decays are given in Table 7. Most of them could be within the reach of Super.
However, large LFV branching ratios are not a specific feature of the LHT but a general property of many new physics model including the MSSM. Nevertheless, as Table 8 clearly shows, specific corrrelations are very suitable to distinguish between the LHT and the MSSM. The different ratios are a consequence of the fact that in the MSSM the dipole operator plays the crucial role in these observables, while in the LHT the penguin and the box diagram contributions are dominant.
| decay | |
|---|---|
| ratio | LHT | MSSM (dipole) | MSSM (Higgs) |
|---|---|---|---|
| 0.4…2.3 | |||
| 0.4…2.3 | |||
| 0.3…1.6 | |||
| 0.3…1.6 | |||
| 1.3…1.7 | 0.3…0.5 | ||
| 1.2…1.6 | 5…10 |
Experimental Reach of LFV Decays
Experimentally, LFV decays can be conveniently classified as , and where is either an electron or muon and represents a hadronic system (e.g., , , , , etc.) The results of searches for LFV decays in data from BABAR and Belle are summarized in Table 6. There is no evidence for LFV violating decays and the individual experiments have each set confidence level (CL) limits of order using data sets of in the range of to .
The considerable experience developed in searching for these decays in large data sets enables us to make projections of the sensitivities to these decays with Super delivering roughly a 100-fold increase in the data set. We express the experimental reach in terms of “the expected CL upper limit” that can be reached assuming no signal, and, for brevity’s sake, refer to this as the “sensitivity”. In the absence of signal, for large numbers of background events , the CL upper limit for the number of signal events can be given as , whereas for small a value for is obtained using the method described in [276], which gives, for , . Schematically, the CL branching ratio upper limit is then
| (18) |
where is the number of -pairs produced in collisions; is the integrated luminosity, is the -pair production cross section and is the reconstruction efficiency. We have based our projections on BABAR analyses of , , and [256, 257, 258, 277] and Belle analyses of , , and [259, 278].
The experimental signature for LFV decays is extremely clean. In events at , the event can be divided into hemispheres in the center-of-mass frame, each containing the decay products of one lepton. Furthermore, unlike Standard Model -decays, which contain at least one neutrino, the LFV decay products have a combined energy in the center-of-mass frame equal to and a mass equal to that of the . A two dimensional signal region in the – plane therefore provides a powerful tool to reject background, which usually arise from well-understood Standard Model decays. Consequently, residual background rates and distributions can be reliably estimated from Monte Carlo.
The estimated physics reach of Super based on projections from existing analyses depends on how the background is treated. A “worst-case scenario” is obtained if identical analyses to those published by BABAR and Belle are repeated on a sample with more data: the expectations then simply scale as , which for large scales as . A “best case” scenario would take the current expected limit and scale linearly with the luminosity. This is equivalent to a statement that analyses can be developed maintaining the same efficiency and backgrounds as the current analyses.
For , there is an “irreducible background” from in which the photon from initial state radiation can be combined with a lepton to form a candidate that accidentally overlaps with the signal region in the – plane. In the existing BABAR analyses, these events account for approximately one fifth of the total background. We therefore consider a “realistic” scenario, in which this source of background is present at the rate determined with the existing analyses, while all other backgrounds are suppressed with minimal cost to the signal efficiency. Note, however, that improvements on this “realistic” scenario are possible if the mass resolution is improved, which could be achieved by improving the spatial resolution of the electromagnetic calorimeter (see Section 7). Additional signal-to-background gains can be made by restricting the polar-angle acceptance of the thereby reducing initial state radiation (ISR)-related backgrounds, at the cost of efficiency.
The situation for the other LFV decays, and , is even more promising, since these modes do not suffer from the aforementioned backgrounds from ISR. In this case, one can project sensitivities assuming comparable to backgrounds in existing analyses for approximately the same efficiencies. Table 9 summarizes the sensitivities for various LFV decays.
| Process | Sensitivity |
|---|---|
2 Lepton Universality in Charged Current Decays
Precise tests of lepton-flavour universality (LFU) in charged-current interactions (CCI) represent a complementary window on New Physics. In fact, within the Standard Model, possible departures from the LFU in decays, described by are predicted to be
| (19) |
and thus completely negligible.
Violations of LFU in CCI can be classified as:
i) corrections to the strength of the effective four-fermion interaction, ii) four-fermion interactions with new Lorentz structures.
As an example of class i), we mention the vertex correction through a loop of New Physics particles: the induced effect is of order , which is hardly measurable. Class ii) is definitely more promising: the typical example is the scalar current induced by tree level Higgs exchange, with mass-dependent coupling (). In this case, it has been shown that [279],
| (20) |
Note that the same relative effect can be seen in the ratio , which can be determined at the level at Super. A non-Standard Model effect at this level would have a rather precise interpretation within the MSSM: large and small . On the other hand, it must be stressed that a detailed re-analysis of the Standard Model predictions of such ratios within the Standard Model (which are fine with present techniques) would be necessary in view of very precise measurements.
As pointed out in Refs. [246, 245], precise tests of LFU in CCI represent a complementary window on Higgs-mediated LFV amplitudes. These effects are particularly interesting within the MSSM at large , and could rise to visible effects both in [246] and in decays [245]. However, while in the and cases sizable LFU breaking effects can be induced with only LFV couplings, in decays LFU breaking effects are mainly generated by LF-conserving (but mass-dependent) couplings, such as in Eq. (20), while LFV effects provide only a second order correction. From this point of view, the study of LFU breaking in , and decays can be regarded as complementary tools to shed light on New Physics effects, given their sensitivity to different New Physics contributions.
Charged Current Universality Measurements
Charged current universality is probed in decays via:
| (21) |
| (22) |
where the , and are CC couplings, all equal to unity in the Standard Model, but different from each other in extensions of the Standard Model; is a phase-space factor and are radiative corrections. Equation 21 indicates that can be determined from measurements of the masses and lifetimes of the and and the electronic branching fraction of the . A precise determination of is currently limited by the errors on the measurements of ) and of the lifetime. Using the world average values [280, 263] (, , ) the ratio of the to charged current coupling constants is found to be . The ratio of Eq. 21 to Eq. 22 indicates that only requires measurements of the two leptonic branching fractions. From world averages of these branching ratios, the ratio of the to charged current coupling constants is found to be .
Charged current universality can be probed at the level if measurements of leptonic branching ratios and the lifetime are controlled at better than . A determination of will require accurate control over: the differences in the trigger and filter efficiencies between events with an electron compared to those with a muon; differences in tracking efficiency for electrons and muons; the electron particle ID; the muon particle ID. The latter two can be determined from control samples in the data from -pair and radiative Bhabha events. As there will be cuts placed on the momentum spectra of the leptons, there will be some sensitivity to assumptions of the Lorentz structure of the decays that would have to be taken into account. Because this will depend on a relative measurement, the large data sample at Super will make it possible to trade-off considerable numbers of events to bring systematic errors under control. One can therefore expect to be determined to better than at Super.
More challenging will be a determination of , which will require an absolute measurement of the electronic branching fraction, as well as the lifetime. The absolute branching fraction measurement will require (in addition to the absolute trigger, filter, tracking, and particle ID efficiencies) the absolute luminosity to be known with precision better than . The LEP experiments, using specialized luminosity detectors, achieved a precision of , which was dominated by the theory cross section uncertainty. The cross sections will have to be calculated to a comparable precision. To improve the lifetime measurement, one must overcome the challenges of backgrounds and detector alignment, as well as selection biases. It is possible to approach a precision of . Consequently, it may be possible for to be determined to a precision of at Super.
Tests with the Lepton
The Super data set opens up a new window on tests of the third generation charged lepton from measurements of the difference between the lifetimes and masses of the and . The difference in lifetimes, , currently has a value of (the error is statistical only) from a preliminary BABAR result that uses less than [280]. With Super data, the statistical precision will reach . Most systematic errors cancel in this test but care is needed in the selection process in order to avoid effects of known differences in hadronic interaction cross sections for and . A reach of compares favourably with the analogous test for muons, which currently has a measured value of [281, 263].
A similar test related to the mass has been performed by Belle [282] using and a pseudo-mass observable: . This gives a CL limit on violation of . The systematic error is dominated by assessments of potential charge asymmetries in the detector using charmed meson control samples, such as . At Super one expects a statistical error of . In order to fully exploit the statistical power of such a test, charge asymmetric momentum scales would have to be controlled at the level, which is a challenging detector systematics problem. Nonetheless, a test at such precision would represent one of the most precise fundamental fermion mass tests of available.
3 New Physics from Violation in the System
The quantitative confirmation of the Standard Model mechanism for violation in both the kaon and meson systems means that there must be additional sources of violation beyond the Standard Model, if we are to explain the dominance of matter over antimatter in the universe. The origin of the non-Standard Model violation remains one of the most important problems in physics; it is thus important to look for the phenomenon in as many systems as possible. Searches for violation in decays have been proposed [283, 284, 285, 286, 287], as the observation of a non-zero asymmetry in decays would be a clear and unambiguous signature for New Physics. Since all -violating effects result from the interference of at least two amplitudes with a relative phase and, since in the Standard Model the decays via a single decay amplitude, there can be no -violating asymmetries in Standard Model decays (apart from a Standard Model asymmetry of in arising from violation in the neutral kaon system [288]).
With unpolarized leptons, for example, one can measure the branching ratios of decays to at least two hadrons and determine if, for example, is equal to . However, such a simple asymmetry is not expected in many conventional New Physics models.
There could be a -violating asymmetry in multi-Higgs doublet models in which the decay can proceed through charged Higgs exchange in addition to the Standard Model decay via a virtual [289, 285, 286, 287]. In these scenarios, violation arises from the interference between the vector boson and the scalar charged Higgs amplitudes. One of the most promising decay modes in multi Higgs doublet models is [285, 286], where charged Higgs exchange would modify the scalar form factor in the hadronic matrix element. Transitions from the QCD vacuum to two pseudoscalar mesons, and , can proceed only through the vector and scalar currents. The hadronic matrix elements can be expanded along the set of independent momenta, and :
| (23) |
where , is the vector form factor associated with the component of the weak charged current and is the scalar form factor corresponding to the component. A charged Higgs exchange contribution is introduced as a term proportional to where:
| (24) |
The complex parameter transforms under as thereby allowing for the parametrization of possible violation. The general amplitude for the decay of a with spin , , can be written as:
| (25) |
where
| (26) |
One searches for the presence of a -violating phase by comparing the structure functions and [290] measured in and decays,
| (27) |
| (28) |
The structure functions are defined from the hadronic tensor in the hadronic rest frame [290]. A non-zero value for or signals violation, and hence New Physics.
is obtained from an analysis of the difference in the correlated energy distribution of the charged and in and decays in the lab. It can be determined by studying single unpolarized decays produced at Super. where the precision will be limited by the understanding of the charge asymmetry in the detector response, which will be dominated by the differences in the interaction of and in the material of the detector. This can be controlled by studying the response of from, for example, or from in charm decays.
The measurement of requires knowledge of the full kinematics and polarization of the . The full kinematics can be determined using vertex detectors. The component of the polarization along the direction can be obtained from the longitudinal beam polarizations ( and ) as a function of the production angle and energy, [283]. It is important to recognize, however, that only one of the beams needs to be polarized to obtain a non-zero polarization.
Searching for violation via is similar to the methods proposed in [283, 284], which suggest using a -odd rotationally invariant product, such as , where is the component of the polarization along the beam axis averaged over the production angle:
| (29) |
Other multi-meson decay modes should also be considered, and at Super the large data sample will offset the smaller branching ratio to these modes. In particular, decays could well be a fruitful mode for violation searches [287]. In this case a polarization-dependent rate asymmetry is the most sensitive observable. The asymmetry is present with no polarization but can grow by large factors as a function of as the polarization changes from zero to one. This not only gives an enhancement of an violating signal, but with tunable polarization, provides for a powerful systematic control over the asymmetry observable.
A polarized beam also provides for a very sensitive probe of the electric dipole moment (EDM) of the . This observable is sensitive to violation in production and, with it is estimated that an upper limit on the EDM of the of can be achieved [291]. This represents an improvement on the current limits [292] of about three orders of magnitude. In light of existing limits on the EDM of the electron, it would be surprising to observe such a large value and therefore searches for a non-zero EDM at Super would be probes for non-“standard” New Physics violation.
3 Physics at the
1 Running at the
Measurement of CKM- and New Physics-related quantities in the sector is a natural extension of the traditional Factory program. In some cases, studies of mesons allow the extraction of the same fundamental quantities accessible at a Factory operating at the resonance, but with reduced theoretical uncertainty. Experiments running at hadronic machines are expected to be the main source of -related measurements. In particular, in the near future, the increased dataset of the Tevatron experiments and the start of the LHC, ATLAS, and CMS programs will surely yield important new results.
It is also worth noting, however, that despite the rapid oscillation frequency, it is also feasible to carry out studies in the very clean environment of annihilation machines by running at the resonance, where it is possible to perform measurements involving neutral particles (e.g., , and mesons, radiative photons, etc.) CLEO [293, 294, 295] and Belle [296, 297] have had short runs at the , measuring the main features of this resonance. The results clearly indicate the potential for an machine to contribute to this area of physics, and have inspired the work in this section, and elsewhere [298, 299, 300]. Note that, in contrast to much of the remainder of this chapter, there are no experimental analyses for many of the measurements of interest, and therefore our studies are based on Monte Carlo simulations.
The production of mesons at the allows comprehensive studies of the decay rates of the with a completeness and accuracy comparable to that currently available for and mesons, thereby improving our understanding of physics and helping to reduce the theoretical uncertainties related to New Physics-sensitive quantities. Moreover, physics provides additional methods to probe New Physics effects in transitions. In the following, we concentrate on this second point, providing examples of some of the highlight measurements that could be performed by Super operating at the resonance.
The resonance is a state of a quark pair, having an invariant mass of [301, 302, 263]. The cross section of production in collisions is [303], which corresponds to about one third of the one. Unlike the state, this resonance is sufficiently massive to decay into several meson states: vector-vector (), pseudoscalar-vector (), and pseudoscalar-pseudoscalar () combinations of charged mesons, as well as neutral and mesons, as well as into states. Tab. 10 shows the current experimental status of pair production rates, along with the values used in the study presented in this section.
| Decay Modes | CLEO | Belle | This Study |
|---|---|---|---|
| (%) | 26 | ||
| 0.94 | |||
| 0.03 | |||
| 0.03 | |||
| (%) | 44 | ||
| (%) | 7 | ||
| (%) | 7 | ||
| (%) | 16 | ||
| (%) | - |
The multiplicity of possible final states implies different momenta for the produced pairs and affects the reconstruction methods. In particular, the distribution of the usual discriminating variables and is different depending on the final state, as shown in Fig 16. This feature is extremely helpful in isolating the different final states in the plane. With the small beam energy spread of Super, the resolution of will be comparable to the current Factories, resulting in almost negligible crossover between and states. We have taken this small effect into account in our simulations.
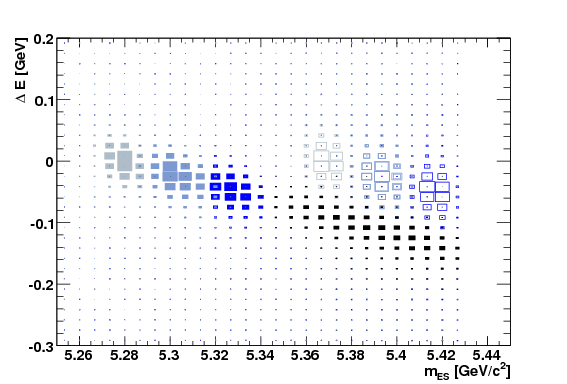
2 Measurement of Mixing Parameters
The absolute value and the phase of the mixing amplitude can be used to test for the presence of New Physics in transitions. These measurements can be made at hadronic colliders [305]. The recent measurement of [306, 307, 308] provides the first milestone in this physics program. These studies exploit the high Lorentz boost of mesons produced at high energy hadronic colliders; the rapid oscillations can be resolved, with current vertex detector spatial resolution (), only with a large boost.
Similar tests for New Physics effects can be made by measuring quantities such as and the asymmetry in semileptonic decays , which can be done at Super, taking advantage of the large statistics, high efficiency of lepton reconstruction, and low backgrounds. These measurements do not require the oscillations to be resolved.
In a generic New Physics scenario, the effect of New Physics contributions can be parameterized in terms of two quantities, and , given by the relation (see also Section 6):
| (30) |
In the absence of New Physics effects, and , by definition. The measured values of and (discussed in Section 2) are related to Standard Model quantities through the relations :
| (31) |
The semileptonic asymmetry [224] and the value of [309] are sensitive to New Physics contributions to the effective Hamiltonian, and can be expressed in terms of the parameters and .
Different experimental methods have been proposed to extract the lifetime difference [310]. For instance, can be obtained from the angular distribution of untagged decays. This angular analysis allows separation of the odd and even components of the final state, which have a distinct time evolution, given by different combinations of the two exponential factors . This allows the extraction of the two parameters or, equivalently, and . The weak phase of the mixing amplitude, , also appears in this parametrization, and a constraint on this phase can be extracted along with the other two parameters (see Eq. 34 below). Measurements of have been performed by CDF [311] and DØ [312]; DØ also obtains a constraint on . We have performed a simulation based on toy Monte Carlo experiments to evaluate the sensitivity of this measurement at Super. An example of the evolution of the precision on as a function of the integrated luminosity is shown in Fig. 17. We see that with a few of data accumulated at the it will be possible to improve upon the current experimental precision. Clearly, LHC also has the potential to improve this measurement.
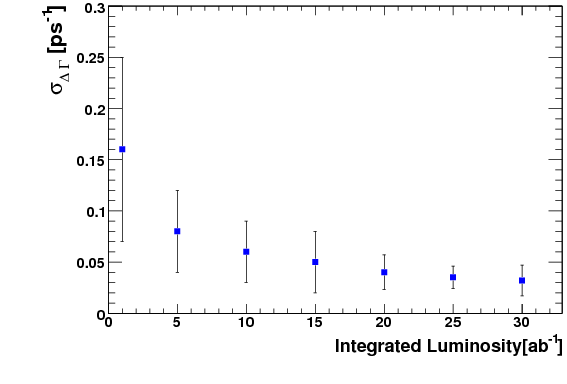
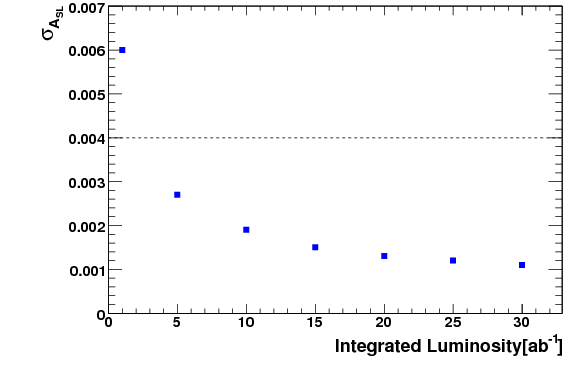
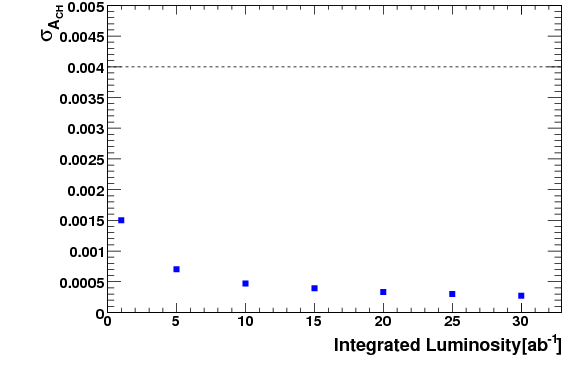
We have also studied the performance of two different experimental techniques that can be used to to extract the semileptonic asymmetry , defined as (see also Section 4):
| (32) | |||||
The first technique consists of exclusively reconstructing one of the two mesons into a self-tagging hadronic final state (such as ) and looking for the signature of a semileptonic decay (high momentum lepton) in the rest of the event. The second approach is more inclusive, using all events with two high momentum leptons. In this case, contributions from and decays cannot be separated, and a combined asymmetry, is measured. Results from this type of analysis are available from DØ [313]. Fig. 17 shows the statistical errors we expect on and . Notice that, in both cases, the error becomes systematics dominated after a relatively small period of data taking. Nonetheless, a clear improvement on the current experimental situation is possible. Since measurements in a hadronic environment generally suffer from larger systematic effects; Super appears better-suited to obtain precise measurements of the semileptonic asymmetries.
It is interesting to mention that in the Littlest Higgs Model with T-parity introduced in Section 1 one finds large and correlated corrections to the asymmetries and (and, to a lesser extent, also to ), as shown in Fig. 18). Note that all these asymmetries, in contrast to many other flavour observables, are not sensitive to the UV completion of the model and, thus allow for more reliable theoretical predictions.
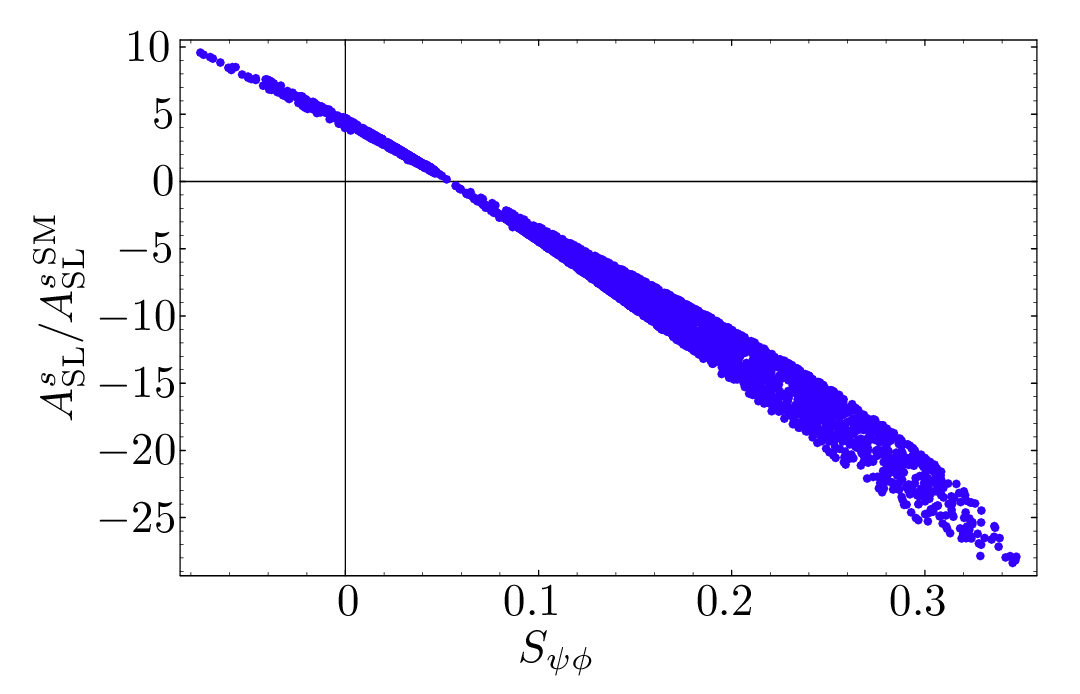
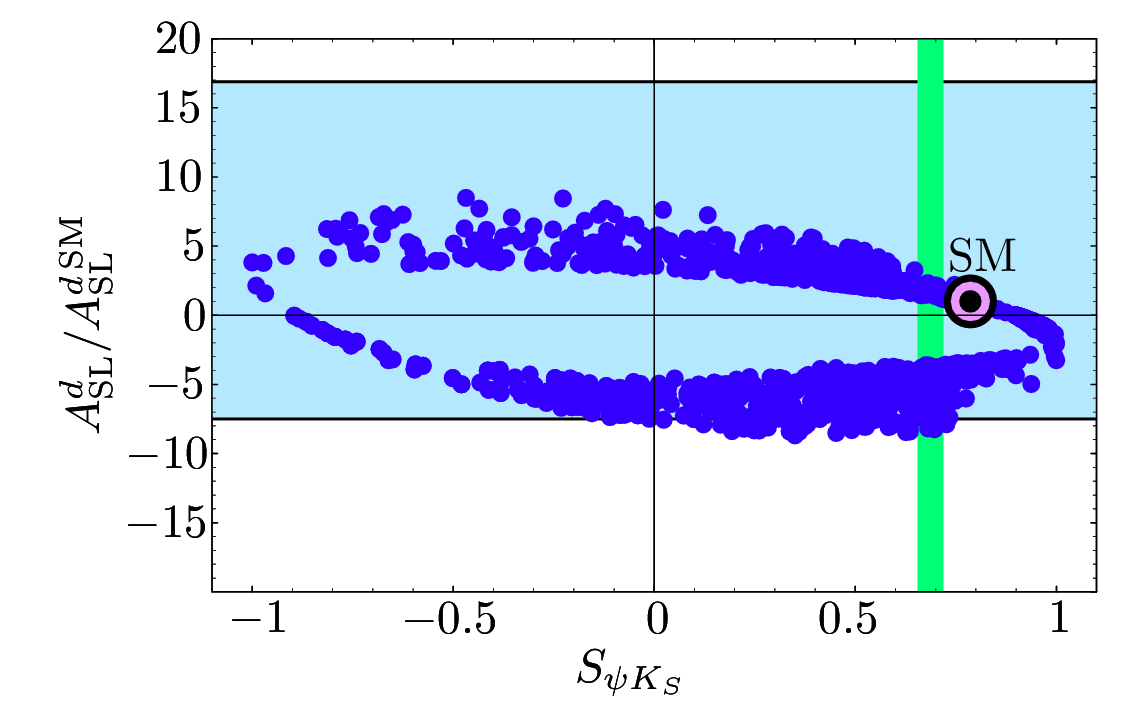
3 Time Dependent Asymmetries
Let us consider a pair produced at the resonance, through a state. If one of the two mesons decays into a eigenstate and the other to a flavour-tagging final state, the decay rates as a function of the proper time difference can be written in terms of the parameter as [309]:
| (33) |
giving an untagged time-dependent decay rate of
| (34) |
With the requirement , the normalization factor is fixed to . In this formulation, we have neglected effects due to violation in mixing.
We have investigated the possibility of performing a similar time-dependent analysis to that for the case of decays, despite the very fast oscillations. We performed a toy simulation to find the sensitivity to the time dependent asymmetry in the decay , and found that in order to measure the violation parameters it would be necessary to achieve a resolution , which does not appear to be possible – improvements coming from new technology, together with the possibility of adding a layer of silicon detectors close to the beam pipe (see Section 4), can only reduce the resolution to with a Lorentz boost of .
However, since , the untagged time-dependent decay rate also allows to be probed, through the -dependence of the coefficient of the -odd term. Such an analysis has been performed by DØ [312, 314]. We have explored the possibility of taking advantage of this, using a “two-bin” time-dependent analysis. We have carried out toy simulations in which we perform a simultaneous fit to extract the yields in four categories (for different signs of and tag flavour). These yields can then be used to constrain .
For instance, considering the decay, and assuming, for simplicity, that it is a pure -even eigenstate (in the general case, an angular analysis can be used to isolate -even and -odd contributions), this technique can be used to extract a constraint on the weak phase of the mixing . A precision on of and can be achieved, with and of integrated luminosity, respectively. Anyway, a two-fold ambiguity between and can produce a (almost) two-times larger resolution in the total pdf, when the value of is close to zero (as it should be in the SM). On the other side, this measurement is not limited by systematics, and the precision can be readily improved by collecting more data.
While the precision that can be achieved in the channel is not fully competitive with that possible at LHC, where a tagged analysis can be done, the success of this technique opens the possibility of using several other channels, not accessible at hadronic machines, that are sensitive to the weak phase of the mixing amplitude. Among the many interesting final states Super could study are , , , , , , and . We have performed a study on the particularly interesting channel , which is a pure penguin transition, complementary to those that can be studied in decays (see Section 1). With accumulated at the , we can reach an error on of .
4 Rare Decays
Leptonic Decays
In the Standard Model [315, 316]; this decay is chirally suppressed, and proceeds in the Standard Model through loop diagrams, which makes it particularly sensitive to New Physics contributions [317, 318, 319, 320, 321, 322, 323, 324, 325, 326]. A combined analysis of and rare decays [327] has recently studied this decay in the context of MFV models with one Higgs doublet or two Higgs doublets at small , finding at probability: this decay rate requires large to receive significant New Physics contributions in MFV models.
Indeed, in a very large scenario, Yukawa couplings contribute, resulting in a sizable enhancement of the decay rate [242, 245, 328]. The current experimental limit is at confidence level [329, 330].
We have estimated the Super sensitivity to the branching ratio for this decay. The numbers of expected events ( signal events and background events in ) suggest that Super would not be competitive for this measurement; indeed, this is one of the primary motivations of the LHC physics program.
Radiative Decays
An independent measurement of , to be compared with the information coming from the measurement, can be provided by transitions, which can be sensitive to New Physics in a different way than .
Such a test is provided by the ratio (see Section 3), which allows a measurement of , with an uncertainty that is expected to be ultimately limited by the presence of the power-suppressed correction term in Eq. 6. In particular, a significant contribution is expected to come from the -exchange diagram, which contributes to but not to . This contribution is of order and is CKM suppressed in the Standard Model. Beyond the Standard Model, however, the CKM suppression may no longer be present. It is therefore interesting to look for a similar observable that is not affected by the presence of the -exchange term, to be sure that no hadronic uncertainty is introduced going from the Standard Model to New Physics scenarios. There is such an observable: the ratio . These two decays are not affected by -exchange and is expected to be small even in the presence of New Physics. The ratio is given again by Eq. 6 where , and the isospin, kinematic and form factor terms are appropriately replaced.
We have performed toy simulations to estimate our sensitivity, with an assumption of . The results have been combined with the lattice QCD prediction for the form factor ratio to extract the corresponding determination of . The error on this determination is fully dominated by the experimental statistical error, even assuming the present error on . Thus the ratio of can be thought of as a golden method for a clean determination of the ratio from radiative decays. As shown in in Table 11, can be measured to a precision of a few percent with a multi-ab-1 data sample accumulated by Super at the .
Measurement of
For several years, has been considered the golden mode to probe New Physics in the flavour sector. Indeed, branching ratios and asymmetries of provide significant constraints on the mass insertion parameters of the mass matrix (see Sections 3 and 6). It is important to look for other channels of this type that can play a similar rôle. An interesting candidate is the decay . The final state contains both -odd and -even components, allowing for the study of -violating effects with Factory tagging techniques. The Standard Model expectation for the branching ratio is [331]. New Physics effects are expected to give sizable contributions to the decay rate in certain scenarios [332, 333]. For instance, in R-parity-violating SUSY models, neutralino exchange can enhance the branching ratio up to [334]. On the other hand, in R-parity-conserving SUSY models, in particular in softly broken supersymmetry, is found to be highly correlated with [335].
From the experimental point of view, the exclusive measurement of is very similar to other measurements already performed at Factories (such as ). The presence of two high-energetic photons presents a clear signature for signal events, particularly with a recoil technique. Both BABAR [336] and Belle [337] have published results of searches for , setting the current experiment upper limit at . These results are encouraging for the study of at Super, though they show that considerable effort will be necessary to control systematic uncertainties. The limiting systematic is knowledge of the efficiency for photon reconstruction, which can be reduced with dedicated studies on control samples with similar photon energy range.
A dedicated simulation shows that we expect signal events and background events in a sample of , indicating that the decay could be observed if it has the Standard Model branching fraction. With , one can achieve a statistical error of and a systematic error smaller than . Using tagging information, direct CP asymmetry can also be measured with good accuracy, as already done at the B factories for neutral decays.
5 Summary of Experimental Reach
The results presented in this section are summarized in Table 11 for the case of either a short () or a long () run at the . Collecting takes less than one month at a design peak luminosity of .
| Observable | Error with | Error with |
|---|---|---|
| from angular analysis | ||
| 0.006 | 0.004 | |
| 0.004 | 0.004 | |
| - | ||
| 0.08 | 0.017 | |
| from | ||
| from |
It is fortunate for experiments in the hadronic environment that many of the most interesting decay channels contain dileptons in the final state. It is clear that Super cannot compete with hadronic experiments on modes such as and . It is also clear that many important channels that are not easily accessible at hadronic experiments such as LHC, among them and . Therefore, Super will complement the results from LHC, and enrich its own physics program, by accumulating several at the .
6 Phenomenological Implications
The experimental measurements of , , and violation parameters described in the previous sections can be used to determined the New Physics contributions in the sector. The knowledge of and is assumed to come from studies at the .
To illustrate the impact of the measurement at Superat the , we show in Fig. 19 selected regions in the – plane (right), compared to the current situation (left). Corresponding numerical results are given in Table 12.
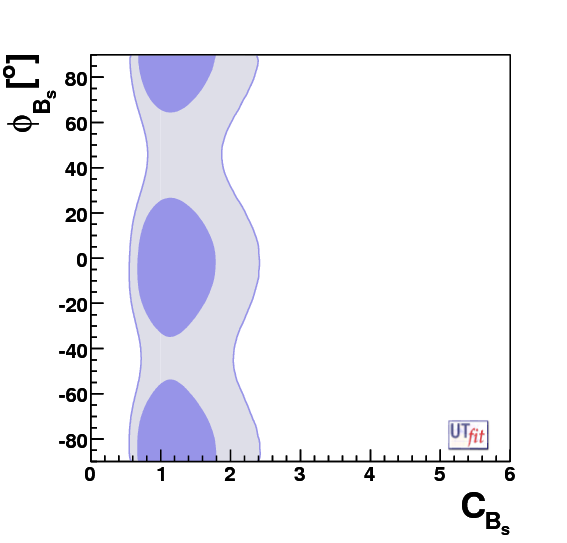
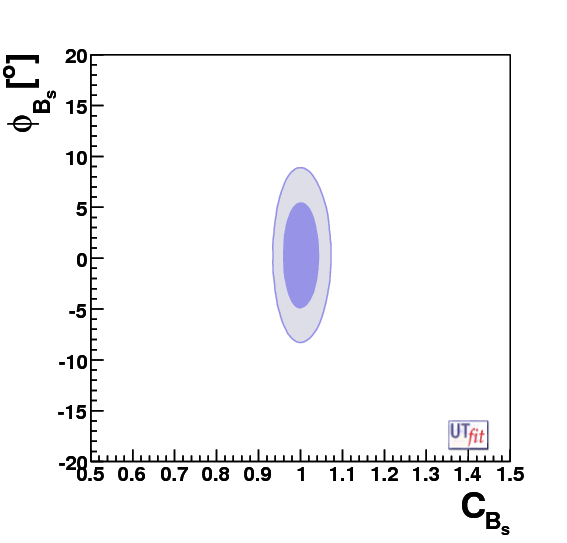
| Parameter | Today | At Super () |
|---|---|---|
It is important to note that the uncertainty on the parameter is largely dominated by the uncertainty on the related hadronic quantity, namely and bag parameters. The error on is not limited by systematics and theory, and can be improved to – with a longer dedicated run at the .
LHC will also measure the New Physics phase . With the final available statistics (), the uncertainty on is estimated to be less than .
4 Charm Physics
It is a truth universally accepted that charm studies played a seminal role in the evolution and acceptance of the Standard Model. Yet the continuing importance of this sector is not widely appreciated, since the Standard Model electroweak phenomenology for charm decays is on the dull side: the CKM parameters are known, oscillations are slow, asymmetries are small or absent and loop-driven decays are extremely rare.
Yet on closer examination, a strong case emerges in two respects, both of which derive from this apparent dullness:
-
•
Detailed and comprehensive analyses of charm transitions will continue to provide us with new insights into QCD’s nonperturbative dynamics, and advance us significantly towards establishing theoretical control over them. Beyond the intrinsic value of such lessons, they will also calibrate our theoretical tools for studies; this will be essential to saturate the discovery potential for New Physics in transitions.
-
•
Charm decays constitute a novel window into New Physics.
Lessons from the first item will have an obvious impact on the tasks listed under the second. They might actually be of great value even beyond QCD, if the New Physics anticipated for the TeV scale is of the strongly interacting variety.
The capabilities of a Super Flavour Factory are well matched to these goals. It allows uniquely clean determinations of CKM parameters, with six of the nine matrix elements impacted by charm measurements. New Physics signals can easily exceed Standard Model predictions by considerable factors such that there will be no ambiguity in interpreting them, yet they are unlikely to be large; this again requires the clean environment and huge statistics that a Super Flavour Factory can provide.
A number of other facilities either currently running or soon to commence operation provide competition in the area of charm physics. The current Factory program is expected to produce a sample of about charm hadrons from operation at or near the resonance. The CLEO experiment at CESR is operating in the charm threshold region, and anticipates collecting a total of pairs and about through coherent production. The BESIII experiment at BEPCII expects first collisions in 2008, and will collect large charmonium samples, in addition to exceeding the CLEO data set in open charm production. Although there will be no successors to the Fermilab fixed target charm production experiments, the LHC will produce copious quantities of charm (notably, charm physics forms a part of the LHC physics program); these are expected to result in very large samples of charmed hadrons in final states with reconstructible topologies.
Most of the benchmark charm measurements will still be statistics-limited after the CLEO, BESIII and Factory projects, and many will not be achievable in a hadronic environment. Super is the ideal machine with which to pursue these measurements to their ultimate precision. Operation near the will provide enormous samples of charm hadrons, in a clean environment and with a detector well-suited for charm studies. The charm physics program would benefit further from the ability to operate in the threshold region, in order to exploit the quantum correlations associated with coherent production. The expected lower luminosity at threshold would be partly compensated by the higher production cross-section, resulting in a comparable charm production rate. To estimate the reach of Super from operation at the charm threshold, we have assumed a simple dependence of the luminosity on the center-of-mass energy: . Thus, we expect that Super (which will integrate per year operating at the ) can accumulate per month when operated at the .
1 Lessons on Strong Dynamics
Detailed analyses of (semi)leptonic decays of charm hadrons provide a challenging test bed for validating lattice QCD (LQCD), which is the only known framework with realistic promise for a truly quantitative treatment of charm hadrons that can be systematically improved . Such studies form the core of the ongoing CLEO and the nascent BESIII programs; they are also pursued very profitably at the Factories. Central goals are measuring the decay constants and and going beyond total rates for semileptonic , and decays. Such high quality studies will greatly improve our understanding of hadronization and provide an even richer test bed for LQCD with the lessons to be learned of crucial importance for extracting from semileptonic decays. Our knowledge of charm baryon decays is also rather limited; e.g., no precision data on absolute branching ratios or semileptonic decay distributions exist. CLEO will not run above the charm baryon threshold, and BESIII cannot.
Leptonic Charm Studies
In the Standard Model the leptonic decay width is given by [338]:
| (35) |
Taking and from elsewhere, one uses Eq.(35) to extract and . The ratio of the leptonic decay rates of the and the is proportional to , for which the lattice calculation is substantially more precise. A significant deviation from its predicted value would be a clear sign of New Physics, probably in the form of a charged Higgs exchange [339]. On the other hand, the ratio of the rates of tauonic and muonic decays for either or is independent of both form factors and CKM elements, and serves as a useful cross-check in this context.
CLEO has published a measurement of [340, 341], and several measurements of [342, 343]. These measurements have benefitted from a “double-tag” method uniquely possible at threshold, where a pair is produced with no extra particles. The latest results are
| (36) |
| (37) |
The central values for and are slightly above, but consistent with, the present LQCD calculations. It is important to note that the desired – accuracy level has not yet been reached on either the experimental or theoretical side. While LQCD practitioners expect to reach this level over the next decade, the experimental precision is likely to fall significantly short of this goal, even after BESIII. Since larger statistics will certainly allow reduction of the systematic errors in the current results, it is clear that data accumulated by Super from a relatively short run ( month) at charm threshold would allow the desired improvement of the experimental precision (see discussion below, and Table 13). Validating LQCD on the level will have important consequences for and oscillations, since it would give us demonstrated confidence in the theoretical extrapolation to and .
Semileptonic Charm Studies
In the area of semileptonic decays, CLEO has made the most accurate measurements for the inclusive and semileptonic branching fractions – and [344] – and expects to do the same for . Such data provide important “engineering input” for other and decay studies. However, a central goal must be to go beyond the total rates for these decays and to extract the form factors etc. In order to do so, it is essential to analyze lepton spectra and perform “meaningful” Dalitz plot studies. To quantify “meaningful”, it is instructive to compare to analyses on decays. With a sample size of 30,000 events which became available in 1977, one was able to begin extracting dynamical information. Precise measurements are now possible, with NA48/2 and E685 each having accumulated 400,000 events [345, 346]. For charm we are nowhere near that level: CLEO will have about 10,000 semileptonic charm decays – comparable to kaon studies in the late 1970s. Since for charm the phase space is larger, thereby opening more domains of interest, a reasonable target sample size is events, which is far beyond the reach of CLEO, and most probably, of BESIII.
Three-family unitarity constraints on the CKM matrix yield rather precise values for and . Using these, one can extract the form factors from analyses of exclusive semileptonic charm decays. Both the normalization and dependence must be measured. Existing LQCD studies do not allow us to determine the latter from first principles; instead a parametrization originally proposed by Becirevic and Kaidalov () is used [347]. Recent and forthcoming results from CLEO, BABAR and Belle [348] are expected to be statistics limited, and will not reach the desired – level.
The current status can be characterized by comparing the measured value of the ratio , which is independent of , to that inferred from a recent LQCD calculation [349]:
| (38) |
The values are nicely consistent, yet both are still far from the required level of precision.
While operation in the region will produce large quantities of charm hadrons, there are significant backgrounds and one pays a price in statistics when using kinematic constraints to infer neutrino momenta, etc.. On the other hand, even a limited run at charm threshold will generate the statistics required to study (semi)leptonic decays with the desired accuracy. Assuming that systematic uncertainties in tracking and muon identification will provide a limit to the precision at the level, we estimate the integrated luminosity from threshold running required to achieve a similar statistical uncertainty. As shown in Table 13 we expect to be able to measure , and their ratio with better than statistical uncertainty with integrated luminosities of at least .
| Channel | Integrated luminosity |
|---|---|
| () | |
| 500 | |
| 100 |
For semileptonic decays, a case-by-case study is necessary. One also has to distinguish between merely determining the branching ratio and performing a “meaningful” Dalitz plot analysis, as discussed above. The required integrated luminosities are given in Table 14. It is clear that the anticipated from one month of running in the threshold region would provide the desired statistics for most measurements. Note that while mesons are not produced at the , short runs at other energies are possible.
| Channel | Integrated luminosity | Integrated luminosity |
|---|---|---|
| () | () | |
| 1.3 | 33 | |
| 17 | 425 | |
| 20 | 500 | |
| 45 | 1125 | |
| 9 | 225 | |
| 9 | 225 | |
| 75 | 1900 | |
| 110 | 2750 | |
| 85 | 2200 | |
| 1300 | 33000 | |
| 1300 | 33000 |
2 Precision CKM Measurements
Studies of leptonic decay constants and semileptonic form factors will yield a set of measurements, including and , at the few percent level. These measurements will constrain theoretical calculations, and those that survive will be validated for use in a variety of areas in which interesting physics cannot be extracted without theoretical input. This broader impact of charm measurements extends beyond those measurements that can be performed directly at charm threshold, and has a large impact on the precision determination of CKM matrix elements.
The determination of and is limited by ignorance of and ; improved determinations of and are required. Precision measurements of and can validate the theoretical treatment of the analogous quantities for mesons. Similarly, improved form factor calculations in the decays and and inclusive semileptonic charm decays will enable improved precision in and .
The precision measurement of the UT angle depends on decays of mesons to final states containing neutral mesons (see Section 1). A variety of charm measurements impact these analyses, including: improved constraints on charm mixing amplitudes, measurements of relative rates and strong phases between Cabibbo-favoured and -suppressed decays (e.g., between and ), and studies of charm Dalitz plots tagged by hadronic flavour or content [58, 73]. Note that the latter two measurements can only be performed with data from charm threshold.
Overconstraining the Unitarity Triangle
At present three-family unitarity constraints yield more precise values for and than direct measurements. Since it is conceivable that a fourth family exists (with neutrinos so heavy that the could not decay into them), one would like to obtain more accurate direct determinations. This should be possible if LQCD is indeed validated at the level through its predictions on form factors and their ratios.
From four-family unitarity, and using current experimental constraints [263] we can infer for a fourth quark doublet :
| (39) | |||||
| (40) |
These loose bounds are largely due to the error on .
3 Charm Decays as a Window to New Physics
While significant progress can be guaranteed for the Standard Model studies outlined above, the situation is much less certain concerning the search for New Physics. No sign of it has yet been seen, but we have only begun to approach the regime of experimental sensitivity in which a signal for New Physics could realistically emerge in the data. The interesting region of sensitivity extends several orders of magnitude beyond the current status.
New Physics scenarios in general induce flavour-changing neutral currents that a priori have no reason to be as strongly suppressed as in the Standard Model. More specifically, they could be substantially stronger for up-type than for down-type quarks; this can occur in particular in models that reduce strangeness-changing neutral currents below phenomenologically acceptable levels through an alignment mechanism.
In such scenarios, charm plays a unique role among the up-type quarks , and ; for only charm allows the full range of probes for New Physics. Since top quarks do not hadronize [350], there can be no oscillations (recall that hadronization, while hard to bring under theoretical control, enhances the observability of violation). As far as quarks are concerned, , and do not oscillate, and decay electromagnetically, not weakly. asymmetries are mostly ruled out by invariance. Our basic contention can then be formulated as follows: charm transitions provide a unique portal for a novel access to flavour dynamics with the experimental situation being a priori quite favourable. The aim is to go beyond “merely” establishing the existence of New Physics around the TeV scale – we want to identify the salient features of this New Physics as well. This requires a comprehensive study, i.e., that we also search in unconventional areas such as charm decays.
On New Physics scenarios
In a scenario in which the LHC discovers direct evidence of SUSY via observation of sleptons or squarks, the Super Flavour Factory program becomes even more important. The sfermion mass matrices are a new potential source of flavour mixing and violation and contain information about the SUSY-breaking mechanism. Direct measurements of the masses can only constrain the diagonal elements of this matrix. However, off-diagonal elements can be measured through the study of loop-mediated heavy flavour processes. As a specific example, a minimal flavour violation scenario such as mSUGRA with moderate , could result in a SUSY partner mass spectrum that is essentially indistinguishable from an SU(5) GUT model with right-handed neutrinos. However the mSUGRA scenario would be expected to yield no observable effects in the heavy flavour sector, whereas the SU(5) model is expected to produce measurable effects in time-dependent violation in penguin-mediated hadronic and radiative decays.
While there is no compelling scenario that would generate observable effects in charm, but not in beauty and strange decays, it is nevertheless reassuring that such scenarios do exist. One should keep in mind that New Physics signals in charm asymmetries are particularly clean, since the Standard Model background (which often exists in decays) is largely absent. The consequence is that New Physics could produce signals that exceed Standard Model predictions by an order of magnitude or more – something that is of great help in interpreting the signals. We will focus on the most promising areas; more details can be found in several recent reviews [351, 352, 353].
oscillations
Oscillations of neutral mesons driven by the two quantities and lead to an effective violation of the Standard Model and rules in semileptonic and nonleptonic channels. The status of the Standard Model prediction can be summarized as [352]: while one predicts , at present one cannot rule out .
Many different charm decay modes can be used to search for charm mixing. The appearance of “wrong-sign” kaons in semileptonic decays would provide direct evidence for oscillations (or another process with origin beyond the Standard Model). The wrong-sign hadronic decay is sensitive to linear combinations of the mass and lifetime differences, denoted and . The relation of these parameters to and is controlled by a strong phase difference. Direct measurements of and independent of unknown strong interaction phases, can also be made using time-independent studies of amplitudes present in multi-body decays of the , for example, . Direct evidence for can also appear through lifetime differences between decays to eigenstates. The measured quantity in this case, , is equivalent to in the absence of violation. Another approach is to study quantum correlations near threshold [352, 354, 355] in and in , which yield -odd and -even pairs, respectively.
Very recently, several new results have suggested that charm mixing may be at the upper end of the range of Standard Model predictions. BABAR finds evidence for oscillations in with significance [356], while Belle sees a effect in , with results using supporting the claim [357]. These results are consistent with previous measurements, some of which had hinted at a mixing effect [358, 359, 360, 361, 362]. The results are not systematics limited, and further improvements are anticipated.
The charm decays subgroup of the Heavy Flavour Averaging Group [12] is preparing world averages of all the charm mixing measurements, taking into account correlations between the measured quantities. A very preliminary average is available [363], giving:
and .
Contours in the plane are shown in Fig. 20. The significance of the oscillation effect in the preliminary world averages exceeds .

The interpretation of these new results in terms of New Physics is inconclusive. For one thing, it is not yet clear whether the effect is caused by or or both, though the latter is favored and this point may be clarified soon. As shown in Table 15, Super will be able to observe both lifetime and mass differences in the system, if they lie in the range of Standard Model predictions. It should be noted that the full benefit of measurements in the system (and indeed for other hadronic decays) can only be obtained if the strong phases are measured. This can be achieved with a short ( month) period of data taking at charm threshold.
A serious limitation in the interpretation of charm oscillations in terms of New Physics is the theoretical uncertainty on the Standard Model prediction. Nonetheless, if oscillations indeed occur at the level suggested by the latest results, this will open the window to searches for asymmetries that do provide unequivocal New Physics signals.
| Mode | Observable | Factories () | Super () |
|---|---|---|---|
| – | |||
| – | |||
| – | |||
| – | |||
| – | |||
| Average | – | ||
| – |
Violation With and Without Oscillations
Several factors favor dedicated searches for violation in charm transitions:
• Within the Standard Model, the effective weak phase is highly diluted, namely , and can arise only in singly-Cabibbo-suppressed transitions, where one expects asymmetries to reach the level; significantly larger values would signal New Physics. Any asymmetry in Cabibbo-allowed or -doubly suppressed channels requires the intervention of New Physics – except for [352] where the impurity in induces an asymmetry of . One should keep in mind that in going from Cabibbo-allowed to Cabibbo-singly and -doubly suppressed channels, the Standard Model rate is suppressed by factors of about twenty and four hundred, respectively. One would expect that this suppression will enhance the visibility of New Physics.
• Strong phase shifts required for direct violation to emerge are, in general, large, as are the branching ratios into relevant modes. Although large final state interactions complicate the interpretation of an observed signal in terms of the microscopic parameters of the underlying dynamics, they enhance its observability.
• With the Standard Model providing one amplitude, observable asymmetries can be linear in New Physics amplitudes – unlike the case for rare decays – thus increasing the sensitivity.
• Decays to multibody final states contain more dynamical information than given by their widths; their decay distributions as described by Dalitz plots or -odd moments can exhibit asymmetries that might be considerably larger than those for the width. Final state interactions, while not necessary for the emergence of such effects, can produce a signal that can be disentangled from New Physics effects by comparing -odd moments for conjugate modes [364].
• The distinctive channel provides a powerful tag on the flavour identity of the neutral meson.
The notable “fly in the ointment” in searching for violation in the charm sector is that oscillations are slow. Nevertheless one should accept this challenge: violation involving oscillations is a reliable probe of New Physics: the asymmetry is controlled by . In the Standard Model both factors are small, namely , making such an asymmetry unobservably tiny – unless there is New Physics (see, e.g., [365, 366]). oscillations, violation and New Physics might thus be discovered simultaneously in a transition. Such effects can be searched for in final states common to and such as eigenstates (e.g., ) doubly Cabibbo suppressed modes (e.g., ) or three-body final states (e.g. ). Undertaking time-dependent Dalitz plot studies requires a high initial overhead, yet in the long run this should pay handsome dividends, since Dalitz plot analyses can invoke many internal correlations that, in turn, serve to control systematic uncertainties. Such analyses may allow the best sensitivity to New Physics.
Experimental Status and Future Benchmarks
Time-integrated asymmetries have been searched for and sensitivities of order [several ] have been achieved for Cabibbo-allowed and -singly suppressed modes with two [three] body final states [367]. Time-dependent asymmetries (i.e., those involving oscillations) are still largely terra incognita.
Since the primary goal is to establish the intervention of New Physics, one “merely” needs a sensitivity level above the reach of the Standard Model; “merely” does not mean this can easily be achieved. As far as direct violation is concerned, this means asymmetries down to the or level in Cabibbo-allowed channels and down to the level or better in doubly Cabibbo-suppressed modes. In Cabibbo-singly-suppressed decays one wants to reach the range (although CKM dynamics can produce effects of that order, future advances might sharpen the Standard Model predictions). For time-dependent asymmetries in , , etc., and in , one should strive for the and levels, respectively.
When striving to measure asymmetries below the level, one has to minimize systematic uncertainties. There are at least three powerful weapons in this struggle: i) resolving the time evolution of asymmetries that are controlled by and , which requires excellent vertex detectors; ii) Dalitz plot consistency checks; iii) quantum statistics constraints on distributions, -odd moments, etc. [354].
Experimental reach of New Physics searches
In this section we briefly summarize the experimental reach of Super for New Physics sensitive channels in the charm sector. Table 16 shows the expected confidence level upper limits that may be obtained on various important rare decays, including suppressed flavour-changing neutral currents, lepton flavour-violating and lepton number-violating channels, from one month of running at the . It is expected that the results from running at the will be systematics limited before reaching this precision.
For studies of mixing, running in the region appears preferable, and, if the true values of the mixing parameters are unobservably small, the upper limits on both and can be driven to below in several channels (, , , etc.) Therefore, Super can study charm mixing if and lie within the ranges predicted by the Standard Model, and recently observed. The sensitivity to mixing-induced violation effects obviously depends strongly on the size of the mixing parameters. If one or both of and are , as indicated by the most recent results, Super will be able to make stringent tests of New Physics effects in this sector.
The situation for searches of direct violation is clearer: the Super statistics will be sufficient to observe the Standard Model effect of in [352], and other channels can be pursued to a similar level. Within three body modes, uncertainties in the Dalitz model are likely to become the limiting factor. However, model-independent -odd moments can be constructed in multibody channels, and limits in the region appear obtainable.
| Channel | Sensitivity |
|---|---|
| , | |
| , | |
| , | |
| , | |
| , | |
| , | |
| , | |
| , |
4 Summary
One does not have to be an incorrigible optimist to argue that the best might still be ahead of us in the exploration of the weak decays of charm hadrons. Detailed studies of leptonic and semileptonic charm decays will allow experimental verification of improvements in lattice QCD calculations, down to the required level of precision. This will result in significant improvements in the precision of CKM matrix elements. The possibility to operate with collision energies in the charm threshold region further extends the physics reach and the charm program of the Super Flavour Factory.
While no evidence for New Physics has yet been found in charm decays, the searches have only recently entered a domain where one could realistically hope for an effect. New Physics typically induces flavour-changing neutral currents. Those could be considerably less suppressed for up-type than for down-type quarks. Charm quarks are unique among up-type quarks in the sense that only they allow to probe the full range of phenomena induced by flavour changing neutral currents, including asymmetries involving oscillations.
There is little Standard Model background to New Physics signals in charm asymmetries, and what there is will probably be under good control by the time Super starts operating. Baryogenesis – necessary to explain the observed matter-antimatter asymmetry in our Universe – requires a new source of violation beyond that of the Standard Model. Such new sources can be probed in charm decays on three different Cabibbo levels, differing in rates by close to three orders of magnitude. With the Standard Model providing one amplitude, observable asymmetries can be linear in a New Physics amplitude, thus greatly enhancing their sensitivity. Finally, as stated repeatedly, the goal has to be to identify salient features of the anticipated New Physics beyond “merely” ascertaining its existence. This will require probing channels with one or even two neutral mesons in the final state – something that is possible only in an production environment. CLEO and BESIII are unlikely to find asymmetries in charm decays, and the Factory results will still be statistics limited. A Super Flavour Factory would allow conclusive measurements. Super, with data taken at the and near threshold, will complete the charm program down to the Standard Model level.
5 Other Topics
1 Spectroscopy
The recent experience of the Factories shows that many of the most exciting results that can be produced by an Super Factory cannot be predicted in advance. A brief inspection of the most cited papers from BABAR and Belle provides evidence of the renaissance of hadronic spectroscopy that has been stimulated by measurements such as:
Although past performance provides no guarantee of future success, new particles have been discovered by the Factories at a rate of more than one per year, and there is no reason to believe that this should not continue into multi- territory. Furthermore, it is clear that the clean environment is ideal for the complicated analyses necessary to pin down the nature of these new hadrons. Many different types of production, such as initial state radiation, cross sections, production in decay or in the continuum, can be probed. The possibility of running at different center-of-mass energies extends the reach of this branch of the physics program. Particles can be searched for in exclusive decays, or using inclusive techniques, such as recoil analysis. Amplitude analyses of multibody decays allow further probes of resonant states. Thus Super is the ideal machine with which to study hadronic spectroscopy over a large mass range, and to discover new particles, both conventional and exotic.
2 Studying Lower Resonances
A high luminosity Factory with flexible center-of-mass energy opens possibilities for the study of lower resonances. Such studies would allow tests of extensions of the Standard Model in a complementary manner to the physics program of a classic Factory and to the LHC.
Taking a non-minimal supersymmetric standard model (like the NMSSM) as an example, it will be possible to detect the presence of a light pseudoscalar Higgs produced in the decay () as an intermediate (perhaps quite broad) state. In this scenario, the first experimental evidence for New Physics would be likely to appear in the breaking of lepton universality, since the tauonic branching fraction would be enhanced with respect to the electronic and muonic ones [392].
Indeed, a light non-standard Higgs has not been excluded by LEP in certain scenarios [393], including the MSSM with explicit violation [394]. From LEP data, a window in the Higgs mass vs. plane is still allowed, which would approximately match the values needed to explain the hint of lepton universality breaking observed by CLEO in decays [395]. In this class of models, the lightest pseudoscalar Higgs (often denoted as or ) would be, in fact, a mixture of singlet and MSSM-like components [396].
In addition, the study of invisible decays allows independent constraints on models with light dark matter (LDM) to be obtained. It is important to remark that the searches for LDM in invisible decays of the carried out by CLEO [397] and Belle [398] only put limits on a vector mediator of the decay. To extend such searches, one should look at the decay invisible [399].
From an experimental point of view, the analysis can be performed using the production of a light resonance through ISR radiation, or with short runs at threshold [400]. The experimental challenge for studies of lies in the ability to detect the breaking of lepton universality, which demands a detailed understanding of trigger efficiencies, and a proper simulation of QED effects and the EMC response. In this picture, statistics is not a limiting factor; even short runs of one month or less at very high luminosity will close this currently open window or lead to the discovery of a light Higgs.
In addition, the possibility of running at the () resonances should be considered. This would provide a very clean environment for invisible decays, allowing additional searches for LDM. Several other studies possible at the resonances have been considered in the literature [401, 402, 403, 404, 405, 406, 407].
On the experimental side, the improved hermeticity of the Super detector, and the lower boost compared to the existing asymmetric Factories will improve the detector performance. Consequently, Super should provide an increase in the reconstruction efficiency of ISR photons and a reduction in the impact of QED and machine background.
3 Studies with Light Quarks
A Super Flavour Factory can also address several interesting open questions concerning light quarks that exist in low energy annihilation data; these questions are otherwise likely to remain unanswered. This can be done by exploiting initial state radiation, as has been done at the present Factories running at the , but it can be done better if Super runs at lower center-of-mass energies, with the expected very high luminosity, and the planned reduced energy asymmetry, which improves the detection efficiency for processes at threshold.
The number of unanswered questions remaining to be addressed will depend on developments at the new low energy colliders: BEPCII [408], the /charm factory in Beijing (if BEPCII collects data below the ); VEPP2000 [409, 410], the VEPP2M machine in Novosibirsk renewed and upgraded in energy up to 2 GeV in the center-of-mass (if VEPP2000 has enough luminosity above the injection energy, 1.9 GeV); and DANAE [411], the present DANE in Frascati upgraded in energy and luminosity (if DANAE is funded).
In the following, some of the open questions are very briefly discussed: , interactions, light quark hadronic chemistry, and baryon time-like form factors. More details on these topics can be found in ref. [412].
The measurement of the muon anomalous magnetic moment, , does not agree with the QED prediction at the level [413, 414]. The total cross-section , integrated over the total center-of-mass energy and weighted by a function strongly peaked at low energies, contributes heavily to the calculation [415, 416]. It also contributes, with less weight, to [417, 418]. Present measurements of up to 1 GeV, (mostly around the (770)), are performed with a claimed accuracy, but actually disagree at the level [419, 420, 421, 422, 423]. Should a future new measurement of be performed, its interpretation would require improved measurements of at these energies, as well as at energies in the – GeV range, where existing data are quite old and scanty [424]. These measurements show a violation of local duality, as in this energy range they are always lower than the pQCD expectation. Many hadronic final states, detected with different detection efficiencies, contribute to the total cross section, and a measurement at 1% level may not be done in the near future.
The process is an important tool to test chiral perturbation theory at threshold [425, 426, 427], as well as being complementary to interactions for studies of electromagnetic form factors of hadrons. In spite of the large number of events collected at the present Factories, severe cuts are necessary in their selection (namely an invariant mass for pion pairs [428] and an angle in the center-of-mass frame , for pion as well proton pairs [429]. Hence chiral perturbation theory at threshold has not been tested. Furthermore at higher center-of-mass energies the angular distributions are not at all isotropic. For instance, at is consistent with , which means that of these events are lost because of the angular cuts.
Hadron spectroscopy will remain interesting in the future, whether or not it is fashionable. Evidence for non states in the charm sector has recently been observed. In particular, a candidate molecular state, the meson [430, 431, 432, 433, 434], has been found at the expected mass and with a vanishing width, with the expected quantum numbers and the expected properties, such as isospin violating decays [376]. In the light and strange quark sector, it has been suggested that the meson, which has vacuum quantum numbers, is not a state. Recently KLOE and CMD2 data on and BABAR data on strongly support the hypothesis that the meson is a tetraquark state [435]. Most of the non vector mesons suggested by QCD are expected to be isoscalar, but the luminosity produced at the current Factories by means of ISR is not high enough to explore isoscalar channels, which are weakly coupled to . There are clear hints of unexpected structures in some isoscalar channels, for instance , and in some isovector channels, 6 or . In conclusion, it is very likely that hadronic chemistry will still be topical in the next decade.
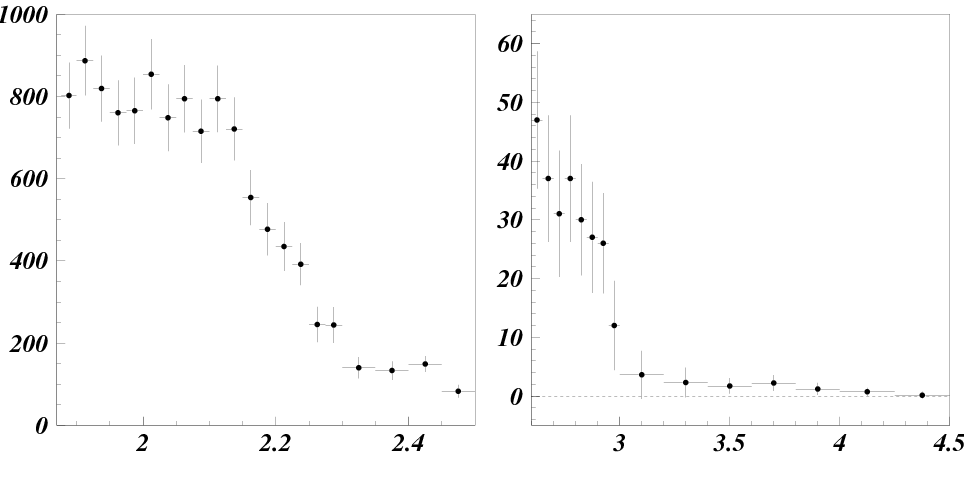
Nucleon space-like form factors were supposed to be well-established thirty years ago. In many textbooks, a scaling law between electric and magnetic form factors was discussed. However, a few years ago, this result was shown to be completely wrong [438, 439, 440, 441], although in agreement with early predictions [442, 443]. BABAR has recently made the best measurement of , showing hints of unexpected behavior, with plateaux and drops (see Fig. 21) and electric/magnetic form factors ratios varying with center-of-mass energy [444, 445] (see Fig. 23), but much more data is needed to draw a conclusion. The neutron time-like form factors (data on is shown in Fig. 23), have been measured only once, nevertheless showing , that is 8 times the naïve expectation [446]. No data exist on strange baryon form factors; baryon time-like form factors are an open field.
![[Uncaptioned image]](/html/0709.0451/assets/Physics/figures/lisbona-r-new.png)
![[Uncaptioned image]](/html/0709.0451/assets/Physics/figures/fenice_gm-new.png)
6 Summary
This chapter has described the rich physics opportunities available at Super. The unique ability of high statistics studies of , and decays at a high luminosity asymmetric Factory to clarify the flavour structure of physics beyond the Standard Model is the flagship of the program, but the wealth of precision measurements in weak decays and new discoveries in spectroscopy are also of clear interest in the coming decade.
Signals for the asymmetry , violations of lepton flavour or lepton universality symmetries in or decays, a shift in the dilepton invariant mass at which , violation in decays, or in Cabibbo-allowed or doubly-Cabibbo-suppressed charm decays, would be unmistakable signs of New Physics. These are all processes whose Standard Model contribution is either vanishingly small or already very well known, and they can only be probed at an interesting level by a Super Factory, with data samples 50 to 100 times that which will exist at the end of the BABAR and Belle programs.
At the same time, many other measurements can be performed that are sensitive to the CKM parameters in the Standard Model: they allow for a redundant determination of the UT sides and angles which could display inconsistencies signaling the presence of New Physics . To this end, precise CKM metrology, which is interesting by itself within the Standard Model, is a crucial ingredient for New Physics searches. Super can determine the UT parameters with percent errors, allowing for New Physics tests in and processes, involving all species of mesons, at the same level of accuracy. For example, a well-known class of measurements is the time-dependent asymmetries of non-leptonic decays involving transitions. These are sensitive to in the Standard Model, but are expected to receive substantial corrections in several New Physics scenarios. Super can reduce the error of the Factory measurements for these modes by more than a factor of five, which is crucial to achieving a New Physics sensitivity at the highest possible mass scale.
Another notable set of measurements are those sensitive to Higgs exchange in models with two Higgs doublets in the large regime. These include , and LUV in and decays. These measurements are a probe of Higgs-mediated New Physics effects, which can be large even in the unfavourable MFV scenario.
To take full advantage of the Super statistics, improvements in non-perturbative calculations will be necessary. Lattice QCD seems capable of achieving the required accuracy by the time Super is operational. Inclusive techniques, mainly the OPE and the heavy-quark expansion, will also profit from the large statistics of Super, which, for instance, allows unprecedentedly accurate measurements of hadronic spectra. On the other hand, in spite of recent theoretical progress, predictions for non-leptonic decays still rely to some extent on models. While the main theoretical ideas (factorization, flavour symmetries, etc.) would benefit from the improved measurements of non-leptonic modes performed at Super, New Physics searches with non-leptonic decay modes are likely to require methods allowing data-driven control over the theoretical uncertainties.
We have presented estimates of the potential for Super to measure these processes, as well as many others. We find typical improvements over previous measurements, either in error or in sensitivity, of factors between five and ten. We have given arguments to support our estimates, considering experimental systematic as well as theoretical uncertainties. The main results are collected in Tables 1 and 2.
In addition, we have tried to assess the theoretical interest of these measurements. We have clearly demonstrated that flavour physics at Super is an open window on virtual effects induced by new particles with masses up to hundreds of TeV, and that even in the MFV scenario there are processes that probe New Physics scales beyond 1 TeV. Super provides a unique opportunity to extend the New Physics reach of the LHC into the multi-TeV region. This is important, whether or not LHC finds direct evidence of New Physics. In the likely scenario that new flavoured particles are discovered at LHC, measuring the flavour-violating couplings of these new particles will become a high-priority task that can be systematically carried out only at Super. In addition, the Super sensitivity to LFV in decays reaches the theoretically interesting range, and will effectively complement the MEG result on muon LFV in helping to ascertain the underlying mechanism of LFV.
While several other interesting measurements have been discussed, from QCD-related studies with charm quarks to hadronic spectroscopy, we have certainly not touched on every aspect of heavy flavour phenomenology that can be studied at Super. There is little doubt that the richness of this phenomenology, and the window of opportunity that it offers for New Physics studies, is as unprecedented in flavour physics as is the planned peak luminosity of the accelerator and its unique capability to run at charm and threshold as well as in the region. Indeed, the potential of the Super physics program goes beyond the traditional flavour physics domain, and could have a profound impact on the future progress of particle physics.
References
- [1] N. Cabibbo, Phys. Rev. Lett. 10, 531 (1963).
- [2] M. Kobayashi and T. Maskawa, Prog. Theor. Phys. 49, 652 (1973).
- [3] M. Ciuchini et al., JHEP 0107, 013 (2001) [arXiv:hep-ph/0012308].
-
[4]
M. Bona et al. [UTfit Collaboration],
JHEP 0507, 028 (2005)
[arXiv:hep-ph/0501199]. Updates: http://www.utfit.org/ -
[5]
M. Bona et al. [UTfit Collaboration],
JHEP 0603, 080 (2006)
[arXiv:hep-ph/0509219]. Updates: http://www.utfit.org/ -
[6]
M. Bona et al. [UTfit Collaboration],
JHEP 0610, 081 (2006)
[arXiv:hep-ph/0606167]. Updates: http://www.utfit.org/ -
[7]
J. Charles et al. [CKMfitter Group],
Eur. Phys. J. C 41, 1 (2005)
[arXiv:hep-ph/0406184]. Updates: http://ckmfitter.in2p3.fr/ - [8] A. B. Carter and A. I. Sanda, Phys. Rev. D 23, 1567 (1981).
- [9] I. I. Y. Bigi and A. I. Sanda, Nucl. Phys. B 193, 85 (1981).
- [10] B. Aubert et al. [BABAR Collaboration], [arXiv:hep-ex/0607107].
- [11] K. F. Chen et al. [Belle Collaboration], Phys. Rev. Lett. 98, 031802 (2007) [arXiv:hep-ex/0608039].
-
[12]
Heavy Flavour Averaging Group (E. Barberio et al.), [arXiv:hep-ex/0603003].
Updates and plots: http://www.slac.stanford.edu/xorg/hfag/ - [13] O. Long, M. Baak, R. N. Cahn and D. Kirkby, Phys. Rev. D 68, 034010 (2003) [arXiv:hep-ex/0303030].
- [14] H. Boos, T. Mannel and J. Reuter, Phys. Rev. D 70, 036006 (2004) [arXiv:hep-ph/0403085].
- [15] H. n. Li and S. Mishima, [arXiv:hep-ph/0610120].
- [16] M. Ciuchini, M. Pierini and L. Silvestrini, Phys. Rev. Lett. 95, 221804 (2005) [arXiv:hep-ph/0507290].
- [17] D. Atwood and G. Hiller, [arXiv:hep-ph/0307251].
- [18] W. S. Hou, M. Nagashima and A. Soddu, [arXiv:hep-ph/0605080].
- [19] I. Dunietz, H. R. Quinn, A. Snyder, W. Toki and H. J. Lipkin, Phys. Rev. D 43, 2193 (1991).
- [20] A. S. Dighe, I. Dunietz and R. Fleischer, Phys. Lett. B 433, 147 (1998) [arXiv:hep-ph/9804254].
- [21] B. Aubert et al. [BABAR Collaboration], Phys. Rev. D 71, 032005 (2005) [arXiv:hep-ex/0411016].
- [22] R. Itoh et al. [Belle Collaboration], Phys. Rev. Lett. 95, 091601 (2005) [arXiv:hep-ex/0504030].
-
[23]
Y. Grossman and M. P. Worah,
Phys. Lett. B 395, 241 (1997)
[arXiv:hep-ph/9612269]. - [24] R. Fleischer, Phys. Lett. B 562, 234 (2003) [arXiv:hep-ph/0301255].
- [25] R. Fleischer, Nucl. Phys. B 659, 321 (2003) [arXiv:hep-ph/0301256].
- [26] B. Aubert [BABAR Collaboration], [arXiv:hep-ex/0703019].
- [27] A. Bondar, T. Gershon and P. Krokovny, Phys. Lett. B 624, 1 (2005) [arXiv:hep-ph/0503174].
- [28] D. London and A. Soni, Phys. Lett. B 407, 61 (1997) [arXiv:hep-ph/9704277].
- [29] M. Ciuchini, E. Franco, G. Martinelli, A. Masiero and L. Silvestrini, Phys. Rev. Lett. 79, 978 (1997) [arXiv:hep-ph/9704274].
- [30] Y. Grossman, Z. Ligeti, Y. Nir and H. Quinn, Phys. Rev. D 68, 015004 (2003) [arXiv:hep-ph/0303171].
- [31] M. Gronau, Y. Grossman and J. L. Rosner, Phys. Lett. B 579, 331 (2004) [arXiv:hep-ph/0310020].
- [32] M. Gronau, J. L. Rosner and J. Zupan, Phys. Lett. B 596, 107 (2004) [arXiv:hep-ph/0403287].
- [33] H. Y. Cheng, C. K. Chua and A. Soni, Phys. Rev. D 72, 014006 (2005) [arXiv:hep-ph/0502235].
- [34] H. Y. Cheng, C. K. Chua and A. Soni, Phys. Rev. D 72, 094003 (2005) [arXiv:hep-ph/0506268].
-
[35]
M. Gronau and J. L. Rosner,
Phys. Rev. D 71, 074019 (2005)
[arXiv:hep-ph/0503131]. - [36] M. Beneke, Phys. Lett. B 620, 143 (2005) [arXiv:hep-ph/0505075].
-
[37]
G. Engelhard, Y. Nir and G. Raz,
Phys. Rev. D 72, 075013 (2005)
[arXiv:hep-ph/0505194]. -
[38]
G. Buchalla, G. Hiller, Y. Nir and G. Raz,
JHEP 0509, 074 (2005)
[arXiv:hep-ph/0503151]. - [39] M. Gronau, J. L. Rosner and J. Zupan, Phys. Rev. D 74, 093003 (2006) [arXiv:hep-ph/0608085].
-
[40]
M. Pierini,
SLAC seminar available from
https://www.slac.stanford.edu
/exp/seminar/talks/2005/Pierini/CharmingPenguins.pdf - [41] M. Pierini, “An update on charming penguins in charmless decays”, presented at 4th International Workshop on the CKM Unitarity Triangle, Nagoya, Japan, December 12-16, 2006.
- [42] B. Aubert et al. [BABAR Collaboration], [arXiv:hep-ex/0607112].
- [43] B. Aubert et al. [BABAR Collaboration], Phys. Rev. Lett. 98, 031801 (2007) [arXiv:hep-ex/0609052].
- [44] B. Aubert et al. [BABAR Collaboration], [arXiv:hep-ex/0607108].
- [45] S. Hashimoto and M. Hazumi (ed.), KEK-REPORT-2004-4; A. Akeroyd et al. (SuperKEKB Physics Working Group), [arXiv:hep-ex/0406071];
- [46] J.L. Hewett, D. Hitlin (ed.), SLAC-R-709, [arXiv:hep-ph/0503261].
- [47] T. Gershon and A. Soni, J. Phys. G: Nucl. Part. Phys. 34, 479 (2007) [arXiv:hep-ph/0607230].
- [48] B. Aubert et al. [BABAR Collaboration], [arXiv:hep-ex/0607096].
- [49] K. Abe et al. [Belle Collaboration], [arXiv:hep-ex/0609006].
- [50] B. Aubert et al. [BABAR Collaboration], [arXiv:hep-ex/0608051].
- [51] B. Aubert et al. [BABAR Collaboration], [arXiv:hep-ex/0607101].
- [52] B. Aubert et al. [BABAR Collaboration], [arXiv:hep-ex/0408095].
-
[53]
T. Gershon and M. Hazumi,
Phys. Lett. B 596, 163 (2004)
[arXiv:hep-ph/0402097]. - [54] M. Gronau and D. London, Phys. Lett. B 253, 483 (1991).
- [55] M. Gronau and D. Wyler, Phys. Lett. B 265, 172 (1991).
- [56] D. Atwood, I. Dunietz and A. Soni, Phys. Rev. Lett. 78, 3257 (1997) [arXiv:hep-ph/9612433].
-
[57]
D. Atwood, I. Dunietz and A. Soni,
Phys. Rev. D 63, 036005 (2001)
[arXiv:hep-ph/0008090]. - [58] A. Giri, Y. Grossman, A. Soffer and J. Zupan, Phys. Rev. D 68, 054018 (2003) [arXiv:hep-ph/0303187].
- [59] M. Gronau, Y. Grossman, N. Shuhmaher, A. Soffer and J. Zupan, Phys. Rev. D 69, 113003 (2004) [arXiv:hep-ph/0402055].
-
[60]
A. Bondar and T. Gershon,
Phys. Rev. D 70, 091503 (2004)
[arXiv:hep-ph/0409281]. - [61] B. Aubert et al. [BABAR Collaboration], Phys. Rev. D 73, 051105 (2006) [arXiv:hep-ex/0512067].
-
[62]
K. Abe et al. [Belle Collaboration],
Phys. Rev. D 73, 051106 (2006)
[arXiv:hep-ex/0601032]. - [63] B. Aubert et al. [BABAR Collaboration], Phys. Rev. D 71, 031102 (2005) [arXiv:hep-ex/0411091].
- [64] B. Aubert et al. [BABAR Collaboration], Phys. Rev. D 72, 071103 (2005) [arXiv:hep-ex/0507002].
- [65] B. Aubert et al. [BABAR Collaboration], Phys. Rev. D 72, 032004 (2005) [arXiv:hep-ex/0504047].
- [66] K. Abe et al., [arXiv:hep-ex/0508048].
- [67] B. Aubert et al. [BABAR Collaboration], Phys. Rev. D 72, 071104 (2005) [arXiv:hep-ex/0508001].
- [68] B. Aubert et al. [BABAR Collaboration], [arXiv:hep-ex/0607065].
- [69] B. Aubert et al. [BABAR Collaboration], [arXiv:hep-ex/0607104].
- [70] A. Poluektov et al. [Belle Collaboration], Phys. Rev. D 73, 112009 (2006) [arXiv:hep-ex/0604054].
- [71] B. Aubert et al. [BABAR Collaboration], [arXiv:hep-ex/0507101].
- [72] See the material prepared for the Particle Physics Project Prioritization Panel (P-5) DOE/NSF HEPAP Subpanel visit to SLAC October 6-7, 2005: http://www.slac.stanford.edu/BFROOT/www/Organization/Spokesperson/P5/
-
[73]
A. Bondar and A. Poluektov,
Eur. Phys. J. C 47, 347 (2006)
[arXiv:hep-ph/0510246]. - [74] Y. Grossman, Z. Ligeti and A. Soffer, Phys. Rev. D 67, 071301 (2003) [arXiv:hep-ph/0210433].
- [75] J. Rademacker and G. Wilkinson, [arXiv:hep-ph/0611272].
- [76] S. Pruvot, M. H. Schune, V. Sordini and A. Stocchi, arXiv:hep-ph/0703292.
- [77] Y. Grossman, A. Soffer and J. Zupan, Phys. Rev. D 72, 031501 (2005) [arXiv:hep-ph/0505270].
- [78] B. Aubert et al. [BABAR Collaboration], Phys. Rev. D 73, 111101 (2006) [arXiv:hep-ex/0602049].
- [79] B. Aubert et al. [BABAR Collaboration], Phys. Rev. D 71, 112003 (2005) [arXiv:hep-ex/0504035].
- [80] F. J. Ronga et al. [Belle Collaboration], Phys. Rev. D 73, 092003 (2006) [arXiv:hep-ex/0604013].
- [81] J. Charles, A. Le Yaouanc, L. Oliver, O. Pene and J. C. Raynal, Phys. Lett. B 425, 375 (1998) [Erratum-ibid. B 433, 441 (1998)] [arXiv:hep-ph/9801363].
- [82] R. Aleksan, T. C. Petersen and A. Soffer, Phys. Rev. D 67, 096002 (2003) [arXiv:hep-ph/0209194].
- [83] G. Cavoto et al., [arXiv:hep-ph/0603019].
- [84] F. Polci, M. H. Schune and A. Stocchi, [arXiv:hep-ph/0605129].
- [85] M. Gronau and D. London, Phys. Rev. Lett. 65, 3381 (1990).
- [86] B. Aubert et al. [BABAR Collaboration], [arXiv:hep-ex/0607106].
- [87] H. Ishino et al. [Belle Collaboration], [arXiv:hep-ex/0608035].
- [88] B. Aubert et al. [BABAR Collaboration], [arXiv:hep-ex/0607098].
- [89] K. Abe et al. [Belle Collaboration], [arXiv:hep-ex/0702009].
- [90] A. E. Snyder and H. R. Quinn, Phys. Rev. D 48, 2139 (1993).
- [91] B. Aubert et al. [BABAR Collaboration], [arXiv:hep-ex/0608002].
- [92] K. Abe et al. [Belle Collaboration], [arXiv:hep-ex/0609003].
-
[93]
A. Kusaka, C. C. Wang and H. Ishino [Belle Collaboration],
[arXiv:hep-ex/0701015]. - [94] A. J. Bevan, [arXiv:hep-ex/0701031].
- [95] M. Gronau, D. Pirjol and T. M. Yan, Phys. Rev. D 60, 034021 (1999) [Erratum-ibid. D 69, 119901 (2004)] [arXiv:hep-ph/9810482].
- [96] J. Zupan, [arXiv:hep-ph/0701004].
- [97] S. Gardner, Phys. Rev. D 72, 034015 (2005) [arXiv:hep-ph/0505071].
- [98] F. J. Botella, D. London and J. P. Silva, Phys. Rev. D 73, 071501 (2006) [arXiv:hep-ph/0602060].
- [99] A. F. Falk, Z. Ligeti, Y. Nir and H. Quinn, Phys. Rev. D 69, 011502 (2004) [arXiv:hep-ph/0310242].
- [100] K. Ikado et al., Phys. Rev. Lett. 97, 251802 (2006) [arXiv:hep-ex/0604018].
- [101] B. Aubert et al. [BABAR Collaboration], [arXiv:hep-ex/0608019].
- [102] N. Satoyama [Belle Collaboration], [arXiv:hep-ex/0611045].
- [103] W. S. Hou, Phys. Rev. D 48, 2342 (1993).
- [104] G. Isidori and P. Paradisi, Nucl. Phys. Proc. Suppl. 163, 192 (2007).
- [105] K. Abe et al. [Belle Collaboration], [arXiv:hep-ex/0408132].
- [106] G. P. Korchemsky, D. Pirjol and T. M. Yan, Phys. Rev. D 61, 114510 (2000) [arXiv:hep-ph/9911427].
- [107] B. Aubert et al. [BABAR Collaboration], Phys. Rev. Lett. 94, 221803 (2005) [arXiv:hep-ex/0408096].
- [108] B. Aubert et al. [BABAR Collaboration], Phys. Rev. Lett. 96, 241802 (2006) [arXiv:hep-ex/0511015].
- [109] M. S. Alam et al. [CLEO Collaboration], Phys. Rev. Lett. 74, 2885 (1995).
- [110] B. Aubert et al. [BABAR Collaboration], Phys. Rev. D 70, 112006 (2004) [arXiv:hep-ex/0407003].
- [111] M. Nakao et al. [Belle Collaboration], Phys. Rev. D 69, 112001 (2004) [arXiv:hep-ex/0402042].
- [112] A. Ali and V. M. Braun, Phys. Lett. B 359, 223 (1995) [arXiv:hep-ph/9506248].
- [113] M. Beyer, D. Melikhov, N. Nikitin and B. Stech, Phys. Rev. D 64, 094006 (2001) [arXiv:hep-ph/0106203].
-
[114]
A. Ali and A. Y. Parkhomenko,
Eur. Phys. J. C 23, 89 (2002)
[arXiv:hep-ph/0105302]. - [115] P. Ball and R. Zwicky, JHEP 0604, 046 (2006) [arXiv:hep-ph/0603232].
- [116] K. Abe et al., Phys. Rev. Lett. 96, 221601 (2006) [arXiv:hep-ex/0506079].
-
[117]
B. Aubert [BABAR Collaboration],
Phys. Rev. D 66, 010001 (2002)
[arXiv:hep-ex/0612017]. - [118] M. Misiak et al., Phys. Rev. Lett. 98, 022002 (2007) [arXiv:hep-ph/0609232].
-
[119]
M. Misiak and M. Steinhauser,
Nucl. Phys. B 764, 62 (2007)
[arXiv:hep-ph/0609241]. - [120] T. Becher and M. Neubert, Phys. Rev. Lett. 98 022003 (2007) [arXiv:hep-ph/0610067].
- [121] J. R. Andersen and E. Gardi, JHEP 0701, 029 (2007) [arXiv:hep-ph/0609250].
- [122] B. Aubert et al. [BABAR Collaboration], Phys. Rev. D 72, 052004 (2005) [arXiv:hep-ex/0508004].
-
[123]
P. Koppenburg et al. [Belle Collaboration],
Phys. Rev. Lett. 93, 061803 (2004)
[arXiv:hep-ex/0403004]. -
[124]
M. Neubert,
Phys. Rev. D 49, 4623 (1994)
[arXiv:hep-ph/9312311]. -
[125]
A. L. Kagan and M. Neubert,
Eur. Phys. J. C 7, 5 (1999)
[arXiv:hep-ph/9805303]. -
[126]
S. W. Bosch, M. Neubert and G. Paz,
JHEP 0411, 073 (2004)
[arXiv:hep-ph/0409115]. - [127] M. Neubert, Eur. Phys. J. C 44, 205 (2005) [arXiv:hep-ph/0411027].
- [128] M. Neubert, Phys. Lett. B 612, 13 (2005) [arXiv:hep-ph/0412241].
-
[129]
I. Bigi and N. Uraltsev,
Int. J. Mod. Phys. A 17, 4709 (2002)
[arXiv:hep-ph/0202175]. -
[130]
D. Benson, I. I. Bigi and N. Uraltsev,
Nucl. Phys. B 710, 371 (2005)
[arXiv:hep-ph/0410080]. -
[131]
O. Buchmuller and H. Flacher,
Phys. Rev. D 73, 073008 (2006)
[arXiv:hep-ph/0507253]. - [132] S. Chen et al. [CLEO Collaboration], Phys. Rev. Lett. 87, 251807 (2001) [arXiv:hep-ex/0108032].
-
[133]
T. Hurth, E. Lunghi and W. Porod,
Nucl. Phys. B 704, 56 (2005)
[arXiv:hep-ph/0312260]. - [134] B. Aubert et al. [BABAR Collaboration], Phys. Rev. Lett. 93, 021804 (2004) [arXiv:hep-ex/0403035].
- [135] S. Nishida et al. [Belle Collaboration], Phys. Rev. Lett. 93, 031803 (2004) [arXiv:hep-ex/0308038].
- [136] J. M. Soares, Nucl. Phys. B 367, 575 (1991).
- [137] T. Hurth and T. Mannel, Phys. Lett. B 511, 196 (2001) [arXiv:hep-ph/0103331].
-
[138]
T. Hurth and T. Mannel,
AIP Conf. Proc. 602, 212 (2001)
[arXiv:hep-ph/0109041]. - [139] J. Chay, C. Kim, A. K. Leibovich and J. Zupan, Phys. Rev. D 74, 074022 (2006) [arXiv:hep-ph/0607004].
- [140] B. Aubert et al. [BABAR Collaboration], Phys. Rev. Lett. 97, 171803 (2006) [arXiv:hep-ex/0607071].
- [141] D. Atwood, M. Gronau and A. Soni, Phys. Rev. Lett. 79, 185 (1997) [arXiv:hep-ph/9704272].
- [142] B. Grinstein, Y. Grossman, Z. Ligeti and D. Pirjol, Phys. Rev. D 71, 011504 (2005) [arXiv:hep-ph/0412019].
- [143] D. Atwood, T. Gershon, M. Hazumi and A. Soni, Phys. Rev. D 71, 076003 (2005) [arXiv:hep-ph/0410036].
-
[144]
B. Grinstein and D. Pirjol,
Phys. Rev. D 73, 014013 (2006)
[arXiv:hep-ph/0510104]. -
[145]
M. Matsumori and A. I. Sanda,
Phys. Rev. D 73, 114022 (2006)
[arXiv:hep-ph/0512175]. - [146] P. Ball and R. Zwicky, Phys. Lett. B 642, 478 (2006) [arXiv:hep-ph/0609037].
- [147] P. Ball, G. W. Jones and R. Zwicky, [arXiv:hep-ph/0612081].
- [148] B. Aubert et al. [BABAR Collaboration], Phys. Rev. D 72, 051103 (2005) [arXiv:hep-ex/0507038].
- [149] Y. Ushiroda et al. [Belle Collaboration], Phys. Rev. D 74, 111104 (2006) [arXiv:hep-ex/0608017].
-
[150]
S. Nishida et al. [Belle Collaboration],
Phys. Lett. B 610, 23 (2005)
[arXiv:hep-ex/0411065]. - [151] B. Aubert et al. [BABAR Collaboration], Phys. Rev. D 74, 031102 (2006) [arXiv:hep-ex/0603054].
- [152] A. Drutskoy et al. [Belle Collaboration], Phys. Rev. Lett. 92, 051801 (2004) [arXiv:hep-ex/0309006].
- [153] B. Aubert [BABAR Collaboration], [arXiv:hep-ex/0611037].
-
[154]
M. Gronau and D. Pirjol,
Phys. Rev. D 66, 054008 (2002)
[arXiv:hep-ph/0205065]. - [155] M. Gronau, Y. Grossman, D. Pirjol and A. Ryd, Phys. Rev. Lett. 88, 051802 (2002) [arXiv:hep-ph/0107254].
- [156] J. P. Lee, Phys. Rev. D 69, 014017 (2004) [arXiv:hep-ph/0309018].
- [157] D. Atwood, T. Gershon, M. Hazumi and A. Soni, [arXiv:hep-ph/0701021].
-
[158]
Y. Grossman and D. Pirjol,
Phys. Rev. D 66, 010001 (2002)
[arXiv:hep-ph/0005069]. -
[159]
L. M. Sehgal and J. van Leusen,
Phys. Lett. B 591, 235 (2004)
[arXiv:hep-ph/0403215]. - [160] Proceedings of the International Workshops on Factories and New Measurements (BNM2006I and BNM2006II), in preparation.
- [161] G. Burdman, Phys. Rev. D 52, 6400 (1995) [arXiv:hep-ph/9505352].
- [162] A. Ali and G. Hiller, Eur. Phys. J. C 8, 619 (1999) [arXiv:hep-ph/9812267].
- [163] K. S. M. Lee, Z. Ligeti, I. W. Stewart and F. J. Tackmann, Phys. Rev. D 75, 034016 (2007) [arXiv:hep-ph/0612156].
- [164] E. Lunghi, A. Masiero, I. Scimemi and L. Silvestrini, Nucl. Phys. B 568, 120 (2000) [arXiv:hep-ph/9906286].
- [165] A. Ali, P. Ball, L. T. Handoko and G. Hiller, Phys. Rev. D 61, 074024 (2000) [arXiv:hep-ph/9910221].
- [166] A. S. Cornell, N. Gaur and S. K. Singh, [arXiv:hep-ph/0505136].
- [167] A. J. Buras, A. Poschenrieder, M. Spranger and A. Weiler, Nucl. Phys. B 678, 455 (2004) [arXiv:hep-ph/0306158].
- [168] A. Hovhannisyan, W. S. Hou and N. Mahajan, [arXiv:hep-ph/0701046].
- [169] H. H. Asatryan, H. M. Asatrian, C. Greub and M. Walker, Phys. Rev. D 65 (2002) 074004 [arXiv:hep-ph/0109140].
- [170] A. Ghinculov, T. Hurth, G. Isidori and Y. P. Yao, Nucl. Phys. B 648 (2003) 254 [arXiv:hep-ph/0208088].
- [171] A. Ghinculov, T. Hurth, G. Isidori and Y. P. Yao, Nucl. Phys. B 685 (2004) 351 [arXiv:hep-ph/0312128].
- [172] H. M. Asatrian, K. Bieri, C. Greub and A. Hovhannisyan, Phys. Rev. D 66 (2002) 094013 [arXiv:hep-ph/0209006].
- [173] C. Bobeth, M. Misiak and J. Urban, Nucl. Phys. B 574 (2000) 291 [arXiv:hep-ph/9910220].
- [174] C. Bobeth, P. Gambino, M. Gorbahn and U. Haisch, JHEP 0404 (2004) 071 [arXiv:hep-ph/0312090].
- [175] T. Hurth, arXiv:hep-ph/0703226.
- [176] B. Aubert et al. [BABAR Collaboration], Phys. Rev. D 73, 092001 (2006) [arXiv:hep-ex/0604007].
- [177] A. Ishikawa et al., Phys. Rev. Lett. 96, 251801 (2006) [arXiv:hep-ex/0603018].
- [178] B. Aubert et al. [BABAR Collaboration], [arXiv:hep-ex/0607048].
- [179] B. Aubert et al. [BABAR Collaboration], Phys. Rev. Lett. 93, 081802 (2004) [arXiv:hep-ex/0404006].
- [180] M. Iwasaki et al. [Belle Collaboration], Phys. Rev. D 72, 092005 (2005) [arXiv:hep-ex/0503044].
- [181] L. S. Littenberg, Phys. Rev. D 39, 3322 (1989).
- [182] J. S. Hagelin and L. S. Littenberg, Prog. Part. Nucl. Phys. 23, 1 (1989).
- [183] D. Rein and L. M. Sehgal, Phys. Rev. D 39, 3325 (1989).
-
[184]
G. Buchalla and A. J. Buras,
Nucl. Phys. B 412, 106 (1994)
[arXiv:hep-ph/9308272]. - [185] A. J. Buras, M. E. Lautenbacher and G. Ostermaier, Phys. Rev. D 50, 3433 (1994) [arXiv:hep-ph/9403384].
-
[186]
G. Buchalla and A. J. Buras,
Phys. Rev. D 54, 6782 (1996)
[arXiv:hep-ph/9607447]. - [187] A. J. Buras, A. Romanino and L. Silvestrini, Nucl. Phys. B 520, 3 (1998) [arXiv:hep-ph/9712398].
- [188] B. Aubert et al. [BABAR Collaboration], [arXiv:hep-ex/0408086].
- [189] K. Abe et al. [Belle Collaboration], [arXiv:hep-ex/0507034].
-
[190]
D. Atwood and A. Soni,
Phys. Rev. D 58, 036005 (1998)
[arXiv:hep-ph/9712287]. - [191] H. J. Lipkin, Phys. Lett. B 445, 403 (1999) [arXiv:hep-ph/9810351].
- [192] M. Gronau, Phys. Lett. B 627, 82 (2005) [arXiv:hep-ph/0508047].
- [193] J. Matias, Phys. Lett. B 520, 131 (2001) [arXiv:hep-ph/0105103].
-
[194]
M. Gronau and J. L. Rosner,
Phys. Rev. D 74, 057503 (2006)
[arXiv:hep-ph/0608040]. -
[195]
M. Gronau and J. L. Rosner,
Phys. Lett. B 644, 237 (2007)
[arXiv:hep-ph/0610227]. - [196] M. Gronau, J. L. Rosner and D. London, Phys. Rev. Lett. 73, 21 (1994) [arXiv:hep-ph/9404282].
- [197] O. F. Hernandez, D. London, M. Gronau and J. L. Rosner, Phys. Lett. B 333, 500 (1994) [arXiv:hep-ph/9404281].
- [198] M. Ciuchini, E. Franco, G. Martinelli and L. Silvestrini, Nucl. Phys. B 501, 271 (1997) [arXiv:hep-ph/9703353].
-
[199]
A. J. Buras and L. Silvestrini,
Nucl. Phys. B 569, 3 (2000)
[arXiv:hep-ph/9812392]. - [200] A. L. Kagan, Phys. Lett. B 601, 151 (2004) [arXiv:hep-ph/0405134].
- [201] A. L. Kagan, [arXiv:hep-ph/0407076].
- [202] S. Baek, A. Datta, P. Hamel, O. F. Hernandez and D. London, Phys. Rev. D 72, 094008 (2005) [arXiv:hep-ph/0508149].
-
[203]
A. Datta and D. London,
Int. J. Mod. Phys. A 19, 2505 (2004)
[arXiv:hep-ph/0303159]. - [204] D. London, N. Sinha and R. Sinha, Phys. Rev. D 66, 010001 (2002) [arXiv:hep-ph/0005248].
-
[205]
D. London, N. Sinha and R. Sinha,
Phys. Rev. D 69, 114013 (2004)
[arXiv:hep-ph/0402214]. -
[206]
D. London, N. Sinha and R. Sinha,
Europhys. Lett. 67, 579 (2004)
[arXiv:hep-ph/0304230]. - [207] M. Ciuchini, M. Pierini and L. Silvestrini, Phys. Rev. D 74, 051301 (2006) [arXiv:hep-ph/0601233].
- [208] M. Ciuchini, M. Pierini and L. Silvestrini, Phys. Lett. B 645, 201 (2007) [arXiv:hep-ph/0602207].
- [209] M. Gronau, D. Pirjol, A. Soni and J. Zupan, Phys. Rev. D 75, 014002 (2007) [arXiv:hep-ph/0608243].
- [210] H. n. Li and H. L. Yu, Phys. Rev. D 66, 010001 (2002) [arXiv:hep-ph/9411308].
- [211] Y. Y. Keum, H. N. Li and A. I. Sanda, Phys. Rev. D 63, 054008 (2001) [arXiv:hep-ph/0004173].
- [212] M. Beneke, G. Buchalla, M. Neubert and C. T. Sachrajda, Nucl. Phys. B 591, 313 (2000) [arXiv:hep-ph/0006124].
- [213] M. Ciuchini, E. Franco, G. Martinelli, M. Pierini and L. Silvestrini, Phys. Lett. B 515, 33 (2001) [arXiv:hep-ph/0104126].
-
[214]
M. Beneke and M. Neubert,
Nucl. Phys. B 675, 333 (2003)
[arXiv:hep-ph/0308039]. - [215] C. W. Bauer, S. Fleming and M. E. Luke, Phys. Rev. D 66, 010001 (2002) [arXiv:hep-ph/0005275].
- [216] C. W. Bauer, S. Fleming, D. Pirjol and I. W. Stewart, Phys. Rev. D 63, 114020 (2001) [arXiv:hep-ph/0011336].
- [217] A. Mohapatra, M. Satpathy, K. Abe and Y. Sakai, Phys. Rev. D 58, 036003 (1998).
-
[218]
R. N. Cahn and M. P. Worah,
Phys. Rev. D 60, 076006 (1999)
[arXiv:hep-ph/9904480]. - [219] M. Ciuchini, E. Franco, V. Lubicz, F. Mescia and C. Tarantino, JHEP 0308, 031 (2003) [arXiv:hep-ph/0308029].
- [220] M. Beneke, G. Buchalla, A. Lenz and U. Nierste, Phys. Lett. B 576, 173 (2003) [arXiv:hep-ph/0307344].
- [221] E. Nakano et al. [Belle Collaboration], Phys. Rev. D 73, 112002 (2006) [arXiv:hep-ex/0505017].
- [222] B. Aubert et al. [BABAR Collaboration], Phys. Rev. Lett. 96, 251802 (2006) [arXiv:hep-ex/0603053].
- [223] B. Aubert et al. [BABAR Collaboration], [arXiv:hep-ex/0607091].
- [224] S. Laplace, Z. Ligeti, Y. Nir and G. Perez, Phys. Rev. D 65, 094040 (2002) [arXiv:hep-ph/0202010].
- [225] P. Ren and Z. z. Xing, arXiv:hep-ph/0703249.
- [226] N. C. Hastings et al. [Belle Collaboration], Phys. Rev. D 67, 052004 (2003) [arXiv:hep-ex/0212033].
- [227] J. S. Bell, Physics 1, 195 (1964).
- [228] J. F. Clauser, M. A. Horne, A. Shimony and R. A. Holt, Phys. Rev. Lett. 23, 880 (1969).
- [229] A. Einstein, B. Podolsky and N. Rosen, Phys. Rev. 47, 777 (1935).
- [230] A. Datta and D. Home, Phys. Lett. A 119, 3 (1986).
- [231] A. Go and A. Bay [Belle Collaboration], [arXiv:quant-ph/0702267].
-
[232]
See talk by O. Schneider at
LHC Collaboration Upgrade Workshop, January 2007,
available from
http://indico.cern.ch/conferenceDisplay.py?confId=8351 - [233] J. M. Soares and L. Wolfenstein, Phys. Rev. D 47, 1021 (1993).
- [234] N. G. Deshpande, B. Dutta and S. Oh, Phys. Rev. Lett. 77, 4499 (1996) [arXiv:hep-ph/9608231].
-
[235]
J. P. Silva and L. Wolfenstein,
Phys. Rev. D 55, 5331 (1997)
[arXiv:hep-ph/9610208]. - [236] A. G. Cohen, D. B. Kaplan, F. Lepeintre and A. E. Nelson, Phys. Rev. Lett. 78, 2300 (1997) [arXiv:hep-ph/9610252].
- [237] Y. Grossman, Y. Nir and M. P. Worah, Phys. Lett. B 407, 307 (1997) [arXiv:hep-ph/9704287].
-
[238]
Y. Grossman and H. R. Quinn,
Phys. Rev. D 56, 7259 (1997)
[arXiv:hep-ph/9705356]. -
[239]
F. J. Botella and J. P. Silva,
Phys. Rev. D 71, 094008 (2005)
[arXiv:hep-ph/0503136]. -
[240]
E. Gabrielli and G. F. Giudice,
Nucl. Phys. B 433, 3 (1995)
[Erratum-ibid.
B 507 (1997) 549] [arXiv:hep-lat/9407029]. - [241] A. J. Buras, P. Gambino, M. Gorbahn, S. Jager and L. Silvestrini, Phys. Lett. B 500, 161 (2001) [arXiv:hep-ph/0007085].
- [242] G. D’Ambrosio, G. F. Giudice, G. Isidori and A. Strumia, Nucl. Phys. B 645, 155 (2002) [arXiv:hep-ph/0207036].
- [243] K. Agashe, M. Papucci, G. Perez and D. Pirjol, [arXiv:hep-ph/0509117].
- [244] M. Bona et al. [UTfit Collaboration], in preparation.
-
[245]
G. Isidori and P. Paradisi,
Phys. Lett. B 639, 499 (2006)
[arXiv:hep-ph/0605012]. - [246] A. Masiero, P. Paradisi and R. Petronzio, Phys. Rev. D 74, 011701 (2006) [arXiv:hep-ph/0511289].
- [247] L. J. Hall, V. A. Kostelecky and S. Raby, Nucl. Phys. B 267, 415 (1986).
- [248] F. Gabbiani, E. Gabrielli, A. Masiero and L. Silvestrini, Nucl. Phys. B 477, 321 (1996) [arXiv:hep-ph/9604387].
- [249] D. Becirevic et al., Nucl. Phys. B 634, 105 (2002) [arXiv:hep-ph/0112303].
- [250] M. Ciuchini, E. Franco, A. Masiero and L. Silvestrini, Phys. Rev. D 67, 075016 (2003) [Erratum-ibid. D 68, 079901 (2003)] [arXiv:hep-ph/0212397].
-
[251]
J. A. Casas and S. Dimopoulos,
Phys. Lett. B 387, 107 (1996)
[arXiv:hep-ph/9606237]. - [252] L. Silvestrini, “Flavour physics in SUSY beyond MFV”, presented at 4th International Workshop on the CKM Unitarity Triangle, Nagoya, Japan, December 12-16, 2006.
- [253] F. Borzumati and A. Masiero, Phys. Rev. Lett. 57, 961 (1986).
-
[254]
R. Barbieri and L. J. Hall,
Phys. Lett. B 338, 212 (1994)
[arXiv:hep-ph/9408406]. - [255] R. Barbieri, L. J. Hall and A. Strumia, Nucl. Phys. B 445, 219 (1995) [arXiv:hep-ph/9501334].
- [256] B. Aubert et al. [BABAR Collaboration], Phys. Rev. Lett. 95, 041802 (2005) [arXiv:hep-ex/0502032].
- [257] B. Aubert et al. [BABAR Collaboration], Phys. Rev. Lett. 96, 041801 (2006) [arXiv:hep-ex/0508012].
- [258] B. Aubert et al. [BABAR Collaboration], Phys. Rev. Lett. 92, 121801 (2004) [arXiv:hep-ex/0312027].
-
[259]
Y. Enari et al. [Belle Collaboration],
Phys. Lett. B 622, 218 (2005)
[arXiv:hep-ex/0503041]. - [260] M. L. Brooks et al. [MEGA Collaboration], Phys. Rev. Lett. 83, 1521 (1999) [arXiv:hep-ex/9905013].
- [261] U. Bellgardt et al. [SINDRUM Collaboration], Nucl. Phys. B 299, 1 (1988).
- [262] C. Dohmen et al. [SINDRUM II Collaboration.], Phys. Lett. B 317, 631 (1993).
-
[263]
W. M. Yao et al. [Particle Data Group],
J. Phys. G 33, 1 (2006)
http://pdg.lbl.gov. - [264] L. Calibbi, A. Faccia, A. Masiero and S. K. Vempati, Phys. Rev. D 74, 116002 (2006) [arXiv:hep-ph/0605139].
-
[265]
K. S. Babu and C. Kolda,
Phys. Rev. Lett. 89, 241802 (2002)
[arXiv:hep-ph/0206310]. - [266] P. Paradisi, JHEP 0602, 050 (2006) [arXiv:hep-ph/0508054];
- [267] P. Paradisi, JHEP 0608, 047 (2006) [arXiv:hep-ph/0601100].
- [268] M. Blanke, A. J. Buras, B. Duling, A. Poschenrieder and C. Tarantino, [arXiv:hep-ph/0702136].
- [269] R. S. Chivukula and H. Georgi, Phys. Lett. B 188, 99 (1987).
- [270] L. J. Hall and L. Randall, Phys. Rev. Lett. 65, 2939 (1990).
- [271] V. Cirigliano, B. Grinstein, G. Isidori and M. B. Wise, Nucl. Phys. B 728, 121 (2005) [arXiv:hep-ph/0507001].
- [272] B. Grinstein, V. Cirigliano, G. Isidori and M. B. Wise, Nucl. Phys. B 763, 35 (2007) [arXiv:hep-ph/0608123].
- [273] M. Grassi [MEG Collaboration], Nucl. Phys. Proc. Suppl. 149, 369 (2005).
- [274] N. Arkani-Hamed, A. G. Cohen, E. Katz and A. E. Nelson, JHEP 0207 (2002) 034 [arXiv:hep-ph/0206021].
- [275] H. C. Cheng and I. Low, JHEP 0309 (2003) 051 [arXiv:hep-ph/0308199].
- [276] R. D. Cousins and V. L. Highland, Nucl. Instrum. Meth. A 320, 331 (1992).
- [277] B. Aubert et al. [BABAR Collaboration], Phys. Rev. Lett. 95, 191801 (2005) [arXiv:hep-ex/0506066].
- [278] Y. Yusa, H. Hayashii, T. Nagamine and A. Yamaguchi [Belle Collaboration], eConf C0209101 (2002) TU13 [Nucl. Phys. Proc. Suppl. 123, 95 (2003)] [arXiv:hep-ex/0211017].
- [279] P. Krawczyk and S. Pokorski, Phys. Rev. Lett. 60, 182 (1988);
- [280] A. Lusiani [BABAR Collaboration], Nucl. Phys. Proc. Suppl. 144, 105 (2005).
- [281] G. Bardin et al., Phys. Lett. B 137, 135 (1984).
- [282] K. Abe et al. [Belle Collaboration], [arXiv:hep-ex/0608046].
- [283] Y. S. Tsai, Phys. Rev. D 51, 3172 (1995) [arXiv:hep-ph/9410265].
- [284] Y. S. Tsai, Phys. Lett. B 378, 272 (1996).
-
[285]
J. H. Kuhn and E. Mirkes,
Phys. Lett. B 398, 407 (1997)
[arXiv:hep-ph/9609502]. - [286] J. H. Kuhn and E. Mirkes, [arXiv:hep-ph/9711364].
-
[287]
A. Datta, K. Kiers, D. London, P. J. O’Donnell and A. Szynkman,
[arXiv:hep-ph/0610162]. - [288] I. I. Bigi and A. I. Sanda, Phys. Lett. B 625, 47 (2005) [arXiv:hep-ph/0506037].
- [289] Y. Grossman, Nucl. Phys. B 426 (1994) 355 [arXiv:hep-ph/9401311].
- [290] J. H. Kuhn and E. Mirkes, Z. Phys. C 56, 661 (1992) [Erratum-ibid. C 67, 364 (1995)].
- [291] J. Bernabeu, G. A. Gonzalez-Sprinberg and J. Vidal, Nucl. Phys. B 763, 283 (2007) [arXiv:hep-ph/0610135].
-
[292]
K. Inami et al. [Belle Collaboration],
Phys. Lett. B 551, 16 (2003)
[arXiv:hep-ex/0210066]. - [293] M. Artuso et al. [CLEO Collaboration], Phys. Rev. Lett. 95, 261801 (2005) [arXiv:hep-ex/0508047].
- [294] G. Bonvicini et al. [CLEO Collaboration], Phys. Rev. Lett. 96, 022002 (2006) [arXiv:hep-ex/0510034].
- [295] G. S. Huang et al. [CLEO Collaboration], Phys. Rev. D 75, 012002 (2007) [arXiv:hep-ex/0610035].
- [296] A. Drutskoy et al. [Belle Collaboration], Phys. Rev. Lett. 98, 052001 (2007) [arXiv:hep-ex/0608015].
- [297] K. Abe et al. [Belle Collaboration], [arXiv:hep-ex/0610003].
- [298] W. S. Hou, M. Nagashima and A. Soddu, [arXiv:hep-ph/0610385].
- [299] W. S. Hou and N. Mahajan, [arXiv:hep-ph/0702163].
- [300] E. Baracchini et al., arXiv:hep-ph/0703258.
- [301] D. Besson et al. [CLEO Collaboration], Phys. Rev. Lett. 54, 381 (1985).
- [302] D. M. J. Lovelock et al., Phys. Rev. Lett. 54, 377 (1985).
- [303] G. S. Huang et al. [CLEO Collaboration], [arXiv:hep-ex/0607080].
- [304] A. Drutskoy, [arXiv:hep-ex/0605110].
- [305] M. Bona et al. [UTfit Collaboration], Phys. Rev. Lett. 97, 151803 (2006) [arXiv:hep-ph/0605213].
- [306] A. Abulencia et al. [CDF Collaboration], Phys. Rev. Lett. 97, 242003 (2006) [arXiv:hep-ex/0609040].
- [307] A. Abulencia et al. [CDF - Run II Collaboration], Phys. Rev. Lett. 97, 062003 (2006) [AIP Conf. Proc. 870, 116 (2006)] [arXiv:hep-ex/0606027].
- [308] V. M. Abazov et al. [DØ Collaboration], Phys. Rev. Lett. 97, 021802 (2006) [arXiv:hep-ex/0603029].
- [309] I. Dunietz, R. Fleischer and U. Nierste, Phys. Rev. D 63, 114015 (2001) [arXiv:hep-ph/0012219].
- [310] A. S. Dighe, I. Dunietz and R. Fleischer, Eur. Phys. J. C 6, 647 (1999) [arXiv:hep-ph/9804253].
- [311] D. Acosta et al. [CDF Collaboration], Phys. Rev. Lett. 94, 101803 (2005) [arXiv:hep-ex/0412057].
- [312] V. Abazov [DØ Collaboration], [arXiv:hep-ex/0701012].
- [313] V. Abazov [DØ Collaboration], [arXiv:hep-ex/0701007].
- [314] V. M. Abazov [DØ Collaboration], [arXiv:hep-ex/0702030].
-
[315]
G. Buchalla and A. J. Buras,
Nucl. Phys. B 548, 309 (1999)
[arXiv:hep-ph/9901288]. - [316] M. Blanke, A. J. Buras, D. Guadagnoli and C. Tarantino, JHEP 0610, 003 (2006) [arXiv:hep-ph/0604057].
-
[317]
S. R. Choudhury and N. Gaur,
Phys. Lett. B 451, 86 (1999)
[arXiv:hep-ph/9810307]. -
[318]
K. S. Babu and C. F. Kolda,
Phys. Rev. Lett. 84, 228 (2000)
[arXiv:hep-ph/9909476]. - [319] A. J. Buras, P. H. Chankowski, J. Rosiek and L. Slawianowska, Phys. Lett. B 546, 96 (2002) [arXiv:hep-ph/0207241].
- [320] A. J. Buras, M. Spranger and A. Weiler, Nucl. Phys. B 660, 225 (2003) [arXiv:hep-ph/0212143].
- [321] A. J. Buras, Phys. Lett. B 566, 115 (2003) [arXiv:hep-ph/0303060].
- [322] R. Dermisek, S. Raby, L. Roszkowski and R. Ruiz De Austri, JHEP 0304, 037 (2003) [arXiv:hep-ph/0304101].
- [323] R. Dermisek, S. Raby, L. Roszkowski and R. Ruiz de Austri, JHEP 0509, 029 (2005) [arXiv:hep-ph/0507233].
- [324] D. Auto, H. Baer, C. Balazs, A. Belyaev, J. Ferrandis and X. Tata, JHEP 0306, 023 (2003) [arXiv:hep-ph/0302155].
-
[325]
T. Blazek, S. F. King and J. K. Parry,
Phys. Lett. B 589, 39 (2004)
[arXiv:hep-ph/0308068]. -
[326]
B. Misra, J. P. Saha and P. K. Das,
Phys. Rev. D 74, 074011 (2006)
[arXiv:hep-ph/0605233]. - [327] C. Bobeth, M. Bona, A. J. Buras, T. Ewerth, M. Pierini, L. Silvestrini and A. Weiler, Nucl. Phys. B 726, 252 (2005) [arXiv:hep-ph/0505110].
-
[328]
E. Lunghi, W. Porod and O. Vives,
Phys. Rev. D 74, 075003 (2006)
[arXiv:hep-ph/0605177]. -
[329]
CDF Note 8176.
See also
A. Abulencia et al. [CDF Collaboration],
Phys. Rev. Lett. 95, 221805 (2005)
[Erratum-ibid. 95, 249905 (2005)]
[arXiv:hep-ex/0508036]. - [330] DØ Note 4733. See also V. M. Abazov et al. [DØ Collaboration], Phys. Rev. Lett. 94, 071802 (2005) [arXiv:hep-ex/0410039].
-
[331]
L. Reina, G. Ricciardi and A. Soni,
Phys. Rev. D 56, 5805 (1997)
[arXiv:hep-ph/9706253]. - [332] T. M. Aliev and G. Turan, Phys. Rev. D 48, 1176 (1993).
- [333] G. G. Devidze and G. R. Dzhibuti, Phys. Lett. B 429, 48 (1998).
- [334] A. Gemintern, S. Bar-Shalom and G. Eilam, Phys. Rev. D 70, 035008 (2004) [arXiv:hep-ph/0404152].
-
[335]
S. Bertolini and J. Matias,
Phys. Rev. D 57, 4197 (1998)
[arXiv:hep-ph/9709330]. - [336] B. Aubert et al. [BABAR Collaboration], Phys. Rev. Lett. 87, 241803 (2001) [arXiv:hep-ex/0107068].
-
[337]
K. Abe et al. [Belle Collaboration],
Phys. Rev. D 73, 051107 (2006)
[arXiv:hep-ex/0507036]. - [338] D. Silverman and H. Yao, Phys. Rev. D 38, 214 (1988).
- [339] A. G. Akeroyd, Prog. Theor. Phys. 111, 295 (2004) [arXiv:hep-ph/0308260].
- [340] M. Artuso et al. [CLEO Collaboration], Phys. Rev. Lett. 95, 251801 (2005).
- [341] G. Bonvicini et al. [CLEO Collaboration], Phys. Rev. D 70, 112004 (2004).
- [342] P. Rubin et al. [CLEO Collaboration], Phys. Rev. D 73, 112005 (2006).
- [343] M. Artuso [CLEO Collaboration], [arXiv:hep-ex/0607074], presented at XXXIII Int. Conf. on High Energy Physics, Moscow, Russia, July, 2006.
- [344] Q. He et al., CLEO-CONF 05-3; LP2005-429 (2005).
- [345] S. Pislak et al. [BNL-E865 Collaboration], Phys. Rev. D 66, 010001 (2002) [arXiv:hep-ex/0106071].
- [346] J. R. Batley et al. [NA48 Collaboration], Phys. Lett. B 595, 75 (2004) [arXiv:hep-ex/0405010].
- [347] D. Becirevic and A. B. Kaidalov, Phys. Lett. B 478,417 (2000).
- [348] D. Asner, “Impact of Charm Physics on CKM”, presented at 4th International Workshop on the CKM Unitarity Triangle, Nagoya, Japan, December 12-16, 2006.
- [349] C. Aubin et al., Phys. Rev. Lett. 95, 122002 (2005).
- [350] I.I. Bigi, Y. Dokshitzer, V. Khoze, J. Kühn, P. Zerwas, Phys. Lett. B181, 157 (1986).
- [351] G. Burdman, E. Golowich, J. Hewett and S. Pakvasa, Phys. Rev. D 66, 014009 (2002).
- [352] S. Bianco, F. L. Fabbri, D. Benson and I. Bigi, Riv. Nuovo Cim. 26N7, 1 (2003).
- [353] G. Burdman and I. Shipsey, Ann. Rev. Nucl. Part. Sci. 53, 431 (2003).
- [354] I.I. Bigi, in: Proceed. of the Tau-Charm Workshop, L.V. Beers (ed.), SLAC-Report-343, 1989, p. 169;
- [355] D. M. Asner and W. M. Sun, Phys. Rev. D 73, 034024 (2006).
- [356] B. Aubert [BABAR Collaboration], [arXiv:hep-ex/0703020].
-
[357]
K. Abe [Belle Collaboration],
arXiv:hep-ex/0703036.
See also talk by M. Staric at Rencontres de Moriond EW 2007
http://belle.kek.jp/belle/talks/moriondEW07/Staric.pdf - [358] R. Godang et al. [CLEO Collaboration], Phys. Rev. Lett. 84, 5038 (2000) [arXiv:hep-ex/0001060].
- [359] K. Abe et al. [Belle Collaboration], [arXiv:hep-ex/0308034].
- [360] L. M. Zhang et al. [Belle Collaboration], Phys. Rev. Lett. 96, 151801 (2006) [arXiv:hep-ex/0601029].
- [361] B. Aubert et al. [BABAR Collaboration], Phys. Rev. Lett. 97, 221803 (2006) [arXiv:hep-ex/0608006].
- [362] D. M. Asner et al. [CLEO Collaboration], Phys. Rev. D 72, 012001 (2005) [arXiv:hep-ex/0503045].
-
[363]
D. M. Asner at the final meeting of the
workshop Flavour in the Era of the LHC, available from
http://indico.cern.ch/materialDisplay.py?contribId=18
&sessionId=0&materialId=slides&confId=12011 - [364] For a pioneering study see: J. M. Link et al. [FOCUS Collaboration], Phys. Lett. B 622, 239 (2005) [arXiv:hep-ex/0506012].
- [365] For a very recent and detailed analysis see: Y. Grossman, A. L. Kagan and Y. Nir, [arXiv:hep-ph/0609178].
- [366] K. Agashe, G. Perez, A. Soni, Phys.Rev. D71, 016002 (2005).
- [367] I. Shipsey, Int. J. Mod. Phys. A 21, 5381 (2006) [arXiv:hep-ex/0607070].
- [368] B. Aubert et al. [BABAR Collaboration], Phys. Rev. Lett. 90, 242001 (2003) [arXiv:hep-ex/0304021].
- [369] D. Besson et al. [CLEO Collaboration], Phys. Rev. D 68, 032002 (2003) [arXiv:hep-ex/0305100].
- [370] P. Krokovny et al. [Belle Collaboration], Phys. Rev. Lett. 91, 262002 (2003) [arXiv:hep-ex/0308019].
- [371] K. Abe et al., Phys. Rev. Lett. 92, 012002 (2004) [arXiv:hep-ex/0307052].
-
[372]
K. Abe et al. [Belle Collaboration],
Phys. Rev. D 69, 112002 (2004)
[arXiv:hep-ex/0307021]. - [373] A. Kuzmin [Belle Collaboration], [arXiv:hep-ex/0611054].
- [374] S. K. Choi et al. [Belle collaboration], Phys. Rev. Lett. 89, 102001 (2002) [Erratum-ibid. 89, 129901] (2002) [arXiv:hep-ex/0206002].
- [375] S. Uehara et al. [Belle Collaboration], Phys. Rev. Lett. 96, 082003 (2006) [arXiv:hep-ex/0512035].
- [376] S. K. Choi et al. [Belle Collaboration], Phys. Rev. Lett. 91, 262001 (2003) [arXiv:hep-ex/0309032].
- [377] B. Aubert et al. [BABAR Collaboration], Phys. Rev. D 71, 071103 (2005) [arXiv:hep-ex/0406022].
- [378] B. Aubert et al. [BABAR Collaboration], Phys. Rev. D 73, 011101 (2006) [arXiv:hep-ex/0507090].
- [379] B. Aubert et al. [BABAR Collaboration], Phys. Rev. D 74, 071101 (2006) [arXiv:hep-ex/0607050].
- [380] G. Gokhroo et al., Phys. Rev. Lett. 97, 162002 (2006) [arXiv:hep-ex/0606055].
- [381] B. Aubert et al. [BABAR Collaboration], Phys. Rev. Lett. 97, 232001 (2006) [arXiv:hep-ex/0608055].
- [382] K. Abe et al. [Belle Collaboration], Phys. Rev. Lett. 89, 142001 (2002) [arXiv:hep-ex/0205104].
-
[383]
K. Abe et al. [Belle Collaboration],
Phys. Rev. D 70, 071102 (2004)
[arXiv:hep-ex/0407009]. - [384] K. Abe et al., [arXiv:hep-ex/0507019].
- [385] B. Aubert et al. [BABAR Collaboration], Phys. Rev. Lett. 95, 142001 (2005) [arXiv:hep-ex/0506081].
- [386] B. Aubert [BABAR Collaboration], [arXiv:hep-ex/0610057].
- [387] A. Garmash et al. [Belle Collaboration], Phys. Rev. D 71, 092003 (2005) [arXiv:hep-ex/0412066].
- [388] B. Aubert et al. [BABAR Collaboration], Phys. Rev. D 72, 052002 (2005) [arXiv:hep-ex/0507025].
- [389] B. Aubert et al. [BABAR Collaboration], Phys. Rev. D 72, 072003 (2005) [Erratum-ibid. D 74, 099903 (2006)] [arXiv:hep-ex/0507004].
- [390] B. Aubert et al. [BABAR Collaboration], Phys. Rev. D 74, 032003 (2006) [arXiv:hep-ex/0605003].
-
[391]
A. Garmash [Belle Collaboration],
Phys. Rev. D 75, 012006 (2007)
[arXiv:hep-ex/0610081]. -
[392]
M. A. Sanchis-Lozano,
Int. J. Mod. Phys. A 19, 2183 (2004)
[arXiv:hep-ph/0307313]. - [393] E. Accomando et al., [arXiv:hep-ph/0608079].
- [394] M. Carena, J. R. Ellis, A. Pilaftsis and C. E. M. Wagner, Phys. Lett. B 495, 155 (2000) [arXiv:hep-ph/0009212].
- [395] D. Besson [CLEO Collaboration], Phys. Rev. Lett. 98, 052002 (2007) [arXiv:hep-ex/0607019].
- [396] J. F. Gunion, D. Hooper and B. McElrath, Phys. Rev. D 73, 015011 (2006) [arXiv:hep-ph/0509024].
- [397] P. Rubin et al. [CLEO Collaboration], Phys. Rev. D 75, 031104 (2007) [arXiv:hep-ex/0612051].
- [398] O. Tajima et al. [Belle Collaboration], [arXiv:hep-ex/0611041].
- [399] B. McElrath, Phys. Rev. D 72, 103508 (2005) [arXiv:hep-ph/0506151].
- [400] M. A. Sanchis-Lozano, [arXiv:hep-ph/0610046].
- [401] H. B. Li and M. Z. Yang, Phys. Rev. D 74, 094016 (2006) [arXiv:hep-ph/0610073].
- [402] N. Brambilla et al. [Quarkonium Working Group], [arXiv:hep-ph/0412158].
- [403] M. Artuso et al. [CLEO Collaboration], Phys. Rev. Lett. 94, 032001 (2005) [arXiv:hep-ex/0411068].
- [404] V. Zambetakis and N. Byers, Phys. Rev. D 28, 2908 (1983).
-
[405]
S. Godfrey and N. Isgur,
Phys. Rev. D 32, 189 (1985).
- [406] S. Godfrey and J. L. Rosner, Phys. Rev. D 64, 074011 (2001) [Erratum-ibid. D 65, 039901 (2002)] [arXiv:hep-ph/0104253].
- [407] T. A. Lahde, Nucl. Phys. A 714, 183 (2003) [arXiv:hep-ph/0208110].
-
[408]
F. A. Harris,
Nucl. Phys. Proc. Suppl. 162, 345 (2006)
[arXiv:physics/0606059]. - [409] S. I. Serednyakov, Phys. Atom. Nucl. 67, 482 (2004) [Yad. Fiz. 67, 501 (2004)].
- [410] S. I. Serednyakov, Nucl. Phys. Proc. Suppl. 126, 369 (2004).
- [411] M. Zobov et al., SLAC-PUB-11655, Prepared for Particle Accelerator Conference (PAC 05), Knoxville, Tennessee, 16-20 May 2005.
- [412] F. Ambrosino et al., [arXiv:hep-ex/0603056].
- [413] M. Davier, S. Eidelman, A. Hocker and Z. Zhang, Eur. Phys. J. C 31, 503 (2003) [arXiv:hep-ph/0308213].
- [414] M. Passera, Nucl. Phys. Proc. Suppl. 155, 365 (2006) [arXiv:hep-ph/0509372] and reference therein.
- [415] C. Bouchiat, L. Michel, J. Phys. Radium 22 (1961) 121;
- [416] M. Gourdin and E. De Rafael, Nucl. Phys. B 10, 667 (1969).
- [417] N. Cabibbo and R. Gatto, Phys. Rev. 124, 1577 (1961);
- [418] B. V. Geshkenbein and V. L. Morgunov, Phys. Lett. B 340, 185 (1994).
- [419] P. Franzini and M. Moulson, [arXiv:hep-ex/0606033].
- [420] A. L. Sibidanov [CMD-2 Collaboration], AIP Conf. Proc. 814, 478 (2006).
- [421] A. Aloisio et al. [KLOE Collaboration], Phys. Lett. B 606, 12 (2005) [arXiv:hep-ex/0407048].
- [422] M. Davier, S. Eidelman, A. Hocker and Z. Zhang, Eur. Phys. J. C 27, 497 (2003) [arXiv:hep-ph/0208177].
-
[423]
V. Cirigliano, G. Ecker and H. Neufeld,
JHEP 0208, 002 (2002)
[arXiv:hep-ph/0207310]. -
[424]
F. Jegerlehner,
Nucl. Phys. Proc. Suppl. 162, 22 (2006)
[arXiv:hep-ph/0608329] and references therein. - [425] M. Bochicchio, L. Maiani, G. Martinelli, G. C. Rossi and M. Testa, Nucl. Phys. B 262, 331 (1985).
- [426] J. F. Donoghue, B. R. Holstein and Y. C. Lin, Phys. Rev. D 37, 2423 (1988).
- [427] M. R. Pennington, [arXiv:hep-ph/0604212].
- [428] T. Mori et al. [Belle Collaboration], [arXiv:hep-ex/0610038].
- [429] C. C. Kuo [Belle Collaboration], Nucl. Phys. Proc. Suppl. 126, 313 (2004).
- [430] M. Bander, G. L. Shaw, P. Thomas and S. Meshkov, Phys. Rev. Lett. 36 (1976) 695.
- [431] M. B. Voloshin and L. B. Okun, JETP Lett. 23, 333 (1976) [Pisma Zh. Eksp. Teor. Fiz. 23, 369 (1976)].
- [432] A. De Rujula, H. Georgi and S. L. Glashow, Phys. Rev. Lett. 38, 317 (1977).
-
[433]
A. V. Manohar and M. B. Wise,
Nucl. Phys. B 399, 17 (1993)
[arXiv:hep-ph/9212236]. - [434] N. A. Tornqvist, Z. Phys. C 61, 525 (1994) [arXiv:hep-ph/9310247].
- [435] S. Pacetti, Prepared for Quarks and Nuclear Physics (QNP06), Madrid, Spain, 5-10 June 2006 to be published in Eur. Phys. J. A.
- [436] B. Aubert et al. [BABAR Collaboration], Phys. Rev. D 74, 091103 (2006) [arXiv:hep-ex/0610018].
- [437] B. Aubert et al. [BABAR Collaboration], Phys. Rev. D 73, 052003 (2006) [arXiv:hep-ex/0602006].
- [438] M. K. Jones et al. [Jefferson Lab Hall A Collaboration], Phys. Rev. Lett. 84, 1398 (2000) [arXiv:nucl-ex/9910005].
- [439] O. Gayou et al., Phys. Rev. C 64, 038202 (2001).
- [440] O. Gayou et al. [Jefferson Lab Hall A Collaboration], Phys. Rev. Lett. 88, 092301 (2002) [arXiv:nucl-ex/0111010].
- [441] B. D. Milbrath et al. [Bates FPP collaboration], Phys. Rev. Lett. 80, 452 (1998) [Erratum-ibid. 82, 2221 (1999)] [arXiv:nucl-ex/9712006].
- [442] T. Massam, A. Zichichi, Nuovo Cim. A 43, 1137 (1966).
- [443] F. Iachello, A. D. Jackson and A. Lande, Phys. Lett. B 43, 191 (1973).
- [444] B. Aubert et al. [BABAR Collaboration], Phys. Rev. D 73, 012005 (2006) [arXiv:hep-ex/0512023].
- [445] R. Baldini Ferroli, PoS HEP2005, 285 (2006) [arXiv:hep-ph/0512183].
- [446] A. Antonelli et al., Nucl. Phys. B 517, 3 (1998).
- [447] G. Bardin et al., Nucl. Phys. B 411, 3 (1994).
- [448] R. Baldini, C. Bini, P. Gauzzi, M. Mirazita, M. Negrini and S. Pacetti, Nucl. Phys. Proc. Suppl. 162, 46 (2006).
- [449] P. G. Blunden, W. Melnitchouk and J. A. Tjon, Phys. Rev. Lett. 91, 142304 (2003) [arXiv:nucl-th/0306076].
- [450] D. Bisello et al., Nucl. Phys. B 224, 379 (1983).
- [451] D. Bisello et al. [DM2 Collaboration], Z. Phys. C 48, 23 (1990).
- [452] B. Delcourt et al., Phys. Lett. B 86, 395 (1979).
- [453] M. Castellano, G. Di Giugno, J. W. Humphrey, E. Sassi Palmieri, G. Troise, U. Troya and S. Vitale, Nuovo Cim. A 14, 1 (1973).
Chapter 2 The Accelerator
1 Overview
1 A History of Factories
A Super Factory, an asymmetric energy collider with a luminosity of order , can provide a uniquely sensitive probe of New Physics in the flavour sector of the Standard Model.
The PEP-II and KEKB asymmetric colliders [1, 2] have produced unprecedented luminosities, above , taking our understanding of the accelerator physics and engineering demands of asymmetric colliders to a new parameter regime. This very high luminosity, coupled with the innovation of continuous injection and the high efficiency of the accelerators and detectors, will allow each of these machines to produce 1000 or more by the end of this decade. The study of New Physics effects in the heavy quark and heavy lepton sectors, however, requires a data sample two orders of magnitude larger, hence the luminosity target of for Super.
Attempts to design a Super Factory date to 2001. The initial approach at SLAC and KEK had much in common: they were extrapolations of the very successful Factory designs, with increased bunch charge, more bunches, somewhat reduced values, and crab cavities. These proposed designs reached luminosities of 5 to , but had wall plug power of the order of 100.
This daunting power consumption motivated us to adapt linear collider concepts from the SLC and ILC to the regime of high luminosity storage ring colliders. The low emittance design presented herein reaches the desired luminosity regime with beam currents and wall plug power comparable to those in the current Factories.
The parameters for a Flavor Factory based on an asymmetric-energy collider operating at a luminosity of order at the resonance and at production threshold are described below. Such a collider would produce an integrated luminosity of at least 15,000 (15) in a running year () at the resonance.
The construction and operation of modern multi-bunch colliders have brought about many advances in accelerator physics in the area of high currents, complex interaction regions, high beam-beam tune shifts, high-power RF systems, control of beam instabilities, rapid injection rates, and reliable up-times (90%). The successful operation of the currently operating Factories has proven the validity of their design concepts:
-
•
Colliders with asymmetric energies work;
-
•
Beam-beam energy transparency conditions provide only weak constraints;
-
•
Interaction regions with two energies can be built for both head-on and small angle collisions;
-
•
IR backgrounds can be handled successfully;
-
•
High-current RF systems can be operated with excellent efficiency;
-
•
Beam-beam tune shift parameters can reach 0.06 to 0.09;
-
•
Good injection rates can be sustained. Continuous injection is now in routine operation, largely removing the distinction between peak and average luminosity;
-
•
The electron cloud effect (ECI) can be managed; and
-
•
Bunch-by-bunch feedback works well with 4 bunch spacing.
Lessons learned from SLC, and more recent ILC studies and experiments (FFTB, ATF, ATF2), have also produced and proven new concepts:
-
•
Small horizontal and vertical emittances can be produced in a damping ring having a short damping time.
-
•
Very small beam spot sizes and beta functions can be produced at the interaction region; and
The design of the Super collider combines extensions of the design of the current Factories with new linear collider concepts to produce an extraordinary leap in Factory luminosity without increasing beam currents or power consumption.
The luminosity of an collider is given by the expression
| (1) | |||
| (2) |
where is the frequency of collision of each bunch, is the number of particles in the positron and electron bunches, is the beam size in the horizontal (), vertical () and longitudinal () directions, is the beam emittance, is the beta function (in ) at the collision point in each plane and is the crossing angle between the beam lines at the interaction point (IP).
In this chapter we describe the principles of the design of a new asymmetric collider that can reach a peak luminosity of with beam currents and bunch lengths similar to those of the currently operating factories, through the use of smaller emittances and a new scheme of crossing angle collision.
2 Key Issues for a Super Factory
Our design is based on a new collision scheme, that we call a “crabbed waist”. This new scheme will allow Super to reach a luminosity of the order of by overcoming some of the issues that have plagued earlier super collider designs, such as very high beam currents and very short bunches. In this section we will review the crabbed waist concept and address key issues related to high luminosity colliders, such as luminosity with a crossing angle, beam lifetime and injection, backgrounds, beam emittances and stability, polarization, power and costs.
The crabbed waist collision scheme
In high luminosity colliders, one of the key requirements is very short bunches, since this allows a decreased at the IP, thereby increasing the luminosity. However, cannot be made much smaller than the bunch length without incurring an “hourglass” effect. Moreover, high luminosity requires small vertical emittance, together with large horizontal beam size and horizontal emittance, to minimize the beam-beam effect. It is, unfortunately, very difficult to shorten the bunch length in a ring.
This problem can be overcome with the recently proposed crabbed waist scheme [5] for beam-beam collisions, which can substantially increase luminosity without having to decrease the bunch length, since it combines several potentially advantageous ideas.
The first idea is the use of a large Piwinski angle: for collisions at a crossing angle , the luminosity , the horizontal and the vertical tune shifts scale according to [6]:
| (3) | ||||
| (4) | ||||
| (5) |
The Piwinski angle is defined as:
| (6) |
where the horizontal rms bunch size, the rms bunch length, () the number of electron per HER (LER) bunch, and the Lorentz factor for the positrons in the LER. We consider here the case of flat beams, small horizontal crossing angle and large Piwinski angle .
The idea of colliding with a large Piwinski angle is not new (see for example [7]). It has been also proposed for the LHC upgrade [8], to increase the bunch length and the crossing angle. In such a case, if it were possible to increase in proportion to , the vertical tune shift would indeed remain constant, while the luminosity would grow proportional to (Eqs. 3 and 4). Moreover, the horizontal tune shift drops like (Eq. 5), so that for very large the beam-beam interaction can be considered, in some sense, one-dimensional, since the horizontal footprint in the tune plane shrinks. However, as distinct from [8], in the crabbed waist scheme described here, the Piwinski angle is increased by decreasing the horizontal beam size and increasing the crossing angle. In this way, the luminosity is increased, and the horizontal tune shift due to the crossing angle decreases. The most important effect is that the overlap area of colliding bunches is reduced, as it is proportional to . Thus, if the vertical beta function can be made comparable to the overlap area size:
several advantages are gained:
There are additional advantages in such a collision scheme: there is no need to decrease the bunch length to increase the luminosity, as proposed in standard upgrade plans for and Factories [10, 11, 12]. This will certainly ease the problems of HOM heating, coherent synchrotron radiation of short bunches, excessive power consumption, etc.. Moreover the problem of parasitic collisions (PC) is automatically solved by the higher crossing angle and smaller horizontal beam size, which makes the beam separation at the PC large in terms of .
However, a large Piwinski angle itself introduces new beam-beam resonances and may strongly limit the maximum achievable tune shifts (see for example [13]). This is where the crabbed waist innovation is required. The crabbed waist transformation boosts the luminosity, mainly by suppression of betatron (and synchrobetatron) resonances that usually arise (in collisions without the crabbed waist) through the vertical motion modulation by horizontal beam oscillations [14]. A sketch of the crabbed waist scheme is shown in Fig. 1.
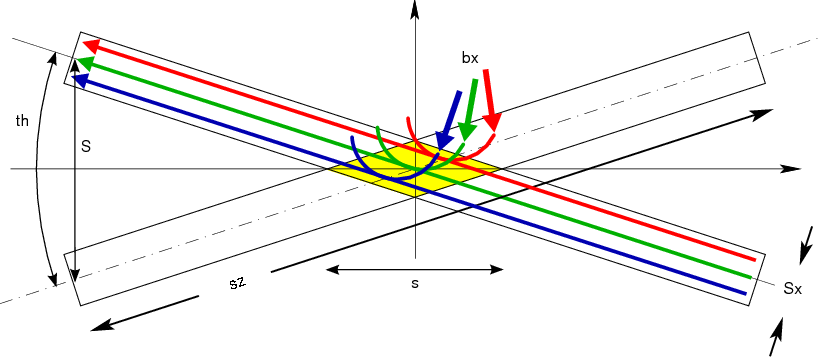
The crabbed waist correction scheme can easily be realized in practice with two sextupoles magnets in phase with the IP in the plane and at in the plane, on both sides of the IP, as shown in Fig. 2.
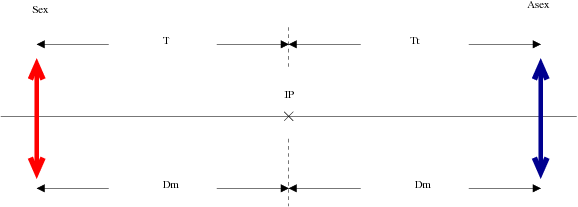
Review of the key issues
The Super design aims to achieve a luminosity in excess of . Some of the key design elements that need consideration in realizing this goal are described in this section, beginning with the luminosity-vs.-power issue.
-
1.
Luminosity: For very flat beams, luminosity can be written as:
where is the LER beam current, is the LER energy, the vertical tune shift, is the vertical beta at the Interaction Point.
-
2.
Synchrotron radiation power: Power dissipation is related to the beam current and to the energy loss per turn via:
All colliders aim to maximize while keeping as small as possible. The Super design is based on a “large Piwinski angle” and crabbed waist scheme as described above. This allows us to lower to and increase to . These values should be compared with the present KEKB parameters of and . The Super parameters result in a luminosity about two orders of magnitude larger than that achieved at KEKB, with beam currents and power consumption essentially unchanged.
-
3.
Detector backgrounds: Maintaining beam power as low as possible is important to minimize backgrounds, which scale with the beam currents. The interaction region (IR) design also plays a fundamental role. The combination of large crossing angle and small beam sizes, emittances and beam angular divergences at the IP in the Super design is very effective in further decreasing the absolute background levels with respect to the current Factories. These same factors also relax design requirements for the IR. Luminosity-related backgrounds must, of course, be taken into account, and can impose serious shielding requirements.
-
4.
Beam lifetime: In the current factories, beam lifetime is determined mainly by ring characteristics such as vacuum quality, dynamic aperture, etc.. In Super, beam lifetime is instead almost entirely dominated by the luminosity itself: radiative Bhabhas limit the lifetime to a few minutes for both rings. All other contributions are much smaller, except for the Touschek lifetime of the low energy beam, which causes a worsening by about a factor 1.3. Given the short beam lifetime, the injection system must be able to provide particles at a rate about 10 times larger than those for the present factories.
-
5.
Beam emittance: The horizontal emittance is determined mainly by the ring lattice optics; the vertical emittance is dominated by ring imperfections, which must be tightly controlled to reach the design value. The current factories, and most of the other colliders, have achieved vertical/horizontal emittance ratios similar to the Super design. However, the absolute values for Super are much smaller; they are similar to those at the test damping ring for the ILC project, the ATF [15]. Thus, tolerances, stability levels and tuning constraints are also tighter than those for the current factories. Instead, they are very similar to those for the ATF and the design values for the ILC Damping Rings, which will produce beams very similar to those of Super.
-
6.
Polarization: Super can provide collisions with longitudinally polarized electrons by using a polarized electron gun and spin rotators in the ring. Polarized positrons could be provided as well, but further study is required to evaluate whether the additional physics benefit outweighs the added complexity. A vigorous R&D program (see references in Sec. 4) is being pursued by the ILC community to provide a polarized positron source. Production rates required by Super are 100 times less demanding than those for the ILC, so such a source could be feasible by the time Super is funded. Preliminary considerations for a polarized positron source are discussed in Sec. 4.
-
7.
Cost: In the conventional Super Factory designs, the cost is dominated by the requirements for dealing with higher currents and shorter bunches: for example, substantial additions to the RF system, engineering design for larger HOM power due to shorter bunches, and the cooling and vacuum challenges posed by larger synchrotron radiation power. Most of these problems do not exist in the Super design; the absolute cost of Super is therefore very similar to the present machines. In addition, the Super design allows the reuse of a great deal of PEP-II hardware, resulting in substantial savings for the project, even at a new site.
3 Parameters
Nominal parameters for
The IP and ring parameters have been optimized based on several constraints. The most significant are:
-
•
Maintaining wall plug power, beam currents, bunch lengths, and RF requirements comparable to present Factories;
-
•
Planning for the reuse as much as possible of the PEP-II hardware;
-
•
Requiring ring parameters as close as possible to those already achieved in the Factories, or under study for the ILC Damping Ring or achieved at the ATF ILC-DR test facility [15];
-
•
Simplifying the IR Design as much as possible. In particular, reduce the synchrotron radiation in the IR, reduce the HOM power and increase the beam stay-clear. In addition, eliminate the effects of the parasitic beam crossings;
-
•
Relaxing as much as possible the requirements on the beam demagnification at the IP; and
-
•
Designing the final focus system to follow as closely as possible already tested systems, and integrating the system as much as possible into the ring design.
Column 1 of Table 1 shows a parameter set that closely matches these criteria. Further details on beam-beam simulations and lattice design will be presented in the following sections.
Upgrade parameters
Many of the nominal Super design parameters could, in principle, be pushed further to increase performance. This provides a excellent upgrade path after experience is gained with the nominal design. The upgrade parameters are based on the following assumptions:
-
•
Beam currents could be raised to the levels that PEP-II should deliver in 2008;
-
•
Vertical emittance at high current could be reduced to the ATF values;
-
•
Lattice properties support a further reduction in and ; and
-
•
Beam-beam effects are still far from saturating the luminosity.
In principle, the design supports these improvements, so a luminosity higher than nominal may well be feasible. In addition, it should be pointed out that, since the nominal design parameters are not pushed to maximum values, there is flexibility in obtaining the design luminosity by relaxing certain parameters, if they prove more difficult to achieve, and pushing others. Columns 2 and 3 of Table 1 show two potential upgrade paths.
| Nominal | Upgrade | Ultimate | ||||
| Parameters | Parameters | Parameters | ||||
| Parameter | LER | HER | LER | HER | LER | HER |
| Particle type | ||||||
| Energy (GeV) | 4 | 7 | 4 | 7 | 4 | 7 |
| Luminosity () | 1.0 | 2.4 | 3.4 | |||
| Circumference (m) | 2250 | 2250 | 2250 | |||
| Revolution freq. (MHz) | 0.13 | 0.13 | 0.13 | |||
| Long. polarization (%) | 0 | 80 | 0 | 80 | 0 | 80 |
| RF frequency (MHz) | 476 | 476 | 476 | |||
| Harmonic number | 3570 | 3570 | 3570 | |||
| Momentum spread () | 8.4 | 9.0 | 10 | 10 | 10 | 10 |
| Mom. compaction () | 1.8 | 3.0 | 1.8 | 3.0 | 1.8 | 3.0 |
| RF voltage (MV) | 6 | 18 | 6 | 18 | 7.5 | 18 |
| Energy loss/turn (MeV) | 1.9 | 3.3 | 2.3 | 4.1 | 2.3 | 4.1 |
| Number of bunches | 1733 | 3466 | 3466 | |||
| Particles/bunch | 6.16 | 3.52 | 5.34 | 2.94 | 6.16 | 3.52 |
| Beam current (A) | 2.28 | 1.30 | 3.95 | 2.17 | 4.55 | 2.60 |
| (mm) | 0.30 | 0.20 | 0.20 | |||
| (mm) | 20 | 20 | 20 | |||
| (pm-rad) | 4 | 2 | 2 | |||
| (nm-rad) | 1.6 | 0.8 | 0.8 | |||
| (nm) | 35 | 20 | 20 | |||
| (m) | 5.657 | 4.000 | 4.000 | |||
| Bunch length (mm) | 6 | 6 | 6 | |||
| Full Crossing angle (mrad) | 34 | 34 | 34 | |||
| Wigglers (#) | 4 | 2 | 4 | 4 | 4 | 4 |
| (trans/long)(ms) | 32/16 | 25/12.5 | 25/12.5 | |||
| Luminosity lifetime (min) | 10.3 | 5.7 | 7.4 | 4.1 | 6.1 | 3.5 |
| Touschek lifetime (min) | 5.5 | 38 | 2.9 | 19 | 2.3 | 15 |
| Total beam lifetime (min) | 3.6 | 5.0 | 2.1 | 3.4 | 1.7 | 2.8 |
| Inj. rate pps (100%) | 4.9 | 2.0 | 15 | 5.0 | 21 | 7.2 |
| (from Eq. 5) | 0.004 | 0.007 | 0.009 | |||
| (from Eq. 4) | 0.17 | 0.16 | 0.2 | |||
| RF Power (MW) | 17 | 35 | 44 | |||
Projected Super integrated luminosity
We project the performance of Super as a function of time using assumptions based on present experience. The construction of the Super collider will take approximately four years. The injector will be commissioned over a period of a few months approximately six months prior to the commissioning of the collider. The injector performance is assumed to be adequate for the needs of the collider at the start of collider commissioning. To calculate the integrated luminosity expected, we assume that the collider will operate for ten months each year, with a two month maintenance and upgrade period each year. During the first few months of each run, the collider luminosity will be unsteady and the luminosity will be incrementally increased. After about two months, the luminosity will reach the previous run’s luminosity level. It is then slowly increased during the rest of the run, while nearly continuous luminosity is being provided to the detector and particle physics data is recorded.
We envision that the peak luminosity will reach 50% of the design () during the first year of operation, and full design value after two years of operation. The luminosity is then held constant for about three years. After five years the luminosity is increased by hardware upgrades by a factor of 2.5 to a peak of . The peak luminosity for each month over a ten year span is shown in Fig. 3. The resulting integrated luminosity over the ten year period is shown in Fig. 4. With this model, more than will be delivered to the detector in the ten years.
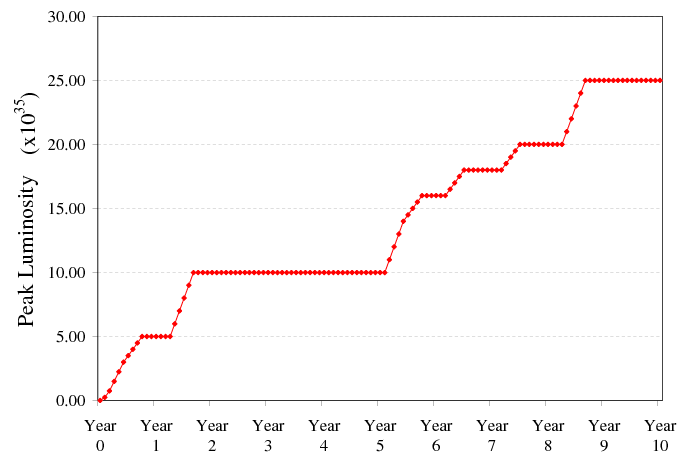
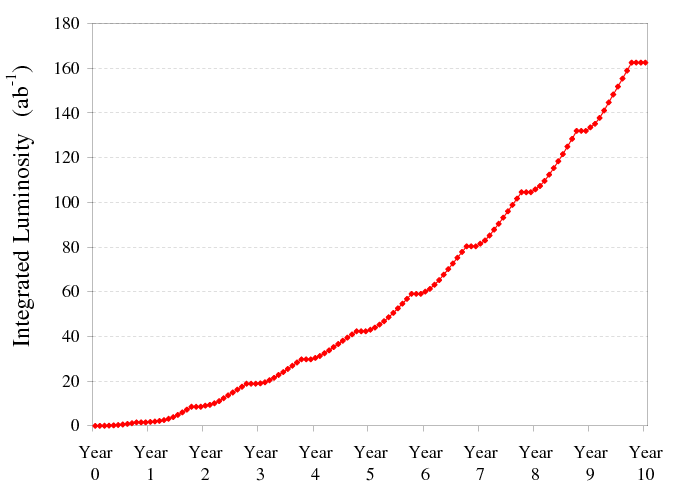
Energy asymmetry at the
The energy asymmetry plays an important role in the design of Super and the optimization of parameters. It is not straightforward to quantify precisely the ultimate luminosity achievable at a given asymmetry, but simple scaling of some fundamental machine parameters clearly shows a more than linear dependence with respect to the boost (greater than ). In addition, there are other consequences for the design and practical limits. A list of some of the more significant dependences follows; the choice of the Super energy asymmetry, 4 on 7, has been based on these considerations.
Factors leading to a LER energy of 4:
-
•
Because of the transparency condition, the bunch charge of the LER beam increases as . This provides a direct limit to the luminosity, whose ultimate value depends on the maximum beam colliding currents;
-
•
The Touschek lifetime scales as , the additional factor in the exponent being due to the fact that the bunch charge must also be increased. This causes a factor of two decrease in the Touschek lifetime in going from to for the LER (from to for the present beam parameters);
-
•
Intrabeam scattering (IBS) instead scales as . Since the emittance growth in the LER due to IBS is already of the order of , it is not possible to obtain the design horizontal emittance at lower energies without significant changes in the present ring design. In particular, the bends would have to be weakened and lengthened. Wigglers would have to be added to reduce the intrinsic horizontal emittance;
-
•
All collective effects, such as instabilities, electron cloud, etc., increase at least with , since the LER becomes weaker because of the reduced energy and the increased bunch charge;
-
•
The wiggler length required to produce the desired damping time nearly doubles if the energy is reduced from 4 to . The magnet costs and the overall ring length would increase correspondingly.
Factors leading to a HER Energy of 7:
-
•
The equilibrium emittance increases with energy. To produce the design parameters at higher energy, we would have to make softer and longer bends, compared to the PEP-II values, or add more cells. For the latter solution, the sextupoles would become stronger, and the PEP-II components could not be reused without modification. The ring dynamic aperture would also decrease considerably, especially if we add more cells;
-
•
The final focus chromaticity increases linearly with energy. The ultimately achievable scales directly with the chromaticity. This additional factor adds to the luminosity dependence on the boost;
-
•
The final focus emittance growth increases with energy. At a higher energy the final focus bends become incompatible with the reuse of the PEP-II components. Other solutions to reduce the emittance growth would damage the optical and chromatic properties of the final focus;
-
•
The IR design becomes more difficult with larger energy asymmetry. The final quadrupoles would be much closer to the IP and stronger in comparison to those at PEP-II or KEKB. The value of , the distance of the first quadrupole from the IP, would increase, worsening the final focus properties;
-
•
IR synchrotron radiation increases proportional to . The related backgrounds in the detector would correspondingly worsen;
-
•
The site power consumption would increase by about 10% if the HER energy were to be increased from 7 to 8; and
-
•
The cost of the injector linac increases linearly with the HER energy.
Energy scaling for operation at the /charm threshold
Super can operate at a lower center-of-mass energy with a somewhat reduced luminosity. In order to operate at /charm threshold energies (in the vicinity of ) with minimal modifications to the machine, beam energies will be scaled, maintaining the nominal energy asymmetry ratio used for operation at the center-of-mass energy of the . All magnet currents will be rescaled accordingly, except for the wigglers, which will be kept at the same field to provide maximum damping. If the IR magnets are permanent magnets, they will be replaced with weaker versions. The main differences in the ring properties will be:
-
•
Lower energy by a factor of about 2.78 per ring;
-
•
Longer damping time by a factor of about 4.3 per ring;
-
•
Decreased Touschek lifetime by a factor of for a given current and emittance;
-
•
Rematched optics in the wiggler section to maintain (or increase if necessary) the beam emittance of the rings at the nominal energy; and
-
•
Increased sensitivity to collective effects by a factor of about 2.78 per ring.
Luminosity should scale linearly with energy (see formula in Sec. 2). However, the damping time and collective effects will result in a further decrease the luminosity. In general, the luminosity dependence is less then linear with respect to the damping time (about ). However, given decreased Touschek lifetime and increased collective effects, we expect that operations at lower energy will require a decrease of the beam current and/or an increase of the beam emittance. It is thus reasonable to expect a luminosity about 10 times smaller than that at .
It should also be noted that the beam polarization scheme, described in Sec. 12, does not work at lower energy. For a given running period and polarization, however, polarization studies are best done at high energy.
Synergy between Super and ILC
There are significant similarities between the Super storage rings and the ILC damping rings [16]: Table 2 compares some of the important parameters. Beam energies and beam sizes are similar. The ILC damping rings have a circumference three times larger than the Super rings (because of the need to store a long train of bunches with bunch spacing sufficiently large to allow injection and extraction of individual bunches); the nominal bunch charge is smaller in the ILC damping rings than in the Super storage rings, leading to a lower average current. Nevertheless, one may expect the overall beam dynamics in the two facilities to be in comparable regimes. A similar lattice design is used in both cases, the main difference being a reduction in circumference and the insertion of an interaction region in the case of Super.
| Unit | Super | Super | ILC |
| LER | HER | DRs | |
| Beam energy (GeV) | 4 | 7 | 5 |
| Circumference (m) | 2249 | 2249 | 6695 |
| Particles per bunch | |||
| Number of bunches | 1733 | 1733 | 2767 |
| Average current (A) | 2.28 | 1.30 | 0.40 |
| Horizontal emittance (nm) | 1.6 | 1.6 | 0.8 |
| Vertical emittance (pm) | 4 | 4 | 2 |
| Bunch length (mm) | 6 | 6 | 9 |
| Energy spread (%) | 0.084 | 0.09 | 0.13 |
| Momentum compaction | |||
| Transverse damping time (ms) | 32 | 32 | 25 |
| RF voltage (MV) | 6 | 18 | 24 |
| RF frequency (MHz) | 476 | 476 | 650 |
The ILC damping rings and the Super storage rings will face similar demands on beam quality and stability: the Super rings for direct production of luminosity, and the ILC damping rings for reliable tuning and operation of the downstream systems, to ensure efficient luminosity production from the extracted beams. Significant issues common to both the Super rings and the ILC damping rings include:
-
•
Alignment of the magnets, including orbit and coupling corrections, with the precision needed to produce vertical emittances of a few picometers on a routine basis;
-
•
Reduction of magnet vibration to a minimum, to ensure beam orbit stability at the level of a few microns;
-
•
Optimization of lattice design and tuning to ensure sufficient dynamic aperture for good injection efficiency (for both Super and the ILC damping rings) and lifetime (particularly for the Super low energy ring); and
-
•
Control of beam instabilities, including electron cloud and ion effects.
These are all active areas of research and development for the ILC damping rings. For example, there has been significant progress in recent years in the development of techniques for suppression of the electron cloud instability (including low secondary yield vacuum chamber coatings; use of grooved chamber surfaces; and clearing improved electrodes), that could have a major impact on the performance of the ILC damping rings. While small-scale tests of these techniques in the laboratory are essential, the experience of operating a full-scale facility in the regime of the Super storage rings or the ILC damping rings would be beneficial whether the facilities are constructed and commissioned sequentially or in parallel.
In general, the similarity of the proposed operating regimes for the ILC damping rings and the Super storage rings presents an opportunity for a well-coordinated program of activities that could yield much greater benefits than would be achieved by separate, independent research and development programs.
The Super baseline design includes a polarized electron beam. The addition of a polarized positron beam would increase the effective luminosity for polarization studies since, in the unpolarized case, chirality conservation in QED processes acts as a “filter” on half of the and production channels. Thus, for example, in the limiting case with both beams fully polarized, the same production rate would be achieved with half the luminosity, allowing some relaxation in machine parameters.
A polarized positron source (PPS) is included in the ILC baseline. The design envisages the installation of a superconducting helical undulator in the electron beamline, a solution that is clearly not applicable to Super. An alternative solution for the ILC is a PPS based on Compton scattering [17]. This solution presents the important advantage that the electron beam energy is in the 1–2 range; this approach could potentially be adapted for the Super project. Different ILC R&D programs are in place to develop the associated technologies. Of particular note are the efforts at LAL Orsay and KEK to develop and test optical resonators with very high gain and very small waists to improve the Compton cross section. With the rapid development of high power pulsed lasers, and of high current electron guns, the ILC Compton scheme could become the basis for upgrading Super to a fully polarized configuration. A polarized positron source for the Super upgrade, could even prove to be an interesting test facility for the ILC. The details of such an approach are discussed in Sec. 4.
The choice of wiggler technology, either permanent or superconducting magnets, is also of interest for both the ILC Damping Rings and Super. The permanent magnet solution seems less costly for Super. The low quadrupoles of the final focus will, however, likely employ superconducting technology, in order to accommodate the detector and allow for changing the beam energy.
2 Layout
1 The Rings
The lattices for the Super rings must satisfy several requirements:
-
•
Very small emittances;
-
•
Asymmetric energies ();
-
•
Insertion of a final focus with very small ;
-
•
Good dynamic aperture and lifetimes; and
-
•
Reuse of available PEP-II hardware as much as possible.
A crossing angle with the crabbed waist scheme relaxes the requirements on the bunch lengths and beam currents, compared to the older high-current designs. However, the objective remains to design a lattice that could deliver a peak luminosity of while keeping the wall plug power requirements as low as possible. By adapting the approach of the ILC damping ring design, we have developed a Super design for low-emittance rings that reuses all the available PEP-II magnets. Since the RF requirements for Super are also fully satisfied by the present PEP-II RF system, consdierable cost savings are possible.
The high energy ring (HER) and the low energy ring (LER) will be built on the same horizontal plane, with a horizontal crossing angle of . The beams will travel together only over a short section (about ) of the interaction region (IR), where they will collide at the interaction point (IP). On the opposite side of the IP the beams will be vertically separated in order not to collide, and the rings will be horizontally separated by a magnetic chicane. The design uses 1733 bunches with a 5% ion gap.
The IP collision parameters listed in Table 3 have been chosen based on beam-beam simulations, which also show that the requirements on damping times can be relaxed. The crossing angle has been fixed by optimization of the interaction region design.
| IP horizontal | 20 |
| IP vertical | 0.2 |
| Horizontal beam size | 4 |
| Horizontal beam divergence | 200 |
| Vertical beam size | 20 |
| Vertical beam divergence | 100 |
| Bunch length | 7 |
| Crossing angle |
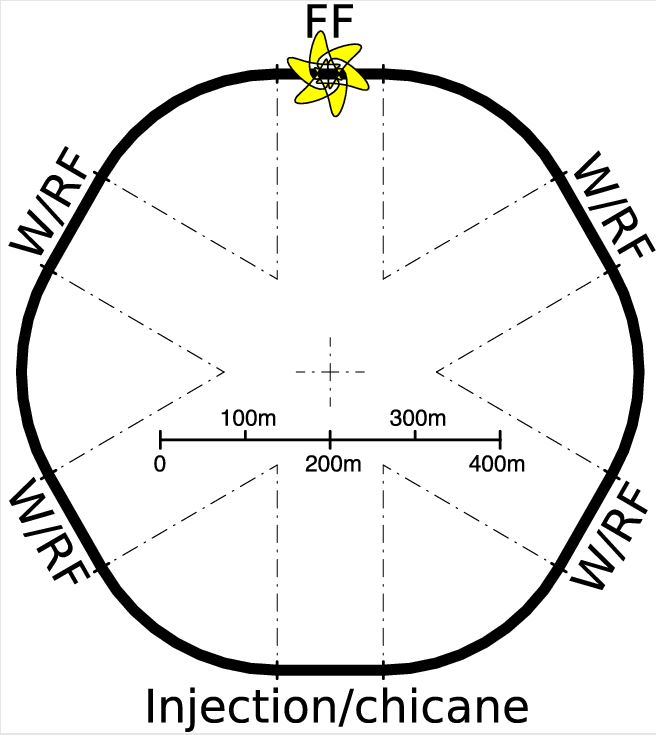
The magnetic layouts of the two rings are identical. Each ring has a 6-fold symmetry, with 6 arcs separated by 6 long straight sections, similar to the PEP-II design. Wiggler magnets will be installed in some of the straight sections in order to control emittance and damping time. A sketch of the rings is shown in Fig. 5.
Each ring is about 2249 long, corresponding to a harmonic number of 3568 for the PEP-II RF frequency of 476, although the circumference can easily be adjusted if needed.
A special final focus (FF) section brings the beams together, focuses them to the very small functions required by the design, and separates them after the collision. The FF has been designed as part of the final arc and straight section. A magnetic chicane on the opposite straight section will be used to adjust the ring length and to inject both beams. Details of the ring lattices are provided in Sec. 1. Table 4 summarizes the upgrade lattice parameters for both rings.
| LER | HER | |
| Energy (GeV) | 4 | 7 |
| C (m) | 2250 | 2250 |
| Bw (T) | 1.00 | 0.83 |
| (m) (Arc/FF) | 0.45/0.75/5.4 | 5.4/5.4 |
| Number of Bends (Arc/FF) | 120/120/16 | 120/16 |
| (MeV/turn) | 1.9 | 3.3 |
| Wiggler sections: Number | 4 | 2 |
| Wiggler sections: (m) | 100 | 50 |
| (mm) | 4.07 | 5.00 |
| (ms) | 16.00 | 16.00 |
| (nm-rad) | 0.8 | 0.8 |
| Emittance ratio | 0.25% | 0.25% |
| 1. | 1. | |
| Momentum compaction | 1.8 | 3. |
| 0.011 | 0.02 | |
| (MV), | 6, 8 | 18, 24 |
| 6.16 | 3.52 | |
| (A) | 2.3 | 1.3 |
| (MW) | 4.4 | 4.3 |
| (MHz) | 476 | 476 |
| 1733 | 1733 | |
| Ion gap | 5% | 5% |
2 Interaction Region
The Super interaction region (IR) has been designed with the following design constraints in mind:
-
•
Very small spot sizes at the IP;
-
•
Local correction for the very high chromaticity due to the highly focused beam, keeping geometric aberrations small;
-
•
Separation of the LER and HER beams as soon as possible;
-
•
Preventing synchrotron radiation (SR) production from hitting the beam pipe and the detector;
-
•
Compatibility with a beam pipe of minimum radius and thickness; and
-
•
Maintenance of the largest possible angular acceptance for the detector.
The study of beam trajectories has led to the introduction of a small dipole between the first two low- quadrupoles in each beam in order to redirect the SR coming from the focusing element. The crossing angle has been chosen to be . A detailed description of the IR and SR backgrounds can be found in Sec. 3.
3 Injector
A possible injection scheme for Super is the one presently used for the DANE -Factory at Frascati. This scheme inlcudes an electron gun, a linac for positron production, a positron converter and a linac for electron and positron acceleration to operational energies. Separate transfer lines bring the two beams into the rings. Details of this simple scheme are described in Sec. 11. Alternatively, a design incorporating two damping-rings could offer advantages. Other schemes, including a recirculating linac, are under consideration.
3 Interaction Region
1 Geometry
The final focus of the Super design calls for a small ( and a very small (). These small beta functions require the final focus magnets to be as close to the interaction point (IP) as possible in order to keep the maximum beta values as low as possible and minimize the chromaticity generated in the final focus. Table 5 lists the accelerator parameters that are important for the interaction region (IR) design. In the table and throughout this section we assume the higher and more challenging beam currents from the Super upgrade.
| LER | HER | |
| Energy (GeV) | 4.0 | 7.0 |
| Beam current (A) | 3.95 | 2.17 |
| No. of bunches | 1733 | |
| Bunch spacing (m) | 1.26 | |
| (mm) | 20 | 20 |
| (mm) | 0.2 | 0.2 |
| (nm-rad) | 1.6 | 1.6 |
| (pm-rad) | 4 | 4 |
| Crossing angle (mrad) | 34 | |
We have adopted a beam-stay-clear (BSC) envelope that is similar to that used in the PEP-II design [18]. The stay-clear is defined as 15 uncoupled beam for closed orbit distortion (COD). The stay-clear is defined as 15 fully coupled beam COD.
With these parameters in mind, we have positioned the first quadrupole magnet (QD0) to start away from the IP. A collision crossing angle of ( degree) means that the beam centers are apart at this location, while the two BSC envelopes are only . The small separation distance precludes the use of separate initial quadrupole magnets, so QD0 is shared by the two beams. In order to produce similar final focus beta functions for both beams, we would like to have set the gradient of QD0 by the requirements for the high-energy beam (HEB), resulting in a magnet length of . However, this is too strong for the low-energy beam (LEB), so we shorten the length to to obtain the correct integrated strength for the LEB. The beams therefore need to be separate enough at from the IP () to be able to place an additional magnet that continues the vertical focusing for the HEB, while providing a field free region for the LEB. We label this -long magnet QD0H. The two beams enter separate beam pipes at this location.
2 The QD0H magnet
The beam center separation at is for the incoming LEB side and for the incoming HEB side. The difference is due to the fact that the LEB is easier to bend than the HEB. If we include the BSC envelopes we have of clearance on the incoming LEB side and of clearance on the incoming HEB side. If we assume a beam pipe radius of for each beam at from the IP, we then have 11.9 and of space for a beam pipe and magnet design. Using permanent magnet (PM) material with a remnant field of , we can construct a cylinder with an inner radius of and an outer radius of ( thick) that has enough strength to satisfy the HER gradient requirements. The PM blocks have a very low residual field beyond the outer radius of the material and hence make a good field free region for the LEB. This leaves enough room for a thick beam pipe for each beam at this narrow location. Beyond from the IP the distance between the beams grows rapidly, and it is relatively easy to accommodate separate beam pipes and magnets for the two beams.
The next quadrupole magnet (QF1) from the IP is an focusing magnet that is long and is located between and from the IP. There are two separate magnets at this location, one for each beam; beyond QF1 the beam lines for both beams have the same layout with counterpart magnets at each location.
3 Synchrotron Radiation Fans and Backgrounds
We distinguish between synchrotron radiation (SR) in the form of “bending radiation”, which are “fans” of radiation generated by bending the entire beam, and “focusing radiation”, which is SR that results from a beam that travels through a quadrupole magnet on axis. The SR power levels from focusing radiation are, in general, about 100 times lower than the power levels from bending radiation. For high current storage rings, the power levels for SR fans can easily be several kilowatts. The power levels for both types of SR are too high to allow these sources to strike directly the detector beam pipe.
The non-zero collision crossing angle means the two beams enter the shared QD0 magnet at different locations. If we center the two QD0 magnets along the axis of the detector beam pipe, the vertically focusing, and hence horizontally defocusing, QD0 magnet starts to bend the two beams away from each other in the plane. The incoming beam trajectories then produce SR fans that strike the detector beam pipe located at the collision point, as illustrated in Fig. 6. In order to protect the detector beam pipe from this radiation without increasing the radius of the beam pipe, masks are placed on either side of the central pipe to shadow this incoming radiation. These masks, which are quite close to the beams, intercept high levels of SR radiation on the inside surfaces near the central beam pipe.
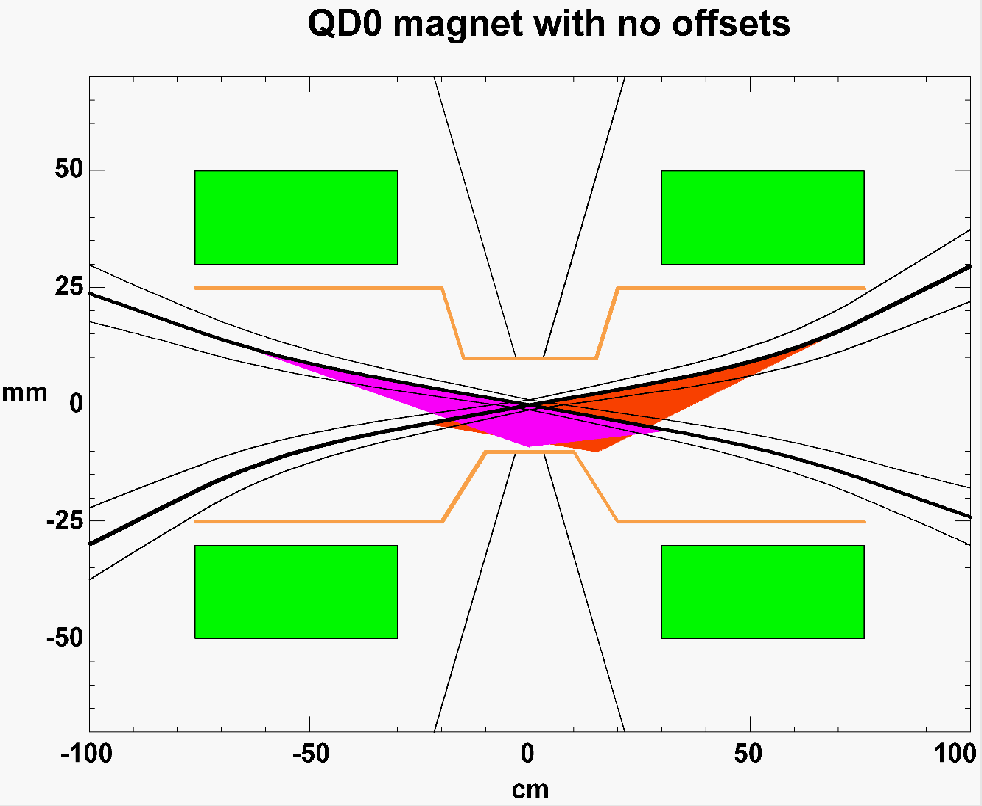
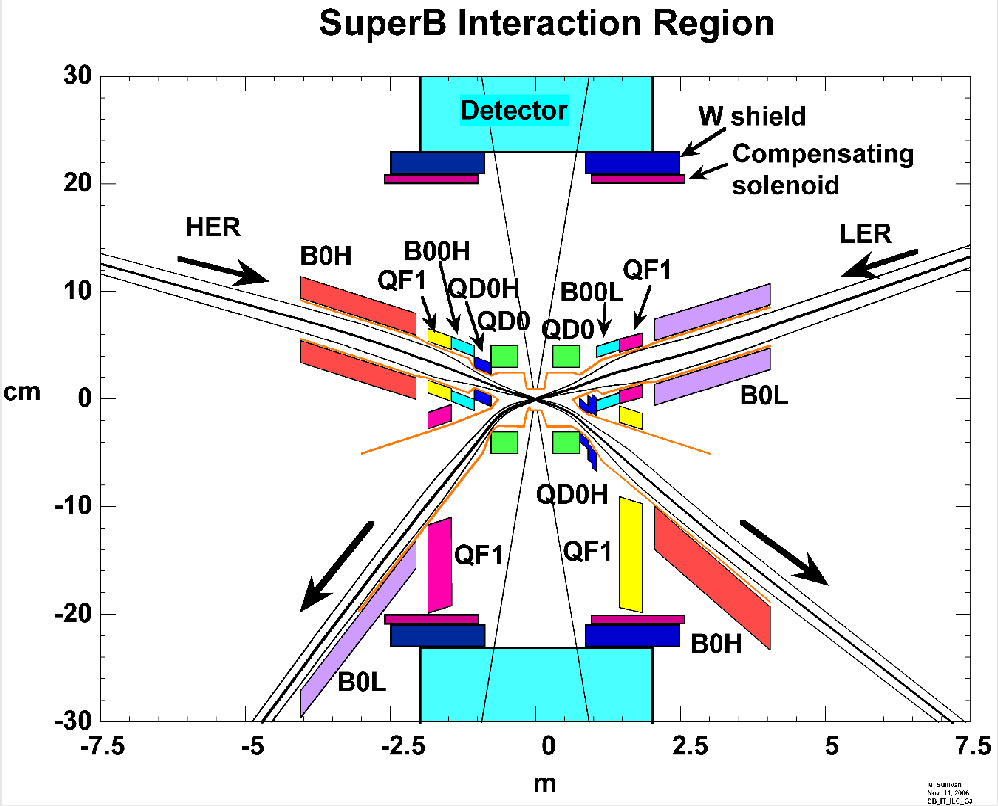
These surfaces have a relatively large solid angle acceptance for backscattered photons to strike the central Be beam pipe, causing unacceptably high backgrounds. Increasing the central detector radius would reduce this problem, but compromise the detector physics performance and, in a sense, reduce the effective luminosity of the collider.
We have therefore adopted an alternative solution of offsetting the magnetic axis of QD0 to a value that is closer to the trajectory of the incoming beams. The axis is still parallel to the detector beam pipe. This eliminates the incoming SR fans from the QD0 magnets and also directs the focusing radiation from QD0 away from the detector beam pipe. Consequently, the detector background from SR has no component from QD0. The QD0 offsets are not identical, because we are partially compensating for the fact that the LEB is easier to bend than the HEB.
The next most important background source after the QD0 is the focusing radiation coming from the incoming beams as they travel through the QF1 magnets. This radiation comes from the horizontal over-focusing of the beam and, as a consequence, the photon trajectories are steeper, making it more difficult to shield the detector beam pipe from this source. In order to control this background rate, we introduce small bending magnets between the QD0 and QF1 magnets on the incoming beam lines. These bending magnets redirect the focusing radiation from the QF1 magnets away from the central Be beam pipe. Figure 7 shows a layout of the interaction region design and Table 6 lists the magnet parameters for the magnets in the IR.
| Length (m) | Starts at (m) | Strength | Comments | |
|---|---|---|---|---|
| 0.3 | 0.0 | Drift | ||
| QD0 | 0.46 | /m | Shared quadrupole | |
| QD0H | 0.29 | /m | HER quadrupole | |
| B00L | 0.4 | Dipole inc. LER only | ||
| BOOH | 0.4 | 1.05 | 1.5 | Dipole inc. HER only |
| QF1 | 0.4 | 292.3 /m | Quadrupole LER only | |
| QF1 | 0.4 | 589.1 /m | Quadrupole HER only | |
| B0L | 2.0 | 2.05 | 0.3 | Dipole LER only |
| B0H | 2.0 | 2.05 | 0.526 | Dipole HER only |
| QD0 offset | Incoming HER side | |||
| QD0 offset | Incoming LER side |
4 QD0H Magnet Design
We now look at some more details of the QD0H magnet. We rely on the experience of the PEP-II accelerator design, which used permanent magnet (PM) material to construct the final shared quadrupole. The design uses the Halbach method [19] for placing magnetized blocks in a cylindrical geometry to achieve the desired magnetic field. Figure 8 shows the magnetic block layout. The quality of the magnetic field is determined by the accuracy with which one can position the magnetized blocks and then maintain these block positions.
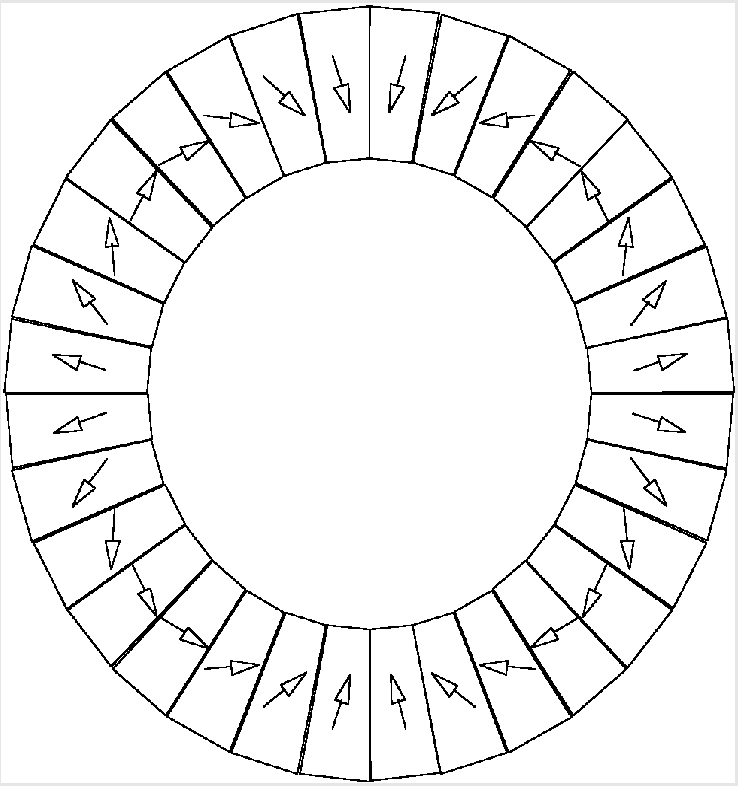
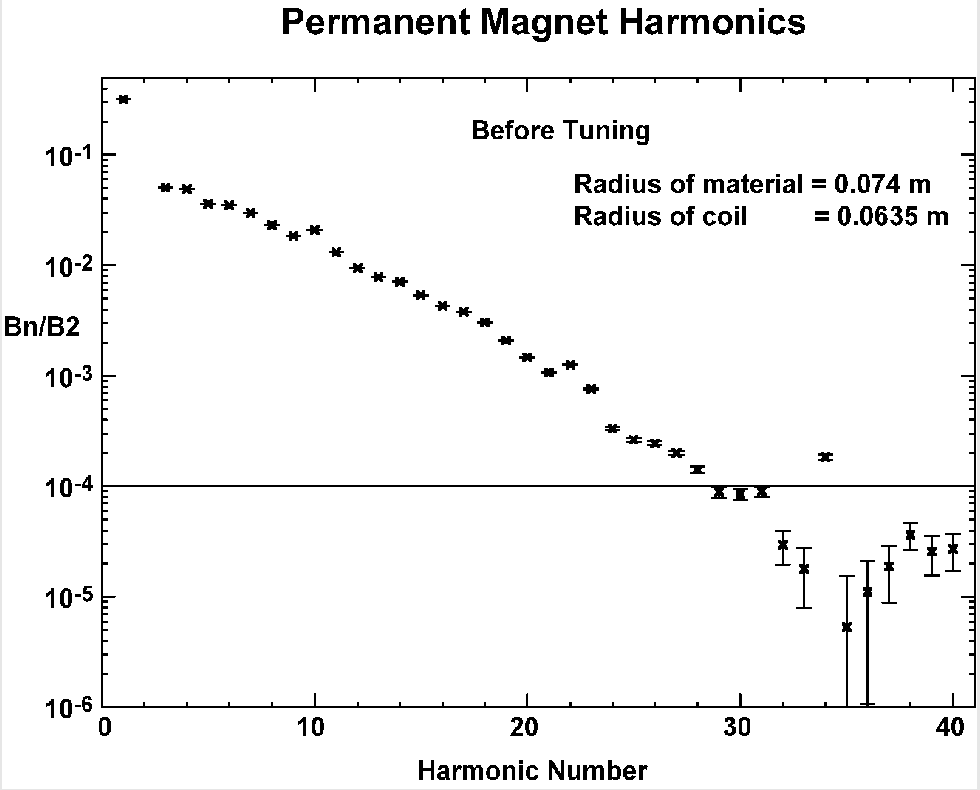
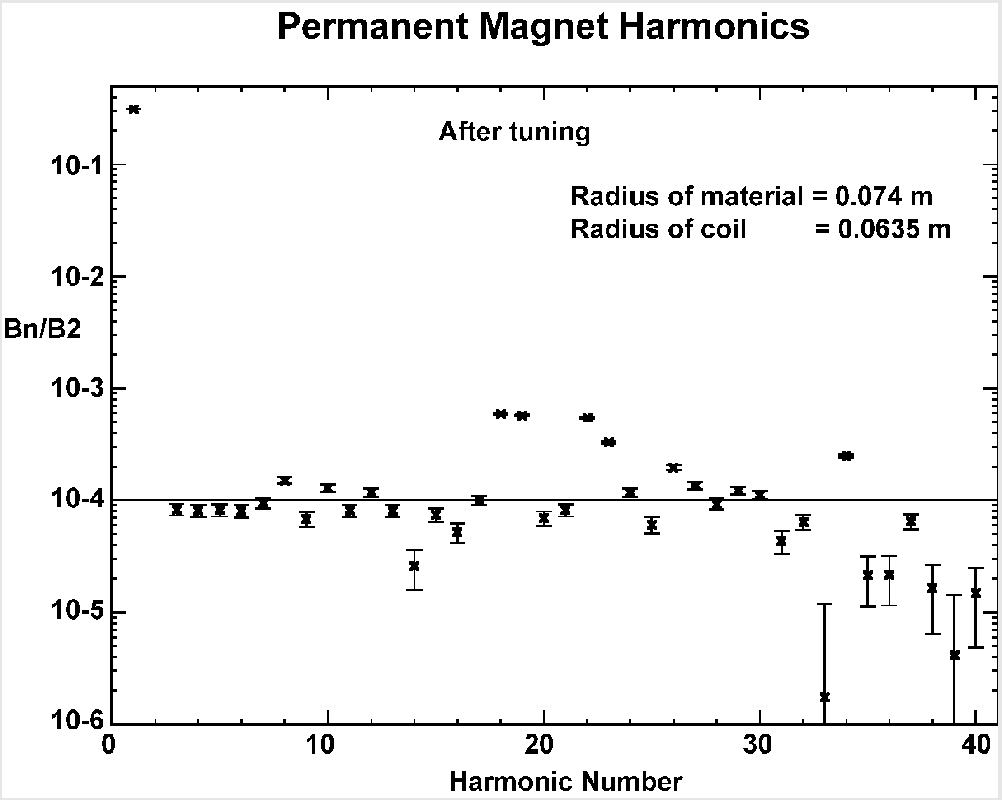
The PEP-II team developed a technique for correcting the higher harmonics of these magnets during assembly [20]. The technique can correct half as many harmonic numbers as there are magnetic blocks used to make up a slice of the magnet. The magnetic slices used to build the PEP-II quadrupoles had an inner radius of , while the Super design has an inner radius for magnetic material of . The block position control in the PEP-II magnet was about . Figure 9 shows the result of correcting the block positions on the higher harmonics of a prototype magnet slice. Because the inner radius of the magnet material in the present design is about five times smaller than for the PEP-II design we would have to control the magnetic block positions to about . Although this is somewhat more challenging, we do not consider it overly difficult. In the PEP-II design, the block assembly was epoxied together to maintain position stability and the temperature was stabilized by water cooling.
5 Transverse Beam Profile
In order to study detector backgrounds from SR we use a two-gaussian transverse beam profile, as employed in the PEP-II design. The primary gaussian distribution matches the sigma and sigma given by the nominal beam emittances and beta functions. To this we add a small fraction of a wider gaussian that simulates the non-gaussian or “tail” distribution of the beams. These tail distributions are produced from several effects; beam-beam forces from the collision, intra-beam scattering, Touschek scattering, etc. Consequently, it is difficult to quantify the exact nature of the tail distribution. We have conservatively chosen a relatively high tail distribution since, with collimation of the beam at for the plane and for the plane, we estimate a beam lifetime of about an hour. Figure 10 shows the transverse beam distributions, together with the expressions used.
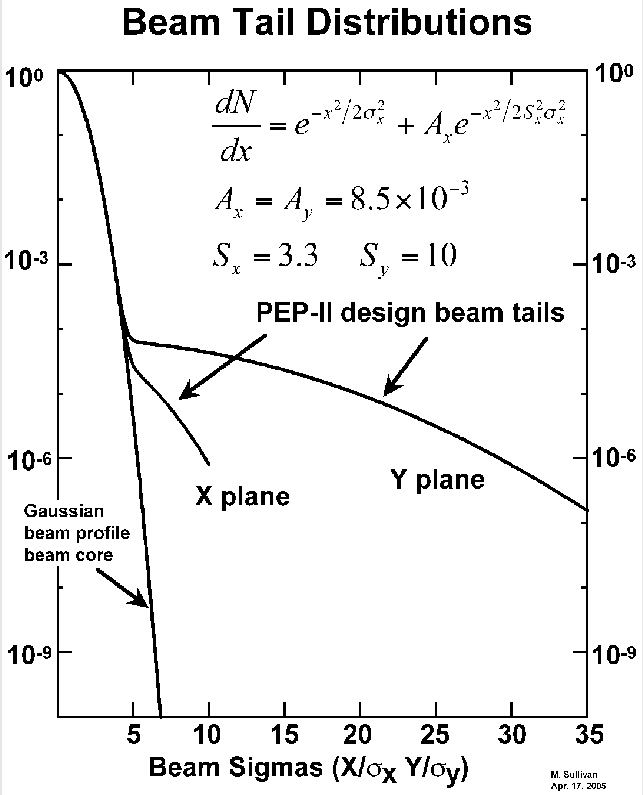
We model a beryllium detector beam pipe with a radius and a long physics window, which accommodates a detector acceptance. We also assume a radius beam pipe out to . Since we must set the QD0 axis closer to the incoming beam trajectory, the axis is consequently farther away from the outgoing beam orbits. This generates more SR from the outgoing beams, which is not a direct source of backgrounds, but can become a source from backscattered radiation. In addition, the total amount of SR power produced in QD0 grows rapidly as the offset moves closer to the trajectory of the incoming beams. With this in mind, we move the QD0 axis only as close as needed to make sure the SR from QD0 does not strike the detector beam pipe, and the photon rates on nearby downstream mask surfaces are acceptably low. We place a mask on the incoming HEB side to help shadow the detector beam pipe from HEB radiation. This mask is located on the side of the detector beam pipe, and is modeled as an ellipse offset from the detector axis. The mask tip is in from the radius pipe. Since this is the only surface that is inside the radius of the detector beam pipe, the overall masking design is quite open, and there are no obvious cavities for trapping higher-order-mode (HOM) power. Figure 11 shows the photon rates on the surfaces that intercept SR from the incoming beams.
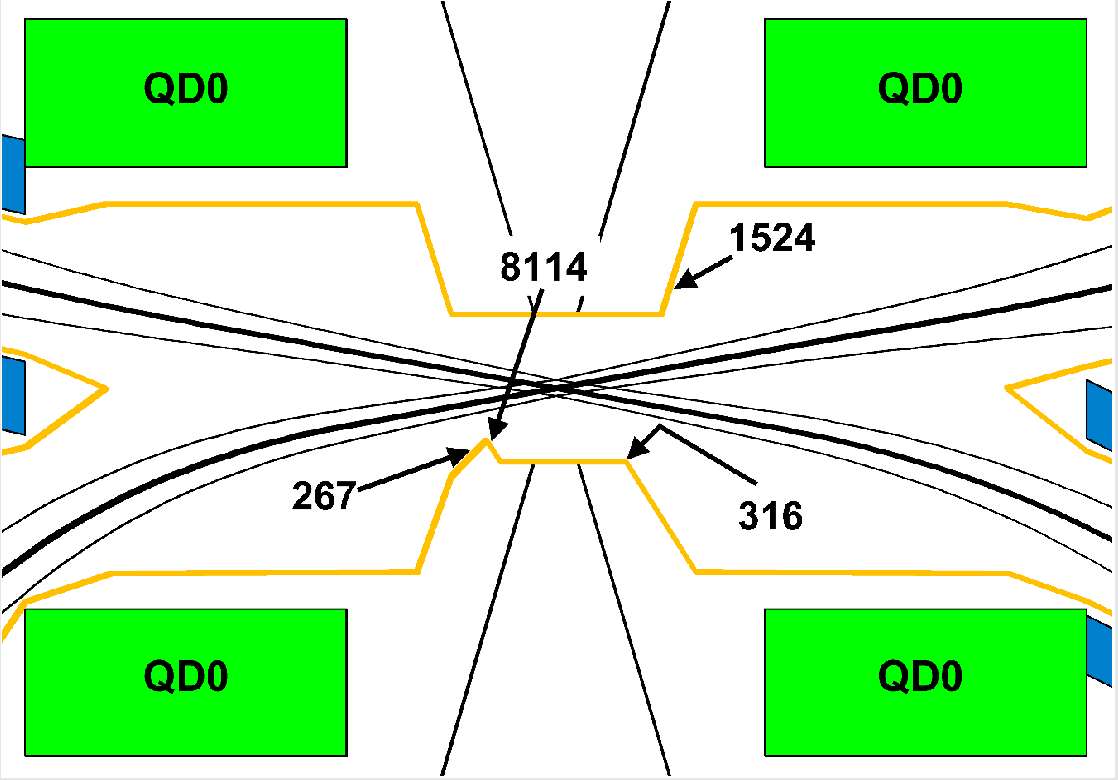
The SR photons that strike the surfaces near the detector beam pipe originate from beam particles that are greater than five beam sigma from the beam center; the background rates are thus sensitive to the particle density of the tail distribution. The photons from the LEB that strike the inside surface (detector beam pipe side) of the HEB mask have a chance of backscattering from the mask surface and hitting the detector beam pipe. This is also true of the photons from the HEB that strike the beam pipe downstream of the detector physics window. Figure 12 shows the energy spectrum of the photons that strike these surfaces, as well as the energy spectrum of photons that backscatter from these surfaces. The backscatter spectra are obtained using the incident spectra and a program that uses an Electron-Gamma Shower (EGS) simulation [21].
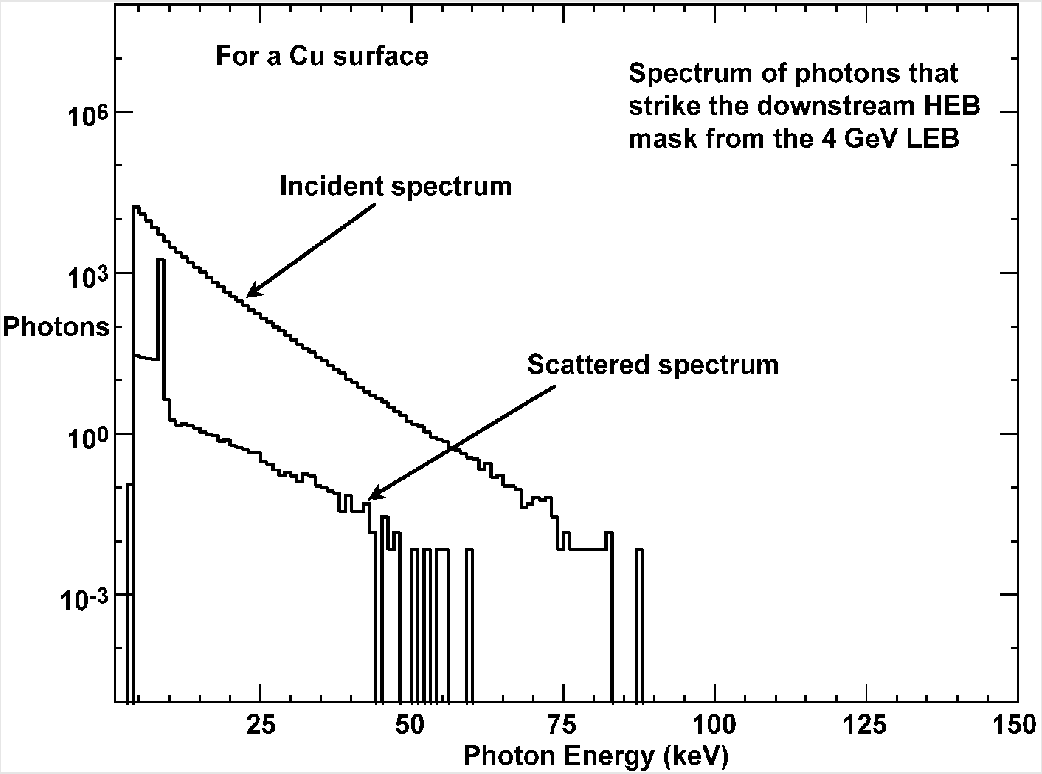
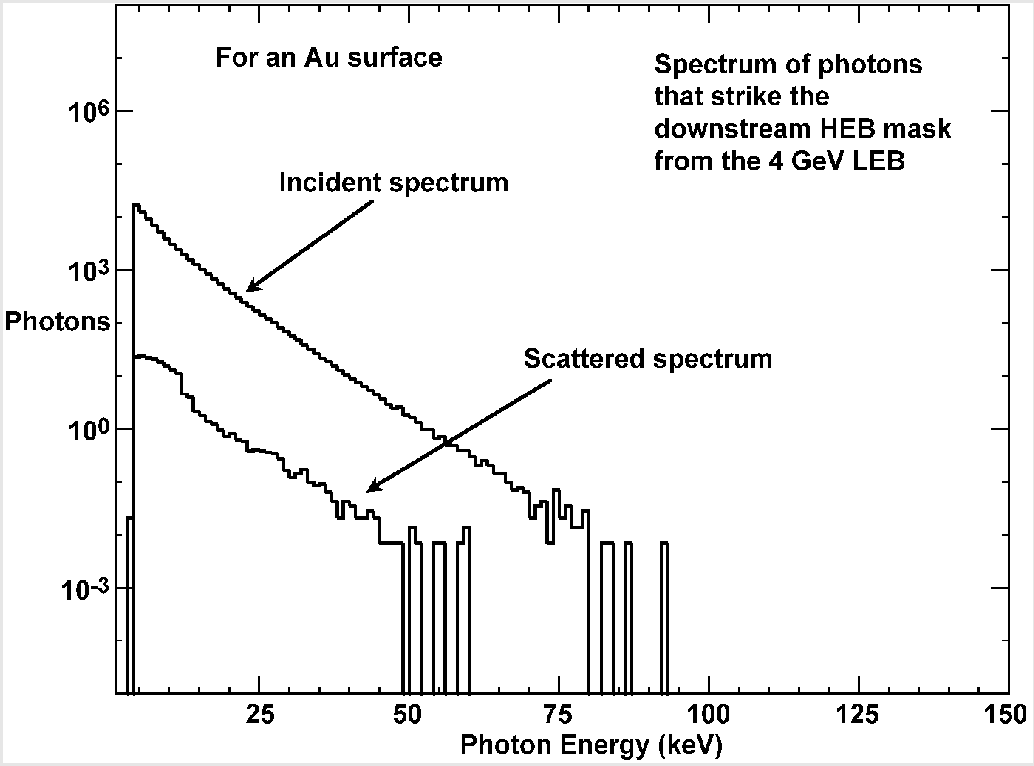
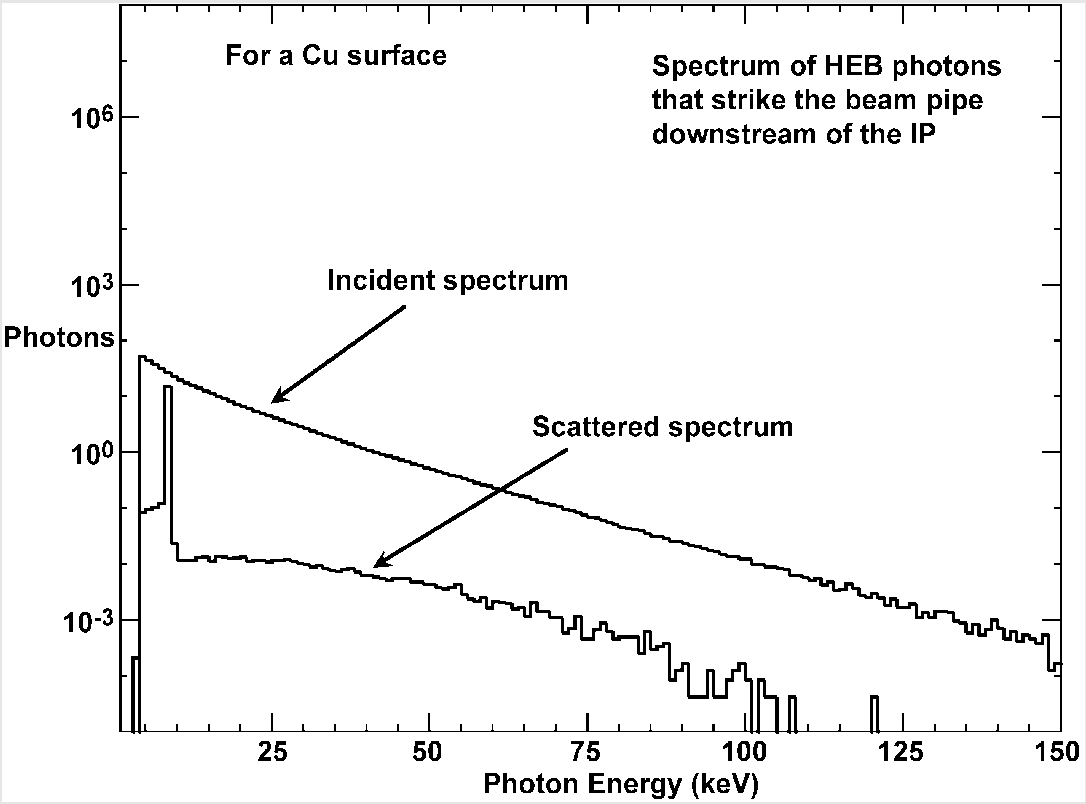
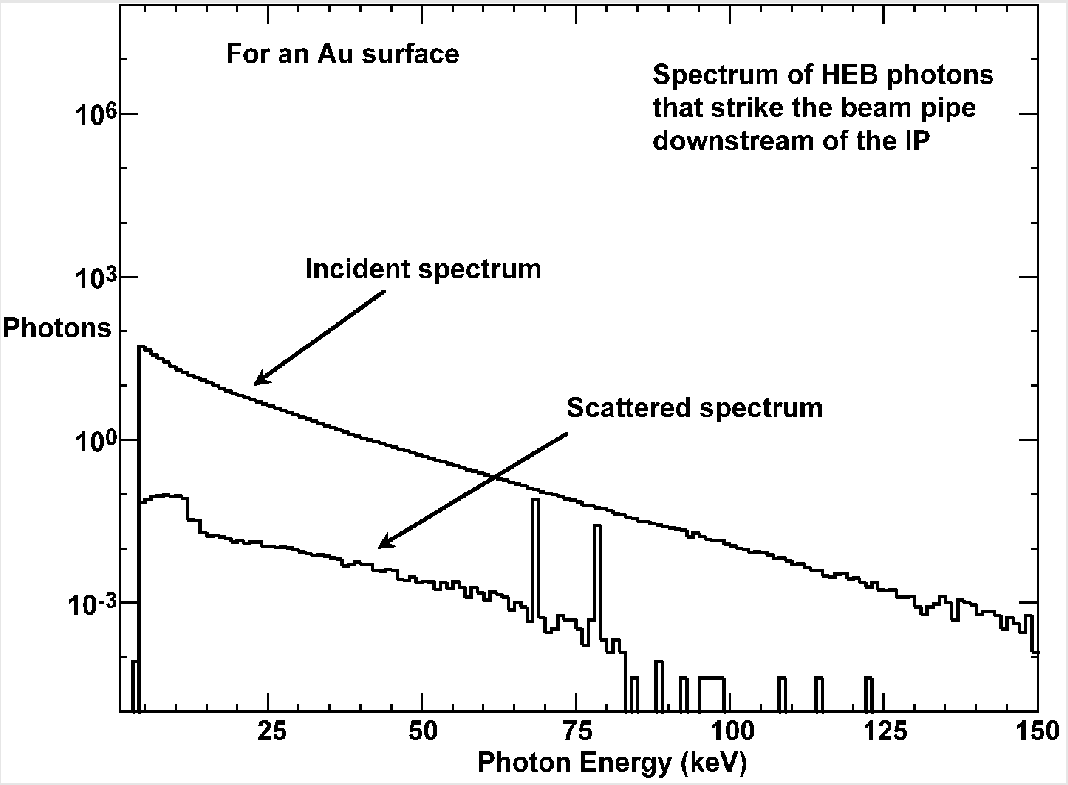
We study two cases: a Cu surface and an Au surface. The backscattering rates are for normal incident photons. Based on the backscatter rates for these nearby surfaces, we can estimate the rate for photons incident on the detector beam pipe. Calculating the solid angle acceptance of the detector beam pipe from these nearby surfaces that are struck by photons, we find an acceptance fraction of about . Applying this fraction to the total backscattered photon rate from these nearby surfaces, we can estimate the rate of photons striking the detector beam pipe. The results are summarized in Table 7. We find the rate of photons incident on the detector beam pipe is lower if the backscattered photons are produced from a Cu rather than Au surface. However, this conclusion is drawn by integrating the spectra above , which is also above the Cu K-shell photo-emission line at . The 8.9 emission line is evident in the Cu backscattered spectrum shown in Fig. 13. Although these photons are low energy, we may prefer the Au coating in order to suppress this potential background source. The rate of photons on the detector beam pipe is sufficiently low in either case. These predicted rates are significantly lower than the 10 per beam crossing for the PEP-II IR design.
6 Outgoing SR Fans
As discussed above the exiting beams are strongly bent as they travel through the QD0 magnets. The outgoing LEB generates of SR power in QD0 and the outgoing HEB generates . The beam pipe for the outgoing beams is designed so that these high power fans do not strike any nearby surfaces and are absorbed on beam pipe surfaces that are meters away from the collision point. Figure 14 shows the SR fans generated by the beams and Table 8 lists the SR power produced by the beam for each IR magnet.
| Surface | LER beam | HER mask | HER mask | b.p. 10 cm | |
|---|---|---|---|---|---|
| incoming surf.a | inside surf. | outside surf.a | from the IP | ||
| Distance to IP | 15–20 cm | 10 cm | 10–15 cm | 10 cm | |
| Source(s) | LER QF1 | LER QD0, | HER QF1 | HER QF1 | |
| B00L, QF1 | |||||
| Fraction of solid angle | 0.000a | 0.011 | 0.000a | 0.011 | |
| to det. b.p. | |||||
| Energy of | |||||
| Incident photons | N/xing | 1524 | 8114 | 267 | 316 |
| 3.63 | 1.93 | 6.36 | 7.52 | ||
| Backscatter from Cu | N/xing | — | 8.85 | — | 0.69 |
| — | 2.11 | — | 1.64 | ||
| Inc. on b.p. from Cu | N/xing | — | 0.097 | — | 0.0076 |
| — | 2.32 | — | 1.81 | ||
| Backscatter from Au | N/xing | — | 24.2 | — | 1.12 |
| — | 5.75 | — | 2.65 | ||
| Inc. on b.p. from Au | N/xing | — | 0.27 | — | 6.34 |
| — | 0.12 | — | 2.93 | ||
| Energy of | |||||
| Incident photons | N/xing | 15.4 | 1072 | 102 | 120 |
| 3.67 | 2.55 | 2.43 | 2.86 | ||
| Backscatter from Cu | N/xing | — | 2.63 | — | 0.49 |
| — | 6.26 | — | 1.16 | ||
| Inc. on b.p. from Cu | N/xing | — | 0.029 | — | 0.0054 |
| — | 6.90 | — | 1.28 | ||
| Backscatter from Au | N/xing | — | 2.83 | — | 0.57 |
| — | 6.74 | — | 1.36 | ||
| Inc. on bp from Au | N/xing | — | 0.031 | — | 0.0063 |
| — | 7.41 | — | 1.49 | ||
-
a
These surfaces are sloped to eliminate the possibility of backscattered photons hitting the Be beam pipe at the IP.
| LER | HER | Type | |||
| ctr | Magnet | Power | Magnet | Power | |
| (m) | (W) | (W) | |||
| -3.05 | B0L | 147 | B0H | 755 | Bend |
| -1.65 | QF1 | 29 | QF1 | 114 | Quad |
| -1.25 | B00H | 1228 | Bend | ||
| -0.905 | QD0H | 24 | Quad | ||
| -0.53 | QD0 | 87970 | QD0 | 6592 | Quad+Bend |
| 0.53 | QD0 | 1718 | QD0 | 141270 | Quad+Bend |
| 0.905 | QD0H | 24 | Quad | ||
| 1.25 | B00L | 1568 | – | Bend | |
| 1.65 | QF1 | 29 | QF1 | 114 | Quad |
| 3.05 | B0L | 147 | B0H | 755 | Bend |
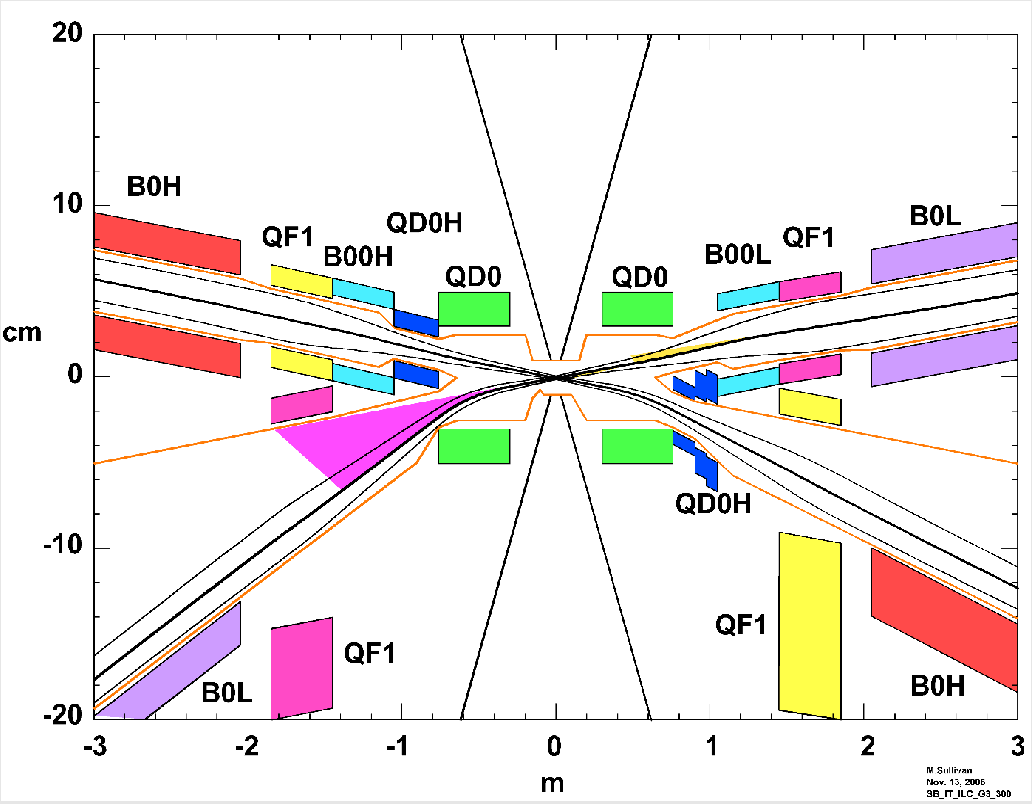
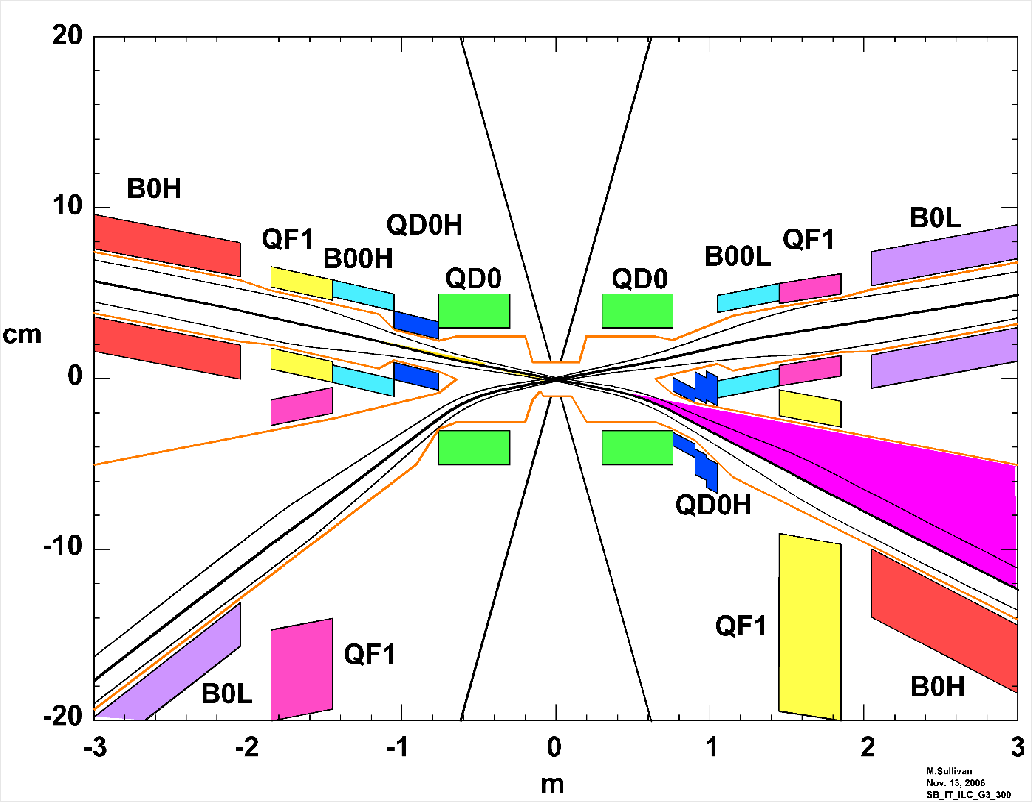
The larger beam pipes on the outgoing beam lines require that the magnets on these lines have larger apertures. A possible design for the outgoing QF1 magnet is one similar to the horizontally split quadrupole magnets used in SPEAR III [22]. These magnets have no material in the horizontal plane, which allows the horizontal fan to pass through the magnet without striking the beam pipe. The outgoing B0 magnets can be C-shaped bend magnets. Both of these designs employ iron core magnets, which would need to be shielded from the detector magnetic field. We would accomplish this by inserting a compensating superconducting solenoid around both beam lines and into the detector far enough so that at least the QF1 and B0 magnets can be iron core magnets. Figure 7 shows a suggested layout of the compensating solenoid.
At some point the outgoing SR fans will strike the beam pipe. We assume this occurs somewhere near from the IP (similar to the HEB PEP-II design), resulting in only a small probability for backscattered photons to hit the detector beam pipe. Although this has not been fully studied, steps can be taken to minimize background from this source. The backscatter rate can be made very small by keeping the source point as far as possible from the detector beam pipe (minimizing the solid angle acceptance of the detector beam pipe). The beam pipe surface can be coated with a layer of high- metal such as gold. The angle of the beam pipe surface can, in some cases, be such as to eliminate the possibility of backscattering into the detector beam pipe. Another approach is to add a small () mask near the detector beam pipe that completely shadows the Be beam pipe from this source. We believe that any background from the strong outgoing SR fans striking the beam pipe far from the detector can be made negligible at the IP, as it is in the PEP-II design.
7 Beam-Gas Bremsstrahlung (BGB)
Another source of backgrounds in the detector comes from beam-gas bremsstrahlung (BGB), which results from a beam particle colliding with a gas molecule in the vacuum chamber, resulting in the production of a gamma and an off-energy beam particle. Both of these particles can cause backgrounds if they strike the beam pipe near or inside the detector. In order to minimize this background source, the residual pressure must be as low as possible just upstream of the detector for both beams. The PEP-II experience indicates that we can achieve a dynamic pressure of 1–2 in these regions with sufficient pumping. Bending magnets further outboard of the detector (–20) can help minimize this background source. Suitable arrangement of the last bend magnet on the inbound beam line can be used to direct the stream of gammas to a known location away from the detector. Likewise this will overbend low-energy beam particles out the beam pipe, again well away from the detector.
8 Radiative Bhabhas
The final-state particles produced in radiative Bhabha scattering are a source of detector background. The gamma produced by this reaction and the reduced energy beam particle can both generate backgrounds in the detector if these particles strike material close enough to the detector. The gammas are generally produced in the direction of the beam, and hence exit the IP along the crossing angle trajectories. In our design, this means the outgoing gammas travel along the edge of the strong outgoing SR fans and hence do not intersect the beam pipe until several meters away from the collision point. However, the outgoing off-energy beam particles from this reaction can be a source of background for the detector. Figure 15 illustrates the orbits of these off-energy particles for Bhabha scattering from the LEB and HEB. A Monte Carlo simulation is needed to fully study this background source, and ways of shielding the detector from it. Section 3 on detector backgrounds has further details on this subject.
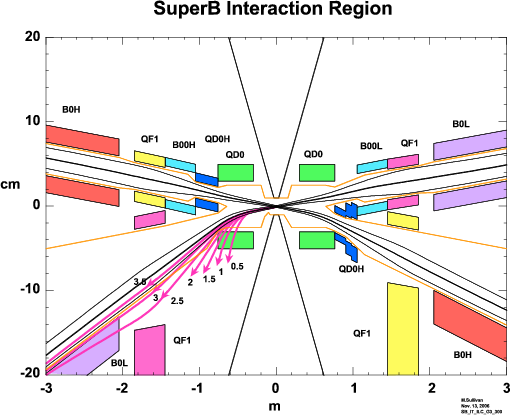
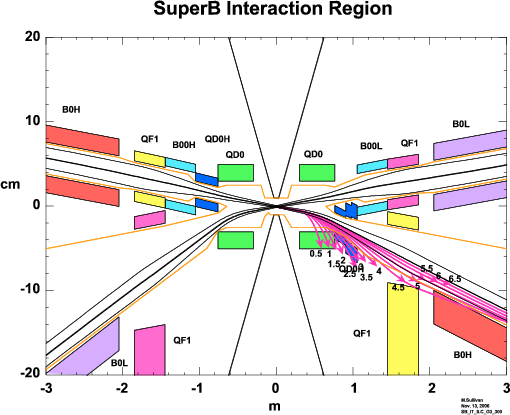
9 Luminosity Monitor
The PEP-II accelerator uses a zero-angle luminosity monitor that detects the gammas from the radiative Bhabha reaction [23]. The monitor detector is located next to the HER beam pipe where it intercepts the gammas from LEB radiative Bhabha events through a relatively thin Al window. This method works quite well, and is an invaluable tool for tuning up the accelerator. The good signal-to-noise ratio allows measurement of the luminosity contribution from individual bunches. The beam pipe design for Super allows a luminosity monitor similar to the PEP-II type to be installed 7–10 from the IP. In the Super case, a detector could be installed on either side of the IP, one to intercept the radiative Bhabha signal from the LEB and another to intercept the radiative Bhabha signal from the HEB. The main background signal for this detector is BGB generated by the incoming beam. This background signal is integrated over the length of the beam trajectory near the collision point following the last inbound bend. In the PEP-II case, this is . The Super design has bending magnets for the incoming beams between the QD0 and QF1 magnets, as well as just outboard of the QF1 magnets. This would make the integrated distance for the BGB signal about , very similar to PEP-II.
4 Magnet Lattice and Optics
1 HER Lattice
The high-energy ring (HER) has 6 arcs, with 12 cells each. Each arc is approximately 250 long. Six straight sections connect the arcs; one contains the final focus (FF), while in the opposite straight section a magnetic chicane is used to keep the beams separated. The other four straight sections will house the wiggler magnets, needed to control emittances and damping times, and the RF cavities. In the initial configuration, the ring will have a horizontal emittance of -rad with no wiggler magnets installed; in the second phase, which has -rad emittance, two wigglers with a field will be used. In this way we can control both emittance and damping time.
The HER lattice was inspired by the OCS lattice used as the baseline design of the ILC Damping Rings (DR), given the similarities of the ILC and Super designs. The beam energy was scaled to the required by Super, and the circumference was shortened from the original to the final design value of , providing shorter (cheaper) rings with the required design emittance and damping time.
The OCS lattice achieves a very small emittance at , by employing a TME (theoretical minimum emittance) long cell [24] with two dipoles and two quadrupole families (QF and QD). The functions are well separated and high at the sextupoles locations, allowing for easy chromaticity correction.
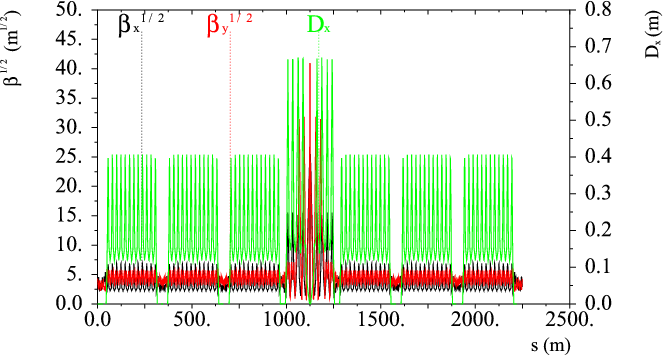
We were able to construct a similar cell using the PEP-II HER bending magnets, which are long. However, to shorten the ring circumference, we chose a cell with a phase advance of in the horizontal plane and in the vertical plane, with even smaller intrinsic emittance. With the shorter arcs we gained other benefits: smaller natural horizontal chromaticity, which drops from to , and fewer elements. The number of sextupole families was also reduced from three to two per arc, requiring higher strength magnets. The optical functions in the ring are shown in Fig. 16. Figure 17 compares the optical functions for the new cell vs. the OCS design.


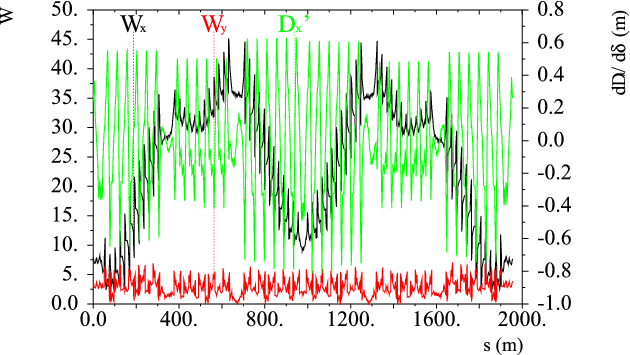
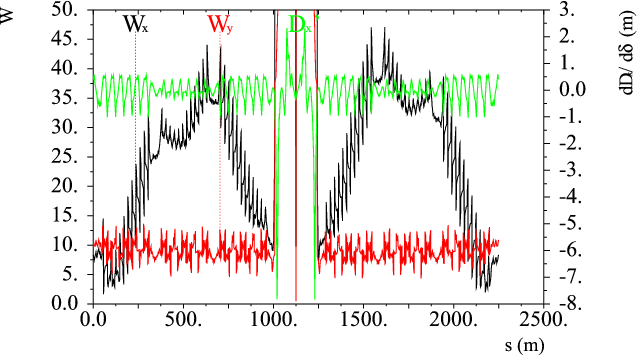
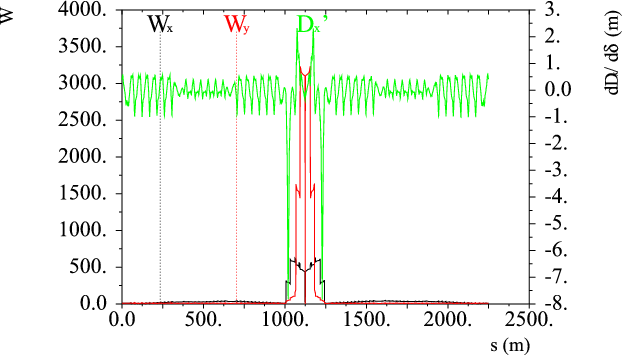


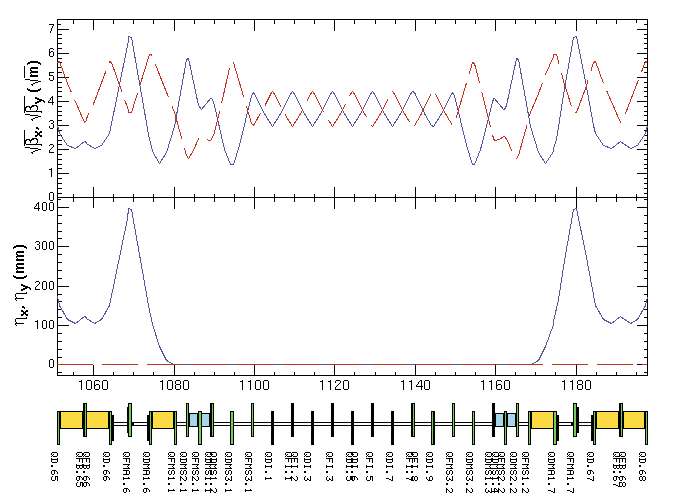
The phase advance between the arcs has been also optimized in order to minimize chromatic terms. Chromaticity in the arcs is corrected with three families of sextupoles, two SD and one SF. The behavior of the chromatic functions and second-order dispersion function for the ring without the insertion of the FF, and with sextupoles to correct chromaticity to zero, is shown in Fig. 18. The vertical function is always very small; however, by adjusting the horizontal phase advance, the horizontal function can be made periodic and goes to zero in the two main straight sections. This behavior is slightly perturbed by the insertion of the FF, with its high gradient sextupoles, as seen in the right-hand plot of Fig. 18, where a blowup allows a better appreciation of the behavior in the arcs. Its value in the FF is, of course, quite different, as can be seen in Fig. 19 in full scale, due to the large chromaticity induced by the high values in the IR quadrupoles.
Each arc has a dispersion suppressor (an example is shown in Fig. 20) so that the dispersion is zero in all the straights connecting the arcs, where the RF cavities and wigglers will be installed. The straight section where we can install the wigglers has an optical function behavior similar to the ILC OCS design (see Fig. 20, righthand plot). Of course similar functions can be obtained in wiggler-free sections. Tuning of the phase advances can easily be performed in the straight section opposite the FF (see Fig. 21), without perturbing the chromatic characteristics of the ring.
All the PEP-II HER magnets (originally built for an machine) have been used in the ring. We will need to build some additional sextupoles and quadrupoles.
2 LER Lattice
The Low Energy Ring lattice is very similar to the HER design, as can be seen in Fig. 22 where the optical functions are shown. However, since the PEP-II LER dipoles are very short (), in order to have the same emittance as the HER, the cell has been modified to incorporate four bending magnets, two of the PEP-II LER type and two of a new type (). The LER cell is very similar to the HER cell. Fig. 23 shows the optical functions for the new cell. The dispersion is somewhat lower in this cell then in the HER cell. The dispersion-suppressor straight sections are very similar (righthand plot of Fig. 23).

The -rad emittance in the LER is obtained using two wiggler magnets of the same design as the wigglers in the ILC OCS lattice. The magnet technology will be the subject of further study; this is an example of an issue common to Super and the ILC DR. With four wigglers, we will be able to reach -rad emittance and the same damping time as in the HER ring. The wiggler section is very similar to that for the HER, as can be seen from the lefthand plot in Fig. 24. A cell with the same optical characteristics but without the wiggler field is shown in the righthand plot of Fig. 24. The chromatic behavior is also the same since the same constraints on the phase advances have been chosen (see Fig. 25). Finally, all PEP-II LER magnets (built for a machine) have been used in the new ring design; we also need to build some new sextupoles and quadrupoles.


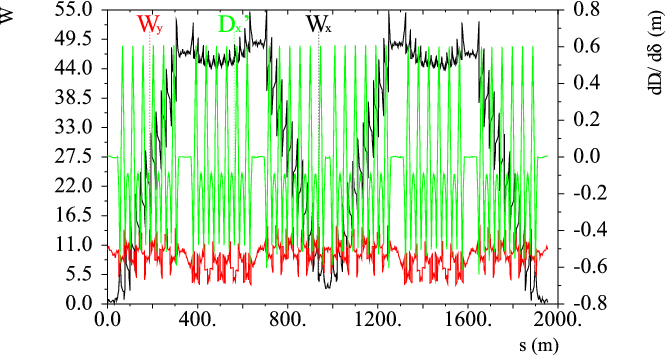
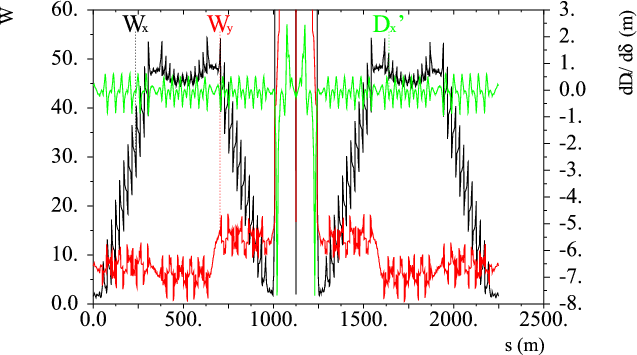
In conclusion, we have been able to develop a lattice design that is very similar for both rings, i.e., with the same design values for parameters such as emittance and damping times, in spite of their different energies and the constraint of re-using all the PEP-II components.
3 Final Focus
Conceptual Design.
The design of the Super final focus section must satisfy several different constraints:
-
•
Very small functions at the interaction point (IP);
-
•
Small geometric aberrations, with non-interleaved sextupoles; and
-
•
All bends with the same sign, to avoid chicanes, keep the geometry simple and reduce the arc length.
Producing low- functions at the IP requires the design to locate the final focus quadrupole doublets as close as possible to the IP. The Super final focus (FF) has been designed with this principle, using the experience gained in designing the FFTB/NLC final focus [26]. The design parameters for the function at the IP are in the horizontal plane and in the vertical plane, with a minimum distance () between the IP and the first FF quadrupole magnet of . The FF quadrupole magnets must have strong magnetic gradients, in order to realize the extremely low- functions at the IP. We have chosen to design the FF as a section of a regular arc, so that it is naturally embedded in the lattice without breaking the 6–fold symmetry. The interaction region is then geometrically, but not optically, equivalent to all the other straight sections.
The horizontal crossing angle is taken to be ; it will be adjusted with bending magnets in the dispersion suppressor of the arc section connected to IR. The solenoidal field of the detector will be compensated with compensation solenoids on each side of the detector. An example of compensation scheme is described in Sec. 4.
The lattice optical functions of the FF are shown in Fig. 27. A sketch of the magnetic structure is shown in Fig. 26.
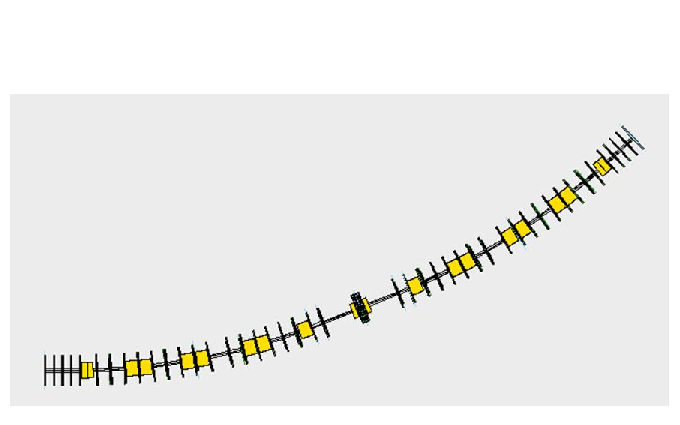
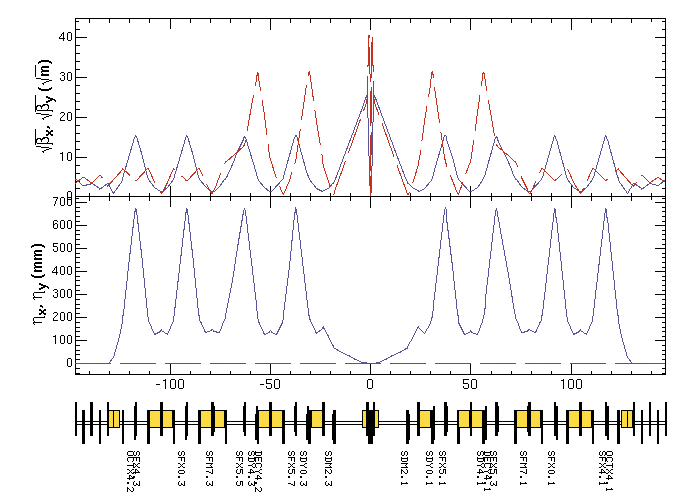
Due to the high values in the first FF doublets, the FF quadrupole magnets generate large chromaticity, which should be corrected as locally as possible. This is accomplished in the Super FF design by using the scheme studied for the FFTB/NLC at SLAC: the local chromaticity correction is accomplished by two sextupole magnets in each plane (SDY0 and SDY4, SFX0 and SFX4), each pair being connected with a transformation matrix:
| (11) |
The sextupole pairs should reduce nonlinearities for each other in correcting the chromaticity, while also increasing the FF bandwidth or momentum acceptance. The dispersion at the sextupoles is created with several bending magnets and matching quadrupole magnets to make the dispersion (,) zero at the IP and localized in the IR. The layout of the IR is geometrically symmetric and the sign of the bending angle is the same for all bending magnets. These bending magnets help to reduce arc length; 32 PEP-II HER dipoles will be used for both LER and HER IRs. The HER and LER branches have different quadrupole strength requirements; the first quadrupole, QD0, will therefore be split into two pieces so that the LER beam sees just the first segment. Additional sextupoles are also used to correct the third-order chromaticity. These do not reduce the dynamic aperture, since the function at the sextupole magnets is small.
Two identical weak sextupole magnets are interleaved with the main local chromaticity correction sextupoles (with about of their intensities) to improve the behavior of the off-momentum particles, and thereby the momentum acceptance of the rings. In Fig 28 the functions for half the IR and the position of the sextupoles are shown. As can be seen in Fig. 29, they are located at a minimum for on-momentum particles, but off-momentum particles see a maximum .
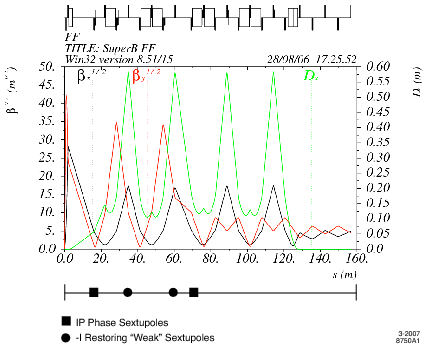
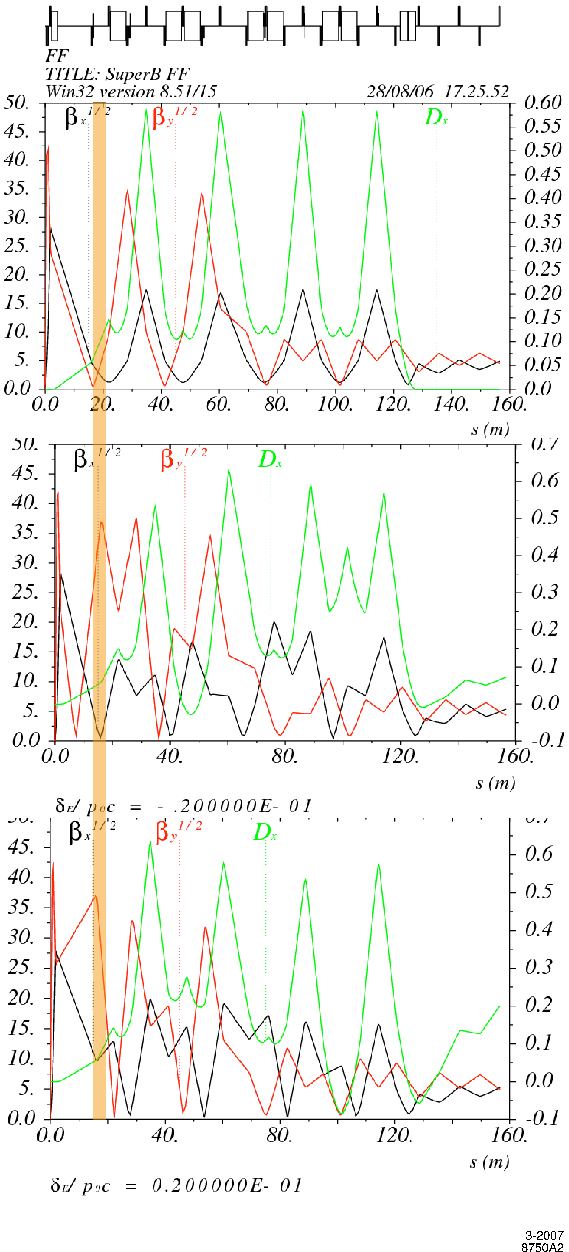
Two weak octupole magnets are used to correct the chromatic effect for the off-momentum particles. There is a emittance growth in the HEB due to the insertion of the FF in the ring, while for the LEB this effect is negligible.
Chromaticity Correction.
Figure 30 shows the betatron phase advance between the end of the IR and the IP, as well as the and function at the IP for the off-momentum particles (bandwidth). In this calculation, half of the lattice in the IR is treated as a transport line. Solid lines show the case in which the octupole magnets are turned off. The dashed lines show the impact of turning on the octupole magnets, which correct the second-order chromaticity. The same distributions for the full HER ring are shown at the bottom.
The betatron tunes for the HEB have been chosen to be in the horizontal and in the vertical plane. The linear chromaticity is adjusted to be close to zero using three families of the sextupoles in the arc section and seven families in the IR. Solid lines (dashed lines) show the case in which the octupole magnets are turned off (turned on). If we increase number of sextupole families in the arc section, we can correct not only the chromaticity for the betatron tunes, but also the Twiss parameters at the IP.
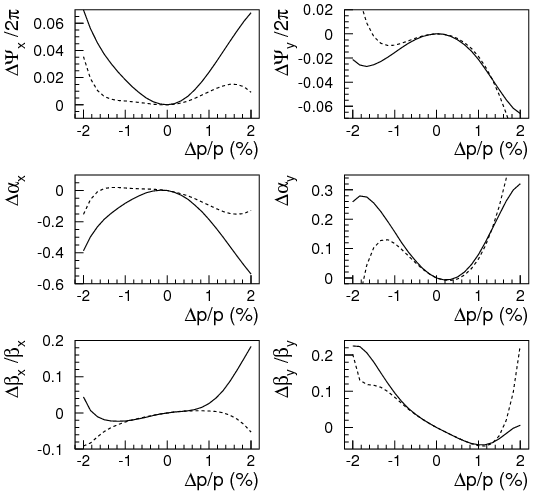
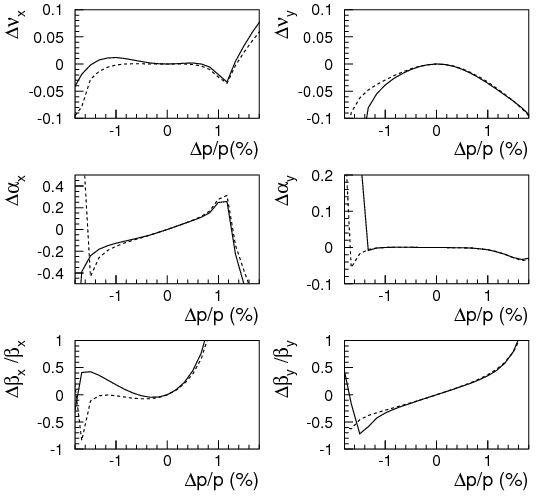
Dynamic Aperture.
The dynamic aperture is commonly defined by requiring stability in one transverse damping time. The transverse damping time of the HER is , which corresponds to 4200 turns. It is difficult to apply either an analytic approach or perturbative methods to this problem, since the sextupole magnets cause strong nonlinearities. Therefore, the dynamic aperture is estimated by numerical tracking simulations. A particle-tracking simulation was performed using SAD [25], an integrated code for optics design, particle tracking, machine tuning, etc., that has been successfully used for years at several machines such as KEKB and KEK–ATF. Six canonical variables, , , , , , and are used to describe the motion of a particle, where and are transverse canonical momenta normalized by the design momentum, , and is the relative momentum deviation from . The injected beam is round in the transverse direction. Coherent oscillations due to injection kickers are assumed to be negligible. Thus, initial conditions , , , and were set to evaluate the acceptance of the injected beam in these sections. Tracking with off-momentum particles, within , was also performed in order to check the momentum aperture. As a criterion for defining stability, we required that the maximum amplitude of the particle orbit be within in the and coordinates during one damping time. The linear chromaticity was adjusted to be nearly zero by optimizing the strength of the sextupole magnets. Synchrotron radiation damping was turned on but quantum excitation was turned off to avoid statistical fluctuations during tracking simulations.
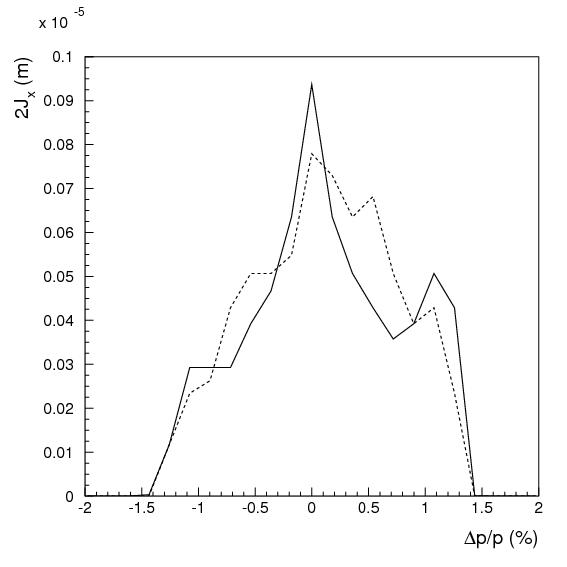
Figure 31 shows the dynamic aperture obtained from the tracking simulations of the HER, assuming the ideal lattice, including nonlinear wigglers. No magnet errors were included in the lattice. The transverse acceptance for the initial condition is given by , where is the Courant-Snyder invariant.
4 Detector Solenoid Compensation
One of the key issues in high luminosity colliders is the control of coupling between horizontal and vertical planes. With the extremely small emittances required in the Super design, the coupling correction is of primary importance. The main source of betatron coupling is the detector solenoidal field. Hence an efficient local correction scheme for the coupling arising from the detector solenoid is mandatory. Other coupling sources, such as quadrupole tilts and sextupoles misalignments, are much smaller, and can be corrected by skew quadrupoles distributed along the ring.
A solenoid rotates the normal transverse modes of the beam by an angle defined by the integral of the longitudinal field component along the beam orbit and inversely proportional to the beam rigidity :
Compensation by two anti-solenoids placed on either side of the detector, with opposite magnetic field to make the total integral of along the beam trajectory vanish, is sufficient only if there are no quadrupoles between the detector and the anti-solenoids. However, to achieve the very small IP beta functions needed for high luminosity, the low- quadrupoles cannot be installed too far from the IP, and correction by two anti-solenoids is no longer sufficient.
At the Frascati Factory DANE a coupling factor as low as has been measured with single beams [27]. The correction scheme implemented at DANE (the so called “Rotating Frame Method”, RFM [28]) is very efficient: at the effect of the KLOE detector solenoid is a rotation of of the normal modes. RFM, based on the general properties of the solenoid matrix, allows the insertion of quadrupoles between the detector solenoid (DS) and the anti-solenoids (AS) without affecting the coupling correction. The principle is very simple: in order to cancel the coupling created by the low- quadrupoles, each quadrupole immersed in the DS magnetic field has to be tilted by the angle defined above, where the integral is performed from the IP to the quadrupole location. The exact application of the RFM implies that each quadrupole be continuously tilted as a helix. This is of course not practical, since, apart from technical difficulties, the rigidity of the scheme would require very strict tolerances on the DS field and beam energy. However it has been proven at DANE that small adjustments of the quadrupole tilts and the AS field allow the measured coupling to be be corrected to a very small value in practice.
A sketch showing how the RFM scheme can be applied for the case where there are quadrupoles inside and outside the DS is shown in Fig. 32, where refers to the rotation angle of the detector solenoid, to the rotation angle of the anti-solenoid, to the rotation angle of the quadrupoles inside the detector and to the rotation angle of the quadrupoles outside the detector before the AS.
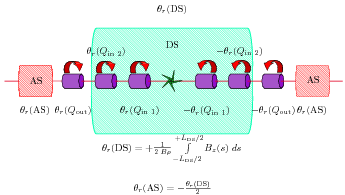
For Super the first defocusing quadrupole will be common to both beams, which means that it will be tilted by an angle averaged over the values needed for each beam. The residual coupling will be compensated by the rotation of the following quadrupoles on the separate lines and of the nearby skew quadrupoles, since we need just four variables to correct the coupling. Table 9 provides a first estimate of the tilt angles required for both beams, with the geometry described in Sec. 3.
| BABAR | Anti | QD0 | QF1L | QD0H | QF1H | |
|---|---|---|---|---|---|---|
| () | Solenoid | centre | centre | centre | centre | |
| LER | ||||||
| HER |
5 Dynamic Aperture
Evaluation of dynamic aperture for the lattice with cells, but without the insertion of the final focus, was first carried out using LEGO [29]. Particles were tracked for 1024 turns with synchrotron oscillations, but no radiation damping or quantum excitation. The dynamic aperture is defined as the boundary between surviving and lost particles. The results of the simulation are shown in Fig. 33 where the lefthand plot is the case of the “ideal” lattice and the righthand plot is the case in which lattice magnetic errors are included. For the ideal lattice, without the insertion of the final focusing optics, the dynamic aperture is (1-rad) and 200 (0.5-rad) in the horizontal and vertical planes respectively. The aperture does not degrade significantly either with off-momentum oscillations up to or with the measured multipole errors in dipole, quadrupole, and sextupole magnets [30]. The magnet errors were based on those observed for the PEP-II ring magnets (see Table 10 for the LER and Table 11 for the HER). They are parameterized in terms of a multipole expansion:
| (12) |
where as the reference radius and is the main field of the magnets.
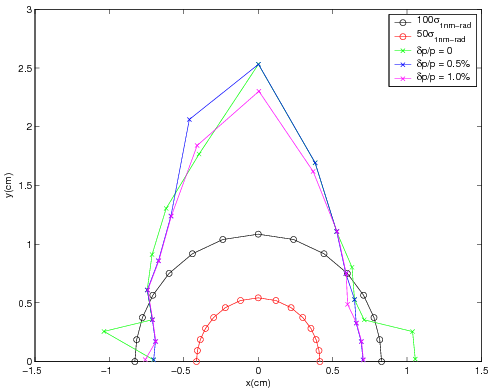
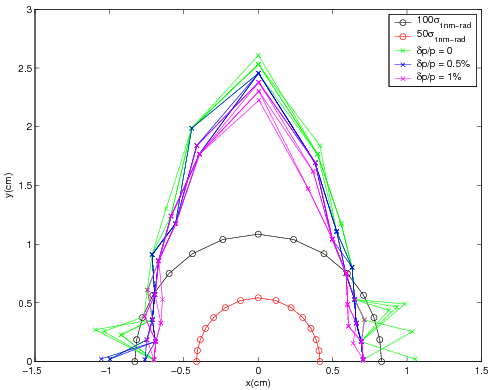
| Multipole index(n) | Systematic: | Random: |
|---|---|---|
| dipole magnet: (r=0.03m) | ||
| 3 | -0.50 x 10⁻⁴ | 1.00 x 10⁻⁴ |
| 5 | 3.00 x 10⁻⁴ | 1.00 x 10⁻⁴ |
| 7 | - | 1.00 x 10⁻⁵ |
| 9 | - | 1.00 x 10⁻⁵ |
| quadrupole: (r=0.05m) | ||
| 3 | 1.02 x 10⁻⁴ | 4.63 x 10⁻⁵ |
| 4 | 1.91 x 10⁻⁴ | 8.09 x 10⁻⁵ |
| 5 | 1.89 x 10⁻⁵ | 8.86 x 10⁻⁶ |
| 6 | 5.69 x 10⁻⁴ | 2.80 x 10⁻⁵ |
| 7 | 6.60 x 10⁻⁶ | 3.45 x 10⁻⁶ |
| 8 | 9.60 x 10⁻⁶ | 5.72 x 10⁻⁶ |
| 9 | 7.14 x 10⁻⁶ | 3.85 x 10⁻⁶ |
| 10 | 3.37 x 10⁻⁴ | 5.62 x 10⁻⁶ |
| 11 | 6.08 x 10⁻⁶ | 3.32 x 10⁻⁶ |
| 12 | 5.34 x 10⁻⁵ | 6.20 x 10⁻⁶ |
| 13 | 1.10 x 10⁻⁵ | 6.53 x 10⁻⁶ |
| 14 | 6.65 x 10⁻⁵ | 8.20 x 10⁻⁶ |
| sextupole: (r=0.05652m) | ||
| 5 | - | 2.20 x 10⁻³ |
| 7 | - | 1.05 x 10⁻³ |
| 9 | -1.45 x 10⁻² | - |
| 15 | -1.30 x 10⁻² | - |
| Multipole index(n) | Systematic: | Random: |
|---|---|---|
| dipole magnet: (r=0.03m) | ||
| 3 | 1.00 x 10⁻⁵ | 3.20 x 10⁻⁵ |
| 4 | - | 3.20 x 10⁻⁵ |
| 5 | - | 6.40 x 10⁻⁵ |
| 6 | - | 8.20 x 10⁻⁵ |
| quadrupole: (r=0.0449m) | ||
| 3 | 1.03 x 10⁻³ | 5.60 x 10⁻⁴ |
| 4 | 5.60 x 10⁻⁴ | 4.50 x 10⁻⁴ |
| 5 | 4.80 x 10⁻⁴ | 1.90 x 10⁻⁴ |
| 6 | 2.37 x 10⁻³ | 1.70 x 10⁻⁴ |
| 10 | -3.10 x 10⁻³ | 1.80 x 10⁻⁴ |
| 14 | -2.63 x 10⁻³ | 7.00 x 10⁻⁵ |
| sextupole: (r=0.05652m) | ||
| 5 | - | 1.70 x 10⁻³ |
| 7 | - | 1.80 x 10⁻³ |
| 9 | -1.45 x 10⁻² | - |
| 15 | -1.30 x 10⁻² | - |
When the final focus is inserted in the lattice, its impact on the dynamic aperture is rather significant, as shown in Fig. 34. Even for the on-momentum particles, the dynamic aperture for the “ideal” lattice is reduced to in both horizontal and vertical planes. For off-momentum particles, the aperture reaches to nearly . From the tracking study, we also found that the paraxial approximation is not accurate enough for the quadrupole magnets in the final focusing system. As a result, we used a better approximation that includes the fourth-order momentum terms in the Hamiltonian [31].
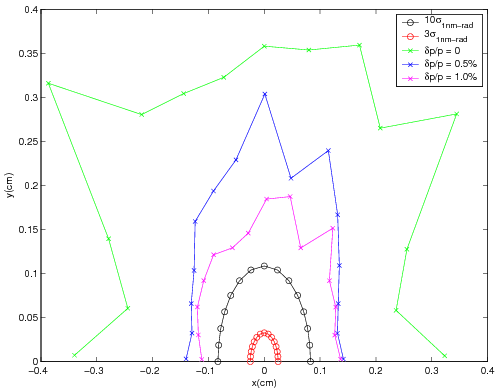
In addition to the study of the “ideal” lattice, we also investigated the effects of magnetic errors on the dynamic aperture for the FF. As shown in the left plot of Fig. 35, the errors in the arcs alone do not significantly reduce the dynamic aperture. However, including the multipole errors in the FF section (right plot), further reduces the dynamic aperture to 16 and 10 for on and off momentum particles respectively.
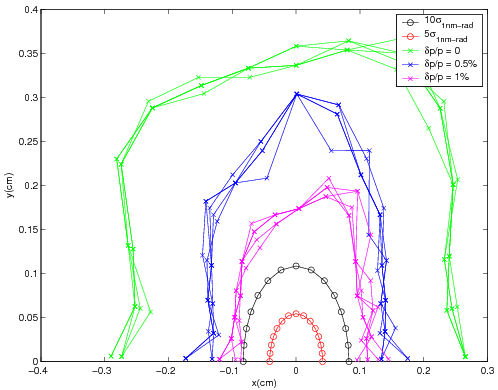
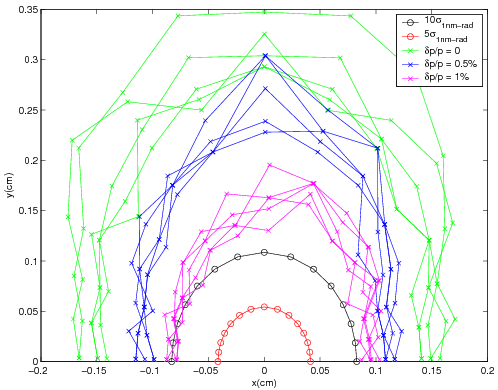
A sixth-order Taylor map is extracted by tracking of truncated power series through the lattice. The map is then canonically transformed into the standard normal form, from which we can extract information about tune dependencies on the amplitudes of the particles as well as the high-order chromaticities. The result of the normal-form analysis is shown in Table 12. It can easily be seen that some amplitude dependent terms are rather large, for instance the crossing terms between the horizontal and vertical planes. These large terms are largely a result of the interference among the non-interlaced sextupoles and may well be the reason behind the small dynamic aperture.
| index | ||||
|---|---|---|---|---|
| 0 | 0 | 0 | 0.57892 | 0.60492 |
| 0 | 0 | 1 | -0.14E-2 | 0.56E-1 |
| 1 | 0 | 0 | -2347 | -55553 |
| 0 | 1 | 0 | -55553 | -533217 |
| 0 | 0 | 2 | -172 | -69 |
| 1 | 0 | 1 | -583538 | -15155279 |
| 0 | 1 | 1 | -15155279 | -12292257 |
| 0 | 0 | 3 | 3156 | -2753 |
For the ideal Super lattice, including a strong focusing section, we have carefully studied the validity of the paraxial approximation:
| (13) |
As can be seen in Fig. 36, we find that the dynamic aperture obtained using the paraxial approximation (left) is artificially small compared to that obtained with the exact Hamiltonian (right). The study was carried out by globally substituting the integrating Hamiltonian for all elements including the quadrupoles. We also find that the reduction in dynamic aperture could be mostly restored by adding the fourth-order term into the paraxial approximation as previously seen in Fig. 34. Clearly, the difference between Fig. 34 and Fig. 35 is rather small.
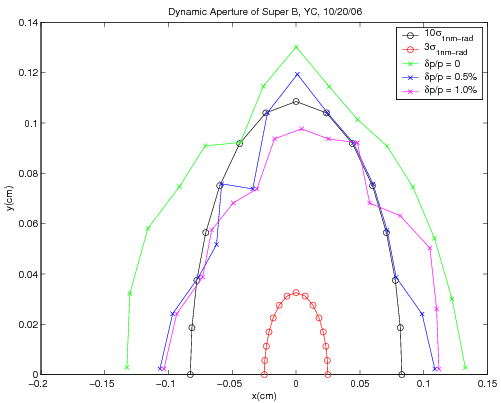
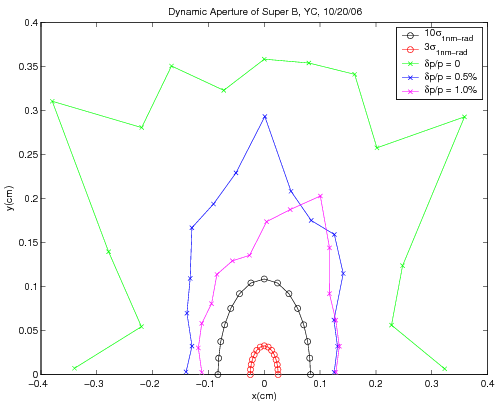
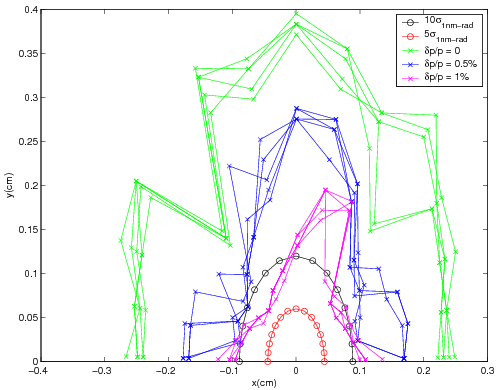
Simulations have also been performed for the LER, with similar results to those for the HER. In particular, the dynamic aperture for the design lattice with all the multipole errors is shown in Fig. 37. We conclude that the dynamic aperture for the LER is just slightly smaller than that for the HER (Fig. 35).
The crab waist correction of the beam crossing angle at the IP requires the use of sextupole magnets. Since these sextupoles are near the IP, they can have a side effect of reducing the dynamic aperture for the rings because of their high gradients and nonlinearity. The dynamic aperture calculations discussed above have been performed without crab sextupoles in the final focus lattice. A study of the final focus design that minimizing these effects is ongoing; preliminary results suggest a reduction of dynamic aperture by less than a factor of two. Further work on the optimization of locations and phase advacnes for the crab sextupoles will be needed, together with optimization of the working point for the rings. It should be noted that tune scans from beam-beam simulations without crab sextupoles show that the baseline luminosity of is still achievable. However, the working point in tune space must be chosen closer to the half-integer and the beam footprint is reduced, leaving less freedom to change the working point.
Based on our simulation results, it is quite clear that the dynamic aperture is limited by the final focusing system in the Super lattices. Although the dynamic aperture is small, it is more than adequate for the stored beam, which is extremely small. The acceptance for a larger injected beam remains a problem to be studied. We may need to optimize further the locations of octupole magnets insert more higher-order multipole correctors near the final focusing quadrupoles, or simply scan the betatron tunes to find a better operating point.
5 Imperfections and Errors
1 Tolerances, Vibrations and Stability
The movement of elements in the magnetic lattice of the Super accelerator will affect the equilibrium emittance of the beam. The horizontal emittance, and particularly the vertical emittance, are quite small and will require special care to achieve. We will first discuss errors in the rings outside the interaction region. The roll stability of quadrupole magnets, and the horizontal and vertical offset stability of the quadrupole magnets, are the most important sources of errors. There are several recent studies for the next generation low-emittance storage rings that have looked extensively at this stability issue. PETRA-III, NSLS-II, and the ILC Damping Rings all have lattice specifications that are similar to the arc and straight section magnets for Super. The design reports of these accelerators discuss these tolerances [32]. The total effect is estimated by including magnet errors around the complete ring with the appropriate betatron and phase weighting. The amplitude of fast magnet motion due to normal ground motion has only a small impact on the emittance. However, slow magnet motion can lead to an increased emmittance. according to “” models, which incorporate temporal and spatial correlations in reasonable agreement with observations. In the model, , where is the transverse offset, is a constant about /m/s, is the time and is the separation distance between points of interest, for example two adjacent quadrupoles. As a result, orbital steering corrections at the 5–10 level are required over timesclaes of a few minutes in order to keep the vertical emittance within specifications. BPM resolutions of order 1 are also needed. These studies show that in order to be acceptable, ring quadrupoles must have three-sigma truncated rms misalignments of 100 and rms rolls of 100radians. These alignment tolerances are possible but challenging.
The final quadrupole doublets adjacent to the IP have strong fields and the beams have large beta functions. Vibration tolerances for these magnets are especially tight. Typically, there is a one-to-one correspondence between the size and direction of vertical motion by final doublet quadrupole magnets and motion of the beam at the IP. The vertical beam size at the IR is 20–35. Since we need keep the beam in collision with tolerances at the 0.1 sigma level or less, quadrupole magnets must be be kept stable to 2–4. The vibration of large objects such as quadrupoles depends on the design of the mechanical supports and the local ground excitation. Typical motion is about 50 in the 50 range. Since there are only a few of these magnets, active vibration controls in the mechanical supports can be employed to bring vibrations within specification. An active vibration suppression by a factor of 10–20 is within industry standards.
The bunches will collide in Super at 476. To maintain luminosity, it is important to keep the bunches transversely centered on one another. Feedback systems using the position monitors and the luminosity signal will be required. Arc BPMs, with resolutions of about 1, can be used to bring the beams close to collision. In the IP region, specially constructed BPMs with resolutions of 0.5 will be needed. The position monitors in the interaction region quadrupoles are located in a very high beta region, which also increases their sensitivity. These BPMs will be used to bring the beams very close to collision. A 476 luminosity signal can be extracted from beamstrahlung under these conditions. Very rapid horizontal and vertical position feedback systems based on this signal will keep the beams in collision. PEP-II and KEKB both already use such a fast luminosity feedback very effectively to keep the beams in collision.
2 Coupling and Dispersion Tuning for Low Vertical Emittance Rings
A variety of collective effects can increase the vertical beam emittance at high currents; however, in the low-current limit, which we consider in this section, three effects dominate contributions to the vertical emittance. The non-zero vertical opening angle of the synchrotron radiation in dipole magnetic fields excites vertical betatron motion of particles as they “recoil” from photon emission. Vertical dispersion from steering errors generates vertical emittance, in the same way that horizontal dispersion from the bending magnets determines the horizontal emittance of the beam. Betatron coupling from skew quadrupole errors leads to a transfer of horizontal betatron motion (and hence horizontal emittance) into the vertical plane. The first of these effects, the non-zero vertical opening angle of the synchrotron radiation, places a fundamental lower limit on the vertical emittance that can be achieved in any storage ring; this can be calculated for a given lattice design. In most rings, including the Super rings, the lower limit is a fraction of a picometer, and is significantly smaller than the specified vertical emittance. The effects of vertical dispersion and betatron coupling, which arise from magnet alignment and field errors, invariably dominate the vertical emittance in an operating storage ring; reducing the vertical emittance in the Super rings to the value required to achieve the specified luminosity will require highly precise initial alignment of the machine, followed by careful tuning and error correction.
The lowest vertical emittance achieved in an operating storage ring is in the KEK Accelerator Test Facility (ATF) [33]; the Super rings are specified to operate at in the first stage, so the alignment and tuning issues require some attention. We note however that the Damping Rings for the ILC are specified to operate at , and that significant effort has already been devoted to understanding the alignment and tuning requirements in these systems [34]. While an experimental demonstration is still required, theoretical and simulation studies suggest that vertical emittance is a realistic goal for the ILC damping rings. The question we then must consider is how the likely difficulty of achieving in the Super rings (and the more stringent constrint for the Super upgrade) compares with the difficulty of achieving in the ILC damping rings.
Broadly speaking, we may characterize the behavior of the vertical emittance in a given lattice by calculating the vertical emittance generated by a variety of magnet alignment errors. The principal errors to consider, in this context, are vertical sextupole misalignments and rotations or tilts of quadrupoles around the beam axis, both of which generate unwanted skew quadrupole components. Also relevant is the closed orbit distortion generated by vertical misalignments of the quadrupoles, which results in vertical beam offsets in the sextupoles with the same consequences as vertical misalignments of the sextupoles themselves. Estimates of the sensitivity of a lattice to these errors can be made using analytical formulae [34] involving the magnet strengths and lattice functions; it is usually found that simulations support the results of these analytical calculations.
Table 13 shows the results of analytical estimates of the sensitivity of the Super rings to various alignment errors, compared to the ATF and the baseline design for the ILC damping rings. We emphasize that the results given in Table 13 are statistical, in that they represent the mean over many different sets of random errors: the spread in the response of a lattice to a given set of alignment errors is large, usually of the mean.
| Super | Super | ILC | KEK | |
|---|---|---|---|---|
| LER | HER | DRs | ATF | |
| Vertical emittance (pm) | 4 | 4 | 2 | 4.5 |
| Orbit amplification factor | 46 | 44 | 32 | 21 |
| Quadrupole jitter sensitivity (nm) | 209 | 217 | 221 | 227 |
| Sextupole alignment sensitivity (m) | 95 | 87 | 70 | 50 |
| Quadrupole tilt sensitivity (rad) | 166 | 183 | 79 | 800 |
The sensitivity indicators given in Table 13 should be interpreted as follows:
-
•
The orbit amplification factor is the mean rms vertical orbit distortion divided by the rms vertical quadrupole misalignment;
-
•
The quadrupole jitter sensitivity is the mean rms quadrupole misalignment required to generate an rms closed orbit distortion equal to the vertical beam size at the specified vertical emittance;
-
•
The sextupole alignment sensitivity is the mean rms sextupole vertical misalignment required, in an otherwise perfect lattice, to generate the specified vertical emittance; and
-
•
The quadrupole tilt sensitivity is the mean rms quadrupole tilt error required, in an otherwise perfect lattice, to generate the specified vertical emittance. Smaller values therefore indicate a greater sensitivity to quadrupole tilts, and larger values are more desirable.
It is important to note that these sensitivity indicators should not be taken as alignment tolerances: they simply indicate the mean response of the beam to errors of a given magnitude. Generally, alignment of the magnets will be significantly worse than the indicated sensitivities, but coupling correction and tuning techniques can then be used to achieve the specified vertical emittance. The sensitivity values that we calculate may be taken to indicate the difficulty of implementing the tuning successfully, and the frequency with which tuning might be required to maintain the specified emittance.
With the exception of the quadrupole tilts, the values given in Table 13 indicate that tuning Super to achieve and in the upgrade stage should not be significantly more difficult than tuning ATF to achieve the already-demonstrated emittance of , or tuning the ILC damping rings to achieve the specified vertical emittance. However, it is important to note that for Super, the strong sextupoles and quadrupoles in the final focus region were omitted from the calculations: the beam orbit and emittance tend to be particularly sensitive to motion of these elements, which will therefore need special consideration.
Finally, we comment that a range of tuning techniques and algorithms have been tested in simulation and experiment on the ATF and on other electron storage rings, including those in colliders and third-generation synchrotron light sources. One procedure applied to the ATF is described in the references [33, 34, 35]; studies to determine an optimum tuning procedure for storage rings required to operate routinely with emittance of around are in progress [36]. For Super, it is expected that further development of the lattices could reduce the sensitivity to alignment errors. Detailed studies, including simulations, are needed to characterize fully the sensitivities and determine specifications for the magnet support scheme, survey and alignment tolerances, and diagnostics and instrumentation performance.
3 Final Focus Tuning
The final focus “tuning knobs” are adjustments of magnet field and alignment to compensate the linear and non-linear beam aberrations and beam size growth at the IP caused by “slow” field or tilt errors in the FF quadrupoles. Sextupoles, octupoles and decapoles can be used in the tuning knobs. Alternatively, the normal and skew quadrupole correcting coils can be considered, which have the advantage of not creating second-order orbit distortions. This method has been studied for the FF systems of the NLC, ILC, ATF2 (see for example ref. [37]) since all these machines employ the same design principles. A short summary is provided here.
Very large peaks produce a characteristic -to-IP phase advance at most of the FF magnets (see Fig. 38). This phase advance reduces the number of efficient tuning knobs, but also helps in correcting the FF errors, since the FF correctors are effectively at the same phase as the FF errors. However, this assumes that the out-of- phase aberrations propagating to the IP from the upstream optics can be corrected prior to the FF.
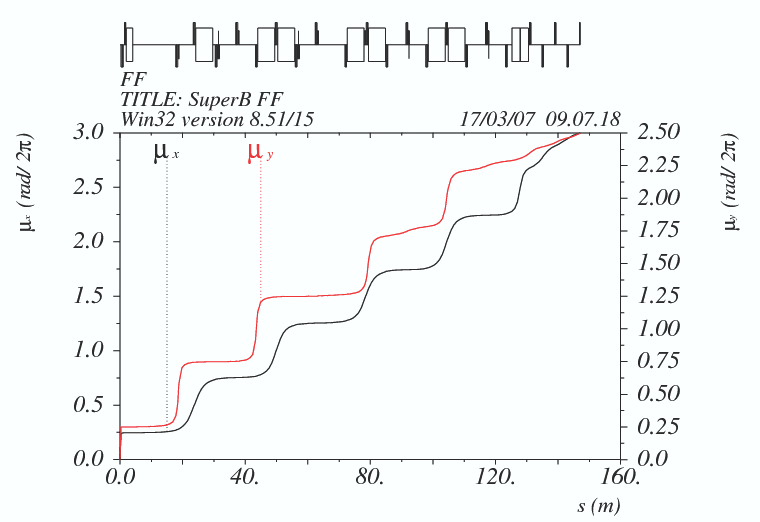
A number of linear and non-linear tuning knobs can be implemented. Examples of orthogonal linear knobs are:
-
•
Horizontal offset in a sextupole to correct the horizontal dispersion at IP and the longitudinal offset of , waists (3 knobs); and
-
•
Vertical offset in a sextupole to correct the vertical IP dispersion and the dominant coupling term () at the IP (2 knobs).
Adjustment of field and tilt angles of the FF sextupoles can be used to correct second-order optical aberrations at the IP, which is needed as well. Additionally, adjustment of the octupole and decapole fields can be used for the third- and fourth-order corrections. These magnets create many high-order terms; “absolute” orthogonality between different terms is therefore typically not possible to achieve using a limited number of correctors. Hence the goal is to create approximately orthogonal knobs that excite one dominant term per knob, while keeping the other terms small. The sextupole knobs can be calculated with second-order matrix optimization using MAD code [38]. A simple octupole knob can correct the octupole field error, and two decapole knobs can correct the decapole field error and the field difference between the two decapoles. The fixed phase to the IP limits the number of matrix terms (knobs) which can be created. To improve the orthogonality of knobs based on sextupole fields, sextupoles can also be added to the lattice. The effect of the knob is equivalent to exciting the corresponding matrix term at the IP, for example:
| (14) | ||||
| (15) | ||||
| (16) | ||||
| (17) |
The actual effect of a matrix term depends, of course, on the IP beam parameters.
The effectiveness of these knobs depends on the set of the random machine errors, which cause the IP aberrations. Tracking of many sets of errors would show which aberrations are the largest at the IP, and therefore which correcting knobs are most important. An example of the iterative procedure for FF tuning can be found in ref. [37]. An ideal initial beam distribution is first generated with a large number of particles, and tracking is done without magnet errors, thereby characterizing the ideal beam at the IP. Random field and alignment errors are then assigned to magnets and BPMs, and tracking with the errors before any correction and measurement of the beam at IP is performed. The initial orbit is corrected using the corrector quadrupole , offsets, and the a response matrix between the correctors and BPMs, and tracking performed again. The IP tuning correction obtained by applying the tuning knobs one-by-one with the orbit correction after each knob is determined, followed by tracking and measuring again. In the tuning loop, the linear knobs are applied first, then the second-order vertical and horizontal knobs. Finally, octupole and decapole knobs can be applied. This procedure can be iterated as needed, and various combinations of rms errors must be studied. An example of the efficiency of this method for the NLC final focus tuning simulation is shown in Fig. 39.
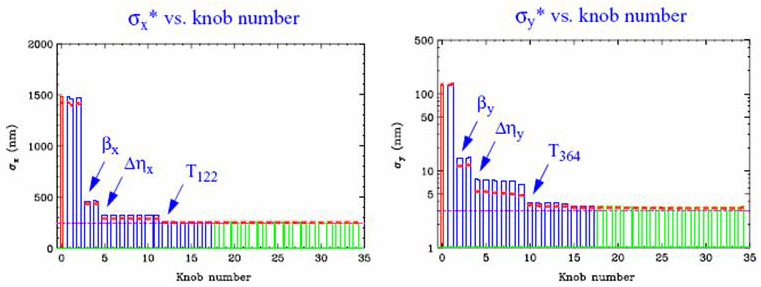
A beam-based alignment (BBA) procedure is required to minimize misalignments and improve the effectiveness of the tuning. The orbit correction in the simulation may need improvement. Tracking with various levels of misalignment will demonstrate the level of residual alignment error required for good tuning.
6 Intensity Dependent Effects
1 Beam-Beam Interactions
Beam-beam interactions are the most important limitation to luminosity performance. They depend on a number of different beam parameters and running conditions; their impact on collider performance can only be calculated using computer simulations, which are also used to choose optimum operating conditions.
Beam-beam simulations for Super started with a beam parameters set similar to that of the ILC Damping Rings (see Table 14). The simulations have been carried out with two weak-strong codes, BBC [39] and LIFETRAC [40], that have been successfully used for beam-beam collision studies for the KEK -Factory [41] and DANE [42]. In the following we will summarize the steps that, starting from a very different parameter set, have led to the final choices.
| Parameter | Early ILC-like | Super |
| Horizontal emittance (nm-rad) | 0.8 | 1.6 |
| Vertical emittance (pm-rad) | 2 | 4 |
| IP horizontal (mm) | 9 | 20 |
| IP vertical (mm) | 0.08 | 0.30 |
| Horizontal beam size (m) | 2.67 | 5.66 |
| Vertical beam size (nm) | 12.6 | 35 |
| Bunch length (mm) | 6 | 6 |
| Momentum spread ( | 10 | 8.4 (9.0) |
| Crossing angle (mrad) | ||
| No. particles/bunch () | 2.5 | 6.2 (3.5) |
| No. bunches | 6000 | 1733 |
| Circumference (m) | 3000 | 2250 |
| Longitudinal damping time (ms) | 10 | 16 |
| RF frequency (MHz) | 600 | 476 |
Results from simulations with these parameters are summarized in Fig. 40, where the luminosity (a) and the blowups of vertical emittance (b), horizontal emittance (c) and longitudinal emittance (d) are shown as a function of the number of particles per bunch. The luminosity has been calculated assuming 6000 colliding bunches. As can be seen, the luminosity grows quadratically with the bunch current, exceeding a luminosity of with no blowup for single bunch populations up to . This is possible due to the crabbed waist scheme, which allows for a decrease in the vertical beta function at the IP and an increase in the vertical tune shift by a factor of 2–3 with respect to that seen in ordinary head-on collisions.
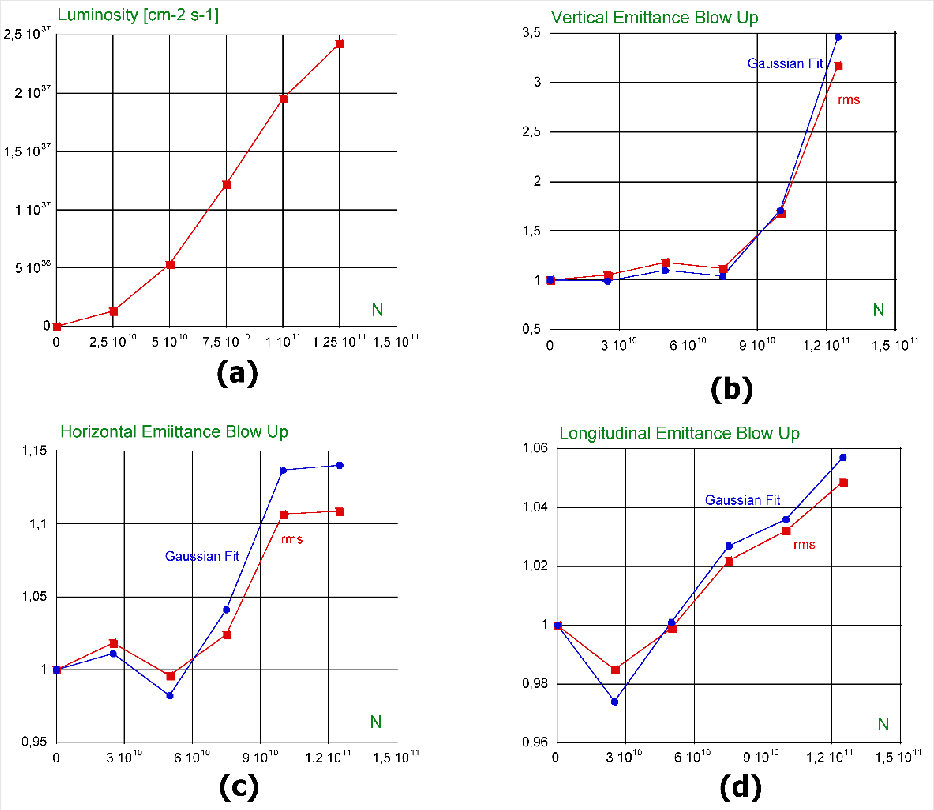
The design luminosity of is achieved with only 2– particles per bunch. This corresponds to an average beam current of , which is a value close to the best results obtained so far at particle factories. We consider particles/bunch to be a conservative choice for the nominal design value. According to numerical simulations, the design beam-beam tune shift is well below the maximum achievable value. We have used this safety margin to significantly relax and optimize many critical parameters, including damping time, crossing angle, number of bunches, bunch length, bunch current, emittances, beta functions and coupling, while maintaining a design luminosity of . We should stress that the condition imposed by the crabbed waist scheme has been always satisfied during the optimization process.
In order to explain our optimization strategy we first discuss how beam-beam interactions are affected by the different parameters.
Damping time.
Damping time and quantum noise fluctuations play important roles in beam dynamics. They affect the instability thresholds for high current operations and the maximum achievable beam-beam tune shift parameter, the resulting luminosity and beam lifetime. In the Super rings, the damping time is shortened by means of wiggler magnets. Since the wigglers are a non-negligible contribution to the overall machine cost, we have investigated with numerical simulations the degree to which an increase in the damping time via a reduction in the number of wigglers affects the luminosity and beam-beam induced tails. Figure 41 shows the beam-beam non-gaussian tails in the space of normalized betatron amplitudes for three values of the damping time: , and (columns 1, 2 and 3, respectively). The simulations have been carried out for (upper plots) and (lower plots) particles/bunch. As can be seen, a damping time increase by a factor of 2.5 does not lead to any substantial luminosity degradation. However, in order to be conservative, we have chosen a longitudinal damping time of , similar to that for the PEP-II -Factory.
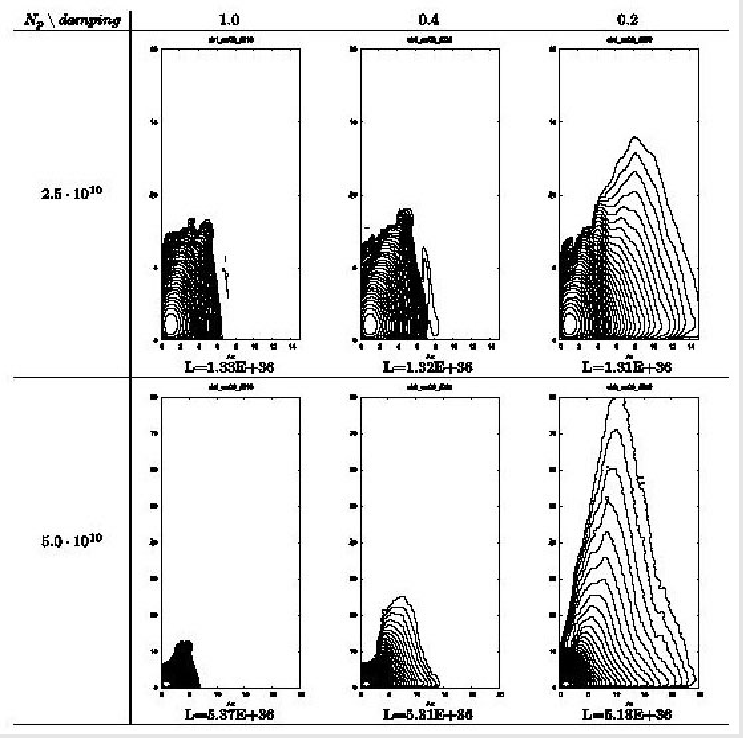
Crossing angle and vertical beta function.
Having designed a safety margin in the vertical tune shift, it is possible to increase the function at the IP. This makes the IR design easier, by reducing the collider chromaticity and simplifying the dynamic aperture optimization. However, the crossing angle must be proportionally reduced in order to keep the function comparable to the overlap area of the colliding bunches: clearly an optimum should exist. The tune shift and the luminosity grow with increasing and decreasing horizontal crossing angle . However, at some point, the tune shift reaches its limit, and beam blowup and tail growth occur. In the opposite direction, with lower and higher , the luminosity drops due to geometric factors, without beam blowup. Such a situation can be seen in Fig. 42 where contour plots are shown as a function of the crossing angle and , respectively. The optimum is at about and . Due to IR design requirements, the final value of the crossing angle has been chosen to be only slightly different, . Nevertheless, the function can be further increased, at the expense of a slight luminosity reduction. Indeed, as can be seen in Fig. 43, an increase from 133 to for would lead to just a 10% luminosity reduction.
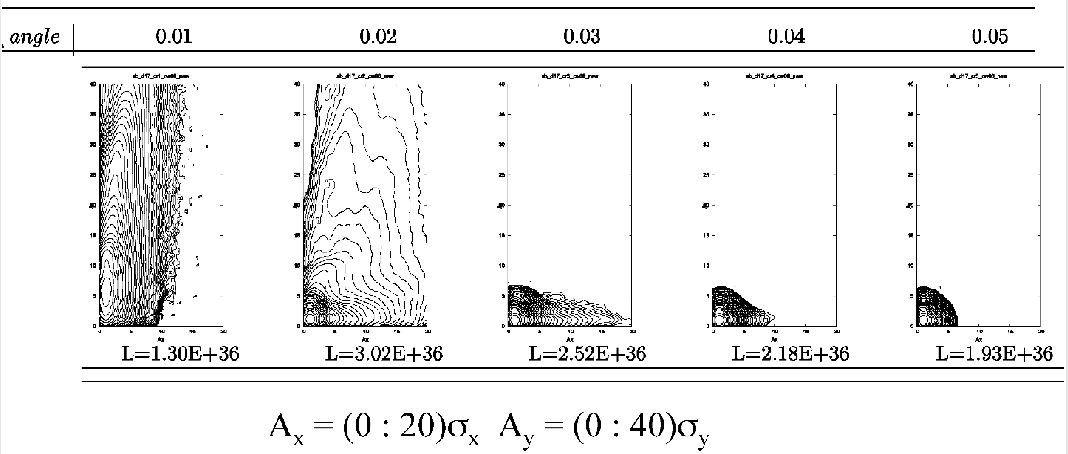
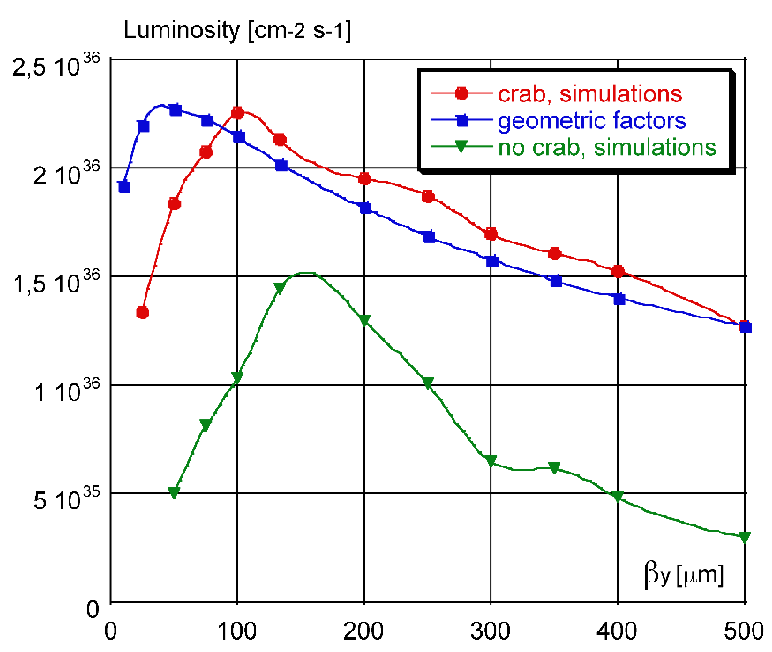
Betatron coupling.
Betatron coupling can also be relaxed. This can be very important at the initial stage of the collider operation. If we assume that we can relax the coupling factor, by as much as a factor of four, for example, then the luminosity can be recovered by using half as many bunches with twice the single bunch charge. In this case, the beam current will remain the same and we can obtain the design luminosity by exploiting the fact that the luminosity grows quadratically with the bunch intensity before the tune shift limit is reached. The beam tails are also limited, as can be seen in Fig. 44 (top plot).
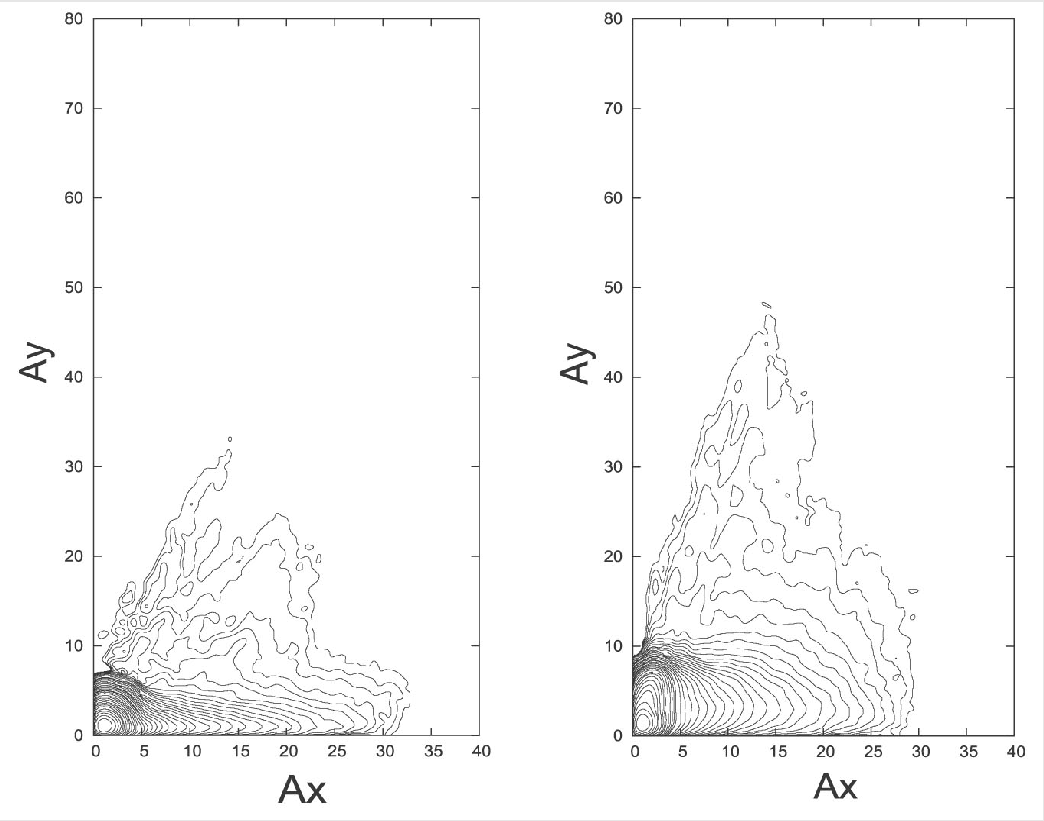
Emittances.
The same strategy can be used for the emittances. By doubling the bunch intensity and reducing the number of bunches by a factor of two, the same luminosity can be obtained with emittances two-times higher and a function increased by a factor of . As shown in Fig. 44 (bottom plot) the bunch tails are limited in this scenario as well.
After several iterations, beam parameters for the “baseline” and “upgrade” stages have been chosen that give a luminosity of and respectively. The corresponding parameter sets can be found in Table 1. Figure 45 shows bunch distribution contour plots for the baseline and upgrade parameters for different strengths of the crabbing sextupoles. Based on simulations, no lifetime problems due to electromagnetic beam-beam interaction are expected for the two design sets. The maximum luminosity and shortest tails are provided by operating the sextupoles at 80% of their nominal crabbing strength.
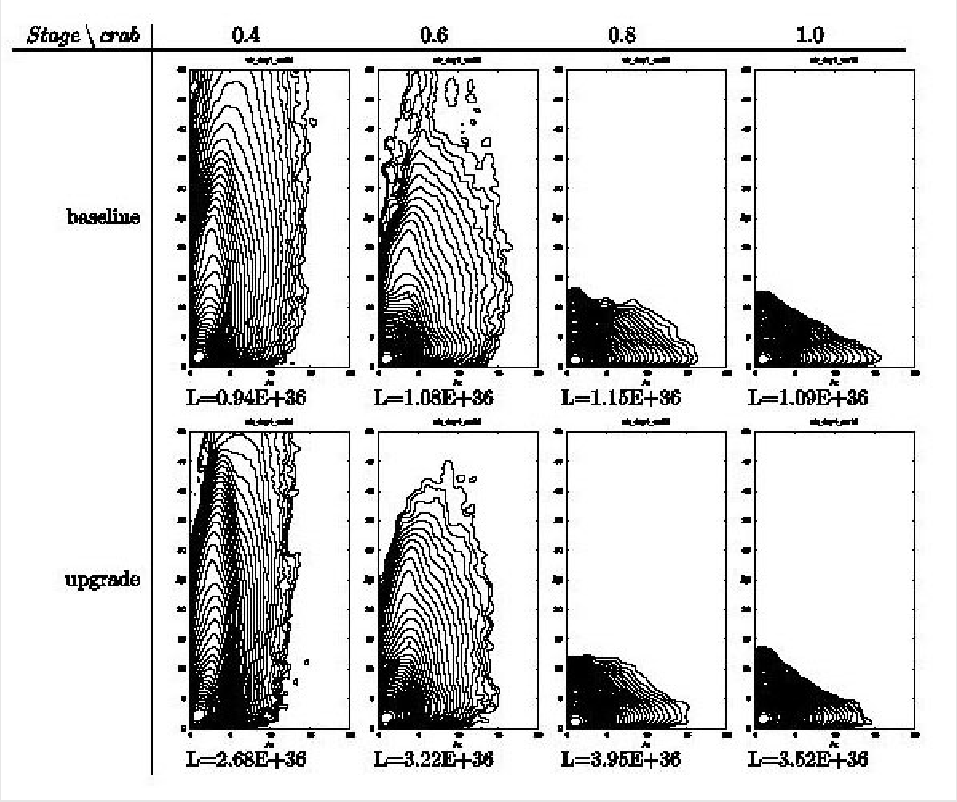
All the simulations have been performed for one of the best working points. In order to define how large the “safe” tune area is, a luminosity tune scan has been performed for tunes above the half integer, which is typical for the operating -Factories. The 2D and 3D surface plots for the scans are shown in Fig. 46, where red corresponds to the highest luminosity, and blue the lowest. Individual contours differ by a 10% in luminosity. The maximum luminosity found inside the scanned area is , while . We conclude that the design luminosity can be achieved over a wide tune area. However, for the final choice of the operational working point, one also needs to take into account the main coupling resonance (dashed line), which can affect the luminosity performance; the working point should be chosen quite far from this resonance.
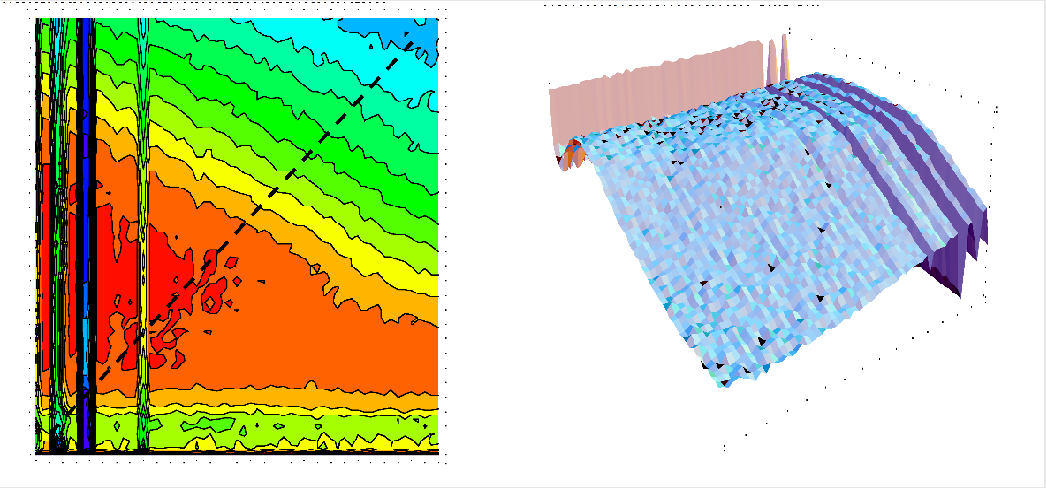
2 Lifetimes and Backgrounds
Luminosity lifetime
An important contribution to beam lifetime is the loss of particles due to scattering at the interaction point at a rate proportional to the machine luminosity.
In the following, we consider the loss of particles due to QED processes (radiative Bhabha) and (elastic Bhabha) that scatter beam particles outside the ring acceptance. The loss rate for the ring depends on luminosity and on cross section according to
Assuming constant, the following approximation holds:
where is the mean number of particles in the ring and is the time elapsed since injection. The beam luminosity lifetime quoted in Table 1 is defined as:
An excellent approximation for the cross section to lose a particle from beam due to radiative Bhabha process is [43]:
| (18) |
where is the minimum energy of a radiated photon that cause the loss of a particle from beam ; thus can be taken as the fractional energy aperture for the ring . Note that this expression depends only logarithmically on the energy acceptance of the ring.
Actual measurements of this cross section [45] find a value smaller than the prediction; this reduction can be ascribed to the effect of finite bunch density. To correctly model this effect, the BBBrem Monte Carlo generator [44] was used. The predicted cross section as a function of the energy acceptance is shown in Fig. 47 together with the best fitting function:
The cross section predicted by BBBrem for a ring energy acceptance of 1% is , corresponding to a beam lifetime of for the LER and for the HER. This is to be compared to values of , and respectively that would be obtained with Eq. 18.
Another loss mechanism, typically not as important as the bremsstrahlung contribution considered so far, is the loss of particles due to elastic Bhabha () scattering at sufficiently large angles to escape the acceptance of the ring. A tree-level approximate formula for this cross section to lose a particle from the beam is:
where is the minimum horizontal/vertical scattering angle in the laboratory frame leading to particle loss. The particle loss cross sections are for the HER and for the LER under the usual assumption of a 10 limiting aperture, calculated using the uncoupled horizontal and the fully coupled vertical beam sizes.
The total particle cross sections and lifetime for these processes are shown in Table 15.
| LER | HER | ||
|---|---|---|---|
| 170 | 170 | ||
| 3 | 9 | ||
| 173 | 179 | ||
| Lifetime | 10.3 | 5.7 |
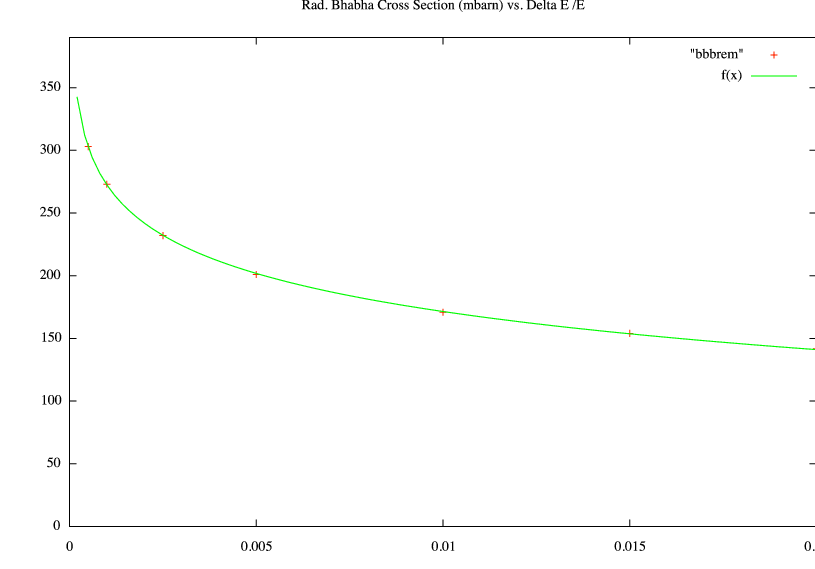
Touschek lifetime
The Touschek beam lifetime in Super is expected to be small, particularly for the LER, because of the extremely small beam emittance. In order to estimate the Touschek beam lifetime we use the formula for the particle loss per unit time given by Le Duff [48]:
| (19) |
where is the momentum acceptance the beam size in the three planes, is the Lorentz factor, and
| (20) |
For the function , we employ Bruck’s approximation [47], valid for :
| (21) |
The total machine acceptance in is the lesser of the RF acceptance and the lattice acceptance,
| (22) |
This approach was used successfully to describe experimental data from the PEP-II LER [46].
The RF acceptance in turn is given by:
| (23) |
The RF acceptance for Super is quite large, about 2.5% ; however, it would difficult to maintain such an acceptance with the chosen lattice designs. We will therefore assume a reasonable value of 1% for the acceptance due to this limitation. The Super parameters relevant for Touschek beam lifetime are summarized in Table 16.
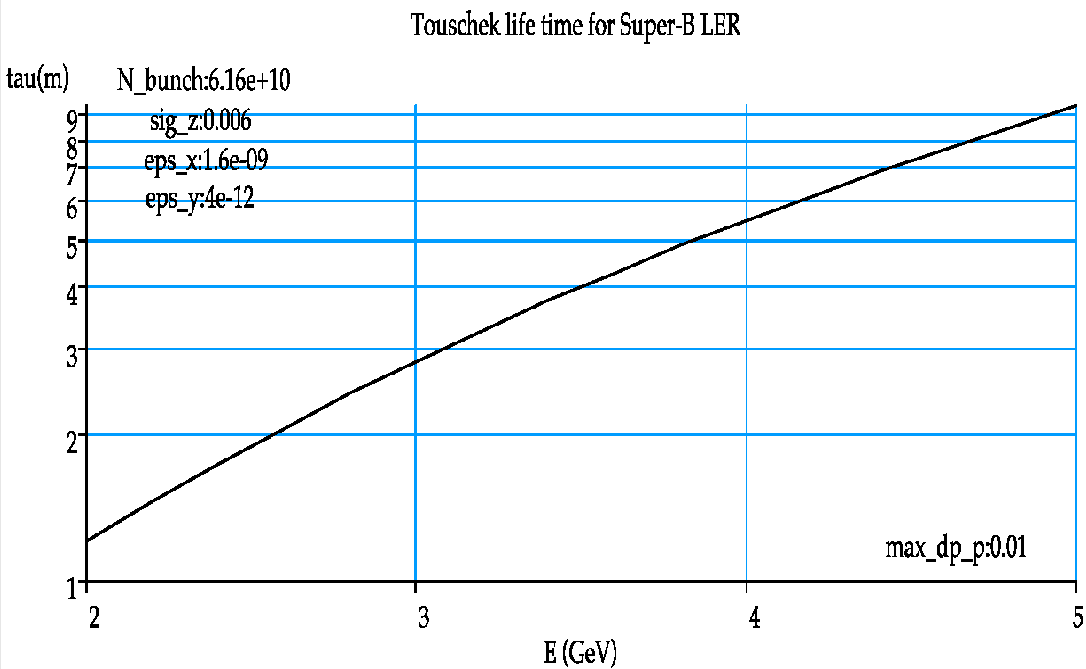
| HER | LER | |
| Beam Energy (GeV) | 7 | 4 |
| Bunch length (mm) | 6 | 6 |
| Energy spread (%) | 0.1 | 0.1 |
| Horizontal emittance (nm) | 1.6 | 1.6 |
| Vertical emittance (pm) | 4 | 4 |
| Energy acceptance (% ) | 1 | 1 |
| avgerage (m) | 10 | 10 |
| avgerage (m) | 22 | 22 |
| Particles/bunch |
In Fig. 48, we show the Touschek beam lifetime for the LER as a function of beam energy. At 4, it is slightly above . The penalty paid in terms of beam lifetime for an increased energy asymmetry is evident. For the Super HER, the corresponding result is shown in Fig. 49. Beam lifetime is close to at 7. In collision, however, since the luminosity beam lifetime will be much lower for the HER than the LER, due to the smaller number of particles present in an HER bunch, the actual beam lifetimes are expected to be similar; a few minutes for each ring.
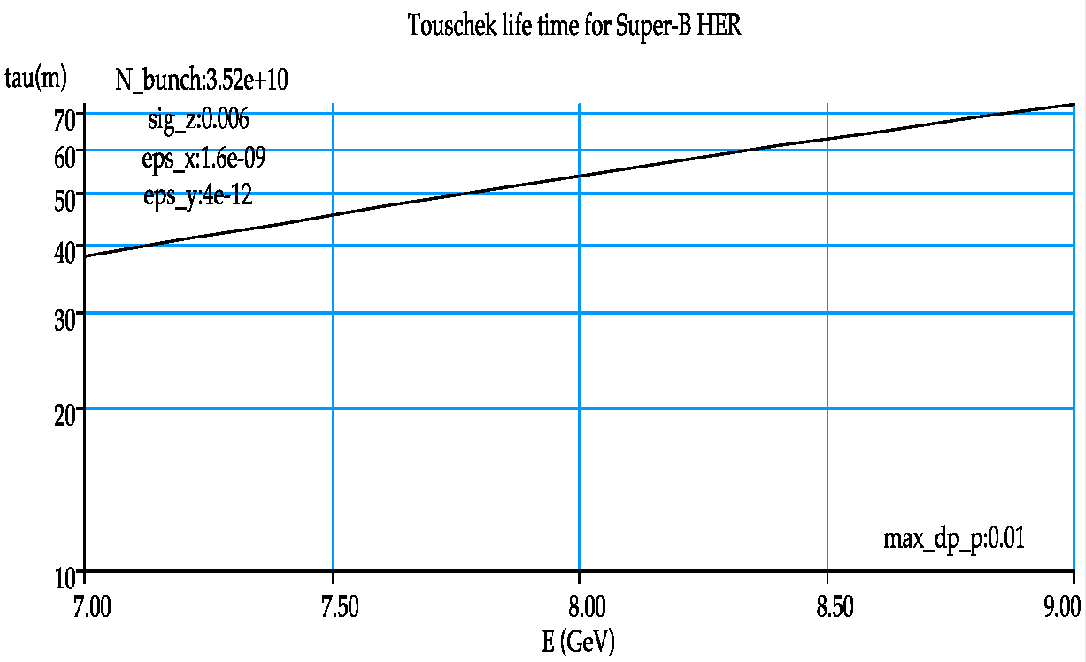
In Table 17 we summarize the Touschek beam lifetimes for both rings at their design energy, for both the nominal and the upgrade parameter set for Super.
| Parameter set | Luminosity | Lifetime HEB | Lifetime LEB |
|---|---|---|---|
| (m-2s-1) | (min) | (min) | |
| Nominal | 38 | 5.5 | |
| Upgrade | 19 | 3 |
Touschek backgrounds
Simulation studies of background from Touschek scattering [49] have been performed for the LER, using a program developed for DANE ; preliminary results are presented here. The reliability of the calculation has been tested with KLOE data, showing good agreement [50, 51]. Further checks for the Super LER case are under way. Touschek scattering is a source of background due to the off-energy particles arising from the elastic scattering of particles within a bunch. Such scattering results in two particles with energy errors and that follow betatron trajectories around the off-energy closed orbit. In the simulation Touschek particles are taken within one transversely Gaussian bunch with the proper energy. Particles are tracked over many turns or until they are lost. In this way, an estimate is obtained for the Touschek losses around the entire ring and for the IR alone. Essentially all losses at the IR arise from particles that are Touschek scattered in dispersive regions. Touschek-scattered particles have a betatron oscillation proportional to the dispersion , to the invariant and to the momentum spread :
The parameter is defined by the following relation:
Given an energy spectrum , one can either throw the single scattered particle energy shift accordingly or use a uniform distribution and weight particles contributions with . We use the latter approach, which allows us to cope with the tails of both the Touschek probability density function and the probability of beam loss vs. energy deviation. For a lower energy shift, the Touschek scattering probability increases while the probability of loss decreases and vice versa. The Touschek density function is mostly related to beam parameters such as bunch volume, emittance, momentum deviation and bunch current. On the other hand, particle losses are related mostly to machine parameters and optics, such as the physical aperture, the phase advance between dispersive regions and collimators, and between dispersive regions and the IR.
The calculation of the energy spectra starts from the formula [47]:
where:
Here accounts for the Møller cross-section and momentum distribution. For a chosen machine section the Touschek probability is evaluated in small steps (30 per element) to account for the beam parameter evolution within the element. Each element is sampled 100 times. The density function for the chosen section is obtained by interpolating between the results using the Touschek scaling law . Further details on the simulation can be found in ref. [49].
Figure 50 shows the behavior of the function along the ring, with the IP located at . It appears that the value of is almost constant at for most of the ring, except for the IR. For this reason, Touschek particles are generated continuously along the whole ring in three element steps. The Touschek-scattered particles undergo large betatron oscillations in the regions where and are high, with very similar energy spectra, but different phase advance, leading to different loss probability.
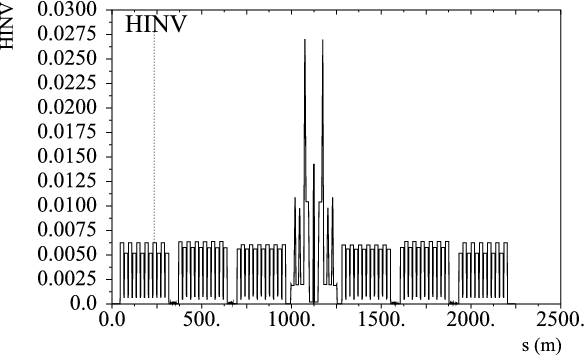
The beam parameters used for our simulations are shown in Table 18. Full tracking has been performed for one machine turn, and only particles with a relative energy deviation between and have been simulated. Particles with higher energy deviations are lost locally, and do not contribute to backgrounds in the experiment, while particles with relative energy deviation almost always remain inside the beam pipe. A beam pipe with a 2 radius was assumed for the entire ring, outside of the IR.
| (nm-rad) | Coupling (%) | ||||
|---|---|---|---|---|---|
Almost all IR losses are due to Touschek scattering occurring far away the IP; they can, therefore, be very effectively reduced with a suitable arrangement of collimators. The most effective location for collimators would be at longitudinal positions corresponding to large radial oscillation of scattered particles. A detailed study on the optimal position of collimators is ongoing. However, a preliminary set of locations has been identified, giving a loss rate of about within the IR () for a single bunch current. The upper plot of Fig. 51 shows the distribution of IR Touschek particle losses, while the lower plot shows trajectories of scattered particles that are eventually lost at the IR. This preliminary collimation scheme appears to be effective for all particles generated along the ring and eventually lost at the IR, except for those scattered at . At this location, the phase advance from the IP is about , resulting in large radial oscillations just at the IR. This residual source of IR background is difficult to remove by inserting additional collimators very close to the IR. However, the phase advance between positions where Touschek scattering results in significant IR losses and the IP can be adjusted in the final design.
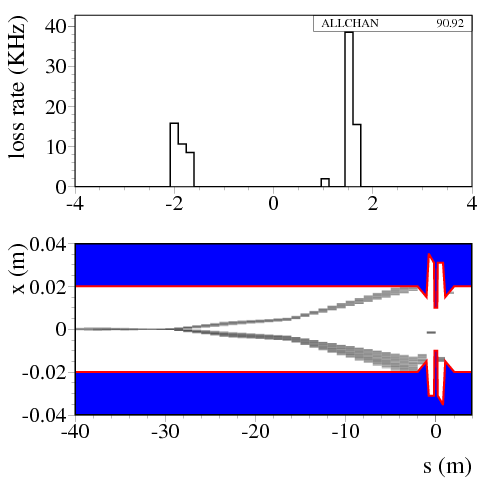
Preliminary studies show that particle losses due to the Touschek effect are expected to be quite high in the LER, consistent with the Touschek lifetime calculations. Since Touschek particles are close in energy to the beam and have small divergence, they can be an important source of background for the detector. Further studies are in progress to optimize the position of collimators, and to improve the machine model, taking into account non-linear terms in the final focus quadrupoles, which can be a relevant issue when tracking Touschek particles.
3 Intrabeam Scattering
Intrabeam scattering [52, 53] is associated with the Touschek effect; while single large-angle scattering events between particles in a bunch leads to loss of particles (Touschek lifetime), multiple small-angle scattering events lead to emittance growth, an effect that is well known in hadron colliders and referred to as intrabeam scattering (IBS). In most electron storage rings, the growth rates arising from IBS are usually very much longer than synchrotron radiation damping times, and the effect is not observable. However, IBS growth rates increase with increasing bunch charge density, and for machines that operate with high bunch charges and very low vertical emittance, the IBS growth rates can be large enough that significant emittance increase can be observed. Qualitative observations of IBS have been made in the LBNL Advanced Light Source [54], and measurements in the KEK Accelerator Test Facility (ATF) [55] have been shown to be in good agreement with IBS theory. IBS is expected to increase the horizontal emittance in the ILC damping rings by roughly [56]; the Super rings will operate with comparable bunch sizes and beam energy, and with somewhat larger bunch charge, so we may expect similar emittance growth from IBS in Super to that in the ILC damping rings. There is a strong scaling with energy, with IBS growth rates decreasing rapidly with increasing energy. Therefore, we expect significantly larger IBS emittance growth in the Super low energy ring than in the high energy ring.
Several formalisms have been developed for calculating IBS growth rates in storage rings, notably those by Piwinski [52] and by Bjorken and Mtingwa [53]. IBS growth rates depend on the bunch sizes, which vary with the lattice functions around the ring; to calculate accurately the overall growth rates, one should therefore calculate the growth rates at each point in the lattice, and average over the circumference. Furthermore, since IBS results in an increase in emittance, which dilutes the bunch charge density and affects the IBS growth rates, it is necessary to iterate the calculation to find the equilibrium, including radiation damping, quantum excitation and IBS emittance growth. The full IBS formulae include complicated integrals that must be evaluated numerically, and can take significant computation time; however, methods have been developed [56, 57] to allow reasonably rapid computation of the equilibrium emittances, including averaging around the circumference and iteration.
For calculation of the IBS emittance growth in the Super rings, we use the formulae of Kubo et al. [57], which are based on an approximation to the Bjorken-Mtingwa formalism [53]. This approximation has been shown to be in good agreement with data on IBS emittance growth collected at the ATF [55, 57]. In our calculations, the average growth rates are found from the growth rates at each point in the lattice, by integrating over the circumference; we use iteration to find the equilibrium emittances in the presence of radiation and IBS.
IBS effects tend to be most significant in the horizontal plane. This is due to the effect of dispersion, which has consequences for the horizontal emittance similar to those in the case of quantum excitation from synchrotron radiation. When two particles scatter, there tends to be a transfer of horizontal to longitudinal momentum; this changes the energy deviations of the particles, which, if the scattering takes place at a location with large dispersion, leads to an increase in horizontal emittance. The principal difference in this respect between synchrotron radiation and IBS is that synchrotron radiation is only significant in the bending magnets, where the dispersion is low by design; IBS occurs throughout the lattice, including regions with relatively large dispersion.
Figure 52 shows the equilibrium transverse emittances, bunch length and energy spread in the Super LER as functions of the bunch charge.
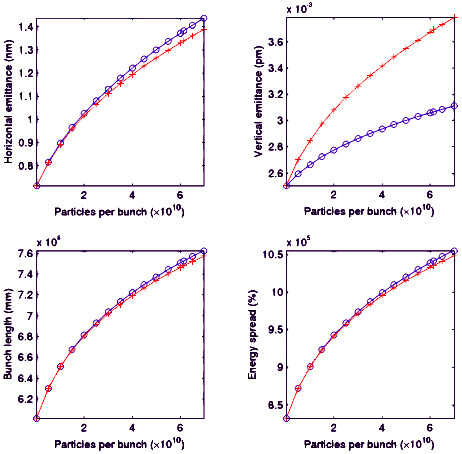
At the nominal bunch charge of , the horizontal emittance is nearly doubled. However, with the design natural emittance of , the final emittance is still below the specified operating horizontal emittance of . There is also an increase in the vertical emittance, of between and , depending on whether the vertical emittance is generated predominantly by vertical dispersion, or by roughly equal contributions from vertical dispersion and betatron coupling. The increase in vertical emittance is significant, but there are possibilities for reducing the impact. If it is felt undesirable to reduce the specification on the vertical emittance below the nominal (at low bunch charge), then the synchrotron radiation damping time may be reduced by increasing the length of wigglers.
As indicated in our results, the increase in vertical emittance from IBS depends on the relative contributions of betatron coupling and vertical dispersion to the vertical emittance. If betatron coupling dominates, then the proportional increase in vertical emittance from IBS will be equal to the proportional increase in horizontal emittance. If we assume roughly equal contributions to the vertical emittance from betatron coupling and from vertical dispersion, then the relative increase in the vertical emittance () is half the relative increase in the horizontal emittance (). However, if the betatron coupling contributes only to the vertical emittance, then the proportional increase in the vertical emittance is reduced to approximately at the nominal bunch charge. It is difficult to know at this early stage the likely relative contributions of betatron coupling and vertical dispersion to the vertical emittance, and this requires further study. A residual rms vertical dispersion of will generate about of the vertical emittance in either the LER or the HER lattice; if the rms vertical dispersion is increased to , then this will generate about of the vertical emittance.
The strong scaling of IBS growth rates with energy means that in the HER the emittance growth from IBS is much less than in the low energy ring; the effects of IBS are further mitigated by the lower bunch charge in the high energy ring. Fig. 53 shows the transverse emittances, bunch length and energy spread in the Super HER as functions of the bunch charge.
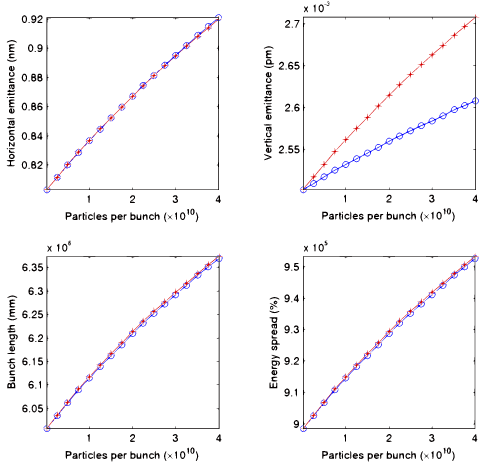
There is a increase in horizontal emittance at the nominal bunch charge of particles, and an increase in vertical emittance of between and , depending on whether the betatron coupling makes a contribution of or to the vertical emittance (with the remaining contribution coming from vertical dispersion). We again assumed that betatron coupling and vertical dispersion make roughly equal contributions to the vertical emittance.
4 Space Charge Effects in the LER
Space charge effects in the LER have been studied using a weak-strong model of dynamics, as implemented in the code Marylie/Impact (MLI). The impact of space charge is noticeable, but our results suggest the existence of workable regions of the tune space in which the design emittance is minimally affected. However, additional studies are recommended to fully substantiate this conclusion.
The large bunch population and small beam sizes result in appreciable space charge tune shifts in the Super rings, and in particular in the LER, as space charge effects scale inversely with the beam energy. For the LER at the design equilibrium and bunch population () linear theory ():
| (24) |
yields the following horizontal and vertical space charge tune shifts: , . This equation, in which and are the relativistic factors, , are the lattice functions, , the horizontal and vertical rms beam sizes, the longitudinal peak density ( is the rms longitudinal bunch length), applies to particles undergoing infinitesimally small betatron and synchrotron oscillations about the center of a gaussian bunch. Plots of the transverse beam sizes for the LER at equilibrium, as determined using the design emittances -rad, -rad, and -rad are shown in Fig. 54.
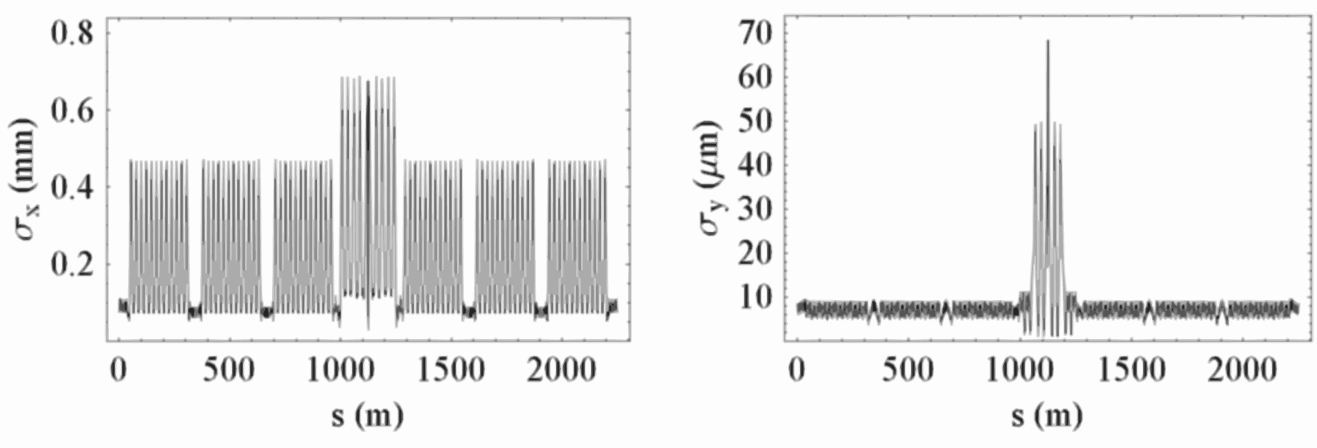
While space charge should have little effect on injection efficiency, since its effects become noticeable only after several damping times, it could cause particle beam losses at later times, if the working point in tune-space is sufficiently close to an unstable lattice resonance. Proximity to stable resonances would be less damaging, but could also be detrimental, and could lead to unacceptable emittance degradation. Far from resonances, space charge may still compromise the target vertical equilibrium emittance, when its impact is considered in combination with radiation and linear coupling in a non-ideal lattice. The latter effect, however, should be small [58], and was neglected here, as we limited our attention to an error-free lattice in the absence of any radiation effects.
Our study was conducted using a weak-strong model for space charge, as implemented in the numerical tools recently developed to study similar effects in the ILC damping rings [59, 60]. In the weak-strong model the space charge force is calculated as if it were produced by a 6D gaussian bunch matched to the ideal linear lattice and with rms emittances equal to those expected at equilibrium for a realistic lattice with some residual linear coupling. A collection of macroparticles, initially distributed according to a bunch density at equilibrium, is then tracked element-by-element, with the inclusion of the lattice nonlinearities and treating the space charge force with the kick approximation. Because of its non-self consistent nature, this model will likely overestimate the effect of any detected emittance growth, and should be used mainly as a tool to search the tune space for regions of minimal emittance growth. An accurate characterization of emittance growth would require more detailed, and considerably more computationally intensive, models of beam dynamics.
In our study we used an augmented version of the Marylie/Impact (MLI) code [61]. The code was validated during the ILC damping ring studies by calculations carried out independently using SAD [25, 59]. For more details on the implementation of the weak-strong space charge model in MLI we refer to [59].
We assessed the space charge effects in the LER lattice by producing tune space scans and looking for the rms emittance changes in the transverse plane. The results of our investigations are reported as color-density plots showing the maximum value of the rms emittance experienced by the macroparticle beam within the indicated duration of tracking, see Figs. 56, 55, and 57.
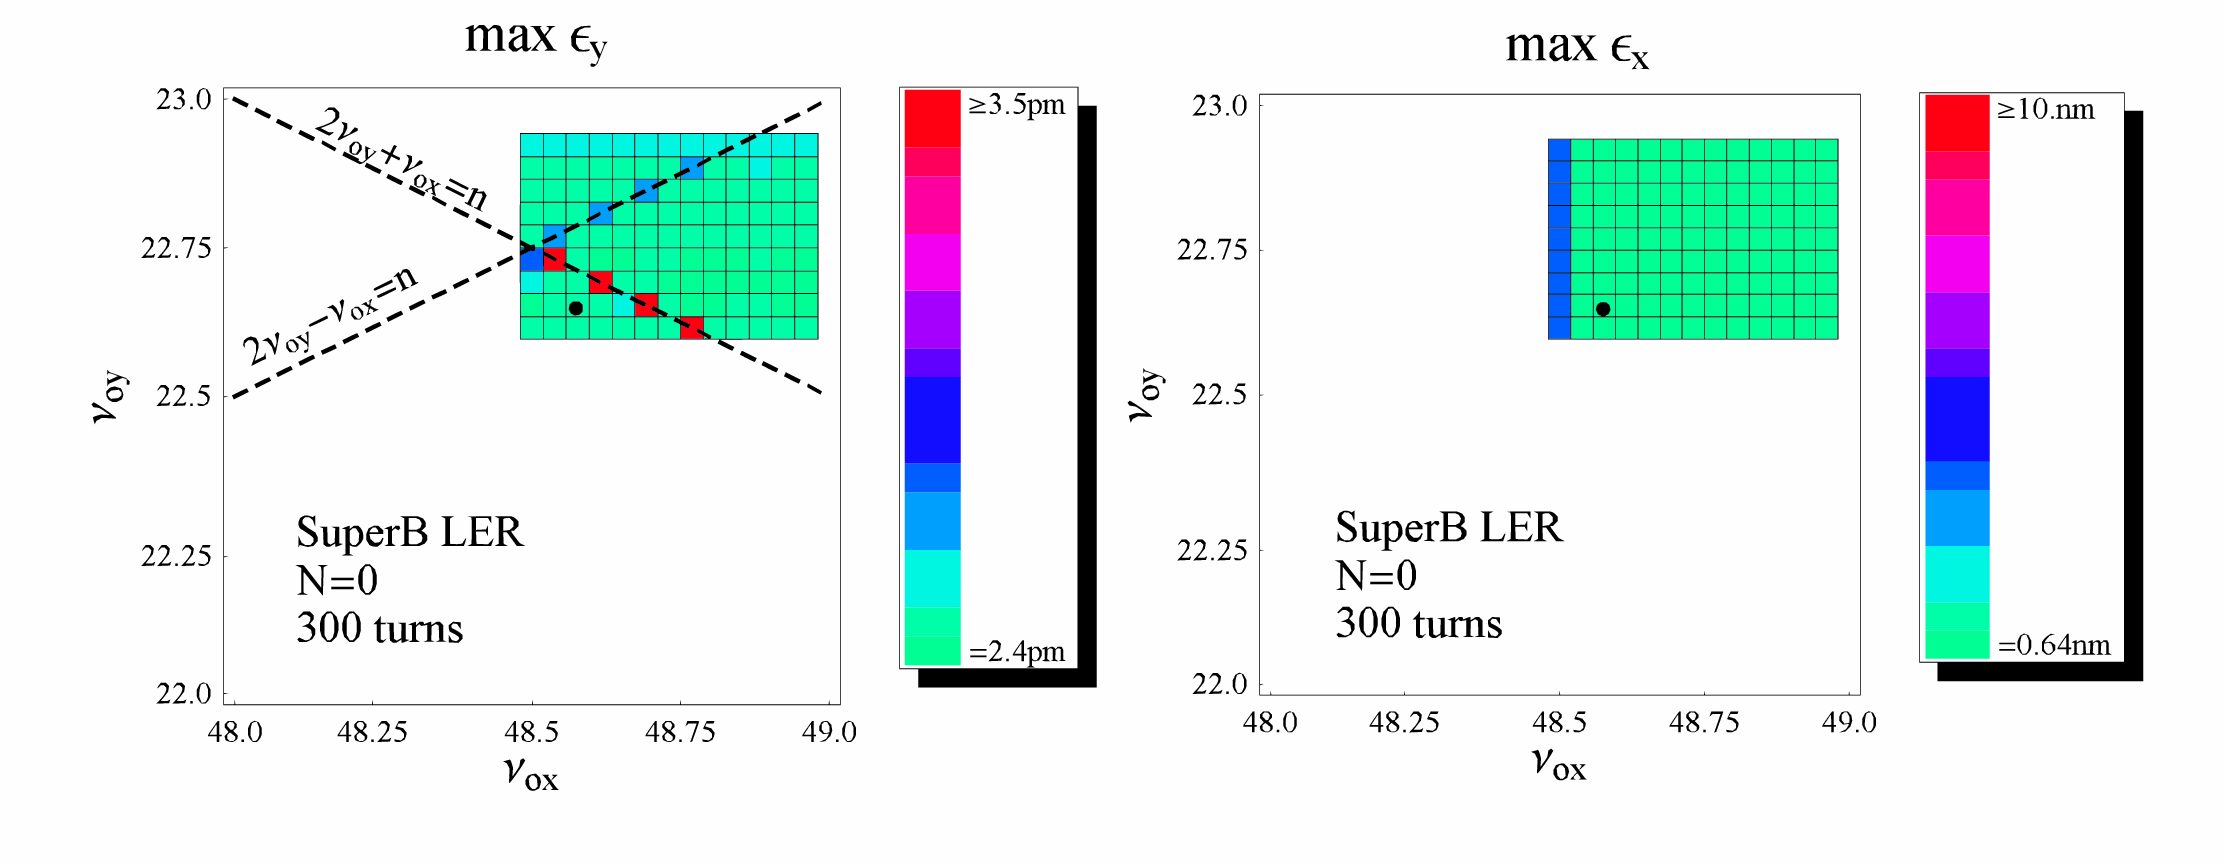
We tracked a bunch population of 200 macroparticles. Because of the weak-strong nature of the model, evaluation of the space charge kick is independent of the number of macroparticles used; a modest number should therefore be sufficient to provide an acceptable sampling of the phase space available to the beam. The detuning of the lattice was done by inserting pure phase rotations at the end of the one-turn lattice with proper matching, so as not to perturb the value of the lattice functions. This amounts to a linear kick causing a small discontinuity in both the particle transverse position and momentum. A short term tracking (50 machine turns) tune scan of the region around the design working point exhibited strong half-integer resonances (Fig. 56). These resonances are already present in the bare lattice and the effect of space charge is to noticeably enlarge their width. This is seen, for the vertical plane, in the lefthand plot of Fig. 56, where the apparent width of the resonance lines is about .
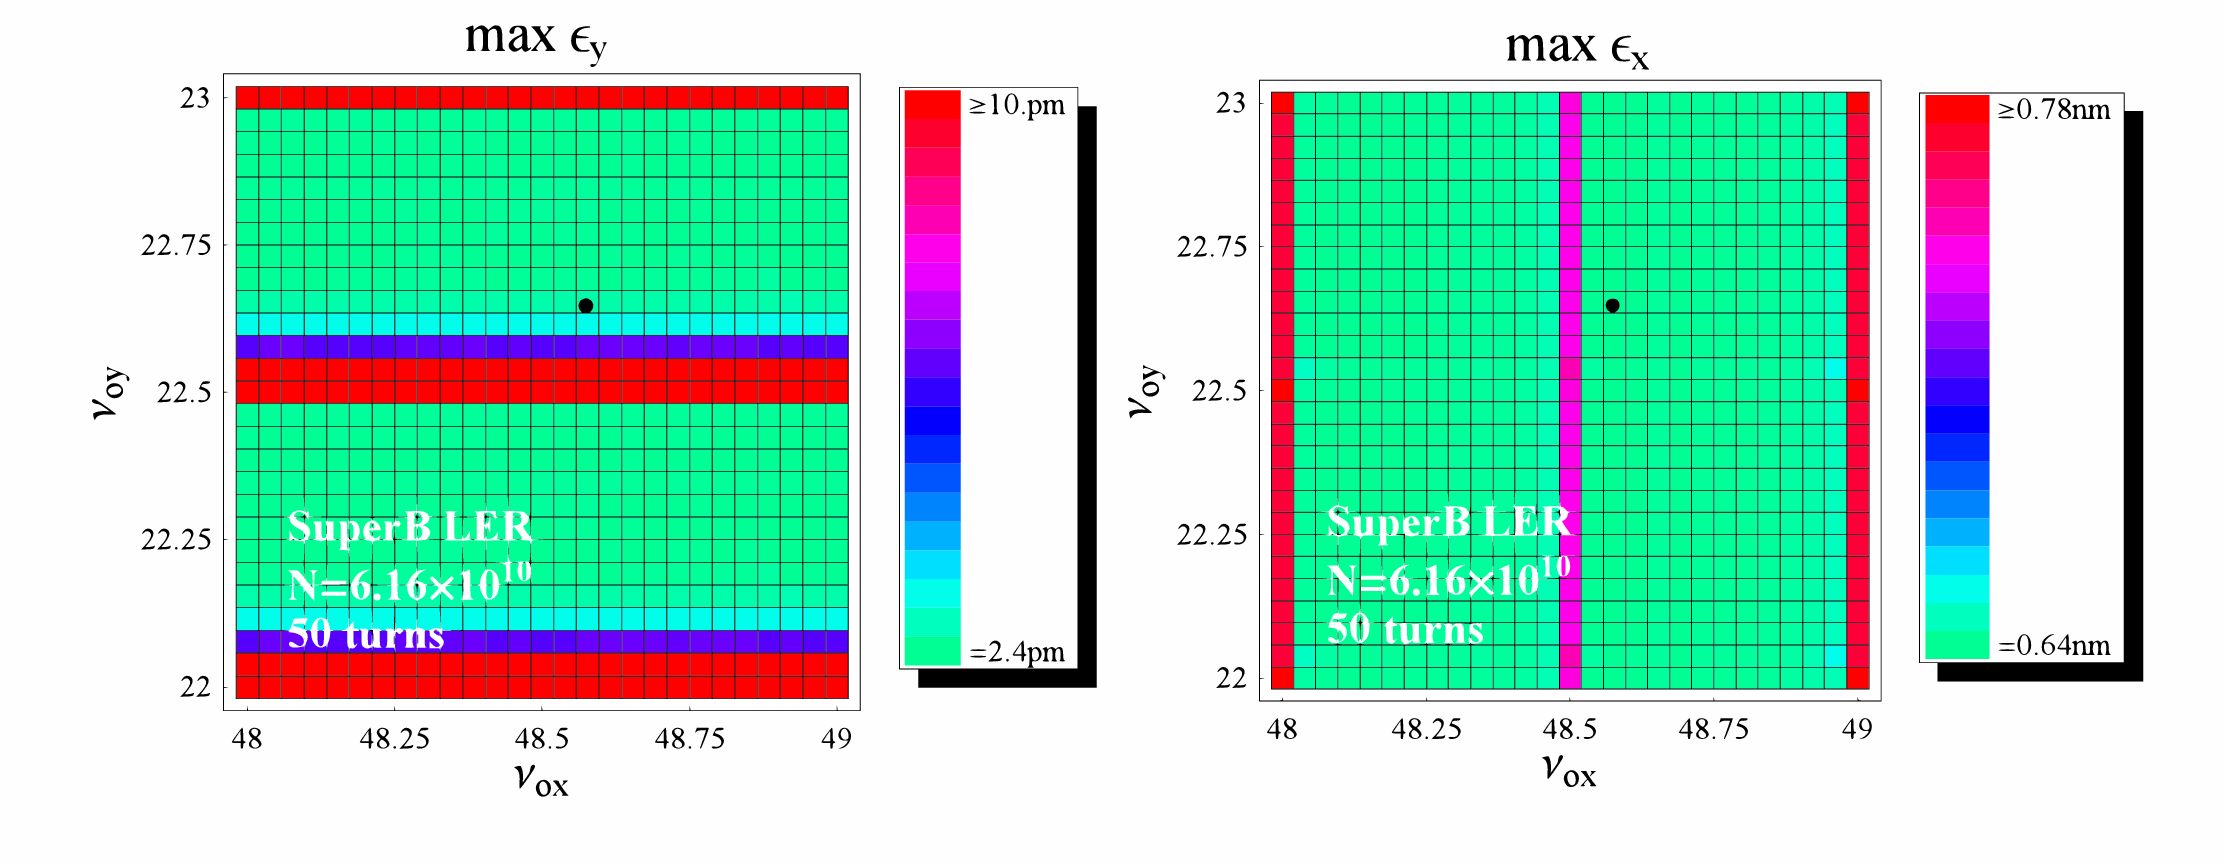
Notice, however, that this value is somewhat smaller than the tune shift predicted by linear theory. This should be interpreted as a consequence of the highly nonlinear nature of the space charge force, which causes the tune shift experienced by particles to decrease quickly from the value predicted by linear theory with increasing amplitude of the betatron (or synchrotron) oscillations. In the horizontal plane (lefthand plot in Fig. 56) the space charge tune shift is too small to have any detectable effect on the scale of resolution used for these tune scans. The minimum emittance reported in the figures, -rad and -rad (regions with dark green shading), representing the rms emittances of the simulated macroparticle distributions, differ slightly from the nominal equilibrium values -rad and -rad, because of statistical fluctuations associated with the use of a limited number of macroparticles.
For practical reasons, in order to study space charge effects on a longer time scale (up to 600 machine/turns), we restricted our investigation to a smaller area of tune-space. The case with space charge (Fig. 55) is to be compared with the case without space charge (Fig. 57). In the absence of space charge, the vertical emittance tune scan (lefthand plot in Fig 55) shows evidence of two third-order resonances at and , with the first being considerably stronger, and resulting in about emittance growth over 300 machine turns. The other resonance resulted in a smaller growth over the same tracking time. Outside these narrow resonances, the vertical rms emittance appears to remain largely unchanged.
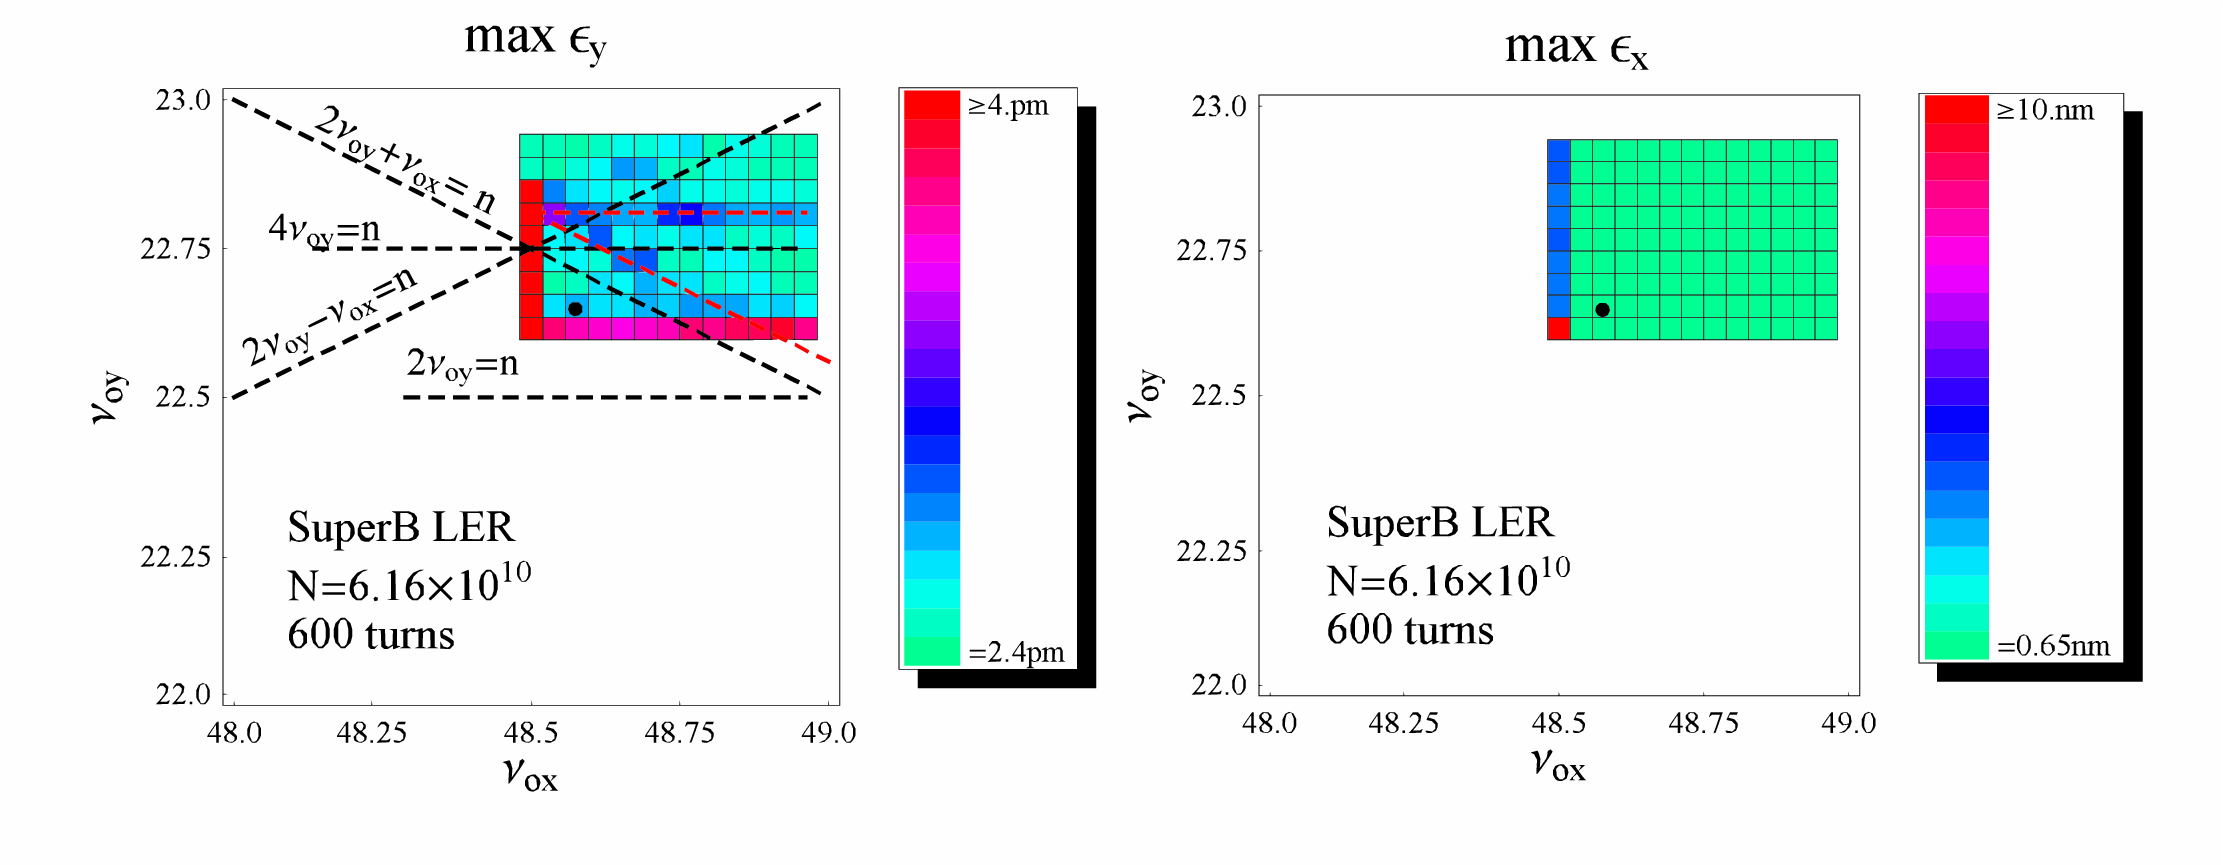
Inclusion of space charge causes some additional degradation of the rms vertical emittance that is not apparent in short term-tracking (lefthand plot in Fig. 57). Not unexpectedly, the largest growth occurs along the half-integer line. This resonance is already present in a bare lattice, but with visible consequences only on the horizontal motion. Its impact on the vertical motion is fostered by the coupling introduced by space charge. The emittance growth detected along this line was very large, and for some choices of the vertical tune was found to lead to particle losses. Outside this resonance line and the upper part of the region affected by the resonance we observe some smaller, but clearly noticeable, emittance growth up to about over 600 turns (region with bluish shading). The emittance growth appears to be concentrated mostly along two lines–we highlighted these strips of growth in the lefthand plot of Fig. 56 with two red dashed lines. These lines are not traceable to some obvious resonances and identification of the exact growth mechanism will require some more work. At this time our tentative interpretation is that these regions of growth are related to the resonance lines and ; they appear shifted upward for reasons that remain to be understood. Notice that the magnitude of this shift is well within the value of space charge detuning – an argument in favor of this interpretation. The resonance is a lattice resonance already present in the bare lattice whereas the fourth order could be ascribed to a space charge induced resonance caused by the space charge force nonlinearity and the breathing of the the beam envelopes. Recall that the latter is among the lowest-order nonlinear resonances that can be driven by space charge.
In conclusion, this preliminary study indicates that space charge effects are noticeable in the low energy ring. One clear consequence is the enlargement of strong half-integer structural lattice resonances present in the bare lattice, causing fast emittance growth and possibly, particle losses. This alone poses a significant limitation to the choice of the working point because of the sizeable space charge vertical tune shift. On a longer time scale, we encountered some areas of moderate, but clearly detectable, emittance growth. Encouragingly, however, our calculations also show the existence of regions in the tune space that appear little affected by emittance growth. Further studies are needed to insure that motion stability persists on a longer timescale, up to a few damping times, and in the presence of lattice errors.
5 HOM Heating and Intensity-Dependent Effects
In this section we discuss the effects that must be considered in the design of the vacuum chamber for a very high luminosity factory. We investigate the influence of the various intensity-dependent effects on the actual performance of the accelerator. The analysis is based on the parameters listed in Table 19.
| LER | HER | |
| Energy (GeV) | ||
| Beam current (A) | ||
| Bunch length (mm) | ||
| Beam energy spread | ||
| SR energy loss (MeV/turn) | ||
| Long. damping time (ms) | ||
| Momentum compaction | ||
| RF voltage (MV) | ||
| Synchrotron tune | ||
| Number of cavities | ||
| RF frequency (MHz) | ||
| Circumference (m) | ||
| Revolution frequency (kHz) | ||
| Harmonic number | ||
| Number of bunches | every second bucket gap | every second bucket gap |
In terms of collective effects, the dominant issue is the relatively high beam current that must be supported in each ring. A beam circulating in a storage ring interacts with its surroundings electromagnetically by inducing image currents in the walls of the vacuum chamber and exciting higher-order-modes (HOMs) in the chamber elements, such as RF cavities, vacuum valves, collimators, bellows, beam position monitor (BPM) electrodes, kickers, etc. This interaction leads, in turn, to a temperature rise of the chamber elements, and may cause beam instabilities. In the worst case, the HOM electric fields may be large enough to produce sparking, or even breakdowns that may lead to beam aborts due to bad vacuum conditions.
These issues fall into the broad categories of single-bunch and multi-bunch phenomena and higher-order-mode (HOM) heating. The main concern is coupled-bunch instabilities, where different bunches “communicate” through the narrow-band ring impedances, i.e., wakefields deposited in various resonant objects can influence the motion of following bunches, and can cause the motion to become unstable if the beam currents are too high. To avoid coupling to the bunch motion at the bunch spacing resonance, HOMs must have a damping time (loaded filling time) smaller than the bunch spacing .
The multi-bunch instabilities are mainly driven by the total beam current, with little regard to how it is distributed in the ring, i.e., once the bunch separation is small enough for bunches to see fully the wakefields left by proceeding bunches, the growth rates become independent of the details of the bunch pattern. Thus, if high beam current is required, coupled-bunch instabilities become almost unavoidable.
| . | |||||||||
|---|---|---|---|---|---|---|---|---|---|
| . | |||||||||
| . | |||||||||
| . | |||||||||
| . | |||||||||
| . | |||||||||
| . | |||||||||
| . | |||||||||
| . | |||||||||
| . | |||||||||
| . | |||||||||
| . | |||||||||
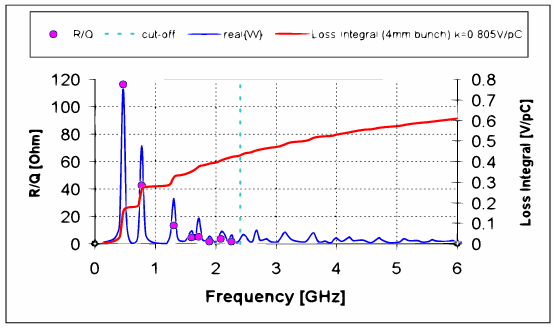
RF cavities
The main contribution to the narrow-band impedance comes from the RF cavities. This means that HOMs trapped in the cavity must be very well damped, as was done with the PEP-II cavities. Measured and calculated frequencies and Q values of monopole higher-order modes for the PEP-II cavities are shown in Table 20 (from ref [62]). The PEP-II spectrum, calculated from the wake potential of a bunch [66], is shown in Fig. 58.
HOM power below cut-off frequencies.
| (25) | ||||
| (26) | ||||
| (27) |
where is the loss factor, is the beam current, is the bunch spacing and is a loaded . Table 21 shows the HOM power into each bellow cut-off mode, and the total loss of a PEP-II cavity for the beam current of .
| Mode frequency (GHz) | R/Q () | Loss factor (V/) | Filling time (ms) | Bunch spacing (ns) | Power loss (kW) | |||
|---|---|---|---|---|---|---|---|---|
| 0.475997 | 117.3 | 8000 | 0.1754 | 2.675 | 1.000 | 0.9969 | 4.202 | 0 |
| 0.758 | 44.6 | 18 | 0.1062 | 0.004 | 0.398 | 0.1082 | 4.202 | 0.4701 |
| 1.009 | 0.43 | 128 | 0.0014 | 0.020 | 0.066 | 0.6595 | 4.202 | 0.0013 |
| 1.283 | 6.7 | 259 | 0.0270 | 0.032 | -0.774 | 0.7699 | 4.202 | 0.0083 |
| 1.295 | 10.3 | 222 | 0.0419 | 0.027 | -0.933 | 0.7349 | 4.202 | 0.0140 |
| 1.595 | 2.43 | 300 | 0.0122 | 0.030 | -0.299 | 0.7552 | 4.202 | 0.0055 |
| 1.71 | 0.44 | 320 | 0.0024 | 0.030 | 0.398 | 0.7542 | 4.202 | 0.0023 |
| 1.82 | 0.13 | 543 | 0.0007 | 0.047 | -0.602 | 0.8378 | 4.202 | 0.0002 |
| 1.898 | 0.17 | 2588 | 0.0010 | 0.217 | 0.988 | 0.9620 | 4.202 | 0.0065 |
| 2.121 | 1.82 | 338 | 0.0121 | 0.025 | 0.850 | 0.7180 | 4.202 | 0.0519 |
| 2.16 | 0.053 | 119 | 0.0004 | 0.009 | 0.889 | 0.3835 | 4.202 | 0.0033 |
| 2.265 | 0.064 | 1975 | 0.0005 | 0.138 | -0.994 | 0.9412 | 4.202 | 0.0000 |
| Total | 184.437 | 0.3811 | 0.5635 |
HOM power for above cut-off frequencies.
The calculated loss factor [65, 66] for different bunch lengths is shown in Fig. 59. HOM power above the cut-off frequency for a PEP-II cavity [66] is given by
HOM losses below and above the cut-off frequencies are shown in Table 22. The total HOM power for all cavity losses is also shown for the PEP-II and Super parameters.
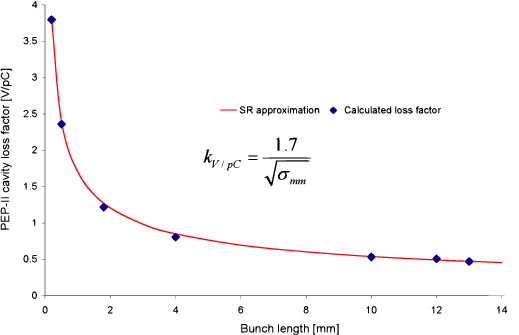
| LER | HER | |||
| PEP-II | Super | PEP-II | Super | |
| Beam current (A) | 2.9 | 2.3 | 1.8 | 1.3 |
| Bunch length (mm) | 13 | 6 | 11 | 6 |
| Number of cavities | 8 | 12 | 26 | 22 |
| Power below cut-off (kW) | 37.91 | 23.85 | 47.47 | 22.86 |
| Power above cut-off (kW) | 25.54 | 55.62 | 46.51 | 53.31 |
| Total HOM cavity power (kW) | 63.46 | 79.4 | 93.98 | 76.16 |
Resistive-wall wakefields
The resistive wall loss factor from [67] is given by
The calculated resistive wall losses for the LER and HER rings of PEP-II and Super are shown in Table 23.
| LER | HER | |||
|---|---|---|---|---|
| PEP-II | Super | PEP-II | Super | |
| Bunch length (mm) | 13 | 6 | 11 | 6 |
| Bunch spacing (nsec) | 4.2 | 4.2 | 4.2 | 4.2 |
| Beam current (A) | 2.9 | 2.3 | 1.8 | 1.3 |
| Power (kW) | 71.74 | 143.92 | 36.15 | 46.81 |
Beam chamber elements
PEP-II collimator wakefield.
The geometry of a PEP-II collimator is shown in Fig. 60. The loss factor for a bunch is also shown for different positions of the beam collimator [68]. The bunch length dependence is shown in Fig. 61. Wakefield collimator losses for PEP-II and Super parameters are shown in Table 24.

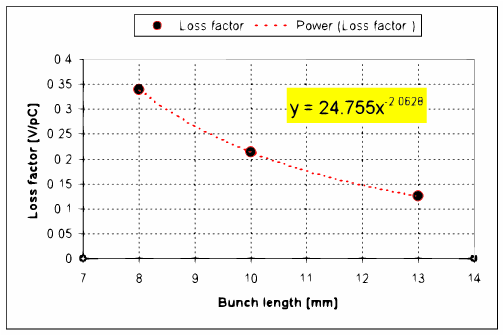
| LER | HER | |||
| PEP-II | Super | PEP-II | Super | |
| Beam current (A) | 2.9 | 2.3 | 1.8 | 1.3 |
| Bunch length (mm) | 13 | 6 | 11 | 6 |
| Number of collimators | 7 | 7 | 6 | 6 |
| Wakefield power (kW) | 18.1 | 53.5 | 16.7 | 29.3 |
HOM power in injection and abort kickers.
Figure 62 shows the beam current dependence of the power dissipated in the injection and abort kickers of the PEP-II LER. At a beam current of , the power in these four LER kickers reaches for PEP-II parameters. If we assume that the bunch length dependence is the same as that for the resistive-wall wake-field losses, , then the Super LER will have dissipated for a beam current of .
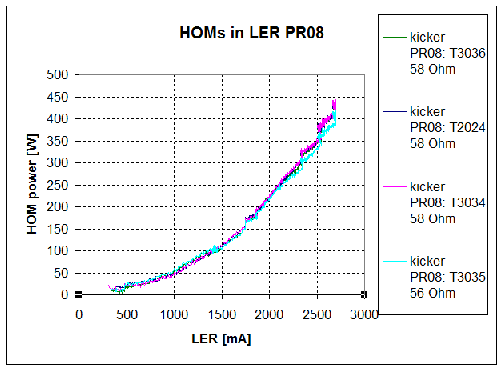
Loss factor and wake-field power of longitudinal kickers.
The longitudinal kicker spectrum and the loss factor as a function of bunch length from an azimuthally symmetric model are shown in Fig. 63. The measured single bunch spectrum for a longitudinal kicker is shown in Fig. 64. The wake-field power in two longitudinal kickers is shown in Table 25 for the PEP-II and Super LER and HER parameters.
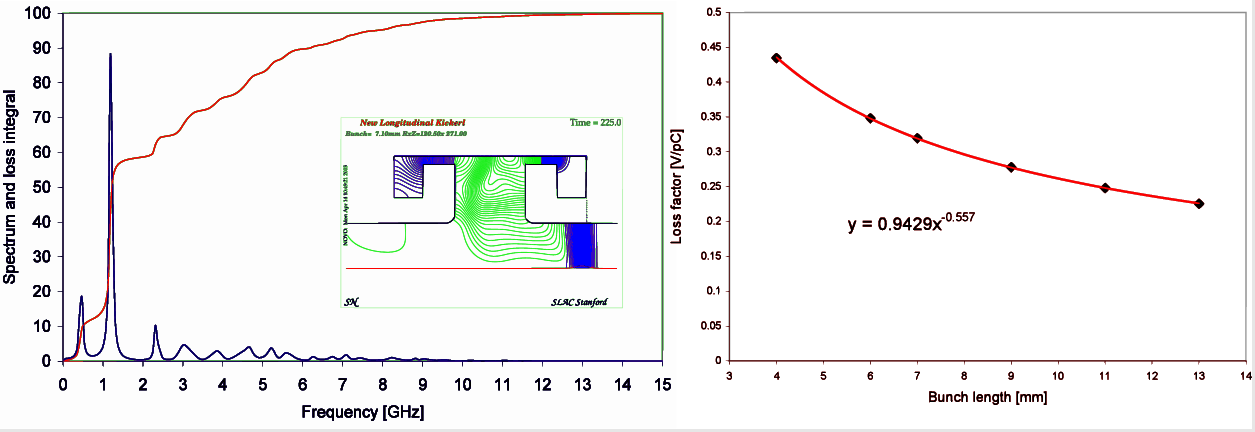
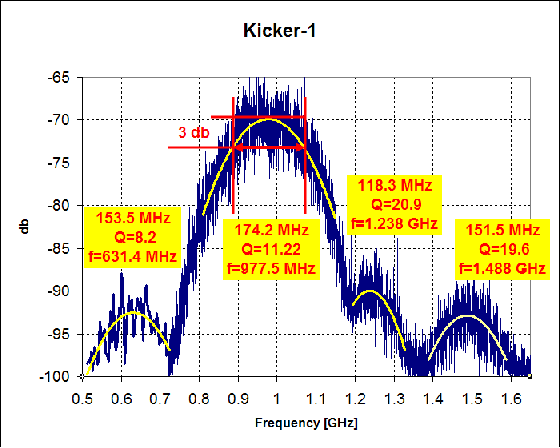
| LER | HER | |||
| PEP-II | Super | PEP-II | Super | |
| Beam current (A) | 2.9 | 2.3 | 1.8 | 1.3 |
| Bunch length (mm) | 13 | 6 | 11 | 6 |
| Number of longitudinal kickers | 2 | 2 | 2 | 2 |
| Wakefield power (kW) | 5.93 | 7.74 | 2.68 | 2.47 |
Loss factor and wake-field power for transverse kickers.
The transverse kicker loss factor as a function of bunch length from an azimuthally symmetric model is shown in Fig. 65. Wake-field power in two transverse kickers is shown in Table 26 for PEP-II and Super LER and HER parameters.
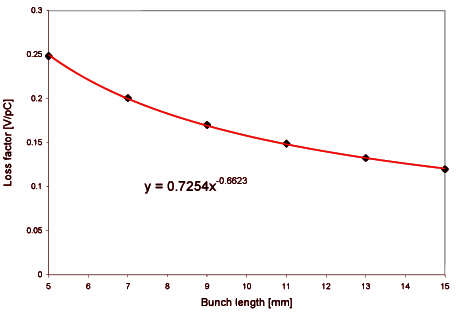
| LER | HER | |||
| PEP-II | Super | PEP-II | Super | |
| Beam current (A) | 2.9 | 2.3 | 1.8 | 1.3 |
| Bunch length (mm) | 13 | 6 | 11 | 6 |
| Number of transverse kickers | 2 | 2 | 2 | 2 |
| Wake-field power (kW) | 9.37 | 7.84 | 2.68 | 2.47 |
Distributed Pumps.
The loss factor per unit length is estimated from [69]:
where (coherence effect). Results for the coupled power in distributed pumps are shown in Table 27 for PEP-II and Super parameters.
| LER | HER | |||
| PEP-II | Super | PEP-II | Super | |
| Beam current (A) | 2.9 | 2.3 | 1.8 | 1.3 |
| Bunch length (mm) | 13 | 6 | 11 | 6 |
| Wake-field power (kW) | 1.24 | 37.21 | 5.50 | 59.44 |
IP wakefields
The calculated geometrical loss factor is shown in Fig. 66 as a function of bunch length. The IP “geometrical” HOM power is given in Table 28 for PEP-II and Super parameters.
Additional substantial HOM power loss will likely occur in the transition bellows from the single beam pipe in the IR to the separate HER and LER beam pipes in the rest of the ring. In PEP-II, these forward and backward Q2 transition bellows contain “open” ceramic tiles that generate power loss through Cherenkov radiation [70]. The loss factors are given by:
Power loss due to Cherenkov radiation in the forward and backwards Q2 bellows in PEP-II, and extrapolations for equivalent components with Super parameters, is shown in Table 29. The measured power in the Q2 bellows is shown in Fig. 67. Additional numerical and experimental study is needed to make a more precise prediction for Super.
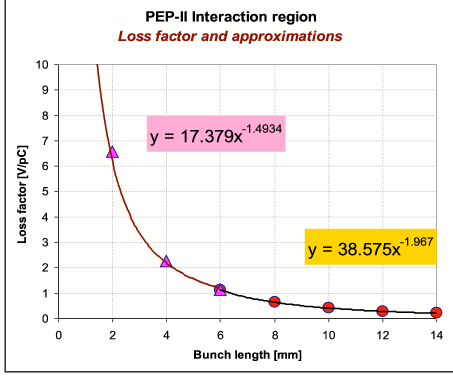
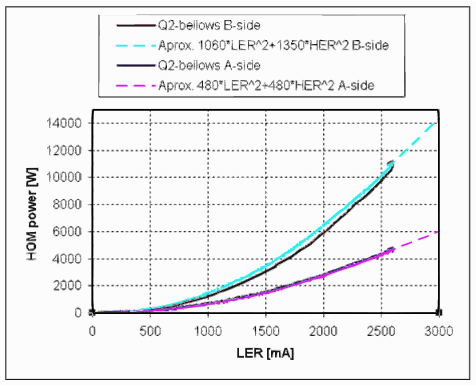
| Parameters | PEP-II | Super |
|---|---|---|
| Bunch length (mm) | 13 | 6 |
| Loss factor (V/pC) | 0.248 | 1.137 |
| LER current (A) | 2.9 | 2.3 |
| HER current (A) | 1.8 | 1.3 |
| Bunch spacing (ns) | 4.2 | 4.2 |
| LER power loss (kW) | 8.77 | 25.26 |
| HER power loss (kW) | 3.38 | 8.07 |
| Total power loss (kW) | 12.15 | 33.33 |
| Parameters | PEP-II | Super |
|---|---|---|
| (mm-rad) | 30.00 | 30.00 |
| L (mm) | 59.20 | 59.20 |
| Bunch length (mm) | 13.00 | 6.00 |
| s/ | 0.41 | 0.90 |
| Loss factor (V/pC) | 0.07 | 0.30 |
| LER current (A) | 2.9 | 2.3 |
| HER current (A) | 1.8 | 1.3 |
| Bunch pattern by 2 (ns) | 4.20 | 4.20 |
| LER power loss (kW) | 4.89 | 13.15 |
| HER power loss (kW) | 1.88 | 4.20 |
| Total power loss (kW) | 6.77 | 17.36 |
Total HOM power
The calculated total HOM power for PEP-II and Super is summarized in Table 30 for the LER and HER.
| LER | HER | |||
|---|---|---|---|---|
| PEP-II | Super | PEP-II | Super | |
| RF cavities | 63.46 | 79.47 | 93.98 | 76.16 |
| Resistive wall | 71.74 | 143.02 | 36.15 | 46.81 |
| Collimators | 18.11 | 53.47 | 16.7 | 29.29 |
| Kickers | 17.3 | 21.38 | 6.08 | 6.14 |
| Screens | 1.24 | 37.21 | 5.5 | 59.44 |
| IP wakes | 13.66 | 38.41 | 5.26 | 12.27 |
| Total power (kW) | 185.51 | 372.96 | 163.67 | 230.11 |
Total RF power
Table 31 shows the measured [71] total RF power for the PEP-II LER and HER. The measured losses, particuarly for the PEP-II HER, are greater than the calculated losses listed in Table 30. The source of this discrepancy remains to be understood, although it should be noted that the determination of the total measured consumption depends on a knowledge of klysteron and modulator efficiencies. Rescaling the power losses observed in PEP-II to the Super design gives the revised predictions also shown in Table 31.
| LER | HER | |||
| PEP-II | Super | PEP-II | Super | |
| Beam current (A) | 2.9 | 2.3 | 1.8 | 1.3 |
| Bunch length (mm) | 13 | 6 | 11 | 6 |
| S.R. loss (MeV/turn) | 0.56 | 1.9 | 3.16 | 3.3 |
| RF voltage (MV) | 4.05 | 10 | 15.4 | 15 |
| Number of cavities | 8 | 14 | 26 | 22 |
| Number of klystrons | 4 | 7 | 9 | 8 |
| Reflection coefficient | 0.142 | 0.202 | 0.083 | 0.010 |
| S.R. power (kW) | 1624 | 4370 | 5688 | 4290 |
| Cavity loss (kW) | 250 | 549 | 1187 | 1622 |
| Refl. power (kW) | 345 | 1355 | 652 | 64 |
| HOM power (kW) | 210 | 422 | 292 | 378 |
| Total RF power (kW) | 2429 | 6695 | 7819 | 6354 |
6 Single Bunch Impedance Effects
We have made an estimate of single-bunch instabilities for Super. We use the parameters for the 12 cell design in ref. [72], which are listed in Table 32 along with KEKB parameters.
| Super | KEKB | |||
| LER | HER | LER | HER | |
| Energy (GeV) | 4 | 7 | 3.5 | 8 |
| Circumference (m) | 2250 | 3016 | ||
| Bunch length (mm) | 4.7 | 5.0 | 6 | 6 |
| Energy spread | 1.0 | 1.0 | 0.73 | 6.9 |
| Momentum compaction | 1.8 | 3.0 | 3.4 | 3.4 |
| Particles per bunch | 6.16 | 3.52 | 7 | 5.2 |
Longitudinal impedance
The instability threshold in longitudinal impedance is given by the Keil-Schnell-Boussard criterion [73, 74]
| (28) |
Using this equation, we estimated the thresholds for Super and KEKB listed in Table 33.
| Super | KEKB | |||
|---|---|---|---|---|
| LER | HER | LER | HER | |
| Threshold by Eq. 28 | ||||
| Measured impedance | ||||
By comparing with the measured impedance in the KEKB HER [75], the Super HER seems to be safe from longitudinal instability, although the safety margin may be small. On the other hand, the threshold impedance is very small in the Super LER. Since the momentum compaction factor is small in the present Super LER design with , it takes time to damp the microbunching, i.e., structures inside the bunch can last a long time and even grow in the LER. As a result of the potential well distortion from longitudinal impedances, bunches in the LER will be lengthened by roughly , to an equilibrium value around . Although this effect relaxes somewhat the instability threshold, due to the 20% reduction in peak current, the longitudinal instability in the Super LER remains severe.
However, it is instructive to note that the KEKB LER operates without a longitudinal microwave instability. In this case, Eq. 28 predicts for the KEK LER, similar to the value calculated for the Super LER, while the actual measured longitudinal impedance is . This experience suggests that we may be able to operate the Super LER using the present design, although the momentum compaction factor may be too small. It has been noted in ref. [74, 76] that our argument using the simple criterion is not sufficiently reliable, because the instability threshold strongly depends on the impedance characteristics. Therefore, more detailed studies are necessary to address the longitudinal impedance problem. We should at the same time make efforts to reduce the longitudinal impedance, especially in LER.
Transverse impedance
The threshold impedance for transverse single-bunch instability is given by
| (29) |
The threshold impedances for Super are listed in Table 34.
| Super | KEKB | ||
|---|---|---|---|
| LER | HER | LER | |
| Threshold by Eq. 29 | |||
| Measured impedance | |||
The transverse impedance in the KEKB LER was measured to be [75]. The average beta function in KEKB is ; is estimated to be between to . Compared with the values of the KEKB impedance, we find that both the Super LER and HER will operate well below threshold, and should have no problem with transverse single bunch instability. However, a more detailed investigation should be made of both the transverse and the longitudinal impedance. In particular, as noted in ref. [75], collimators will dominate the transverse impedance in the ring, and so special care will be needed in their design.
It may also be that the transverse mode coupling (TMC) instability will limit beam intensity in Super. We made a rough estimation for the threshold of the TMC instability using the following equation:
| (30) |
In the Super design, PEP-II magnets will be reused to reduce costs, so we use the PEP-II vacuum chamber size of (full height in the PEP-II LER bends). The threshold for the Super LER is , which corresponds to , where we are assuming that the average beta function is . It appears that this threshold is high enough to avoid transverse mode coupling instability.
7 Coherent Synchrotron Radiation
With a very short bunch length, coherent synchrotron radiation (CSR) emission can drive microwave instability. In particular, the low energy beam could be unstable if the bunch charge is large, because of the smaller energy. We will discuss possible single bunch instabilities due to CSR in the Super LER, and estimate the margin to the instability threshold. If the low energy beam is stable for CSR-source microwave instability, the HER should be as well. For the HER, the higher energy results in greater rigidity and stronger damping, while CSR does not depend on the particle energy in this energy regime. It is therefore sufficient to investigate CSR effects for LER alone.
The bunch length is designed to be in the Super LER [75]. The ring will have three types of bending magnets in the present design: short, middle bends for arc-sections and long bends for final focus section, to obtain a small emittance and to reduce the cost by re-using PEP-II magnets. The dipole parameters are listed in Table 35.
| Name (length) | Bending radius | Number of bends | |
|---|---|---|---|
| Short () | PEP-II | ||
| Middle () | new | ||
| Long () for FF | (average) | PEP-II |
Since the vacuum chambers currently used in the PEP-II LER bends have an inside dimension of in width and in height [78], we use a rectangular copper pipe in our analysis.
The current Super LER design has four wiggler sections for damping. However, we do not consider CSR emitted in the wigglers in our analysis, because the bending magnets in the arc sections will dominate. The wigglers are, however, considered in calculating the synchrotron radiation loss of the beam. In this section we consider CSR generated in the arc sections and the resistive wall wakefield for a long ring. We note that the bunches may be lengthened by 0.5– because of other wakefields, e.g., due to vacuum components and cavities. As a result, our analysis may give a somewhat overly severe threshold for the CSR-source microwave instability.
The CSR wakefield for a single turn is shown in Fig. 68, where we assume a perfectly conducting pipe, in order to remove the resistive wall wakefield. The middle bending magnets give the largest contribution, but the magnitude of the longitudinal wakefield is just for a single turn.
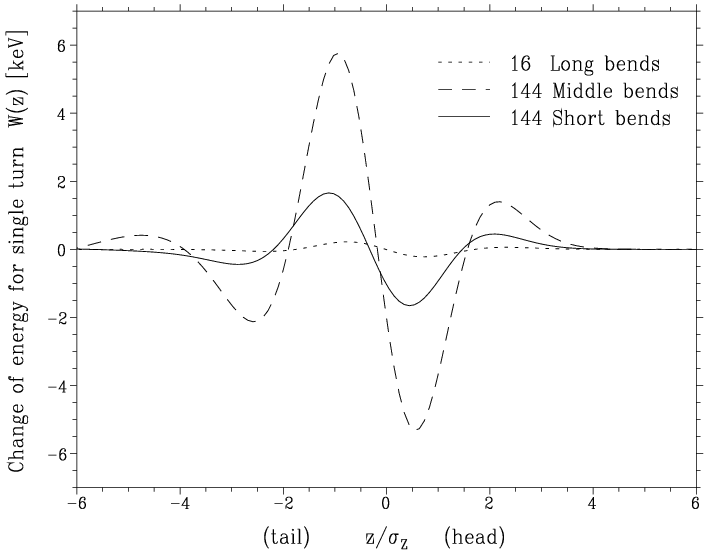
We have studied the effect of CSR and resistive wall wakefields on the longitudinal dynamics of the machine design by solving the Fokker-Planck equation. For the design bunch charge, (), the resulting longitudinal bunch distribution is shown in Fig. 69 for a drift length. In order to isolate the CSR contribution alone, we also show the distribution after removing the resistive wall wakefield contribution. We observe that the distortion of the longitudinal bunch distribution is mainly determined by the resistive wall wakefield.
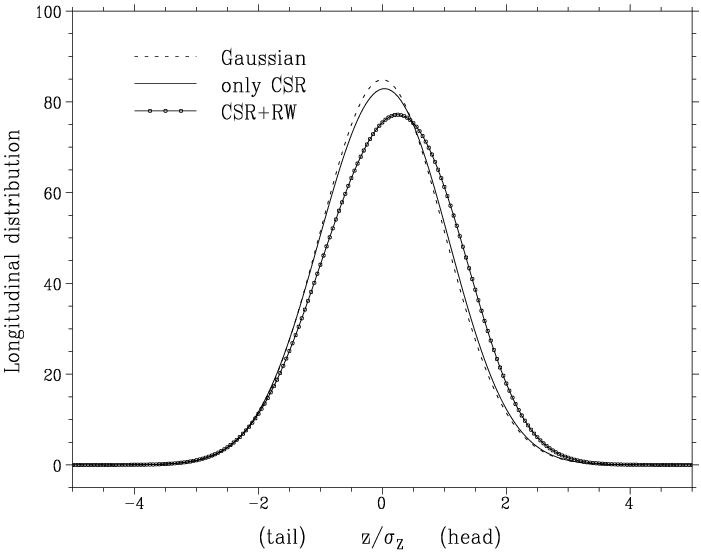
With increasing bunch charge, CSR will induce microwave instabilities. The bunch length and energy spread dependence on bunch charge are shown in Fig. 70 and 71. The energy spread starts increasing at in bunch charge ( particles/bunch). The bunch is no longer stable above this threshold, with both the bunch length and the energy spread oscillating with a saw-tooth shape in the time domain. Since the design bunch charge is ( particles/bunch) the safety margin is about .
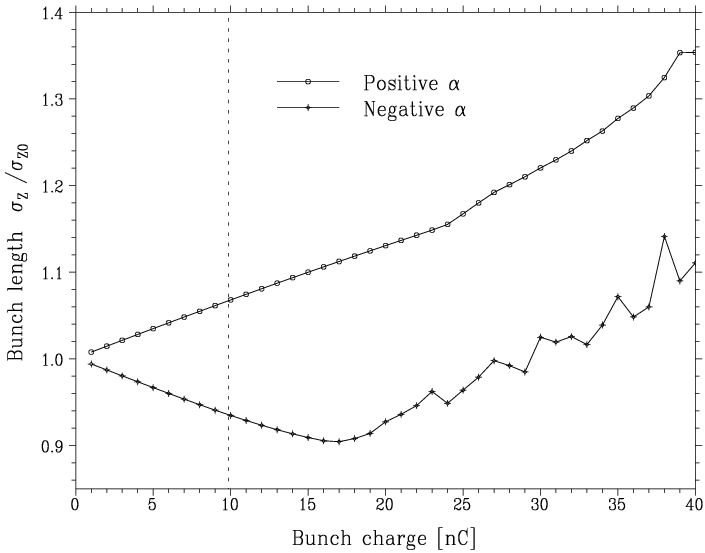
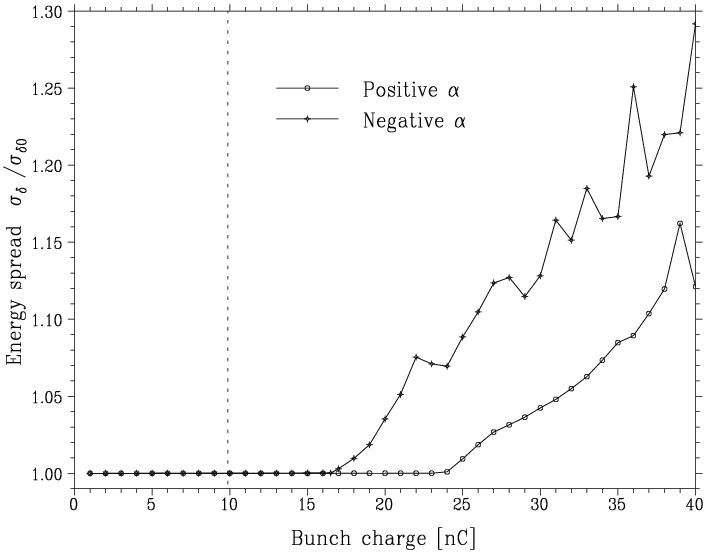
We made the same stability analysis for a negative momentum compaction factor, where we assume that the absolute value is the same as the positive case. The resulting bunch length and energy spread are shown in Figs. 70 and 71 with the crosses (). With the negative momentum compaction factor, the threshold charge is , i.e., smaller than the positive case. Although the bunch length will be a little shorter than the design value below the threshold, this is due, not to the CSR, but to the resistive wall wakefield instead.
Based on these studies, we conclude that the bunches in the Super LER will not be affected by CSR. The instability threshold for the bunch charge is , which is about times larger than the design value; the margin is enough to avoid the microwave instability. For the design bunch charge, bunch lengthening due to CSR is small; CSR will not be a concern in the present LER design.
With negative momentum compaction, the threshold charge will be smaller than in the positive case, although it still has some margin with respect to the threshold. Negative momentum compaction seems to be interesting, since the bunch will be somewhat shorter than in the positive case. However, since the Super Factory does not require short bunches because of the proposed crabbed waist collision, a design with negative momentum compaction may not be a practical scheme.
8 Transverse Multibunch Stability
In the transverse plane, the coherent multibunch growth rate is dominated by the resistive wall impedance (we do not concern ourselves in this section with two-stream-type instabilities). The transverse HOMs in the RF cavity are sufficiently well damped that their growth rates are significantly smaller. The resistive wall impedance may be estimated by the following formula:
| (31) |
where is the skin depth, which is proportional to the square root of the conductivity of the chamber wall. Figure 72 shows the frequency dependence of for copper, aluminum and stainless steel, the most common vacuum chamber materials, for an aperture radius of 4.5. As can be seen, copper and aluminum have similar impedance whereas stainless steel is significantly worse. We will therefore avoid using stainless steel for the vacuum chambers. In principle, a larger aperture radius could be chosen. However, since magnet (especially quadrupole) costs scale proportional to the aperture and the PEP-II magnets are to be reused in Super, the dimensions used here are reasonable.
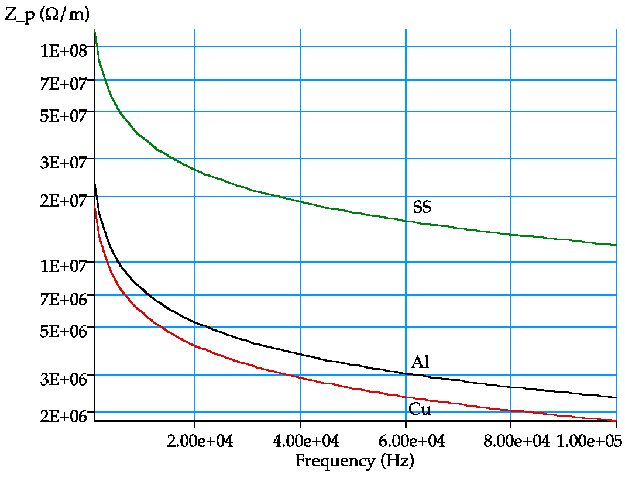
Experience at PEP-II indicates that the actual growth rate for transverse instabilities is close to 1/ms, several times larger than originally estimated. However, this can be damped by the transverse feedback system. Practically all of the growth occurs in low-lying modes. At Super, avoiding stainless steel chambers will help keep the impedance lower than that of the PEP-II vacuum system. However, we use the PEP-II experience to estimate parameters for the Super transverse feedback systems. To control a maximum transient of 1, we require about 1.5 integrated gradient, or about 50 amplifier power for the 0.63 long, 4.5 aperture-radius stripline kickers used at PEP-II, consistent with the 150 amplifiers per electrode. These kickers and amplifiers are suitable for the 238 bunch frequency of the nominal Super parameter set.
For the upgrade parameters, the bunch frequency doubles to 476, requiring kickers of 0.315 length. Everything else remains the same, except the voltage and bandwidth need to double and the amplifier power quadruple. The resulting hundreds of watts in a bandwidth of almost 500 are not straightforward to obtain in commercially produced amplifiers. Ways to reduce the requirements include higher functions at the kicker and smaller kicker apertures, e.g., increasing from 25 to 75 and reducing the kicker aperture radius to 3.75 would just about compensate for the shorter length, thus maintaining the power requirement of about 100. The increased bandwidth requirement is not affected by these changes. However, growth rates at the high frequencies will need to be evaluated, as they may be much smaller, and therefore require less power to control.
An issue requiring further study is the level of noise that can be tolerated in the transverse feedback systems. Fundamentally, the amplitude growth due to noise should be significantly less than the damping. Given the extremely small beam size, especially in the vertical plane, frontend noise and quantization noise from the digital portions of the system can spoil the equilibrium emittance of the beam. This issue is complex and requires further study to quantify these effects and understand the ramifications for the transverse feedback system for Super.
9 Electron Cloud Instability
Analytic approach
A single-bunch instability is caused by a short range transverse wakefield induced by the electron cloud [79]. The wakefield is analytically estimated by a simple model: i.e., the beam and an electron cloud having the same transverse size interact with each other. We will focus on the vertical instability with this treatment. The wakefield is represented by a resonator model. The resonator frequency () corresponds to oscillation frequency of electrons in the beam field,
| (32) |
where and are the beam line density in a bunch and the transverse beam sizes, respectively, is the classical electron radius and is the speed of light. The frequency in the horizontal plane for a flat beam is low.
The wakefield is expressed by
| (33) |
where
| (34) |
The density of the electron cloud , which is the local line density near the beam, is related to the electron volume density via , where is the enhancement factor due to the cloud size. The wake force can be calculated by a numerical method [79]. is 2–3 for a sufficiently large cloud compared to the beam size. characterizes damping of electron coherent motion due to the nonlinear interaction with the beam: it is estimated to be 5–10 for a coasting beam by the numerical method. is reduced by other effects, such as variations of beam charge density as a function of and beam size as a function of , which induce a frequency spread of and make it difficult to estimate an accurate value.
The electron phase advance in the bunch, , is an important parameter for the instability characteristics. A large phase advance helps Landau damping, but induces a strong cloud pile up and pinching near the beam, with the result that increases. The wake force, with a range characterized by , is efficient only inside the bunch with a length, ; i.e., the effective value is the minimum of the true value and .
The Keil-Schnell-Boussard criteria for the transverse wake force, which is based on coasting beam model, gives the threshold of the fast head-tail instability. The threshold cloud density for a given bunch intensity is expressed by
| (35) |
where and are average function and synchrotron tune, respectively. For finite chromaticity (), is replaced by .
The threshold value of the electron cloud density is estimated from Eq. 35 to be,
| (36) |
for Super, where . The threshold density is given for and .
Numerical simulation
Although the wakefield approximated by the resonator model permits us to study the instability with a simple analytic formula, the estimation of the threshold includes factors, such as and , where there is some uncertainty in determining an appropriate value. Since is related to pinching, one could choose . A value of larger than will not help. These uncertainties are removed using tracking simulations [80, 81, 82].
We report on simulation results using a strong-strong code, named PEHTS [82]. A bunch and an electron cloud are represented by macro-particles, and the interactions between them are determined by solving a two-dimensional Poisson equation using the particle-in-a-cell method.
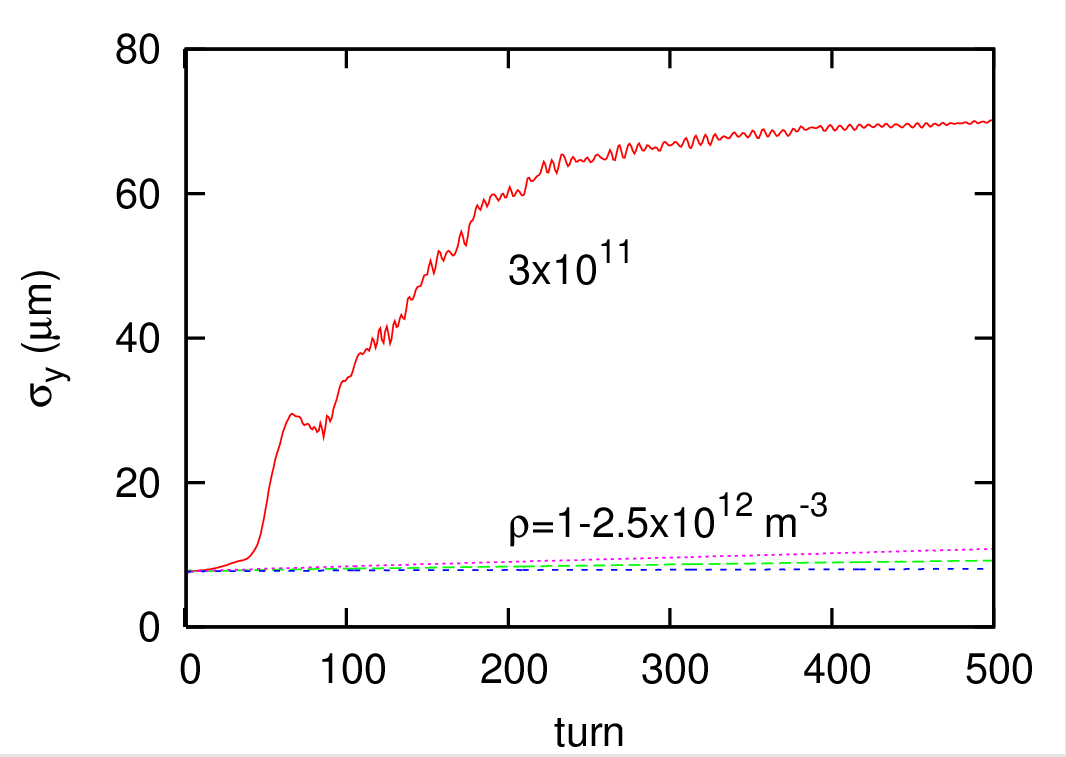
The interaction between beam and cloud is evaluated at eight positions around the ring, where the function is uniform. Figure 73 shows emittance growth due to the fast head-tail instability caused by the electron cloud effect in the Super ring. Each line shows an emittance growth for various cloud densities. The threshold density is determined by the density at which the growth starts. From this numerical simulation, we determine that the instability starts between and .
Figure 74 shows a snapshot of the beam and cloud centroid oscillation amplitude, as well as the vertical beam size, as a function of the bunch length, from a 60-turn simulation at an above threshold density . The amplitude of beam-cloud coherent motion is similar to the increase in vertical beam size. We conclude that the fast head-tail instability is dominant at these bunch densities. The coherent motion is smeared, due to the nonlinear beam-electron cloud interactions, and the amplitude is reduced after 300 turns. This behavior has been observed in experiments at KEKB [84], where a sawtooth coherent instability arises.
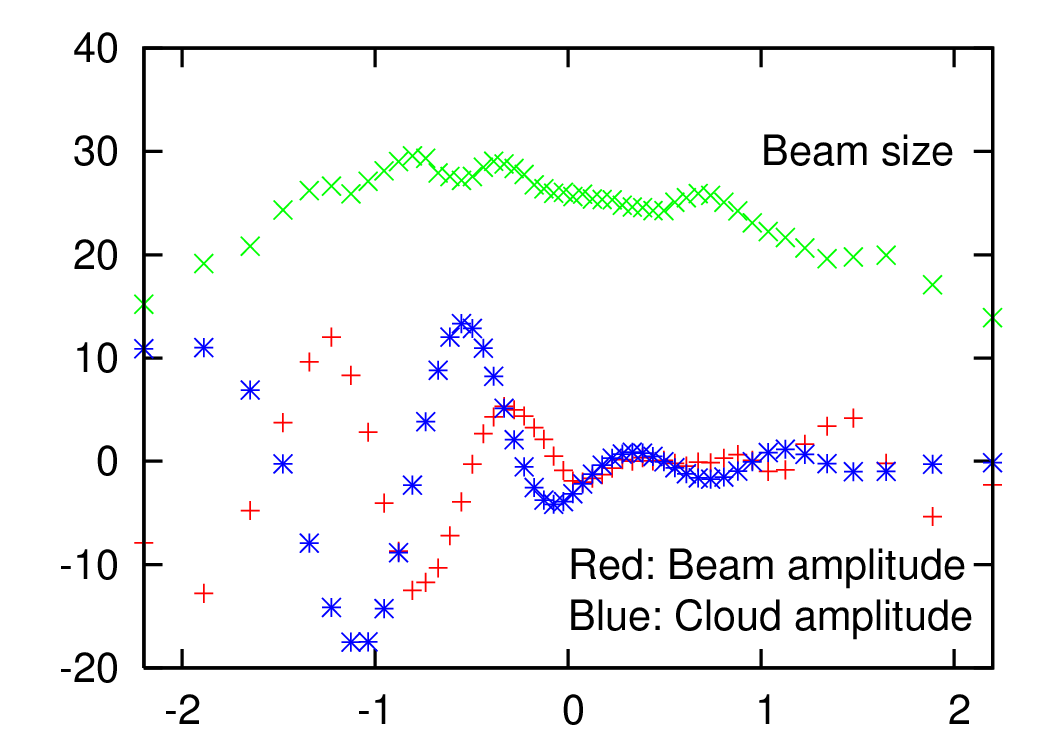
The analytical estimate can be compared with the threshold value given by simulation,
| (37) |
The density given by the simulation is systematically lower than the analytic estimate for a very low emittance ring, as already seen for the ILC Damping Ring [85]. We believe that the lower threshold density in the simulation is caused by pileup and pinching of electrons due to the attractive force of beam. The characteristic constant for the attractive force is the electron phase advance in the beam, . In the KEKB and PEP-II Factories, where the phase advance is far lower than for the ILC Damping Rings, the analytical estimate is in good agreement with the simulation.
Electron cloud density
Positrons create photons with a line density /meter for the Super ring. We assume that 99% of these photons are absorbed in the antechamber slot, and the remaining 1% create photoelectrons with a quantum efficiency of 10%. With these assumptions, positrons create photoelectrons with a line production density per positron per meter. The photoelectrons stay in the chamber for 20–40 or 10–20 bunch passages. Such an estimate can be obtained, for example, from an average electron velocity of –/s and a chamber size of 0.05–0.1. This is the duration of the electron build-up time, when multipactoring is not dominant. The amplification factor (), defined as the number of stored electrons normalized to the produced number of electrons, is the ratio of the dwell time (build-up time) and the bunch spacing, i.e., –20.
The electron cloud density can be estimated as
| (38) |
If the photon absorption in the antechamber is less than 80–90%, electrons created by photoemission will exceed the threshold density for the single bunch instability.
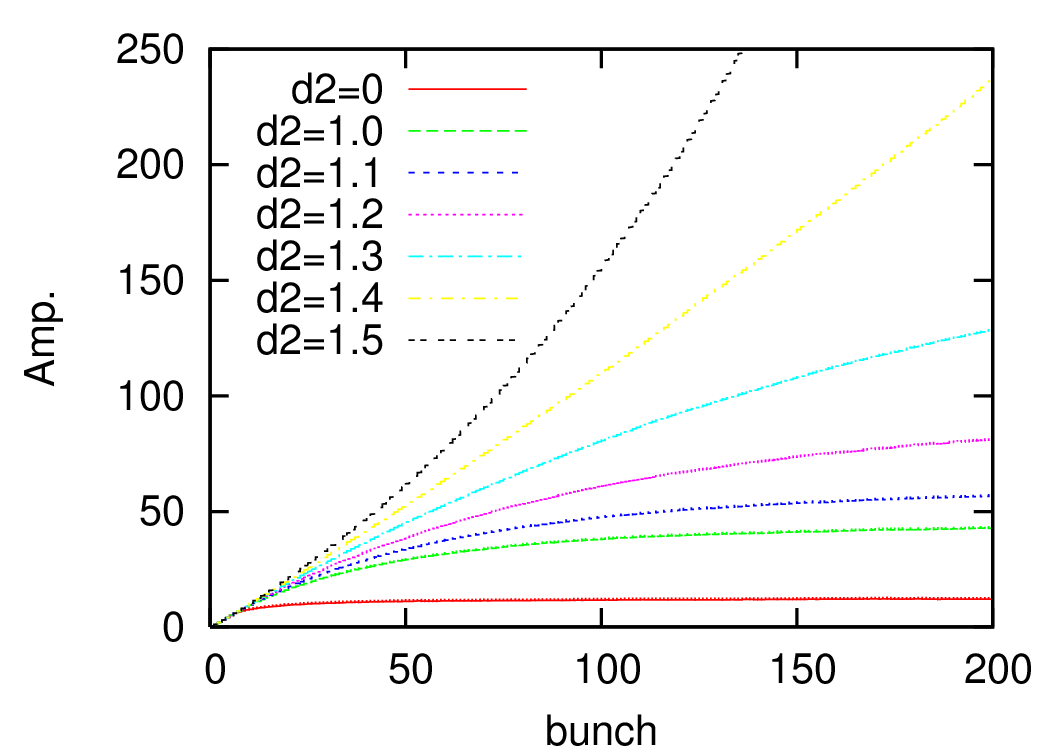
The amplification factor increases due to multipactoring of electrons. Figure 75 shows the amplification factor obtained from a simulation of electron cloud build up. The limit of the amplification is . For no secondary electrons, an amplification of 13 is predicted. Increasing the secondary emission rate, the amplification factor increases. From this simulation, the secondary emission rate should be less than .
10 Electron Cloud Remediation Techniques
Recent simulation results for electron cloud build-up in the Super positron ring are discussed here, assuming beam parameters similar to those of the ILC Damping Ring, but adopting a shorter bunch spacing [88]. Possible remedies for the electron cloud formation considered recently include clearing electrodes and vacuum chamber grooves [89, 90]. Our simulations show that the insertion of clearing electrodes in the vacuum chamber is indeed a extremely powerful way to suppress electron cloud formation. We will describe the effect of clearing electrodes in the dipole magnetic field regions and the chamber layout.
Electron cloud build-up and clearing electrode effect
We have used the simulation code POSINST to evaluate the contribution to the electron cloud build-up in the arc bends of Super.
The KEKB and PEP-II Factories have adopted external solenoid fields to mitigate the electron cloud effect in field-free regions, which constitute a large fraction of the rings [91, 92]. The Super rings typically do not have long field free regions. Over much of the ring, the beam pipe is surrounded by magnets, such as wigglers and dipoles, where large electron cloud densities may develop. In magnetic field regions, external solenoid fields are not effective in suppressing the build-up of the electron cloud. Thus, we have focused our simulations on the build-up of an electron cloud in the arc bend regions.
To remove most of the synchrotron radiation emitted in the arc sections, we have assumed a vacuum chamber with an antechamber design. For these preliminary simulations, we have assumed the same bunch population of particles per bunch but a reduced bunch spacing of 1.5 in comparison with the ILC DR (6.154). Results for the electron cloud build-up are shown in Fig. 76 and 77.
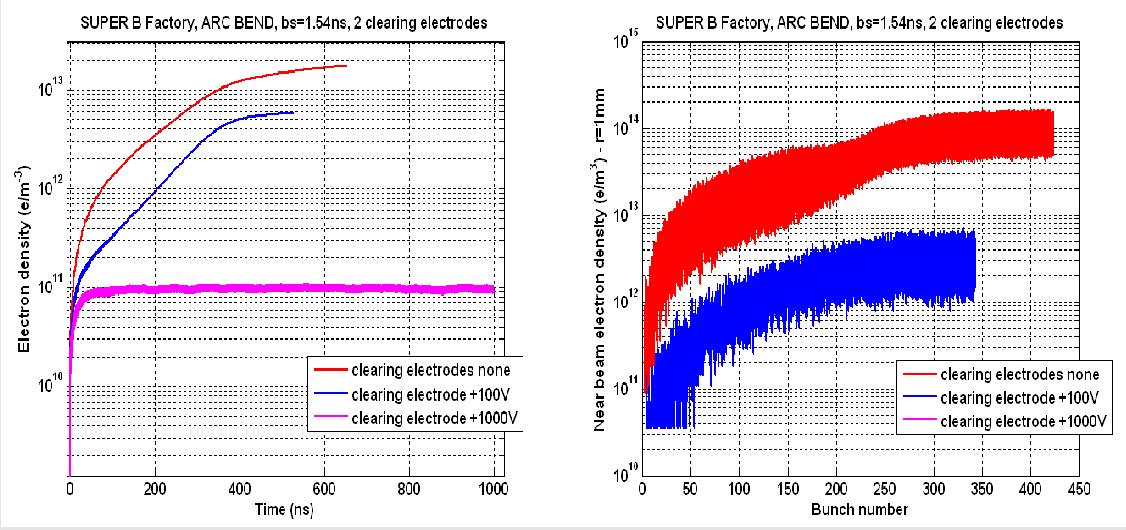
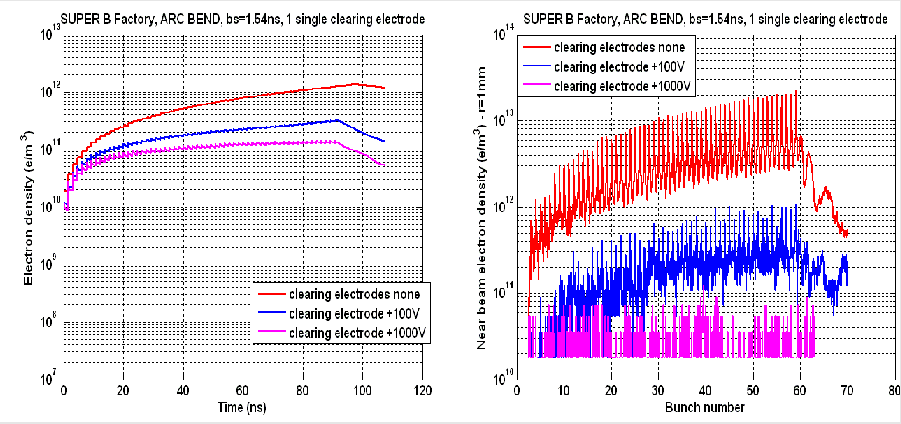
To mitigate the formation of an electron cloud, we have also simulated the effect of clearing electrodes installed in the bend vacuum chamber, and extending along the longitudinal direction of the magnet. The electrodes are biased with a positive potential. A sketch of a possible clearing electrode configuration is shown in Fig. 78. In a bend or wiggler magnet, the electrodes can be arranged along the top and bottom, since the electron cloud forms mostly along stripes directed along the vertical magnetic field lines [87, 93]. The effect of the electrodes is to compensate, on average, for the electric field from the positron bunch, which tends to attract the electrons to the center of the chamber. The electrons at the wall are first accelerated to the center by the bunch, and then accelerated back to the surface by the electrodes, during the time interval between bunches.
The effect of the two clearing electrodes is shown in Fig. 76. The average cloud chamber density and the central cloud density are plotted on the left and right side of the figure, respectively, for different electrode bias potentials. A bias voltage of 1 is sufficient to suppress electron cloud formation and drastically reduce the central cloud density near the beam. The effect of applying a potential to only one clearing electrode, rather than two, is shown in Fig. 77. A single electrode is also very effective in suppressing electron cloud formation.
These preliminary simulations show the effect of the clearing electrode suppression in Super, although with beam parameters (bunch population and bunch spacing) that differ from the Super configuration. Future simulations will be performed with updated parameters. Clearing electrodes have been proposed for the ILC DR and LHC magnetic field regions. An extensive R&D program is ongoing to test their effect with operating accelerators [94, 95].
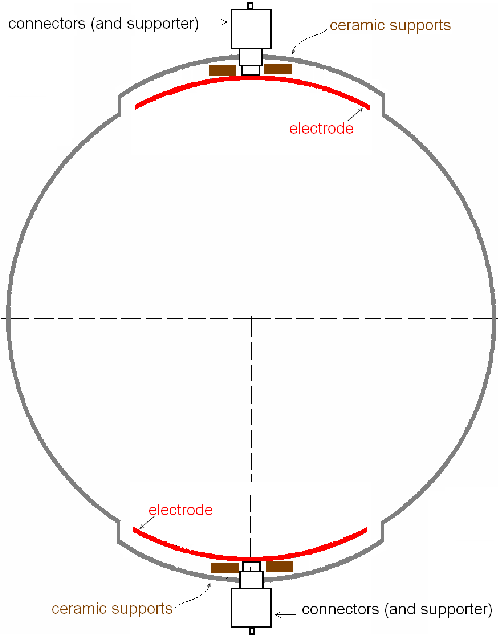
11 Fast Ion Instability
Model
We consider CO+ ions as the instability source, because the major components of residual gas in vacuum systems are CO and H2, and the ionization cross-section of CO is 5 times higher than that of H2. The ionization cross-section is m-2 for CO at the electron beam energy, . We assume that the partial pressure of CO gas is . The number of ions created by the electron beam with a population is expressed by
| (39) |
In our case for and .
We investigate ion instabilities for various bunch filling pattern in Super. A simulation method based on the model shown in Fig. 79 is used. Ions are represented by macro-particles, and each bunch is represented by a rigid transverse gaussian macro-particle. The beam size of the bunch is fixed, as determined by the emittance and function, and only dipole motion is considered.

Beam-ion interaction is expressed by the Bassetti-Erskine formula [86] for a beam with gaussian distribution in the transverse plane. The equations of motion for electrons and ions are expressed as
| (40) | |||||
| (41) |
where the suffixes and denote the ion and electron, respectively. and are masses, and and are their number. and are the Lorentz factor of the beam and the classical electron radius, respectively. is the Coulomb force expressed by the Bassetti-Erskine formula. These consist of differential equations, where each electron couples to the motion of all ions, and each ion couples to the motion of all electrons.
It is easy to solve the equations simultaneously with a numerical method [83]. The structure of the bunch train and function variation are also taken into account with this approach. The effect of a bunch-by-bunch feedback system is included in the simulation. The feedback system has a damping time of 50 turns and fluctuation of . This gain is rather conservative with present technology.
Simulation of ion instability
The simulation gives the position and momenta of every bunch, turn by turn. Figure 80 shows the vertical position of every bunch after 1000 turns. We use as filling parameters the bunch population (), the bunch spacing (), the number of bunches in a train (), the number of trains (). Gaps between trains are simulated for three cases, and . In the figure, the gap is removed: i.e., at 1–50, 51–100 etc. are the vertical bunch positions of the first, second etc. trains, respectively. The amplitude of the head of the first train is exactly zero, because there is no ion effect, and the amplitudes of the first 50 bunches do not depend on the gap length. Those of the second, third etc. trains are not zero, and depend on the gap length. Some ions remaining after the passage of previous trains affect the head part of the subsequent trains. The maximum amplitude is saturated for all trains at . This means that the gap length is efficient for clearing the ions. On the other hand, the maximum amplitudes increase along trains for ; i.e., the gap length is not sufficient, and ions are built up.
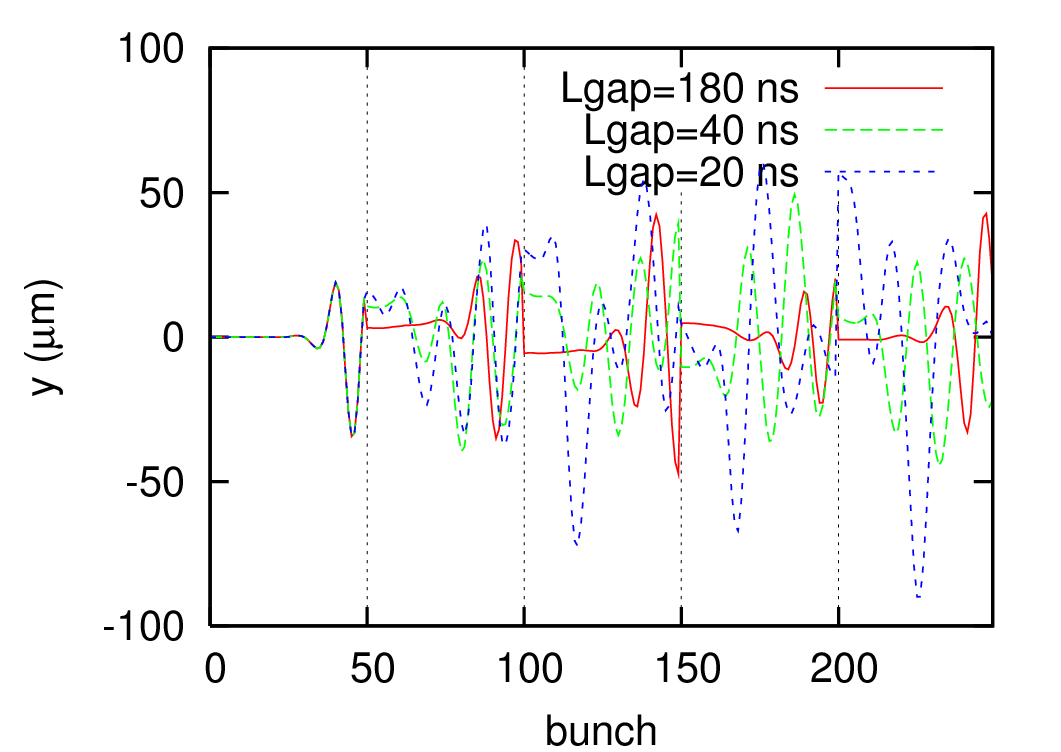
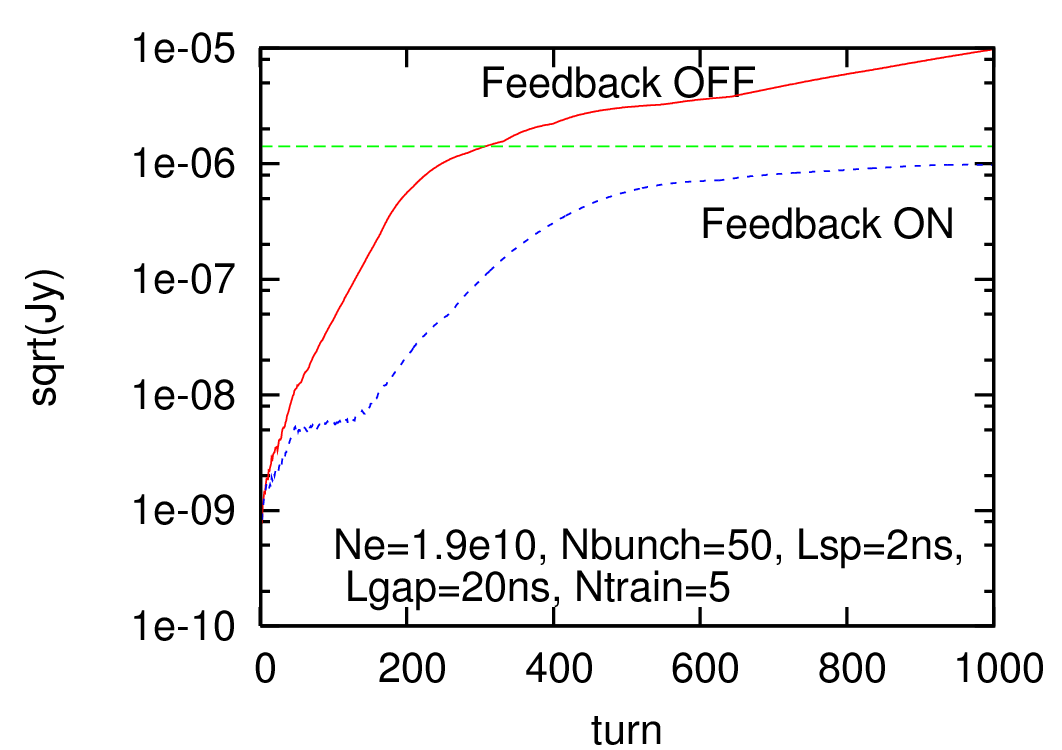
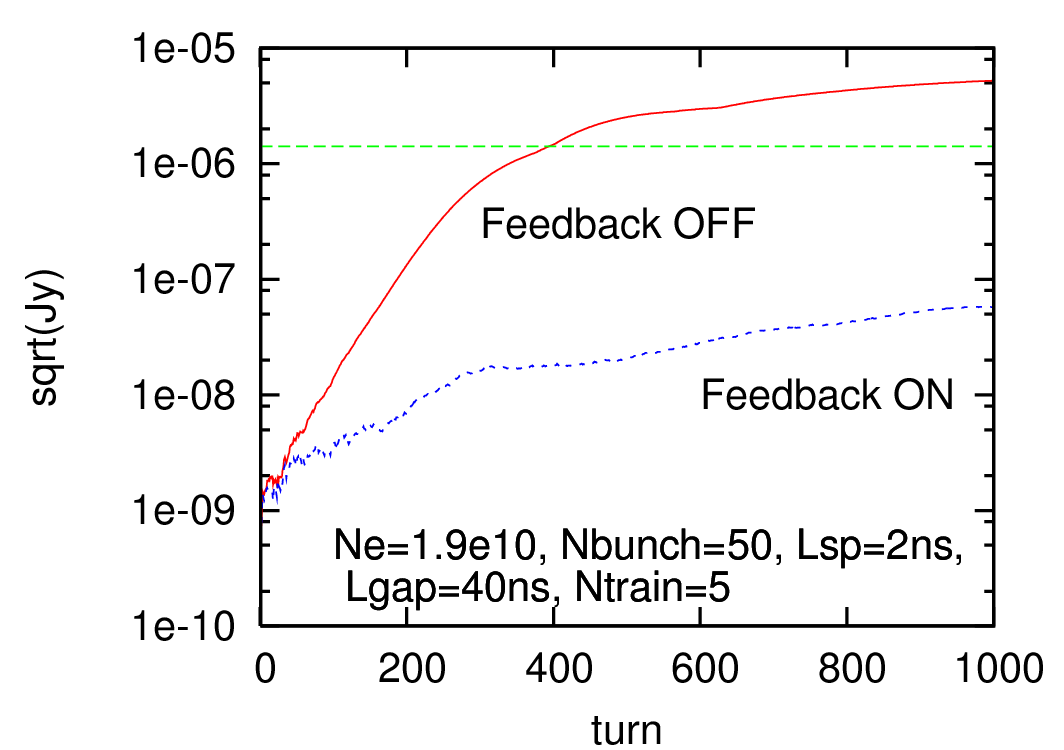
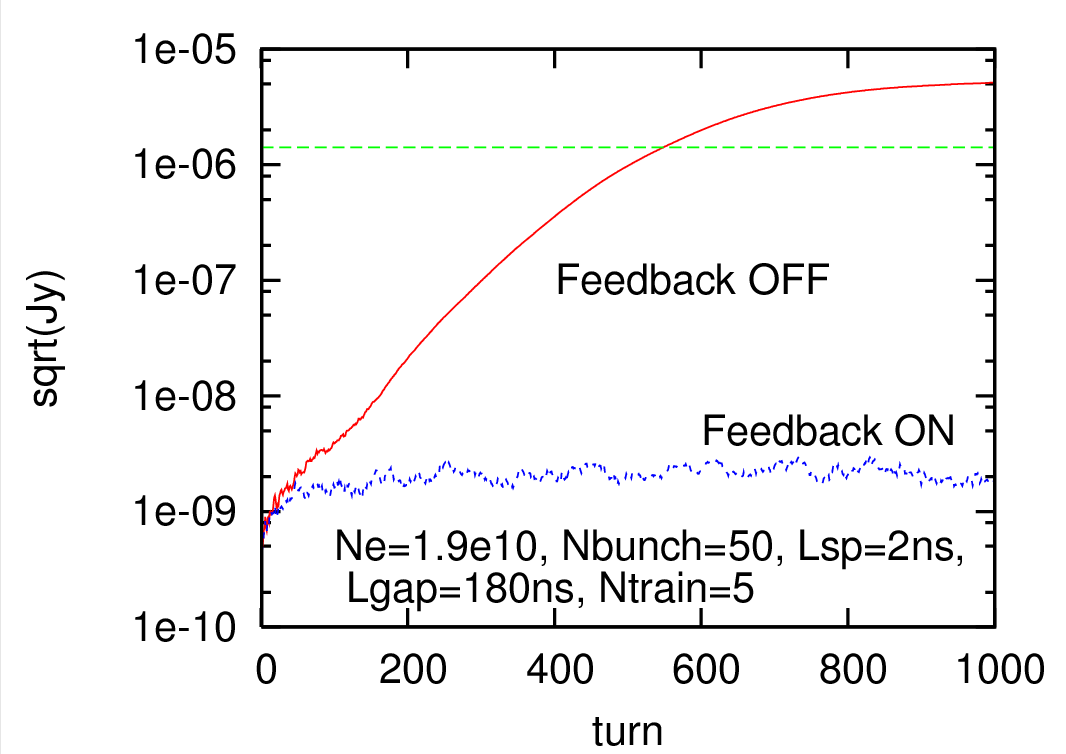
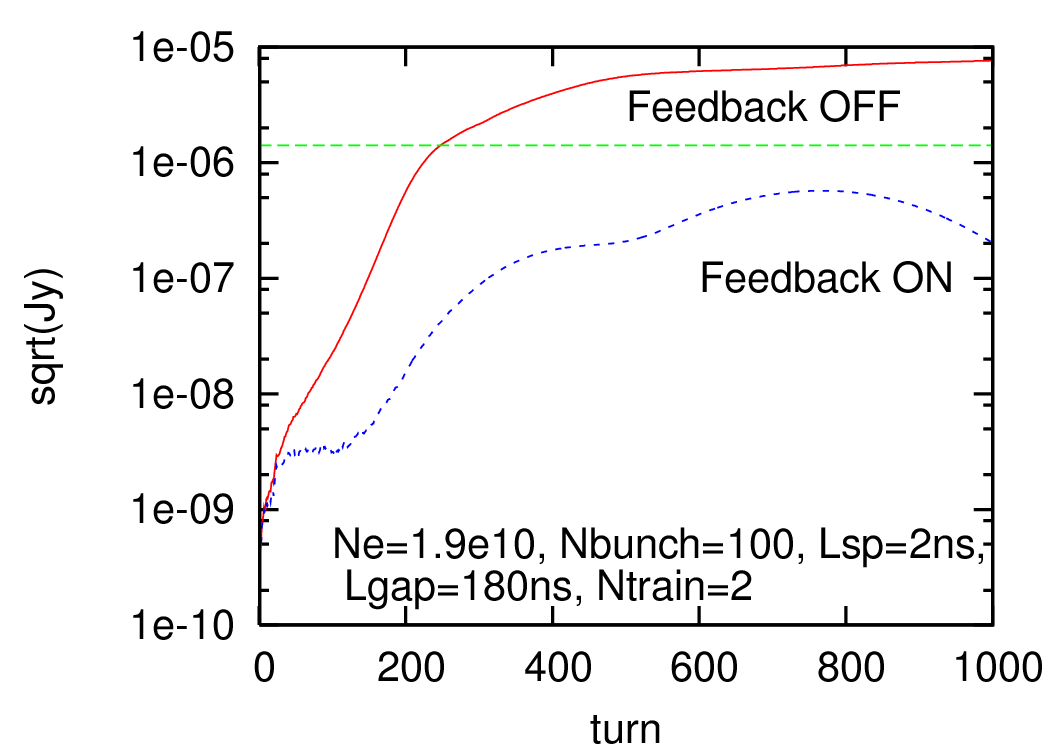
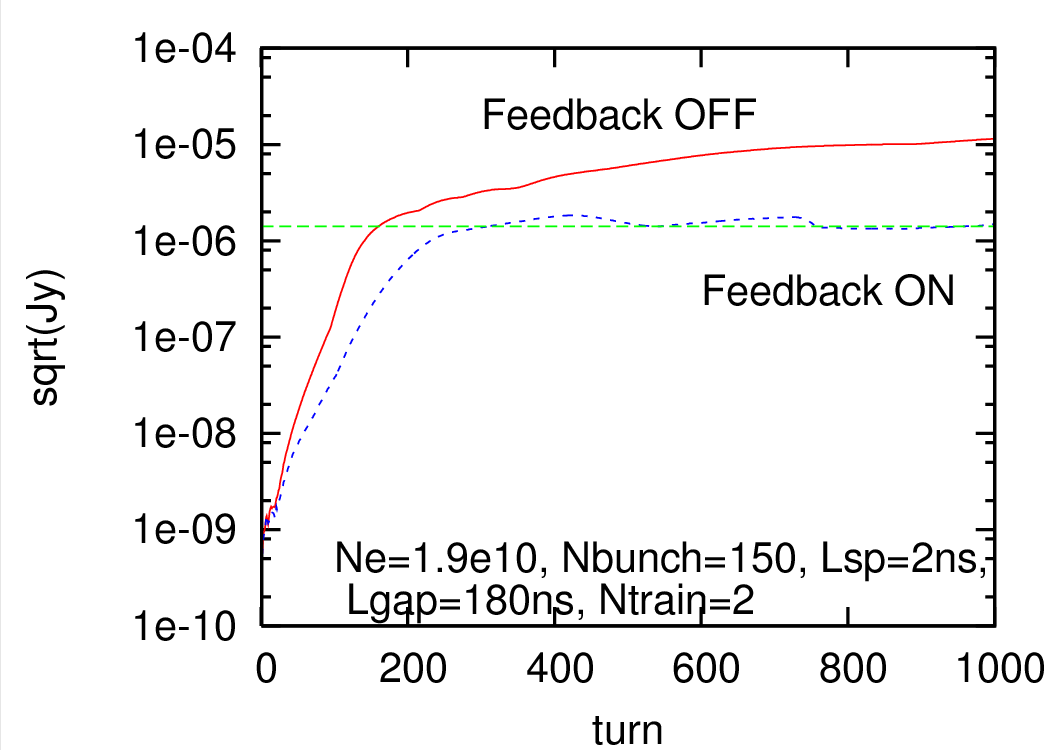
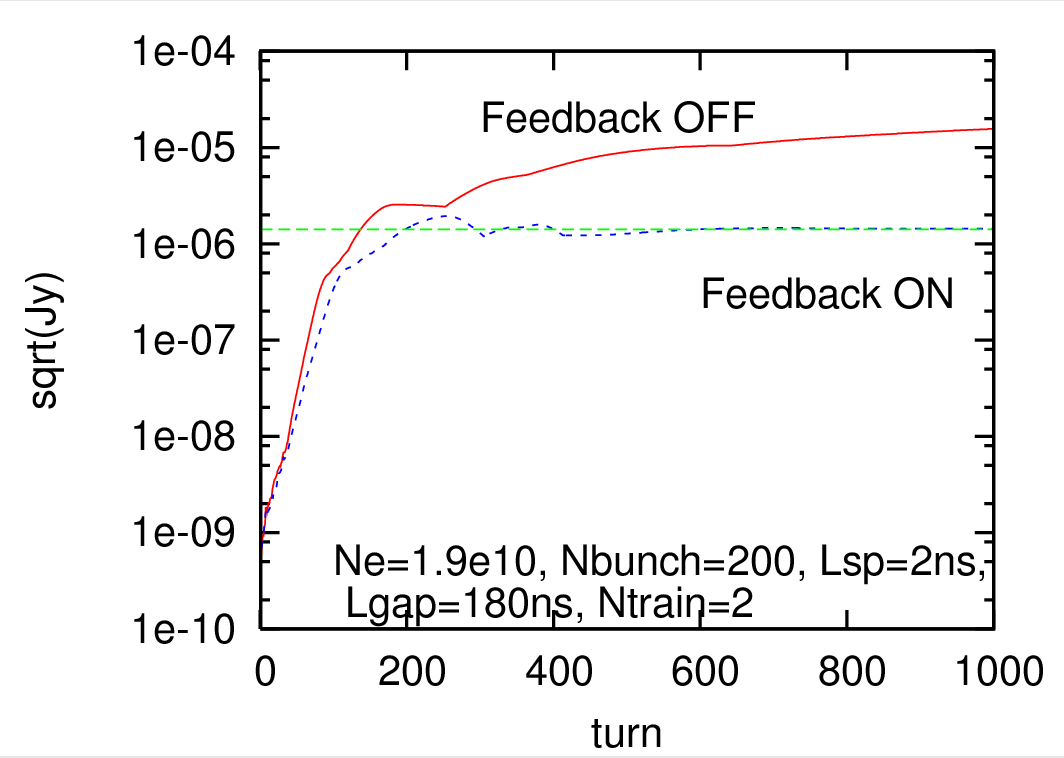
The maximum amplitude for all bunches, , is obtained turn-by-turn from the simulation. Figure 81 shows the evolution of with turn number. The red and blue lines show the evolution with and without the bunch-by-bunch feedback system, respectively. From top to bottom, the amplitude growth is shown for the three gap lengths, , 40 and 180. Beam oscillations are suppressed by the feedback system for , while considerable residual oscillation remains for .
Figure 82 shows the variation in amplitude growth with the number of bunches in a train (, 150, 200), where . The instability for is suppressed by the feedback system, but it is not suppressed for longer trains, .
In summary, the bunch filling pattern for Super is and (20 buckets). In this filling pattern, secondary efficiency should be less than the required to keep below electron cloud instability. These results depend on various conditions, such as chamber geometry, magnetic field, and vacuum pressure. Further studies should be done as the design is updated.
7 Magnet Systems
1 Introduction
The Super rings will be built with room-temperature magnets. The lattice has been designed to take maximum advantage of the potential availability of the PEP-II ring magnets without compromising performance. This is possible, since the energies and the circumference of the PEP-II rings are quite comparable to those of Super. The Super HER magnet requirements are summarized in Table 36, while the LER requirements are summarized in Table 37.
| Dipoles | Length | Max. Field | Min. | Quantity |
| (Location) | (m) | (T) | (m) | |
| Arc | 5.4 | 0.168 | 139 | 144 |
| Final focus | 5.4 | 0.212 | 110 | 16 |
| Soft bends | 2 | 0.053 | 444 | 2 |
| Quadrupoles | Length | Max. Gradient | Int. Strength | Quantity |
| (Location) | (m) | (T/m) | (T) | |
| Wiggler | 0.5 | 21.7 | 10.9 | 34 |
| Arc | 0.56 | 17.0 | 9.5 | 213 |
| Arc, final focus. | 0.56 | 20.0 | 11.2 | 30 |
| Final focus | 0.56 | 32.4 | 18.1 | 2 |
| Straight section. | 0.73 | 16.6 | 12.1 | 138 |
| Sextupoles | Length | Max. Strength | Int. Strength | Quantity |
| (Location) | (m) | (T/m2) | (T/m) | |
| Arc | 0.25 | 100 | 25.0 | 216 |
| High gradient | 0.25 | 350 | 87.5 | 10 |
| Final focus | 0.6 | 320 | 192.0 | 4 |
| Dipoles | Length | Max. Field | Min. | Quantity |
| (Location) | (m) | (T) | (m) | |
| Arc | 0.45 | 0.592 | 22.5 | 144 |
| Arc | 0.75 | 0.469 | 28.4 | 144 |
| Final focus | 5.4 | 0.121 | 110 | 16 |
| Soft bend | 2 | 0.03 | 444 | 2 |
| Quadrupoles | Length | Max. Gradient | Int. Strength | Quantity |
| (Location) | (m) | (T/m) | (T) | |
| All | 0.43 | 9.74 | 4.1882 | 341 |
| Wiggler | 0.5 | 6.59 | 3.295 | 36 |
| Final focus | 0.56 | 10.36 | 5.8016 | 42 |
| Sextupoles | Length | Max. Strength | Int. Strength | Quantity |
| (Location) | (m) | (T/m2) | (T/m) | |
| Arc | 0.25 | 55 | 13.75 | 218 |
| Final focus | 0.25 | 192 | 48 | 8 |
| Final focus | 0.6 | 180 | 108 | 4 |
In order for PEP-II magnets to be suitable for Super, the magnet apertures must be sufficient, but not too much larger than needed to avoid excessive power consumption. At Super, with its small beam sizes, the apertures will be dominated by impedance and vacuum conductance considerations, rather than the size of the beams, and the apertures required will be similar to those of PEP-II. Thus, there is a good match between the size of the PEP-II magnet apertures and the anticipated Super requirements.
Table 38 lists the magnet inventory of thePEP-II HER. In many cases, these magnets are capable of higher field strengths than used operationally at PEP-II, since they were originally designed for the 18 PEP-I rings. This has been taken into account in Table 38.
| Dipoles | Length | Aperture | Field | Int. Strength | Current | Quantity |
| (Location) | (m) | (mm) | (T) | (Tm) | (A) | |
| Arc | 5.4 | 60 | 0.27 | 1.45 | 950 | 194 |
| IR Soft bends | 2 | 0.092 | 0.184 | 170 | 6 | |
| Quadrupoles | Length | Aperture | Gradient | Int. Strength | Current | Quantity |
| (Location) | (m) | (mm) | (T/m) | (T) | (A) | |
| Arc | 0.56 | R 50 | 16.96 | 9.5 | 350 | 202 |
| Inj. sect. | 0.45 | R 50 | 11.11 | 5 | 200 | 4 |
| Straight sect. | 0.73 | R 50 | 17.53 | 12.8 | 350 | 81 |
| IR | 1.5 | 6.67 | 10 | 650 | 2 | |
| IR | 1.5 | 10 | 15 | 1150 | 2 | |
| Global skew | 0.3 | R 90 | 2.33 | 0.7 | 250 | 4 |
| IR skew | 0.2 | R 50 | 0.32 | 0.064 | 50 | 4 |
| IR skew | 0.3 | R 50 | 1.33 | 0.4 | 12 | 4 |
| Sextupoles | Length | Aperture | Strength | Int. Strength | Current | Quantity |
| (Location) | (m) | (mm) | (T/m2) | (T/m) | (A) | |
| Arc | 0.3 | R 60 | 210 | 63 | 400 | 104 |
| Correctors | Length | Aperture | Field | Int. Strength | Current | Quantity |
| (Location) | (m) | (mm) | (T) | (Tm) | (A) | |
| Arc X | 0.3 | 0.018 | 0.0054 | 12 | 96 | |
| Arc Y | 0.3 | 0.01 | 0.003 | 12 | 96 | |
| Straight | 0.3 | R 50 | 0.012 | 0.0036 | 12 | 91 |
The PEP-II LER magnet inventory is listed in Table 39. These magnets were built specifically for the PEP-II LER. In most cases, the maximum field was specified such that the PEP-II LER can reach 3.5 in energy.
| Dipoles | Length | Aperture | Field | Int. Strength | Current | Quantity |
| (Location) | (m) | (mm) | (T) | (Tm) | (A) | |
| Arc dipole | 0.45 | 63.5 | 0.93 | 0.42 | 750 | 192 |
| Straight BB+/- | 0.45 | 10 | ||||
| Straight BM…, BV… | 0.5 | 0.56 | 0.28 | 850 | 10 | |
| Straight, BC.. | 1.5 | 0.37 | 0.562 | 175 | 10 | |
| Quadrupoles | Length | Aperture | Gradient | Int. Strength | Current | Quantity |
| (Location) | (m) | (mm) | (T/m) | (T) | (A) | |
| Arc, Q58Al4 | 0.43 | R 5 | 9.5 | 4.1 | 160 | 196 |
| Straight Q58Al4 | 0.43 | R 5 | 9.5 | 4.1 | 160 | 127 |
| IR 2 Q58Cu4 | 0.43 | R 5 | 11.9 | 5.1 | 200 | 30 |
| Insertion QF2 | 0.5 | 13.6 | 6.8 | 1200 | 2 | |
| Insertion QD1 | 1.2 | (pm) | 2 | |||
| Insertion SK1 | 0.2 | (pm) | 2 | |||
| Skew quad | 0.2 | 2.6 | 0.52 | 12 | 15 | |
| Sextupoles | Length | Aperture | Strength | Int. Strength | Current | Quantity |
| (Location) | (m) | (mm) | (T/m2) | (T/m) | (A) | |
| Arc SF, SD1 | 0.25 | R 60 | 192 | 48.1 | 310 | 76 |
| Arc SD2 | 0.35 | R 60 | 245 | 85.6 | 500 | 8 |
| IR 2 | 0.25 | R 60 | 0 | 7 | ||
| Orbit correctors | Length | Aperture | Field | Int. Strength | Current | Quantity |
| (Location) | (m) | (mm) | (T) | (Tm) | (A) | |
| Arc X | 0.233 | 0.0365 | 0.0085 | 12 | 96 | |
| Arc Y | 0.312 | 0.0212 | 0.0066 | 12 | 92 | |
| Arc X wide | 0.012 | 12 | 4 | |||
| Straight | 0.3 | 0.0252 | 0.00755 | 12 | 104 |
2 Dipoles
The PEP-II HER dipoles have C-shaped yokes and 2.2 sagitta based on their design 165 bending radius. For Super, the bending radius for the main arc dipoles is 139 and the sagitta will increase to 2.6, which is close enough to the original value. For some of the dipoles in the final-focus region the bending radius is reduced to 110, but the increase in sagitta to 3.3 will be tolerable given the more than 5 total width for the good-field region and the fact that the magnets can always be centered on the average beam orbit. Figure 83 shows a sketch of a PEP-II HER dipole.
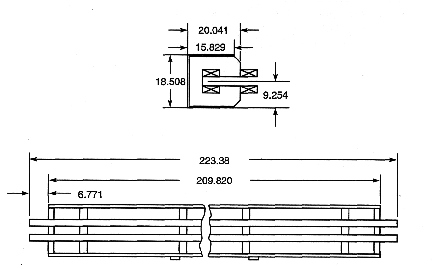
While the PEP-II HER dipoles are the original PEP dipoles, the magnets were completely overhauled and refurbished during construction of PEP-II, serialized, and mechanically and magnetically measured. The measurement data–, field harmonics at 0.9 Tm and gap height vs. –are available in the archives of the Magnetic Measurement Group at SLAC [96]. They have been in constant use since PEP-II commissioning began. Despite the high beam current, the radiation environment in the PEP-II arcs is actually quite benign, and no evidence for significant radiation damage to the magnet coils has been seen. We therefore, at present, see no need to re-measure or refurbish the dipole magnets, although each magnet coil will be carefully inspected for signs of aging. Comparing Tables 36 and 38 shows that the Super HER dipole magnet requirements, including the soft bends, are well satisfied, including a significant number of spare PEP-II HER dipole coils.
The 0.45-long PEP-II LER dipoles are box-type magnets. Because of their short length, there is no issue with the different sagitta at any reasonable bending angle. In Super the angle will be less than at PEP-II because of the added 0.75 dipole magnets. These long dipoles will be newly built, likely using the laminations cut for the existing PEP-II LER arc dipoles. It is also conceivable to rebuild some of the excess short dipoles, combining two into a 0.75 long unit; a similar conversion was done with PEP-I quadrupoles to create additional magnets for the PEP-II HER. The sixteen 5.4-long dipoles needed for the Super LER will be covered by left-over PEP-II HER dipoles. The PEP-II LER dipole magnets were built new at the time of PEP-II construction. They were measured at the factory at that time, however, an individualized set of measurements does not exist for each magnet. There is also a certain variation of field shape with excitation in these magnets. We therefore anticipate re-measuring each of the dipoles at the operating field for Super, before installation in the Super LER. As in case of the HER dipoles, however, there is no need to refurbish the PEP-II LER dipole magnets; a careful inspection should suffice. Figure 84 shows the cross section of the LER dipoles. There is significant space available in the horizontal plane to accommodate an antechamber for the vacuum system.
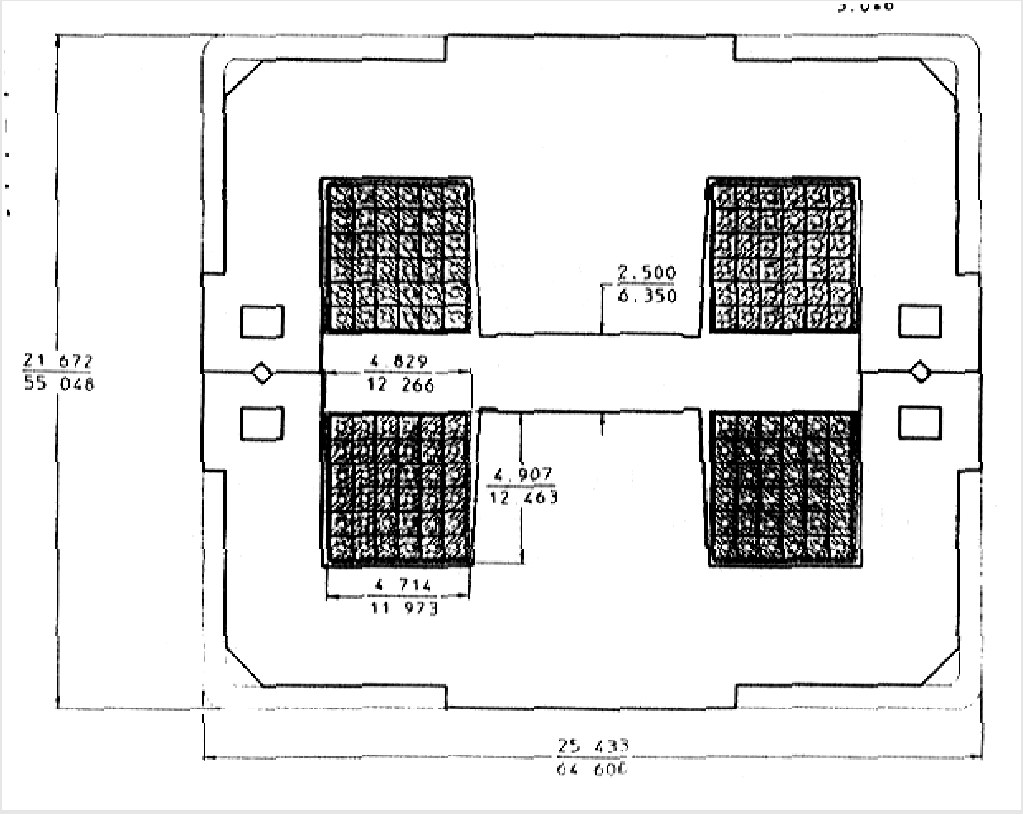
3 Quadrupoles
It is anticipated that most PEP-II quadrupoles will find use in Super. All of the 0.56 quadrupoles of the PEP-II HER will be used in the Super HER; in fact, more magnets are needed than exist. Some of the new quadrupoles will be of the same design as the exciting PEP-II HER quadrupoles, having similar field gradients. However, there are about 30 quadrupoles with gradients exceeding the specification for the PEP-II HER 0.56-long quadrupoles. These will be built using new designs optimized for the higher field requirement. Since these are DC magnets, matching of new and old magnets is straightforward. In the same way, an additional sixty 0.73-long quadrupoles have to be built.
For the 0.43-long Super LER quadrupoles the needs are covered by the existing PEP-II LER quadrupoles. The latter come in three different coil configurations with somewhat different maximum excitation, so care will be taken in matching the coil type to the requirements. In addition, over forty new 0.56-long quadrupoles are needed. While these can use the PEP-II HER lamination design, a modified coil design may be necessary to accommodate an antechamber for the vacuum system. Again, a complete audit trail exists for the measurements of the PEP-II HER quadrupoles, while for the PEP-II LER quadrupoles only a sparse data set is available. As a result, we will need to re-measure the PEP-II LER quadrupoles as well. Careful inspection of all coils will detect any sign of aging, and there is a significant number of spare coils available in case it is decided to replace some of the coils. There may, however, be cases of quadrupoles in Super being excited at higher current than in PEP-II. In these cases we will change the cooling circuits to connect all coils in parallel, thus minimizing the total temperature increase during operation. Figure 85 shows a cross sectional and side view of a PEP-II HER quadrupole, while Fig. 86 shows a PEP-II LER quadrupole.
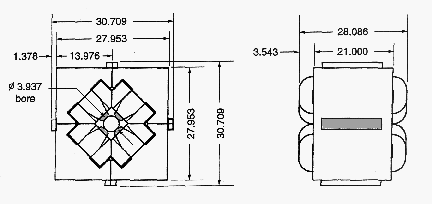
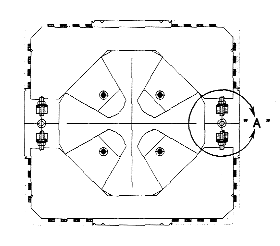
4 Sextupoles
Altogether, the two Super rings will use over 500 sextupoles, a little less than half of which exist in PEP-II. Additional magnets will be built using the original PEP-II lamination die. Since the sextupoles in the Super LER have less strength, we may use two different coil configurations optimized for the application. The 0.6-long sextupoles in the final focus will be new.
5 Correction Magnets
The basic orbit-corrector dipoles exist in three types for each ring: horizontal arc-type, vertical arc-type and straight-section type, which are mounted either as horizontal or vertical correctors around the chamber of circular cross section. Where prudent these magnets will be reused. However, the Super vacuum system will differ from that of PEP-II, which may prevent reuse of some of these magnets. Since the cost for orbit correctors is fairly modest, it appears prudent to avoid compromising the vacuum chamber geometry in order to reuse existing orbit corrector magnets. The same principle applies to other correction magnets, such as skew quadrupoles.
6 Field Quality
Field uniformity requirements for Super magnets will be determined following more detailed tracking studies. However, since the beam sizes are small and orbit excursions will have to be tightly controlled in order to preserve the small emittances, the beams do not sample field regions far from the nominal center line. We therefore expect the field uniformity tolerances of the PEP-II magnets to be sufficient for Super applications. The field uniformity of the PEP-II HER dipoles is shown in Fig. 87; the field harmonics of the PEP-II HER 0.56 quadrupoles magnets are shown in Fig. 88. Since we will have individual measurement data for each magnet, sorting algorithms will be employed as necessary to mitigate the effect of field differences between the magnets in a family, as was done for PEP-II.
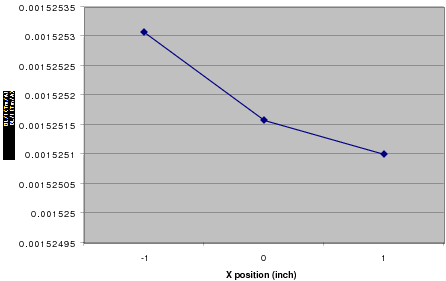
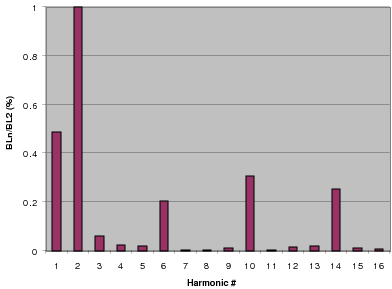
7 Power Conversion
The DC power supplies for the magnets represent a significant share of the overall cost of the magnet system. The approach taken in PEP-II is to power long strings of identical magnets with 500, 400 chopper units fed from a bulk power supply (one for each ring), which in turn is fed by a 480 ac line. Shorter strings (or “families”) are fed from smaller individual supplies operating on 208 or 480 ac feeds. All of these supplies are of relatively modern switching type and therefore, in principle, capable of being operated at the 50 ac frequency used in Europe (as opposed to the 60 used in North America) including the large bulk power supplies for the choppers [97]. While the details must worked out, reuse of components of the PEP-II magnet power system appears to be feasible.
8 Summary of Regular Lattice Magnets
Super magnet requirements are well within the performance envelope of the PEP-II magnets, and almost all PEP-II magnets, with the possible exception of specialty magnets such as the insertion quadrupoles, will be reused. Additional magnets will be built to existing designs wherever feasible. Only a limited number of Super magnet designs have no PEP-II counterpart and will be of a new design. Table 40 summarizes the magnet types and building needs.
| Type | Length | Required | Extant | Build | Design |
|---|---|---|---|---|---|
| (m) | for Super | at PEP-II | new | ||
| Dipole | 0.45 | 144 | 194 | 0 | |
| Dipole | 0.75 | 144 | 0 | 144 | PEP-II (lamin.) |
| Dipole | 5.4 | 176 | 194 | 0 | |
| Dipole | 2 | 4 | 6 | 0 | soft bends |
| Quadrupole | 0.43 | 341 | 353 | 0 | |
| Quadrupole | 0.5 | 70 | 0 | 70 | PEP-II or new |
| Quadrupole | 0.56 | 255 | 202 | 53 | PEP-II, new coil |
| Quadrupole | 0.56 | 32 | 0 | 32 | new (high field) |
| Quadrupole | 0.73 | 138 | 81 | 57 | PEP-II |
| Sextupole | 0.25 | 452 | 188 | 264 | PEP-II (2 coil configs.) |
| Sextupole | 0.6 | 8 | 0 | 8 | new |
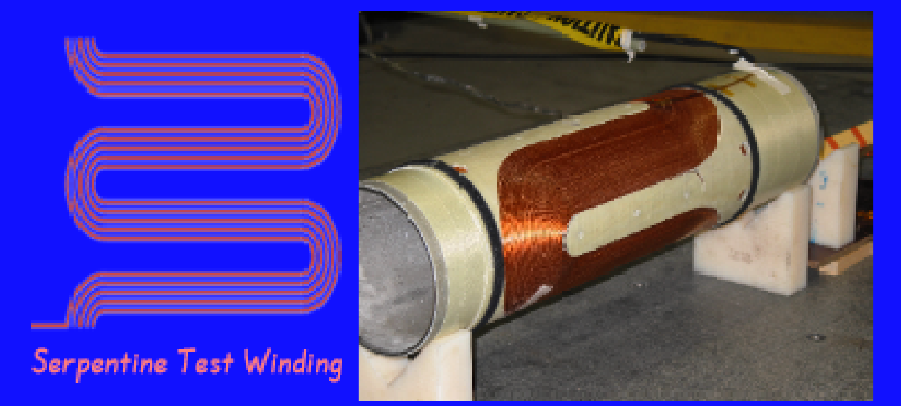
9 IR Quadrupoles
The IR QD0 magnet can be a permanent magnet as described in Section 2. The next IR quadrupoles must be compact, since we need to separate into two beamlines as soon as possible in order to reduce IR backgrounds. This suggests the use of superconducting quadrupoles, which can be constructed in a fashion similar to the IR quadrupoles built at Brookhaven Laboratory for HERA and BEPC-II [98]. This is also the choice for the ILC final focus. One possible version of the Super IR quadrupole design is shown in Fig. 89 and 90. This specific superconducting quadrupole design is 0.8 long and has a gradient of 25.8 T/m. The inner warm bore of the cryostat in this example is about 6 radius and the outer warm shell diameter about 20. Thus, the design has about 14 in radius, including the cryostat, to provide main quadrupole windings as well as solenoidal, skew-quadrupole, and dipole windings in a combined design. Other designs are also possible, and a study of alternatives is in progress.
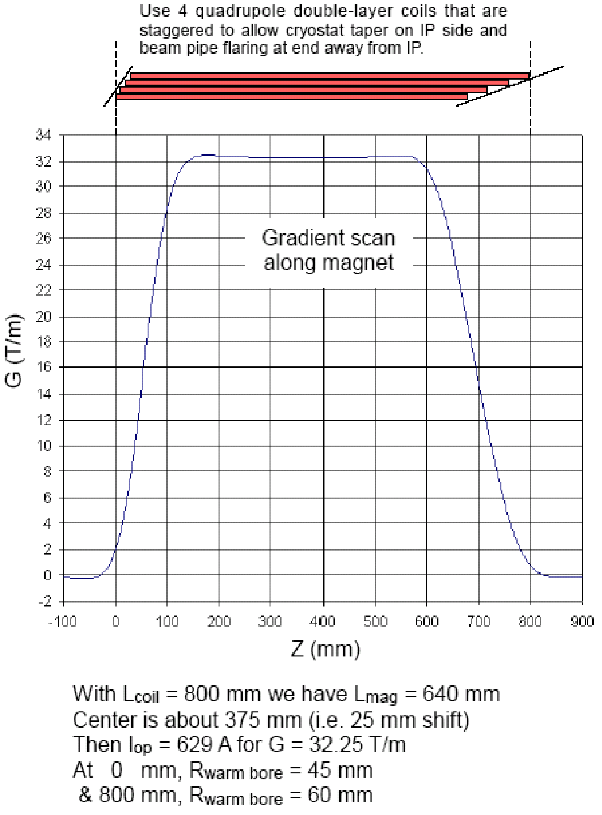
10 Permanent Magnet Damping Wiggler
The srong damping required for the Super rings will be provided by wiggler magnets. These will be constructed as permanent magnets in order to minimize energy consumption. In addition, we will use a wedge-shape pole-tip design to concentrate magnetic flux lines, thereby minimizing the volume of magnetic material. The field amplitude for each individual pole will be tunable at the level of about 400, using a design that provides for independent adjustment of individual poles. The wiggler parameters are shown in Table 41.
| Field | Pole gap | Period length | Transverse homogeneity |
| (T) | (mm) | (mm) | () |
Figure 91 shows the magnetic flux lines and the maximum field in the relevant parts of the wiggler. The maximum field in the iron yoke reaches 1.2–1.4, which is far from saturation. Figure 92 shows the transverse homogeneity of the wiggler field.
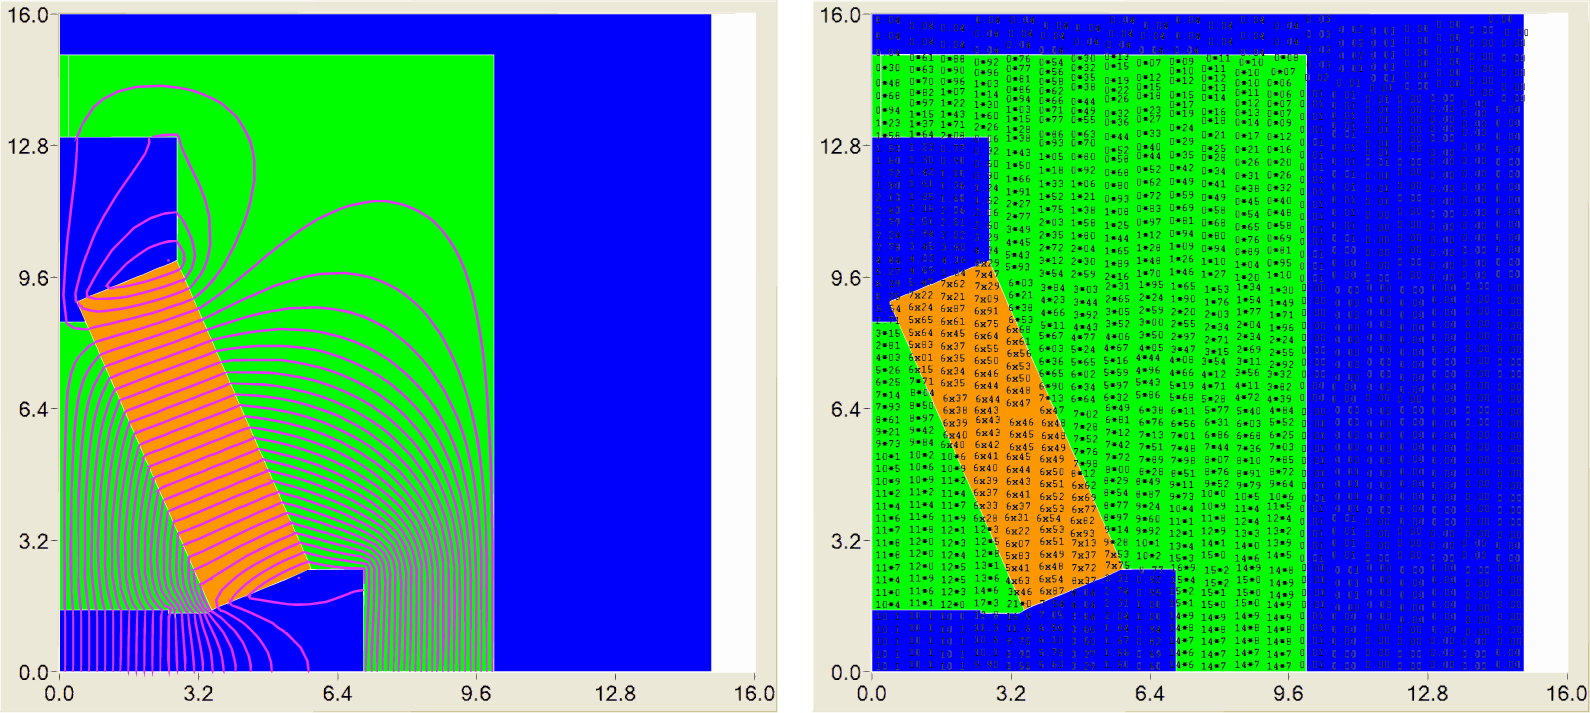
To achieve a uniform field profile in the longitudinal direction, a special magnetic shunt adjustment is foreseen between the pole and the upper part of the iron yoke (see lefthand plot of Fig. 93). This shunt expels some fraction of magnetic flux, allowing the field in the wiggler gap to be tuned (righthand plot).
Fig. 94 shows the longitudinal distribution of the magnetic flux and the longitudinal profile of the wiggler field. The permanent magnets, which are shown in Fig. 94 shield the magnetic field of adjacent poles, providing easy wiggler assemble and adjustment.
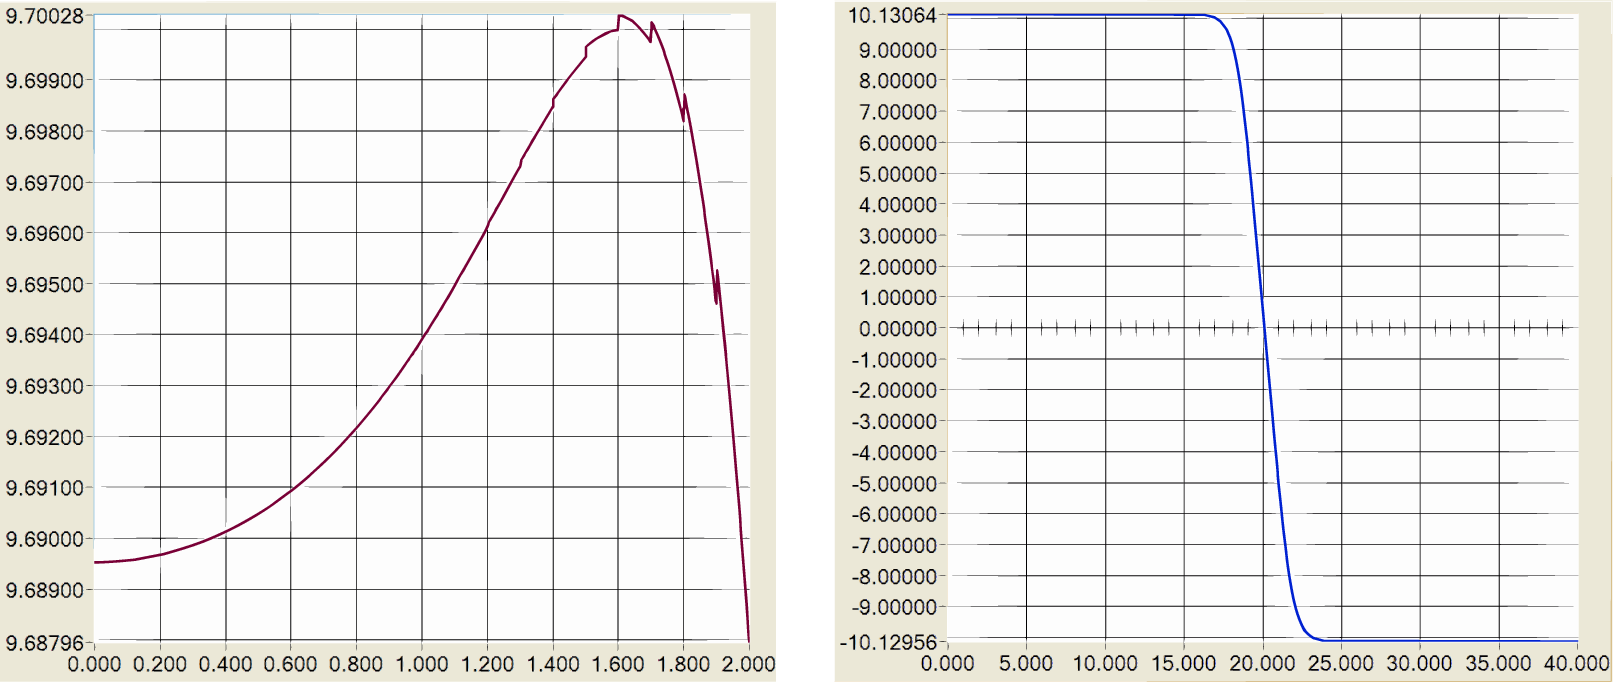
8 RF Systems
1 Parameters
The RF system provides the energy to the beam necessary to make up for synchrotron-radiation losses and—to a lesser extent—losses due to the loss factor of the RF system and the cavities. In addition to replenishing the beam energy, the RF system also provides longitudinal focusing, i.e., the RF voltage, together with the momentum compaction of the magnet lattice, controls the bunch length. For Super, the bunch length is about 6 in each ring at the operating current; in order to achieve this, the zero-current bunch lengths should be less by about one mm. One of the most challenging aspects of a high-current storage ring, the RF system for Super draws heavily on the experience gained at PEP-II, and in fact it is planned to reuse the PEP-II RF hardware.
The RF voltage, however, cannot be chosen solely on the basis of bunch length. In order to control the cavity at high beam current a minimum amount of stored energy, i.e., voltage on the cavity, is required. In addition, the maximum power transmitted to the beam by each cavity is limited by the coupling hardware and by the RF window necessary to separate the cavity vacuum from the waveguide, thus setting a lower limit on the number of cavities necessary to provide a certain amount of power to the beam. The power limit for each cavity window of the PEP-II RF system is [99].
The fundamental operating parameters for the system are given in Table 42.
| Parameter | HER | LER |
| RF frequency frf (MHz) | 476 | 476 |
| Harmonic no. h | 3572 | 3572 |
| Beam current Ibeam (A) | 1.3 | 2.3 |
| Energy loss/turn U0 (MeV) | 3.3 | 1.9 |
| Power loss/turn P0 (MW) | 4.3 | 4.4 |
| Momentum compaction | 2.3 | 3.3 |
| Total RF voltage VRF (MV) | 15 | 10 |
| No. cavities | 22 | 14 |
| Volts/cavity (MV) | 0.682 | 0.714 |
| No. klystrons with 2 cavities | 5 | 7 |
| No. klystrons with 4 cavities | 3 | – |
| Forward power/klystron (MW) | 0.85 | 0.76 |
| Coupling factor | 2.5/5.5a | 8.3 |
| Detuning frequency (kHz) | -100 | -220 |
| Synchrotron frequency (kHz) | 2.2 | 1.9 |
| Bunch length (0-current) (mm) | 4.4 | 5 |
-
a
for 2/4 cavities per klystron.
At the planned beam currents, radiation power have to be provided to the beam in the HER and to the LER beam. These values are comparable to the corresponding values for the PEP-II rings. An RF frequency of has been chosen to allow reuse of the PEP-II RF components. Our design requires 34 of an available total of 36 cavities to provide the power to both beams. A total of fifteen klystrons provide the power. This somewhat exceeds the minimum required and provides an operating margin allowing the system to operate reliably with a minimum number of trips, while at the same time increasing the beam-current reach of the rings by about . In order to compensate the beam loading, the cavities are detuned from resonance, where the detuning frequencies shown in Table 42 are less than those routinely achieved at PEP-II (.)
The klystrons required, plus several spares, exist at SLAC, although more klystrons may eventually be built to replenish the supply as tubes age.
2 RF System Description
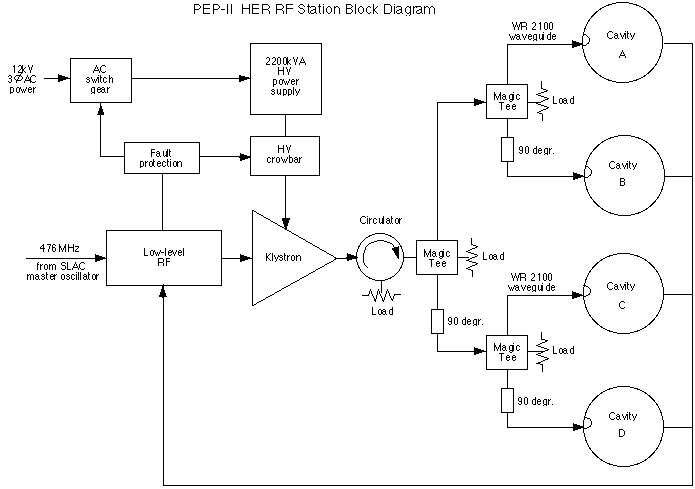
Each station consists of a DC power supply, klystron amplifier and a high-power circulator and waveguide distribution system at surface level feeding cavities down in the tunnel. A low-level RF system provides control and feedback for stable multi-bunch high current operation.
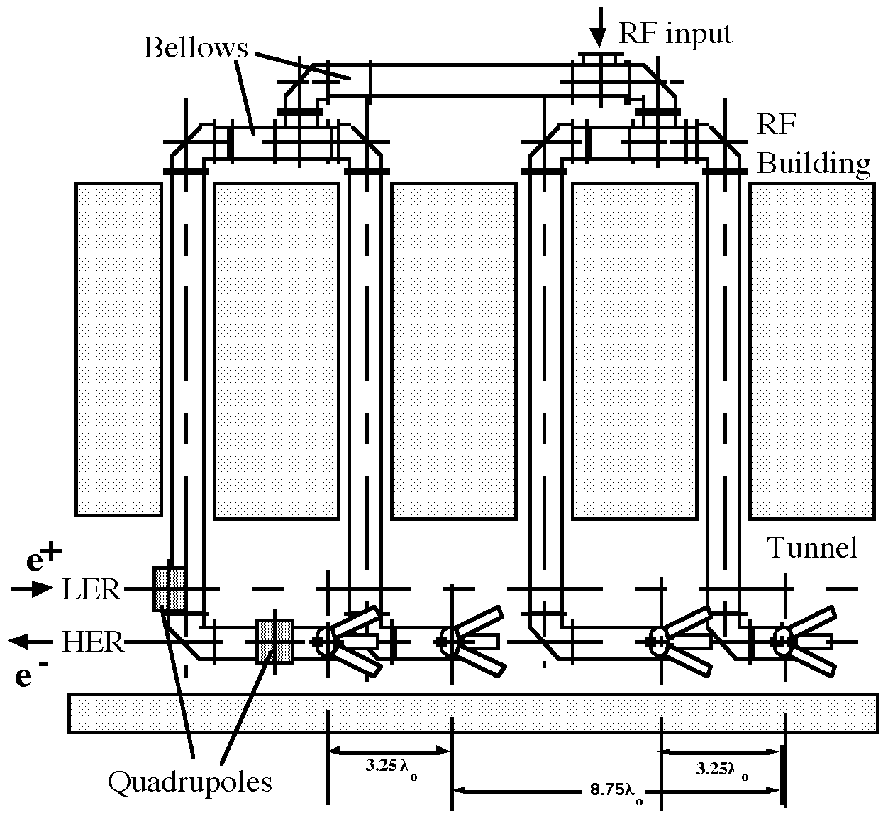
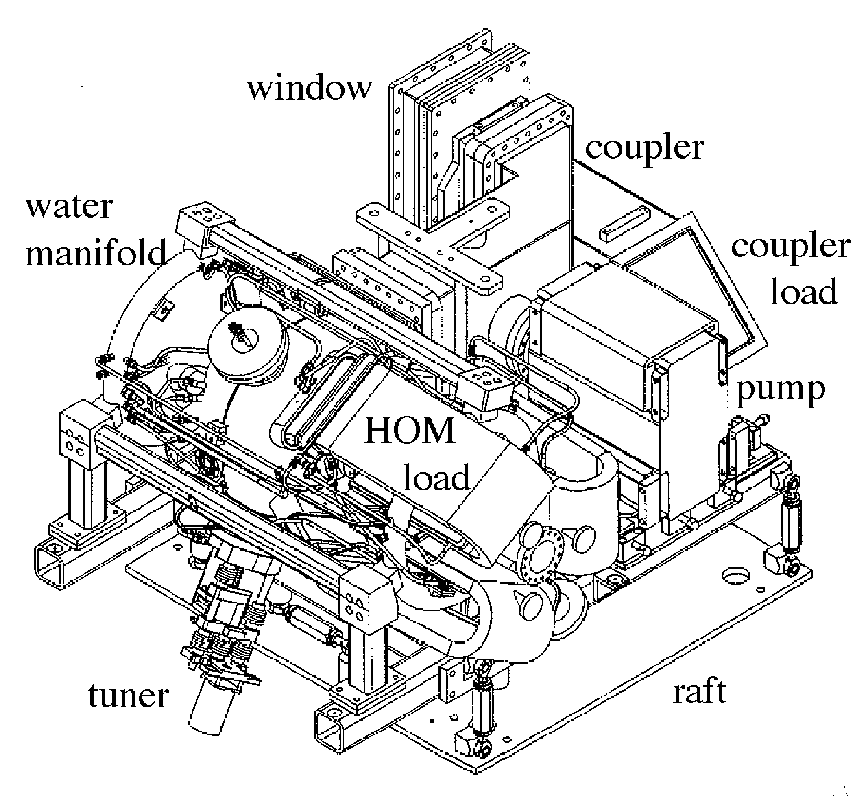
Figure 95 shows a block diagram of a typical RF station layout. Figure 96 shows the waveguides running down penetrations into the tunnel. Figure 97 shows a cavity raft assembly with all ancillary equipment mounted, and Figure 98 shows a production raft assembly.
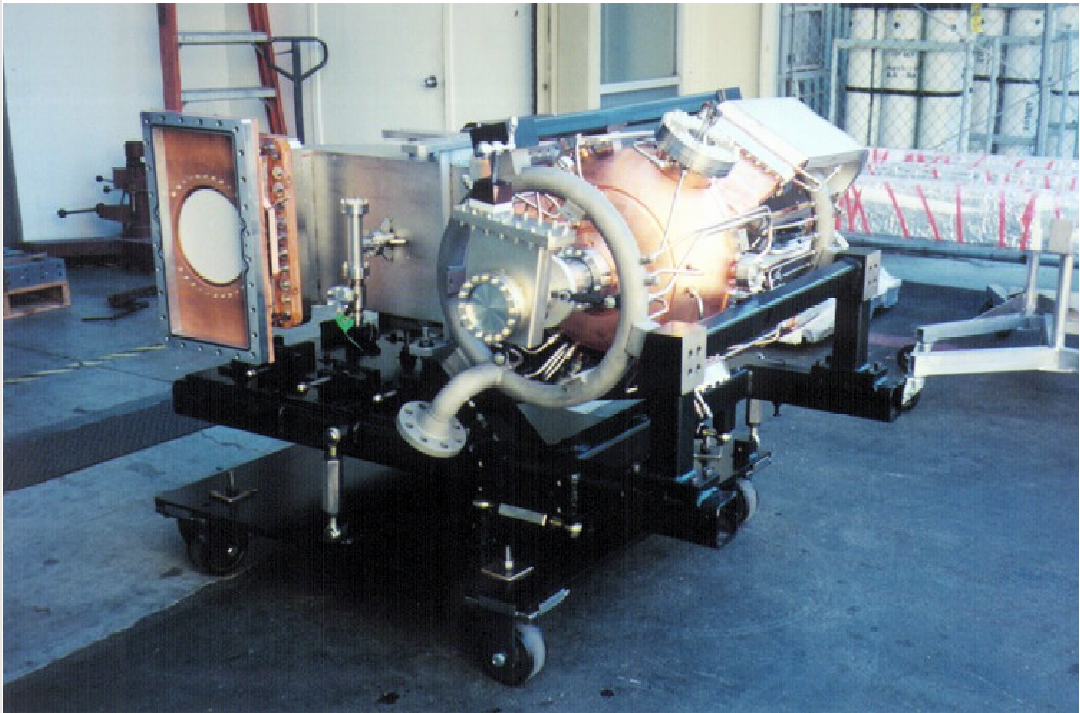
The DC power supply uses a modern SCR-switched design for both voltage control and crowbar functions. The major components and the enclosures were sourced from industry while the SCR switching and crowbar stacks were fabricated in house. The klystrons are required to provide a high average power with good reliability, low group delay (to enable fast feedback), and good efficiency. The RF distribution is via WR2100 waveguide, chosen primarily for low group delay, and a circulator is used on the output of each klystron. The low-level RF system is a state-of-the-art implementation in the VXI environment and incorporates fast RF electronics, programmable feedback loops, tuner loops, a built-in network analyzer and other diagnostics. High-level controls and the user interface are implemented in EPICS. The windows, tuners and HOM loads have been specified for operation at up to a 3 beam current to give safety margin and headroom for future upgrades of the machine.
3 RF Cavities
The RF cavity is a reentrant design with the addition of three HOM damping waveguides as shown in Fig. 99. The design parameters are listed in Table 43. The cavity also has ports for an aperture coupler, a PEP-style plunger tuner, pick-up loop, etc. The location of the HOM damping ports has been chosen to couple to all modes, but most strongly the worst ones. Measurements on a cold test model have shown that the damping scheme reduces the impedance of the worst HOMs by more than three orders of magnitude [103]. Subsequent analysis, measurement of the high-power cavity and observations with beam have confirmed this [104]. The coupling factor has been set to 3.6 for both rings in order to match the transient response in each ring from the gap in the beam.
| Parameter | Value |
|---|---|
| RF frequency (MHz) | 476 |
| Shunt impedance () | 3.5 |
| Gap voltage (MV) | 1.02 |
| Accelerating gradient (MV/) | 4.6 |
| Wall power loss (MW) | 150 |
| Coupling factor | 3.6 |
| Unloaded Q | 32000 |
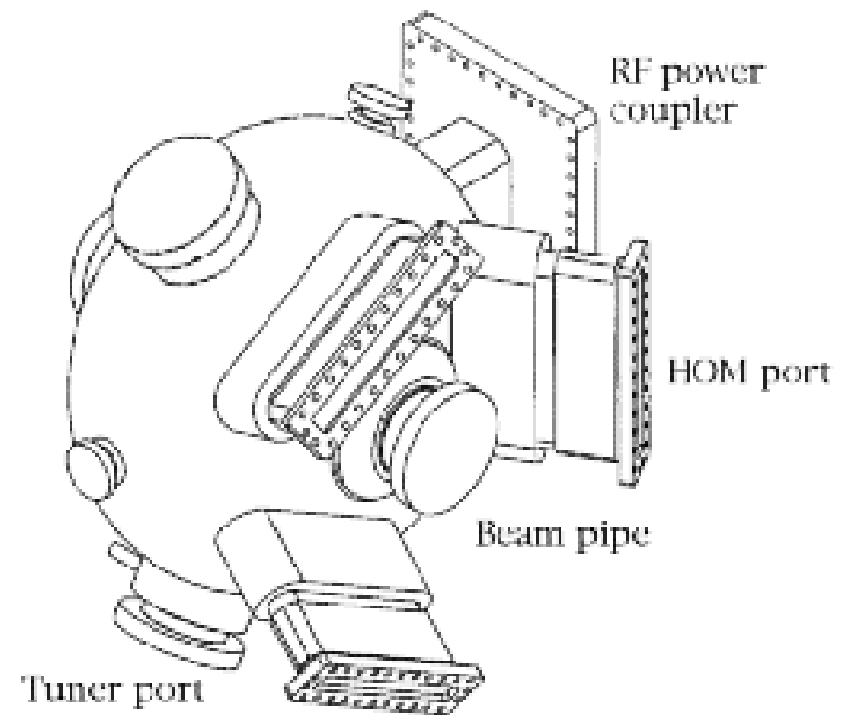
In order to optimize the application of the cavity to Super, we note that the coupling factor should increase significantly for the LER. This factor, which measures the coupling of the generator to the cavity, is dependent on the details of the coupling system, i.e., the physical size of the coupling slot. Fortunately, there appears to be a way to affect this coupling with a change of the size of the waveguide leading to the coupler slot: by reducing its vertical (short-) side length by a moderate amount, we can raise the coupling factor, since it scales inversely with the square of this dimension. Thus up to 10 is achievable without changes to the cavity itself. Since the quality of the match varies only slowly with , we plan to optimize for a common coupling factor for all cavities.
4 HOM Damping
Figure 100 shows the longitudinal and transverse impedance spectra of the cavity, calculated using a time domain method [104] along with the original lab measurements. There is reasonably good agreement for the strongest HOMs. One cavity is instrumented with a pick-up probe to monitor the signal reaching the HOM load. This signal has been observed with a single bunch in the machine, which excites a signal in the cavity—in proportion to the impedance—at all harmonics of the revolution frequency. Due to the short bunch length the spectrum extends to very high frequencies and excites all modes up to the beam pipe cutoff and beyond. Figure 101 shows the measured and calculated spectra reaching the HOM load. There is reasonable agreement in the general features of the two spectra. Initial operation of the feedback systems indicated that true HOM-driven instability growth rates were consistent with expectations [105].
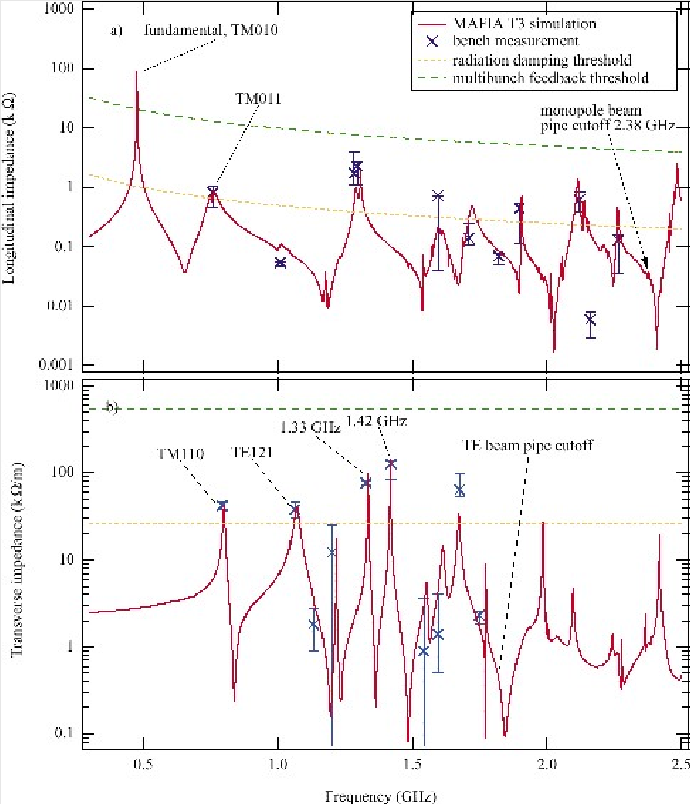
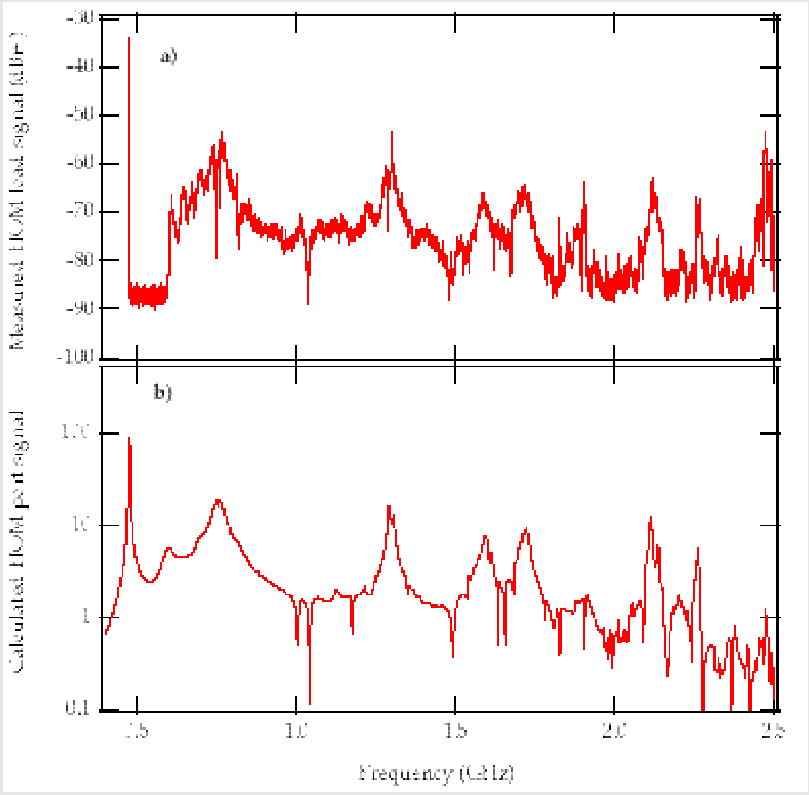
The HOM loads have a design power rating of 10 each. In an updated estimate based on the measured HOM spectrum of a cavity, and for a bunch length of 1, the total beam induced HOM power for 4.2 bunch spacing is estimated to be 15 nominally, and 21 worst-case, if a particular HOM happens to coincide in frequency with a beam harmonic. For 2.1 spacing the numbers are 6 and 13, respectively. Scaling up to 4 at 2.1, even the worst-case estimate is only about 23, within the operating envelope of the existing HOM loads, even when taking into account the shorter bunches at Super.
5 Beam Stability
The combination of high beam current and many bunches can lead to longitudinal multibunch instability depending on the cavity impedance presented to the beam. For each longitudinal mode there is an upper and a lower synchrotron sideband. The real component of the impedance at the lower sideband damps that particular mode while the component at the upper sideband drives that mode unstable. Thus, the difference between these two impedances determines the growth or damping rate. The particular impedance depends on the amount of detuning. For the Super RF system at nominal parameters, the resulting modal spectrum of the impedance is shown in Fig. 102.
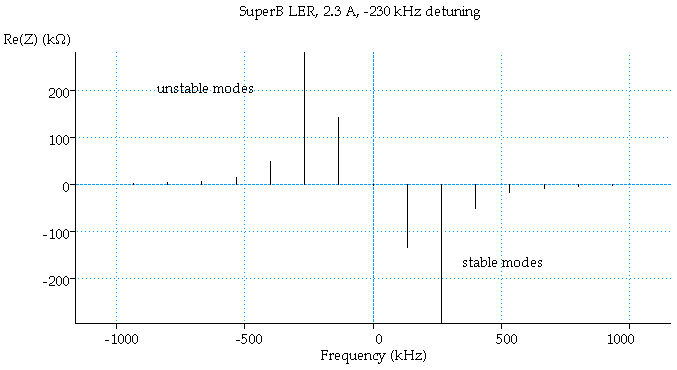
The driving terms for and would cause strong instability of these modes; fast and comb-filter feedback loops in the LLRF are employed to reduce the driving impedance by a factor of around 200 [100]. To get a sense of the significance of these numbers we compare to the situation at PEP-II. At Super, there will be 14 cavities rather than 8, but the beam current will be 2.3 rather than an achieved 3 and projected 4 at PEP-II. Since the growth rates depend on the product of impedance times the number of cavities, and on the beam current, we expect growth rates at Super to be some 30% above the presently measured 2 to 3 -1. This is within the performance envelope of the low group delay woofer of the longitudinal feedback system without further effort to reduce the impedance of the cavities. For the upgraded beam current, however, we will likely exceed the PEP-II growth rate by a significant amount. Possible measures to prevent beam instability under these conditions include reduction of group delay through the system to allow higher loop gain of the feedback system, and a more sophisticated comb-filter loop, allowing one to individually taylor the gain at each sideband, thus changing the difference of the impedances for each mode in favor of the damping impedance [101]. The impedance for each of the HOMs does not depend on the specific detuning conditions of the cavities. An increase in growth rate of 30% compared to PEP-II appears to be well within the capability of an upgraded longitudinal feedback system. PEP-II plans to reach 4 beam current in the LER before the end of 2008, providing valuable additional data on high-beam-current running.
6 Low Level RF System
Figure 103 shows a block diagram of the low level RF system, as implemented at PEP-II. The fast, direct RF feedback loop reduces the impedance presented to the beam by a factor in excess of 10, with the comb-filter loop reducing the impedance at the modal frequencies by another factor of 10. In order to maintain stable operation, the gain and phase of these loops are adjusted to follow the beam current. The “Ripple loop” stabilizes the phase through the klystron. Another loop stabilizes the measured gap voltage by adjusting the high voltage on the klystron. The gap feedforward system is an adaptive loop that compensates the transients caused by the kicker gap as the beam passes by, thus preventing saturation of the klystron due to the gap transient. Finally, on the bottom of the diagram the connections to the longitudinal feedback system implementing the woofer link are shown. In addition to these functions, diagnostics in the system include a network analyser to record transfer functions when tuning a station, and the ability to save important system parameters in “fault files” for the last few tens of milliseconds before a beam abort, thus allowing analysis of the cause of beam abort and RF trips. The state of the system is maintained in “bump-less reboot” files to ensure that a station comes up in its previous state after a reboot. The LLRF is implemented in VME/VXI technology, and controlled by an EPICS IOC. The system is described in numerous references in the literature.
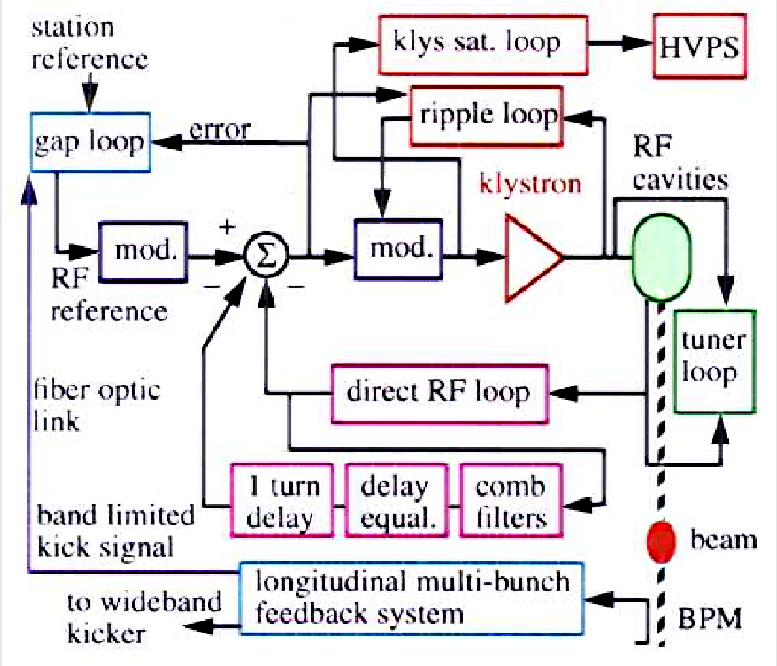
7 Summary
The PEP-II RF stations are a very good match to the Super requirements, providing sufficient voltage and power to exceed the nominal requirements by a healthy margin. By reusing the PEP-II RF system, considerable savings in development and fabrication effort will be realized. The HOM damping in the cavities reduces the impedance to a level where the required damping rates for multibunch instabilities will be well within the performance envelope of present-day technology. The low-lying multibunch modes are effectively damped by the low-level RF feedback loops, with the low-frequency beam-feedback system (“woofer”) providing the balance of the damping required. It is important to note that the parameters called for are a moderate extrapolation of the well established performance at PEP-II, thus minimizing the risk in building such a system for Super. Some of the new technologies anticipated for Super will already be implemented at PEP-II: the asymmetric comb filter and the Gboard-based longitudinal feedback system [102]. For the upgraded beam currents, the required additional power can be provided by adding a moderate number of stations (2 or 3 in the LER, 1 station with two cavities in the HER).
9 Vacuum System
1 General Considerations
Vacuum system parameters for Super can be derived from two different approaches. One is from the standpoint of the PEP-II rings, which benefits from significant and lengthy experience gained in operating a comparable vacuum system [106]. The other is to take advantage of effort already spent on setting the ILC Damping Ring vacuum system parameters [107], which takes into account the extremely small beam emittance. For Super we have adopted the pressure specifications for the ILC Damping Rings, which have beam emittances similar to Super, rather that the somewhat less stringent pressure specifications for PEP-II. The other vacuum parameters for the Super rings (e.g. apertures) in general do not deviate significantly from those for PEP-II. We summarize pressure requirements in Table 44.
| Parameter | ||||
| Arc | Arc | Straight | Straight | |
| Beam Energy (GeV) | 7 | 4 | 7 | 4 |
| Beam | 13700 | 7829 | 13700 | 7829 |
| Beam current (A) | 1.3 | 2.3 | 1.3 | 2.3 |
| Chamber halfwidth (m) | 0.045 | 0.15 | 0.045 | 0.045 |
| Bending angle (rad) | 0.052 | 0.052 | – | – |
| Bending radius (m) | 139 | 28 | – | – |
| Length of radiation fan (m) | 3.1 | 2.9 | 3.6 | 3.6 |
| Eloss/turn (MeV) | 2.0 | 0.8 | – | – |
| Total SR power (MW) | 2.6 | 1.9 | – | – |
| Average pressure (nTorr) | 0.5 | 0.5 | 0.1 | 0.1 |
| Max. linear power density (W/) | 39 | 75 | 39 | 35 |
| Vertical height of s.r. fan (mm) | 0.45 | 0.74 | 0.45 | 0.74 |
| No. of photons (1/) | 7.4 | 7.4 | ||
| Critical photon energy (keV) | 7.2 | 5.1 | ||
| Photon desorption coeff. (molecules/) | 1 | 1 | 1 | 1 |
| Photo desorption gas load (Torr/) | 2.2 | 2.2 | 2.2 | 2.2 |
| Thermal desorption coeff. ( L//) | 1 | 1 | 1 | 1 |
The requirements are not beam-lifetime driven, but rather have been determined in ILC investigations to reduce the chance for collective instabilities, such as the fast ion instability in the electron ring, or excessive electron-cloud effects in the positron ring. Such instabilities–even if controlled by feedback systems–can be detrimental to the small emittance goals for Super.
To avoid excessive impedance, high-conductivity materials, such as copper or aluminum, are preferred. The dissapation of HOM energy will be dealt with using localized HOM absorbers [108]. While this considerably increases the power density at the absorption point, it is believed to reduce the resistive wall impedance, thus lowering the requirements for the transverse feedback systems. The concern for Super arises from the small emittances: while growth rates are not excessive compared to other facilities, preventing emittance growth from noise in the feedback systems will be a concern.
NEG coating provides the bulk of the pumping speed for the proposed ILC Damping Rings. This technique, developed at CERN for the LHC warm sections [109], is attractive, as it provides high pumping speed with low secondary emission. It does require in situ baking of the vacuum system to a relatively high temperature of about C, thus limiting the materials that can be used and incurring the added expense of a suitable bake-out system. Operationally, in situ baking adds the risk of opening vacuum leaks, especially if baking is done at higher temperatures. For Super, we will investigate this technique carefully, and possibly apply it in regions that lend themselves to efficient manufacture and deployment of such a system. On the other hand, more conventional pumping schemes may provide similar pressures at less overall cost. This optimization will require more investigation before a final decision can be made.
In the following we outline a design approach that will likely achieve the required parameters, given the present state of investigations. Choosing a common technology and common cross sections for the HER and LER vacuum systems would have benefits (economy of scale and less design effort, to name just the obvious ones). However, the two rings exhibit significant differences in layout due to the relatively short dipoles in the LER compared to the HER. They also have different technical requirements arising from the susceptibility of the positron ring to electron-cloud effects, which favors an antechamber design. At this point, for Super we pursue individually optimized vacuum designs for the arcs in each ring. For the straight sections (excluding the interaction region), a common design appears to be quite feasible.
2 HER Arc Vacuum System
A possible layout of an arc cell of the HER is shown in Fig 104. Discrete ion pumps will be placed at every quadrupole and distributed pumps will be in the dipole as well as in the long drift tubes. The chambers will be anchored to the quadrupoles at the location of the BPMs, with the other end allowed to expand in the longitudinal direction. Shielded bellows will be inserted next to the BPMs to avoid mechanical stress that could cause the BPM pickups to move with respect to the nearest quadrupole magnet.

The pumping requirement for the HER arcs to maintain 0.5 pressure at 1.3 beam current is about 150 L/s/m average pump speed. The low photon-desorption coefficient () used here has been achieved at PEP-II [106]. Since the conductance of any reasonable aperture over the length of a half cell will be smaller than necessary to achieve this pressure with lumped ion pumps, distributed pumping is required. The Super HER will use the existing 5.4 long dipoles of the PEP-II HER. In PEP-II, the dipole vacuum chambers house distributed ion pumps (DIPs) of 120 L/s/m effective pumping speed (including the screen) that use the field of the dipoles. The outside wall of the chambers constitutes the absorbing surface for the synchrotron radiation. The power handling capability of the PEP-II HER chamber is 100/m, more than sufficient for Super, even for the upgrade option at 2.2 beam current. The aperture of the dipole chambers ( with an octagonal shape) is sufficient for Super even taking into account the extra 0.4 of sagitta due to the smaller bending radius of the dipole in Super. Figure 105 shows a cross section of the HER arc vacuum chamber. Since the development of such vacuum chambers with DIPs is a significant effort there would be considerable savings in reusing the PEP-II dipole vacuum chambers in the Super HER. Only 144 of the 192 dipoles will be used in Super so there would be a significant number of spare chambers in case failures occur. To ensure reliability we would open a few of the PEP-II chambers to inspect the condition of the pump and assess the expected service life.
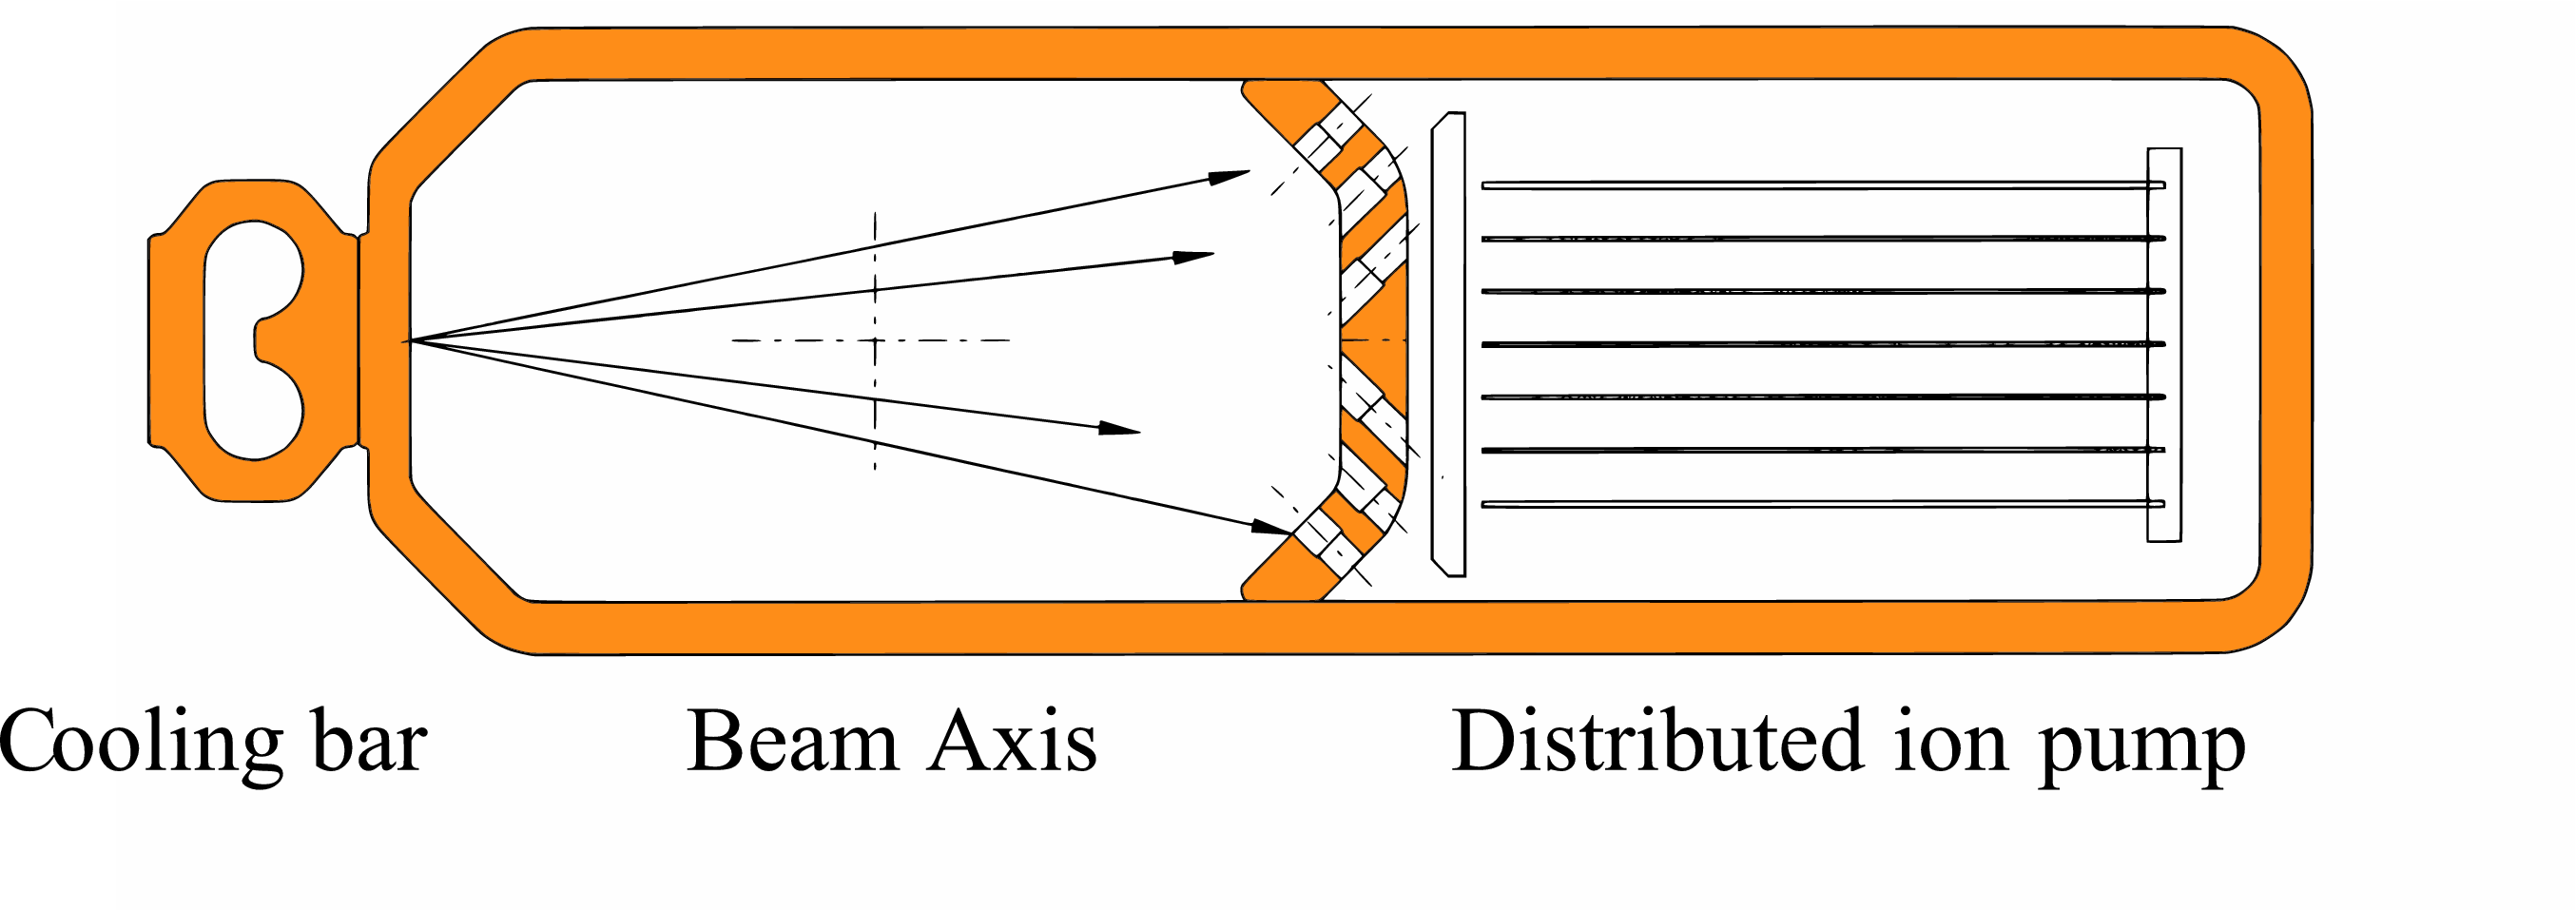
It should be noted that there are 16 additional dipole magnets of the same design at higher bending angle in the final focus section. The design of the vacuum system for these magnets will be the subject of further investigation.
Reusing the PEP-II HER dipole chambers naturally sets the cross section of the other arc vacuum chambers as well. Because of the different magnet lattice we do not plan to reuse the PEP-II HER quadrupole chambers, but will instead build new ones. These could be fabricated from aluminum extrusion for cost savings, pending more detailed thermal analysis. Alternatively, copper extrusions, like those used in PEP-II, could be used for the quadrupole chambers.
The drift tubes in the straight portions of the arcs will be required to have some kind of pumping as well, as the power dissipated on the walls is significant, although smaller than in the dipole chambers. A straightforward solution would be to use a chamber similar to the dipole chamber but with a getter pump in the pumping compartment of the chamber. This could be a long NEG pump such as used in some areas of PEP-II or a long titanium sublimation pump (TSP) such as one recently developed for the PEP-II IR[110]. The TSP would have the advantage of being less prone to separating dust into the beam channel, a significant problem in the early days of PEP-II. A potential issue with HOM heating of NEG pumps due to the high beam current is avoided by ensuring that the screen is sufficiently dense to minimize leakage of electromagnetic fields. An alternative option for these chambers would be a NEG-coating scheme similar to that proposed for the ILC damping rings, but with an octagonal vacuum-chamber cross section. Table 45 summarizes the HER arc vacuum system components.
| Component | Pump speed | Length | Number | Comment |
|---|---|---|---|---|
| (L/s) | (m) | |||
| Distrib. ion pumps | 600 | 5 | 144 | in dipoles |
| Holding pumps | 60 | 0.3 | 216 | adjacent to quadrupoles |
| Long TSP or NEG pump | 600 | 4 | 72 | drift sections, speed is screen-dominated |
| Hot filament gauges | 0.1 | 24 | ||
| Pirani gauge | 0.1 | 12 | to protect gate valves | |
| Roughing ports | 0.1 | 24 | ||
| Bellows | 0.2 | 216 | at each quadrupole |
3 LER Arc Vacuum System
The average pumping requirement for the LER is similar to that for the HER. However, the relatively short dipoles, coupled with the desire for antechambers to reduce the number of photoelectrons near the beam, favor a different vacuum chamber design. While NEG coating is attractive, this approach would favor the use of stainless steel chambers, which for Super would likely have to be copper clad on the inside. The substantial thickness necessary for the copper layer raises concerns about the stability of the cladding, especially after numerous heating cycles required to regenerate the NEG material. On the other hand, copper extrusions of the required shape, while probably obtainable, may be quite expensive.
At PEP-II, a TiN-coated aluminum chamber with a substantial antechamber and discrete photon stops was chosen for the LER. The photon stops have a design limit in power handling of about 15 [111]. For 144 arc dipole pairs, the Super LER synchrotron radiation power per dipole comes out to 13 for the nominal 2.3 beam, but rises to 22 for the 4 upgraded beam current. With one photon stop per dipole pair, this approach would require a certain extrapolation of the technology used in the PEP-II photon stops. Moreover, the clustering of four dipole magnets in close proximity in the lattice creates a large opening angle for the radiation fans, making for a more difficult photon-stop geometry.
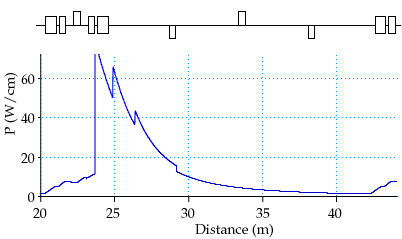
A variation of this approach may be feasible at Super as well: retaining the antechamber, but rather than using discrete photon stops laying out the chamber geometry in such a way as to absorb the photon power along most of the length of the chamber. Magnet dimensions are such that an antechamber width of about 20 can be accommodated. Due to the particular geometry of the lattice, the peak power (75/cm) will hit inside of the dipole pair just after the focusing quadrupole. If the absorbing surface were slanted with a 1:10 ratio, the real power density would be reduced by a factor of 10 to a manageable 100/cm2 for 2.3 beam current, and about twice that for the upgrade scenario. Figure 106 shows the anticipated linear-power-density profile for a standard LER arc period.
There is sufficient vertical space in the dipoles to provide for the necessary cooling and pump channels. The more limited vertical space in the quadrupole pockets restricts the amount of cooling above and below the antechamber, but, given the more moderate power densities (about 20/cm or 30/cm2) at these locations, this should be sufficient. This approach would make use of relatively economical aluminum extrusion and proven technology. Due to the temperature restriction of most aluminum alloys, it is unlikely that such extrusions would be suitable for incorporating a NEG coating design; distributed pumping by either a long NEG or a long TSP is anticipated. Figure 107 shows a conceptual layout of the quadrupole chamber, while Fig. 108 shows a dipole chamber. The latter is also applicable to the drift sections, and more room can be provided in the drift sections for the pumps, if required.
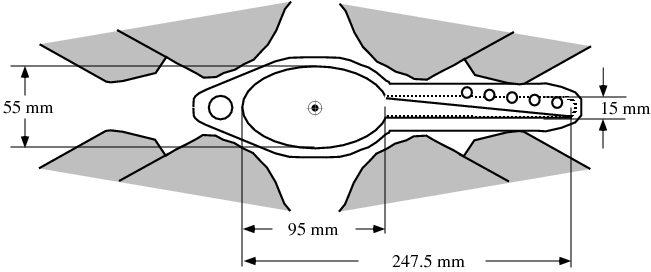

While the actual chamber would be an extrusion, the channel for the pump would be a separate welded-on section, to allow for cutting the screen shielding above the pump.
All LER vacuum-chamber sections not located within magnets would carry current windings to create a solenoidal field of about 50 on the beam axis as a measure designed to prevent electron-cloud built-up near the beam. If it were determined to be of benefit, longitudinal grooves can be provided in the beam channels of the extrusions. All aluminum chambers would be TiN coated inside the beam channel. Table 46 provides a summary of the LER arc vacuum components.
| Component | Pump speed | Length | Number | Comment |
|---|---|---|---|---|
| (L/s) | (m) | |||
| Long TSP or NEG | 240 | 1.2 | 144 | in dipoles |
| Holding pumps | 60 | 0.3 | 300 | adjacent to quadrupoles |
| Long TSP or NEG pump | 600 | 3 | 288 | drift sections |
| Hot filament gauges | 0.1 | 24 | ||
| Pirani gauge | 0.1 | 12 | to protect gate valves | |
| Roughing ports | 0.1 | 24 | ||
| Bellows | 0.2 | 300 | at each quadrupole |
4 Straight Sections
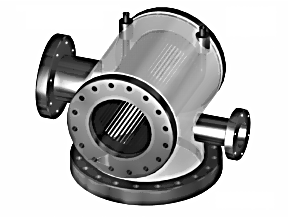
The straight sections in both rings will likely use the same chamber materials and cross sections. For economy, a circular chamber geometry is preferred, since (after a matching section) there will not be significant synchrotron radiation left to absorb. In order to keep the impedance low, aluminum or copper is preferred over stainless steel. The gas load in most of the straight section is dominated by thermal outgassing from the chamber wall. For the specified 0.1 pressure, an average pumping speed of about 300 L/s/m is required. This is a substantial pumping speed, which is only practical with distributed pumping. In these sections, the NEG-coating technology is a serious contender: the circular cross section is ideally suited for this purpose and if copper is used, the temperature of about C needed to regenerate the low-temperature NEG material would not weaken the chamber. The NEG coating would be applied in the drift sections between the quadrupoles. With NEG being primarily a hydrogen pump, however, significant additional pumping is needed to remove other common gases such as Ar, Co and CO2 from the system; this pumping will be provided by ion sputter pumps. Having one 400 L/s ion pump in each half cell should reduce the partial pressure of these gases sufficiently. To achieve high conductance, the pump tee uses a large screen and a plenum. Figure 109 shows a PEP-II straight-section pump tee, a design which could be adapted for Super with little modification.
Experience with PEP-II has shown that the straight sections can be subject to significant electron-cloud effect. While weak solenoidal fields (on the order of 30–50) on the beam axis have been shown to be very effective in suppressing the electron-cloud effect in the present Factories [112], there is concern that the tight emittance requirements of rings like Super and the ILC damping rings necessitate stronger measures. At PEP-II, there are presently several test chambers installed with different surface preparation to systematically study the efficacy of grooves in the chambers and of different materials and coatings on the secondary emission [113]. Results of these experiments are expected to be available sufficiently soon to be fully taken into account for the detailed design of the Super vacuum system. A summary of the straight-section components is provided in Table 47.
| Component | Pump speed | Length | Number | Comment |
|---|---|---|---|---|
| (L/s) | (m) | |||
| NEG-coated chamber | /m | tbd | ||
| Holding pumps | 400 | 0.3 | 180 | adjacent to quadrupoles |
| Hot filament gauges | 0.1 | 10 | ||
| Pirani gauge | 0.1 | 10 | to protect gate valves | |
| Roughing ports | 0.1 | 10 | ||
| Bellows | 0.2 | 180 | at each quadrupole |
5 Expansion Bellows
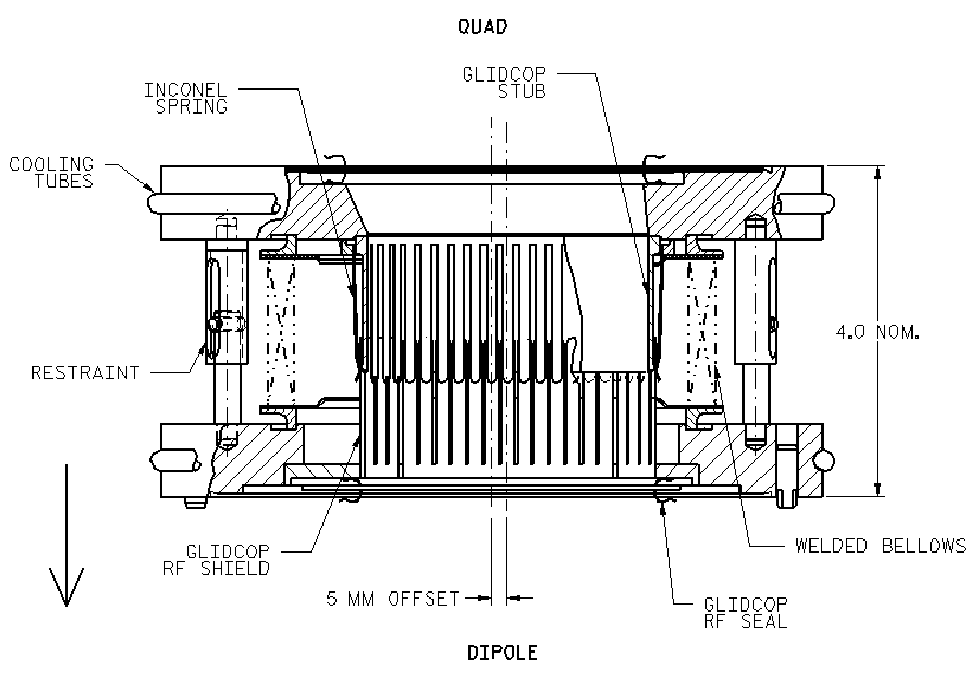
Shielded bellows designs have been used successfully at high beam current, both at KEKB and at PEP-II. Very similar designs will be used at Super, with incremental improvements mainly to reduce the chance of damage to the shield during installation. The PEP-II bellows have been produced with circular, octagonal and antechamber cross section. Figure 110 shows a straight-section bellows design.
6 HOM Absorbers
With the vacuum system of the Super rings made entirely from material with high electrical conductivity, there is concern that higher-order modes (HOMs) excited by the beam will not be quickly absorbed, leading to excessive localized heating and other difficulties. Using a less conductive material in some areas, e.g., the straight sections, could improve the dissipation of HOM power into the vacuum system. However, this would significantly raise the impedance presented to the beam, especially the resistive wall component. At PEP-II, the threshold for resistive-wall instability has been found to be significantly lower than expected. It is quite possible that the stainless-steel vacuum system in the straight sections is one of the culprits for the observed behavior. Dedicated HOM absorbers have recently been developed to address the localized heating observed for certain bellows units. These designs use SiC tiles with high electrical permittivity and relatively high electrical loss (“”) to absorb HOM power. The tiles are prevented from extracting power directly from of the beam, while at the same time HOM power is let through, by an array of longitudinal slots in front of the tiles. Figure 111 shows a rendering of such an absorber module. This particular absorber is integrated with a bellows module for reduced demand on space.
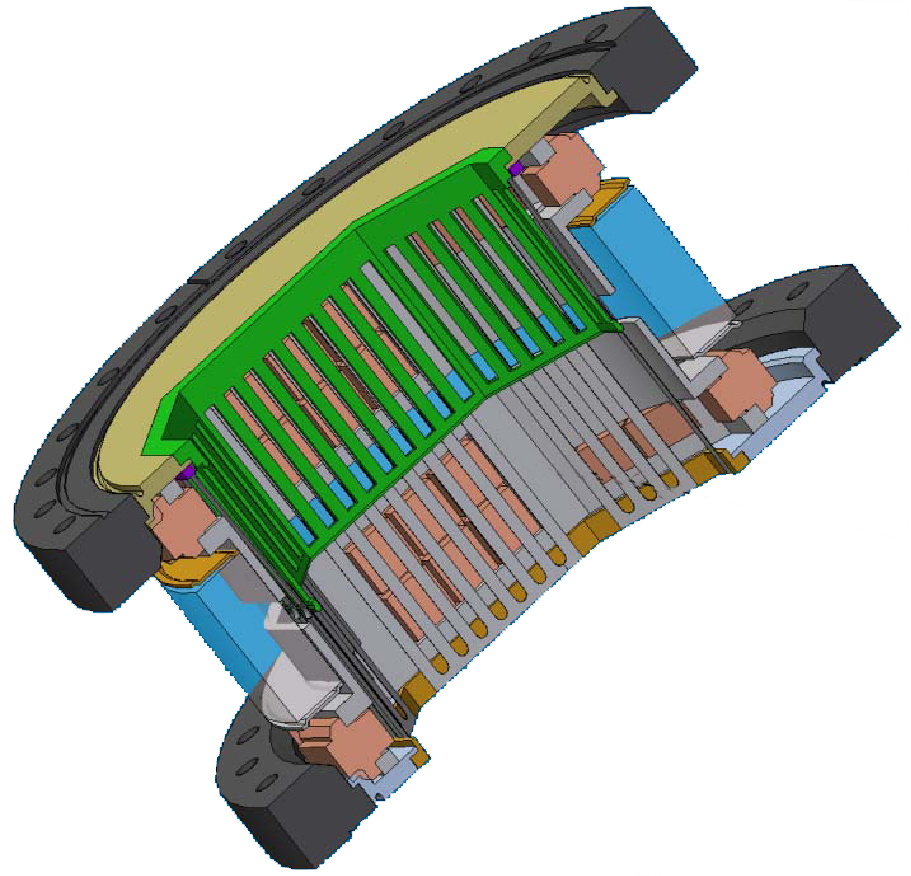
7 Flanges
Stainless steel flanges with ConFlat seals will be used throughout. For aluminum chambers, flanges made of aluminum may be easier to fabricate and attach to the chambers. However, operational experience at PEP-II has shown the vacuum joint using Compression “C” seals to be much more difficult to assemble and keep leak tight. This presents a significant operational issue due to the large number of flanges in a typical machine. ConFlat seals are robust and straightforward to seal after a repair to the vacuum system. They do present a gap to the beam aperture that must be bridged, either by a “gap ring”, usually made of copper, or by a more flexible RF seal involving spring fingers. The latter design is preferred where the joint can flex as the chambers heat up and cool down with changing beam current. This can particularly be the case where chambers are bolted together, not with a bellows, but using a “flex flange” to allow some angular movement between the two chambers. Figure 112 shows a flexible “” seal for the PEP-II HER. An upgraded version with better flexibility of the spring fingers is presently being built; any design for Super will certainly incorporate the latest experience with such seals in PEP-II.
8 Vacuum Monitoring
The electrical current drawn by ion pumps is directly related to the pressure and provides a convenient way to monitor the vacuum pressure, as long at pressures are in the operable region of ion pumps. At Super, with the very low anticipated pressures, this may not be always the case, especially in the straight sections, and wherever significant NEG or TSP pumping is installed. For these cases, we anticipate the installation of sufficient hot-filament gauges to allow monitoring of the system.
Even in cases where the pump currents do provide meaningful pressure readings, care has to be taken to avoid the pump currents being affected by photo- and secondary electrons in the beam pipe. A good pump screen is mandatory, but it may be necessary also to use (relatively small) magnets around the pump ports to deflect any electrons and thereby prevent them from reaching the active pump area. Gauges will be mounted using right-angle adapters to prevent line-of-sight into the vacuum system. The DIPs in the HER chambers are well protected by the magnetic field of the dipole magnets and not susceptible to stray electrons to any significant degree.
In the IR straight sections, in addition to these diagnostics, there will also be a number of residual gas analyzers (RGAs) to track down even very small leaks. The widespread deployment of RGAs around the rings is prohibitively expensive; following PEP-II experience, it is not really necessary, as long as pump ports are provided to quickly flange in an RGA where needed.
9 Summary
The vacuum system described in this section fulfills the Super requirements for pressure and synchrotron radiation power handling. Some reuse of PEP-II components is anticipated, although this is not a driving factor. A significant design and optimization effort will be undertaken to “flesh out” the details of the design, and ensure an effective and cost-efficient solution. This effort will include a thorough evaluation of the NEG coating technology and other concepts presently under consideration for the ILC damping rings.
10 Instrumentation and Controls
1 Beam Position Monitors
Requirements
The plan for beam-position monitors (BPMs) for Super benefits from the experiences of other rings. In particular, the growing number of synchrotron light sources, with their demanding requirements for orbit stability, has led to impressive commercial processors, while the high beam currents in PEP-II have exposed thermal issues not seen elsewhere but which will be relevant for Super.
The BPMs must serve a range of conditions, from tracking the orbit of a small injected charge on its first turn, with an accuracy of , to measuring a stable orbit to in a full ring with over of circulating beam. The measured orbit must be insensitive to the fill pattern. Measurements such as the phase advance require turn-by-turn beam positions for 1000 or more consecutive turns all around the ring. The position history of the last 1000 or more turns must be available after a beam abort for post-mortem investigation. Data must be available on a speed compatible with orbit feedback, which may be applied both globally and locally near the IP.
Buttons
PEP-II uses diameter electrodes (“buttons”) mounted flush with the chamber walls to measure beam position. Identical buttons are used as pick-ups for other diagnostics, such as feedback and bunch-current monitoring. The buttons are mounted at approximately 45 degrees to the horizontal and vertical axes (the exact location depends on the cross sections of the different vacuum chambers) to avoid direct hits from synchrotron radiation. The buttons are stainless steel, mounted on molybdenum pins that pass through a ceramic feedthrough to an SMA connector outside the chamber. When the vacuum chambers are copper (LER near the IP, HER arcs) or stainless steel (standard straights for both rings), these button assemblies are electron-beam welded into place. Since the buttons are not suitable for welding into aluminum chambers (LER arcs and wiggler straights), buttons there are mounted on flanges.
In June 2005, with the LER current in PEP-II at , the RF voltage was increased from to to shorten the bunch length. Within a week, some buttons on the upper half of a few chambers dropped. The end of the molybdenum pin is captured inside a socket on the back surface of the stainless button with a press fit requiring some spring force. This force appears to have weakened after years of thermal cycling and with the increased high-order-mode power from the shorter bunches. The flanged buttons in PEP-II are being replaced with diameter buttons. These buttons and pins are made together from a single piece of molybdenum. This is the design proposed for Super, shown in Fig. 113. Given the difficulty in replacing welded buttons, all the Super buttons should be mounted on flanges.
Processors
The growing number of light sources around the world in recent years has led to the introduction of various commercial BPM processors that could satisfy the requirements for Super. Electronics change rapidly, and so it is too early to select a processor for this project, but the performance available commercially is illustrated by the Libera Electron processor [114] from Instrumentation Technologies in Slovenia.
Each Libera Electron is a separate one-unit-high rack-mounted chassis. The inputs are the four button cables, a ring-turn clock ( for Super), an acquisition trigger, and a beam-abort trigger. An internal Linux processor can run EPICS and so serve the measurements to the control system over ethernet.
Each button signal is filtered to a bandpass, and then the gain is adjusted by a automatic gain control, for a wide dynamic range of over 80. The signals are sampled at a frequency near (adjusted for each ring’s revolution frequency) and downconverted digitally. The resulting beam position may then be read at various rates: sample by sample, turn by turn, for fast orbit feedback, down to for position monitoring. Depending on the requested rate, digital filters further narrow the bandwidth to reduce noise and remove dependence on the fill pattern. For data-rate modes of and below, the buttons may be automatically cycled among the four input channels to even out any gain differences.
In turn-by turn mode, the processor records data from up to hundreds of thousands of consecutive turns, beginning with an acquisition trigger synchronized either with stored beam or with an injection fiducial. Similarly, the abort trigger saves a -entry buffer of turn-by-turn beam positions measured prior to the abort.
2 Beam Size Monitors
In storage rings, synchrotron radiation from bend magnets provides the standard measurement of beam size. Since the vertical size in Super will be very small–typically –even at the defocusing quadrupoles, and so the diffraction limit precludes measurements using visible light. Instead, we turn to x-rays. The simplest x-ray imaging technique, a pinhole camera, is also not suitable, since the necessary hole diameter would be impractically small and would pass very little x-ray power. X-ray zone plates [115, 116, 117, 118, 119], however, provide an effective approach. A zone plate is essentially an x-ray lens of radius that focuses using diffraction rather than refraction or reflection. An x-ray-opaque metal, typically gold, is electroplated in a pattern of (typically hundreds) of narrow () circular rings (Fig. 114) onto a thin membrane of an x-ray-transparent material, such as . The thickness and separation of the rings vary systematically so that, when illuminated by a collimated and monochromatic x-ray beam, each ring forms a first-order diffraction maximum that adds in phase at a focal point downstream, as shown in Fig. 114. Zone plates are produced commercially by firms such as Xradia [120] for use at synchrotron light sources.
Since the zone plate’s focal length [121]:
depends on the wavelength , it is well defined only for a monochromatic beam, but not for the broadband x-ray spectrum of synchrotron emission from a dipole magnet. Narrowing the bandwidth is also essential to reduce the power striking the zone plate to a safe level for the delicate zone-plate structure. We therefore precede the zone plate with a monochromator.
An x-ray monochromator commonly uses Bragg diffraction from a single crystal, with a typical bandpass of . This is far narrower than is needed for imaging and is costly in terms of flux. Instead, a bandwidth of about 1% can be obtained with a grazing-incidence multilayer mirror, a substrate coated with alternating thin layers of light and heavy materials. Here we consider a mirror with layers of and , with the reflectivity [122] shown in Fig. 115. The center of the band may be tuned by small variations in the angle of incidence. To preserve the direction of the incident beam while tuning, such mirrors are commonly used in pairs, with the outgoing beam parallel to the incoming beam, but displaced slightly. Like zone plates, such mirrors are available commercially for use at light sources, from firms such as Rigaku/Osmic [123].
The large heat load now strikes the first multilayer mirror, rather than the zone plate. Although the mirror is far more robust than the zone plate, it is important to reduce the surface heating to maintain the flatness and thickness of the layers. After the x rays enter a separate beamline, the heat load is reduced in several steps that follow the design of the x-ray beam-size monitor in the LER of PEP-II [124].
First, the x rays pass through a water-cooled conical beampipe with a aperture at the downstream end. Grazing incidence on the inside wall of this Glidcop [125] cone allows for safe absorption of photons that are not aimed at the zone plate.
Next, a high-pass x-ray filter removes visible, ultraviolet, and lower-energy x rays. The preliminary design considered here images photons at , somewhat above the critical energy in the dipoles ( for LER and for HER). The filter’s first stages use five thin (5 to ) layers of pyrolytic graphite, which absorb photons below about , and radiate the heat toward the walls of a water-cooled vacuum chamber. Two thin sheets of aluminum foil then remove energies below . The combination cuts the heat flux in half, as seen in Fig. 116.
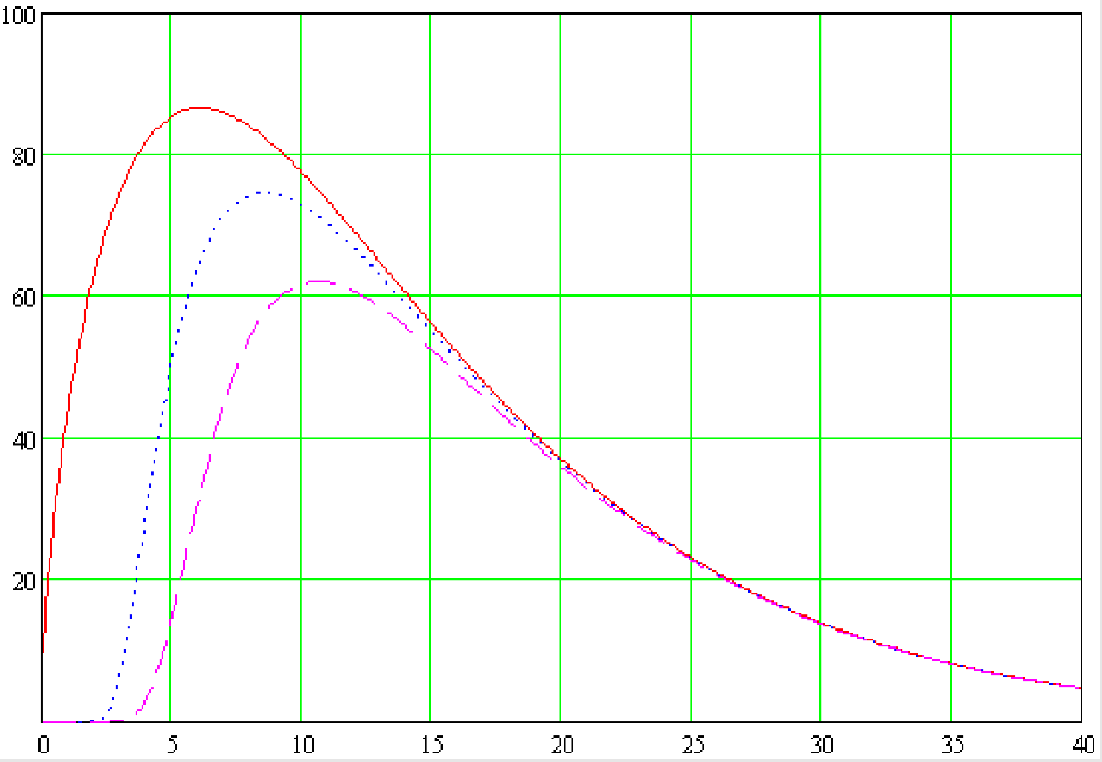
Just before the first multilayer mirror, a conical hole in a Glidcop plate further narrows the pencil of x rays and also serves as a photon BPM. A pair of photodiodes compares the intensity of x-ray fluorescence from the upper and lower surfaces of the cone, so that the vertical angle of the electron or positron orbit in the source dipole can be adjusted to center the x-ray beam on the hole. A similar pair for the horizontal direction ensures that the middle of the x-ray fan is passed through to the next stage.
The beam then reaches the first multilayer mirror, where grazing incidence at one degree spreads the remaining heat. The dimensions and the water-cooling channels in the silicon substrate are carefully designed to conduct this heat away with minimal distortion.
A magnification of ten would be helpful to measure the small beam size, but, to get this magnification with a single zone plate, the detector would have to be well over away, given the long distance from the source to the zone plate. Instead, we use a two-lens system, demagnifying with the first zone plate and magnifying with a second. A resolution (referred to the source plane) of is readily achievable with such a system.
Just before the image plane, the x rays pass out of the vacuum through a thin beryllium window. The basic detector then has a scintillator, lens and video camera. Inspired by the wire scanners used to measure beam profiles in the SLAC linac, PEP-II is now preparing a more elaborate system, designed for rapid measurement of the size of each bunch [124]. An x-ray-opaque mask with three slots at three orientations scans across the image plane. A fast () scintillator [126] and photomultiplier after the mask respond to each bunch as it passes by. Fast digitizing and processing electronics sort the data into profiles for each bunch over many turns as the mask moves, so that the major axis, minor axis and tilt of each bunch’s ellipse can be computed every few seconds. A linear motion, like that of the wire scanner, could be used, but a rotating device, similar to an optical chopper wheel, would be more robust. With a radius of , the change in slot orientation with rotation would not cause difficulty.
3 Longitudinal Feedback
The PEP-II longitudinal feedback system, although designed in the first half of the 1990s, still performs very well. Some parts of the system would be redesigned for Super, others can be used without changes. The main components of the longitudinal feedback system are (see Fig 117):
-
•
Pickup (buttons and the vacuum chamber in which they are located);
-
•
Frontend analog electronics;
-
•
Bunch-by-bunch digital processing system and feedback setup controls;
-
•
Backend analog electronics;
-
•
Power amplifiers, circulators and loads; and
-
•
Kickers
Other important components for the system are SUN/Solaris computers servers with the high & low level software, including the source codes; VME/VXI controllers, VxWorks software licenses for software development; spare parts (very important for the obsolete components); instrumentation needed for timing the system and diagnostics; racks and crates; and cables
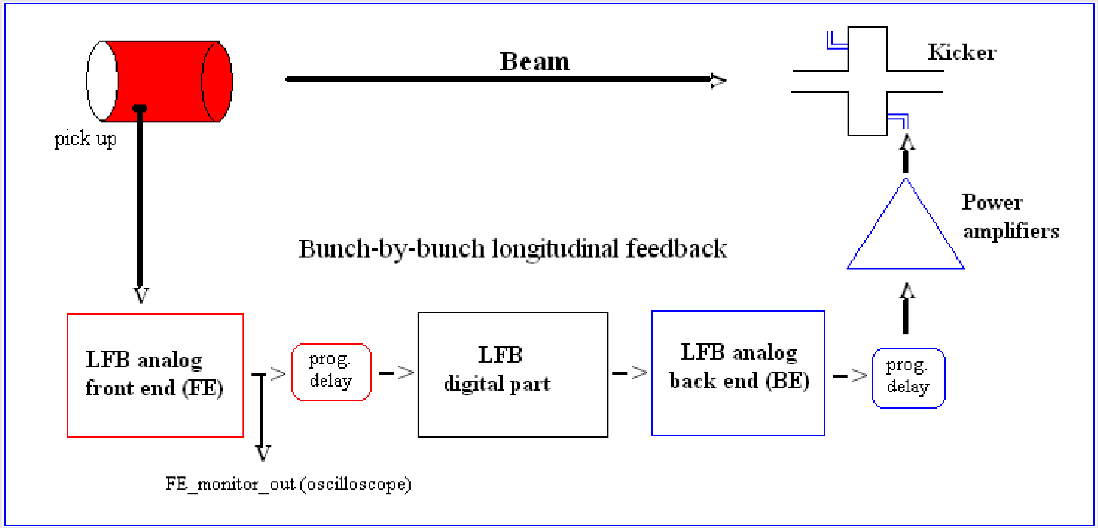
If vacuum components and BPM buttons are reused from PEP-II, the existing pickups are perfectly adequate for the feedback systems. The analog frontend and backend electronics still work very well, and, in principle, can be reused. Their control is based on the VXI bus, which is still in use, and on a now obsolete National Instruments (VxWorks-based) controller module. As a consequence, there are a number of options to be considered in an implementation for Super. The minimal cost solution would be to retain the analog front- and back-end modules unchanged. A more realistic and robust approach would be to update the software using more recent versions of controllers, operating systems and EPICS tools. Alternatively, a completely modern approach would be to use the VME64 bus and redesign with setup control based on FPGA (field programmable gate array) technology.
The power amplifiers, circulators and power loads can be reused, saving a significant amount of money ( k$). Cavity kickers (DANE -style) can be reused or, eventually, redesigned, since these are relatively inexpensive components.
The digital processing system, as well as the feedback setup controls, still perform well and could be reused, although a large number of the components, as well as the VME controllers, are now obsolete. A new digital approach based on FPGA technology has been developed and tested on PEP-II, KEKB and DANE . The ILC-DR will use the new digital approach as well, suggesting that, for synergy with ILC project, it may be attractive to implement a new FPGA-based design.
The minimal cost solution for the feedback system would be to reuse all existing components of the system, simply replacing the cables. However, it would be prudent to replace obsolete parts of the system, while taking advantage of synergies with the ILC project. For example, the FPGA technology approach for the digital processing should be implemented, using new controllers and computer servers, refreshing all the software controls and porting these to the last version of operating systems and EPICS operator interface.
4 Transverse Feedback
The transverse feedback systems, just like the LFB, were designed in the 1990s. The main components of the transverse (horizontal and vertical) feedback systems are:
-
•
Pickups (buttons and the vacuum chamber in which are located);
-
•
Frontend analog electronics;
-
•
Digital processing system and feedback setup controls;
-
•
Backend analog electronics;
-
•
Power amplifiers, absorbers and loads; and
-
•
Stripline kickers
Other important components of the system are spare parts (particularly for obsolete components); instrumentation; racks and crates; and cables.
A minimal cost strategy would be to reuse all system components. In particular, re-using the power amplifiers would save a significant amount of money. The only new costs involved would be associated with new cabling. However, to ensure future reliability, as well as to engender synergy with the ILC-DR project, a preferable approach is to implement a solution using FPGA technology for the digital processing modules, new controllers and servers, and porting all software controls to the latest system.
5 Beam Abort System
At design currents, the stored energy in both the HER and LER beams of Super is . A sudden beam loss that deposited this energy into a small region could melt the beam pipe; we therefore require a system that quickly detects faults and extracts the beam into a dump. Several types of faults should trigger beam aborts, such as a trip of a main magnet string, a fault in an RF station, a rapid loss of beam current, or excessive background radiation in the detector. Table 48 provides a detailed list.
| Manual abort from control room | Faulty beam-abort trigger sys. |
|---|---|
| Beam-stopper insertion | HV on abort kicker |
| Vacuum-valve insertion | Rapid drop in beam current |
| Faulty dipole or quad. string | Sudden large orbit excursion |
| Faulty RF station | High radiation level at experiment |
| Faulty LFB | Temp. over limit on a thermocouple |
| Faulty TFB | Trip of a klixon (thermal switch) |
The fastest of these mechanisms is a loss of RF, causing beam to spiral inward and scrape within some tens of turns. A suitable response speed can be attained only with a hard-wired system that bypasses the latency inherent to the network of control-system computers. Other fault processes are substantially slower. Magnet trips are slowed by inductance, but the response time (milliseconds) is still fast enough to hard-wire the trigger. Thermocouple trips are still slower due to heat capacity, and so can be detected by the control system, which then triggers the abort.
In a large machine, abort triggering is necessarily distributed, with processing electronics at several stations around the ring. At PEP-II, these are connected together in a bidirectional loop for each ring. Each station passes on a request for an abort to the next station. For fail-safe operation, this abort-request line normally propagates a fast clock (the ”heartbeat”) that is halted to initiate an abort. The loop starts and ends at the controller for the abort kicker, which monitors the heartbeat.
The triggering hardware must latch the source of the abort and pass this information along to the control system. In this way, if an abort is triggered by a momentary excursion, it will still be possible to determine the source. Also, an abort often causes the firing of other abort triggers. For example, RF stations will indicate high reflected power after the beam is dumped. The automatic recording of precise time stamps for each trigger is essential to determine the sequence of events.
The dump itself need not be under vacuum. In PEP-II, the beam exits the vacuum through a thin aluminum window on a chamber downstream of the kicker. It is then stopped by blocks of graphite, aluminum, and finally, copper, that make up the meter-long dump. To ensure that the beam has not burned a hole through the dump, there is a small pocket of gas, at a pressure somewhat above ambient, trapped between the second and third layers.
If the pressure in this burn-through monitor drops, then an interlock halts all further injection. (The PEP-II dumps have never shown such damage.) The abort kicker must dump the beam within one turn. Since a bunch passing through the kicker magnet while its field is rising would not get a sufficient kick to exit into the dump, but would instead start a large orbit oscillation, the kicker must have a fast risetime that is synchronized with a short gap in the fill pattern. The field must then decay slowly over the course of one turn, so that all bunches strike the dump, but each deposits its energy at a different point, in order to avoid damage to the dump window and to the dump itself. The abort gap in the fill pattern must be short, in part so that the total number of bunches available for beam is not greatly reduced. Also, at high currents a long gap would allow time for the RF cavities to gain energy while unloaded, leading to a current-dependent slew in synchronous phase from bunches at the head of the pattern to those at the tail.
6 Control System
The control system outlined here takes advantage of the considerable body of experience from other accelerator laboratories, while leaving the flexibility to draw upon new technology. In particular, the global EPICS collaboration provides a standard architecture, with a distributed database and a large collection of software tools that are continually developed, shared, supported and upgraded by the many participating labs. The collaboration is large, mature, and invaluable, since it is no longer necessary to write custom code for tasks that are common to many machines. The architecture of the control system has three tiers of distributed computing. At the front end, EPICS IOCs (input-output controllers) communicate with instruments, process the measurements, and serve this data by way of gateway computers and middleware to user applications at the top layer.
Frontend designs
Older instrumentation commonly employs modules in VME and VXI crates, or in CAMAC crates for even older installations. Stand-alone instruments, such as oscilloscopes, communicate through short-range GPIB connections to a local computer or to a GPIB-to-ethernet interface, allowing control by a distant machine. This arrangement is substantially changed in new installations. CAMAC, VXI and GPIB are no longer used, and the need for VME is greatly reduced. Some devices interface to an IOC through PLCs (programmable logic controllers). Newer instruments communicate directly over ethernet, and often include embedded processors, arranged with one for each device or for a collection of like devices. The EPICS collaboration has developed drivers for a wide range of hardware and instruments, such as motors, video cameras, and oscilloscopes. An oscilloscope is now essentially a computer hidden behind a front panel with the usual oscilloscope knobs and display. EPICS communicates with the scope through its ethernet port. It is interesting to note that these instruments often allow remote control via a web browser, using a web page served by the scope itself. While this method is of limited use for our application, since it is not integrated with the control system, the concept illustrates the evolution of instrument architecture.
Some devices, such as the BPM processors discussed in Section 1, can run EPICS on their embedded processors, turning the device itself into part of the control system. These also have the capability to save data from many ring turns and to work jointly with other processors and higher-level applications to implement fast orbit feedback.
Other diagnostics need special hardware for bunch-by-bunch data capture. For example, transverse and longitudinal feedback, and bunch-current monitoring, all begin with a task-specific analog front end that combines signals from beam pick-ups, mixes the result with an appropriate harmonic of the ring’s RF, and outputs a signal suitable for digitizing at the RF rate or faster. All bunch-by-bunch tasks can use identical digital hardware, starting with a fast digitizer, followed by an FPGA (field-programmable gate array), and finally a fast DAC (digital-to-analog converter) to drive the feedback correction signal. A computer, either nearby or on an additional board in the same box, loads the FPGA with firmware written for the specific job, reads the data accumulated by the FPGA, and serves as an IOC to communicate with the rest of the control system. The FPGA data includes both the essential results (such as the charge in each bunch) and a considerable body of supplemental beam-diagnostic information (such as the spectrum of modes being corrected by feedback). All of this can be monitored by the user over EPICS.
As always, video is needed in many places, such as at screens on the injection line, or for measuring beam size with synchrotron light. In older systems, analog cameras send signals over coaxial cable either to modulators for a closed-circuit cable television system that brings multiple channels to users in the control room, or to digitizers on frame-grabber boards in computers outside the tunnel. Digital cameras have also been available, but with interfaces that do not allow transmission over the long distances typical of large rings or linacs.
Recently, a new camera standard has been introduced that replaces the coaxial analog video output with a gigabit ethernet port. The output is entirely digital, and can be transmitted over 100 with no loss of resolution. Once on the network, the image can be displayed or analyzed by any computer. Many such images might overwhelm the capacity of the network, delaying communications with other instrumentation. One way to preserve network bandwidth is to set the cameras for a lower update rate for slowly changing images. A more thorough approach gives the cameras a separate gigabit network.
High-level applications
Many applications fundamental to running Super are similar to those at other accelerators, and are available from the EPICS collaboration, with only modest modification. This category might include BPM orbit displays, steering, orbit feedback, video and oscilloscope displays, a history buffer (an archive that records all signals periodically, typically at 1), and an error log (a recording of each change to a setting of an accelerator component, such as a magnet, or state, such as an excessive temperature). A high-level mathematical language such as Matlab is useful for writing applications, but tools must be added to provide access to EPICS data, ideally in a manner structured by physical devices to organize the many EPICS channel names. SNS, for example, is using XAL, a Java class hierarchy providing a programming framework based on the physical layout of the accelerator. The user interfaces for broadly used applications should be designed with input from operators and physicists. For less elaborate tasks, the tools should allow the accelerator physicists themselves to write the necessary code.
System management
Several items must be organized at an early stage. For example, a relational database of control items must be set up at the outset, along with a well-planned naming convention that includes both an overall scheme and many examples. Another early need is an environment for developing and testing code. This provides a basis for code management and bug tracking, and for code testing and release.
Also, the timing system should be carefully planned and started early. Timing includes both a means of generating triggers and a means of distributing pulse information to devices or processes which need that information. This combination allows triggering and data acquisition linked to events like the travel of an electron or positron bunch along the linac, to the injection of a bunch into a ring, or to one or more turns of a stored bunch in either ring.
Safety and security
The computers on the control-system network must be highly secure, but still must allow remote users to connect and control the machine. These requirements need secure firewalls and gateways restricting outside access, and also good security even within the firewalls.
The control system is also responsible for safety, both for machine protection and for personnel protection. These functions, and especially the latter, must be kept distinct from the rest of the control system to ensure a fast and reliable response.
11 Injection System
1 Requirements
The injection system for Super must provide electrons and positrons with a injection rate of about particles per second in order to compensate for beam losses due to the short beam lifetimes. This requirement will be particularly demanding for the positron source. The injected beams must also have small emittance to fit into the resticted phase space volume allocated for the injection, given the limited dynamic aperture of the machine and the requirements for the stored beam. Two possible solutions are considered here: the first based on experience with the injector for the DANE collider and the second uses a 6 linac and two 1 damping rings for electrons and positrons.
2 Extrapolation from the DANE Linac
We first briefly describe the DANE linac and injection scheme, and then examine the scaling of key parameters to the Super reuirements. The DANE injector is composed of a -long Linac and an Accumulator [127, 128, 130, 131], a -circumference ring used for longitudinal and transverse phase space damping.
The linac
The DANE linac, built on the basis of a turn-key commercial contract, accelerates both positron and electron beams to the collider operational energy. The linac is an S-band accelerator () driven by four klystrons, each followed by a SLED peak power doubling system. It delivers pulses at a repetition rate of . A quadrupole FODO focusing system is distributed along the entire structure [129]. The relevant beam parameters for both electron and positron beam operations are shown in Tables 49, 50, 51 and 52. The injection of the positron and electron beams is not simultaneous; the switching time between the two modes is about one minute.
| RF frequency | 2856 |
| Klystron power | 45 |
| No. of klystrons | 4 |
| No. of SLED peak power doublers | 4 |
| No. of accelerator sections | 16 |
| Repetition rate | 50 |
| Beam pulse width | 10 |
| Output Energy | 800 |
|---|---|
| Bunch Charge | |
| Output emittance | -mrad |
| Energy spread | 1% FWHM |
| No. of accelerator sections | 5 |
|---|---|
| Input charge from gun | particles |
| Input energy from gun | 120 |
| Output current | particles |
| Output energy | 250 |
| Output emittance | -mrad |
| Energy spread | 10% FWHM |
| Beam spot radius | 1 rms |
| No. of accelerator sections | 10 |
|---|---|
| Output energy | 550 |
| Input energy | |
| Output bunch charge | particles |
| Output emittance | -mrad |
| Energy spread | 2% FWHM |
The injector
The injector subsystem includes a thermionic electron gun, a prebuncher and a buncher. The gun, a triode with Pierce geometry, is equipped with a dispenser cathode able to deliver up to peak current in a FWHM pulse, with a maximum repetition rate of at . Typical operational values are and in the positron mode and and in the electron mode. The prebuncher is a RF cavity tuned at the fundamental frequency of followed by a drift of , and by a five cell traveling-wave constant-gradient buncher.
The RF structures and modulators
The accelerating sections (E1-E5, CS, P1-P9) are all of the same type: long, traveling wave constant gradient SLAC design structures. In our configuration, with an output of from the klystron, the nominal accelerating component of the electric field is in the CS and in the remaining accelerating sections. The phase adjustments between sections are done by means of low power phase shifters upstream of the RF amplifiers of each klystron, and by a high power phase shifter that uncouples the CS and E1 sections. The four modulators are able to produce a video pulse of FWHM and flat top, with a peak power of 100 at 50 pps. A HV power supply with a resonant charging circuit charges a pulse forming network, composed by 8 LC cells, to 50. The switching thyratron is an EEV CX2168. A schematic layout of the linac RF system is shown in Fig. 118.
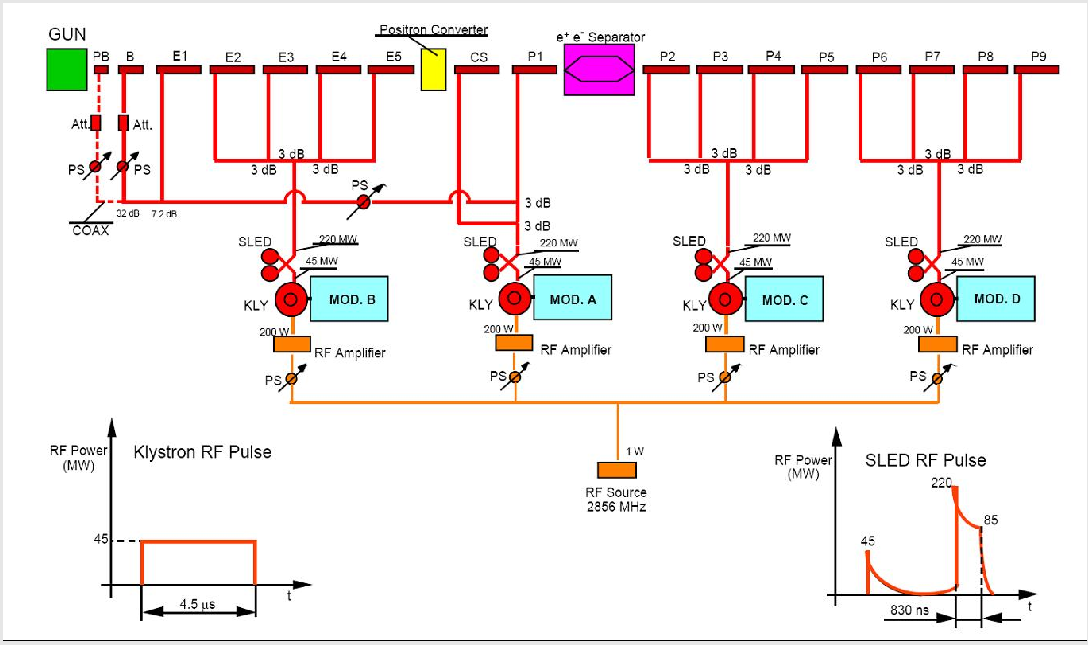
The positron source
The positron beam is produced by a high-energy electron beam impinging on a high target [132]. Due to the initial small transverse size, but large divergence, of the beam emerging from the target, a flux concentrator is placed between the target and the capture section in order to trade a reduction in the divergence for increase in beam size (SLAC design [133]). The concentrator consists of a tapered field DC solenoid, with a peak of , plus a pulsed coil generating a solenoidal field that drops adiabatically from a peak of to zero in about . A length of uniform field DC solenoid, wrapped around accelerating sections CS and P1, completes the magnetic focusing of the capture system. The system allows the choice of 3 different targets, with thickness varying around 2 radiation lengths, built with an alloy of tungsten and rhenium. A remotely controlled actuator permits the extraction of the target from the beam path during electron mode operation. The accelerating gradient of the CS reduces the large energy spread of the outcoming beam. Another efficient knob to minimize this effect is the CS RF phase. The RF scheme for the linac allows operation in both accelerating and decelerating modes. The nominal conversion efficiency is , which is consistent with operating experience of .
The accumulator ring
The accumulator is a quasi-octagonal ring with a total length of along the nominal trajectory. Its lattice is made of four almost achromatic arcs, each consisting of two 45 degree full iron H-type sector dipole magnets with a small gradient to optimize the damping distribution, a quadrupole triplet and two sextupoles to correct the ring chromaticity. All the dipoles are powered in series. The quadrupoles are connected in three independent families, and the sextupoles in two families. The electron beam from the linac is injected into the ring by a system of two septum magnets, the first bending the beam by 34 degrees and the second performing the final deflection of 2 degrees into a special vacuum vessel between two achromats. The stored beam is extracted by a mirror-symmetric system placed in the opposite straight section. The positron beam follows the opposite path. The remaining two straight sections host the pulsed kicker magnets used to deflect the beam at injection and extraction and the RF cavity. A system of 8 correctors and 10 position monitors allows a careful correction of the closed orbit in the ring for the purpose of optimizing injection efficiency. Two synchrotron light monitors and two stored current monitors are also part of the diagnostic system. A transverse feedback system is implemented on the ring: it consists of a stripline pick-up and a stripline kicker. The vacuum chamber is fully stainless steel and a pumping system consisting of 18 sputter ion pumps is designed to reach an average dynamic pressure in the ring of . A parameter list for the accumulator is provided in Table 53 and a schematic layout is shown in Fig. 119.
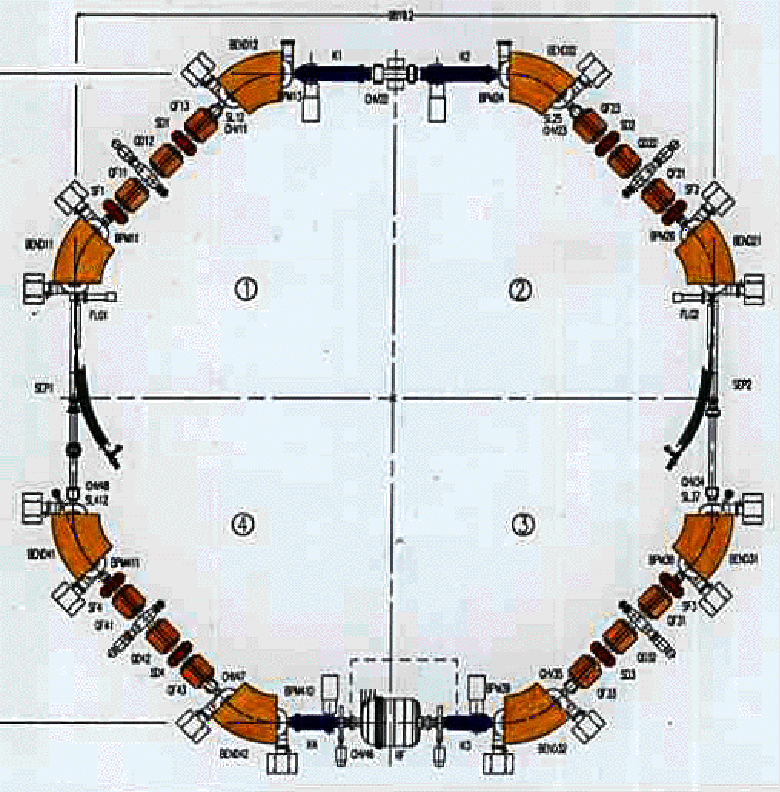
| Energy | 510 |
|---|---|
| Circumference | 32.56 |
| Emittance | 0.26- |
| Horizontal betatron tune | 3.12 |
| Vertical betatron tune | 1.14 |
| RF frequency | 73.65 |
| RF voltage | 200 |
| Max storable current | 100 |
| Bunch length | 3.8 |
| Synchrotron radiation loss per turn | 5.2 |
| Horizontal betatron damping time | 21.4 |
| Vertical betatron damping time | 21.4 |
| Longitudinal damping time | 10.7 |
Injection schemes
The injection system for the DANE main rings is designed to provide full flexibility in the bunch patterns [134, 135]. The circumference of the accumulator is of the main ring, so that a single bunch stored in the booster can be transferred on each turn into one out of three equidistant buckets of the main ring. The accumulator RF harmonic number is 8, and therefore 24 buckets of the main ring can be filled by shifting the relative phase of the linac gun with respect to the accumulator cavity. The main ring revolution frequency acts as a clock for the whole system. The accumulator RF system, running at the 24th harmonic of the clock is phase-locked to the main ring system, and its phase is shifted with respect to the clock in steps of during the damping time before extraction () when more than 24 bunches are to be injected, or if the desired bunch pattern is not in coincidence with one of the 8 accumulator buckets. Five steps are necessary to fill all the main ring buckets. The trigger of the linac gun is locked to the accumulator RF generator, with the capability of reaching any of the 8 accumulator buckets. The acceptance of the booster, due to high cavity voltage and low energy of the beam, is almost one bucket length in phase () and in energy spread. A , bunch from the linac is accepted in longitudinal phase space with more than efficiency. The standard positron injection cycle in DANE involves positron accumulation at in the accumulator, with extraction and injection into the main rings at . The bunch charge injected in the MRP is about per pulse at (15 pulses in the accumulator).
Scaling for Super
In the positron converter scheme, where a primary electron beam impinges on a metallic target, the number of pairs emerging from the target depends on the target thickness (radiation length units) and the primary electron beam energy in a form that can be approximately expressed by [132, 136]:
| (42) |
where:
| (43) |
The function has a small dependence from and can be approximated as . The critical energy can be approximated by:
| (44) |
where is the target atomic number. The number of produced pairs is maximum when :
| (45) |
In the case of DANE , the tungsten target thickness is optimized for . For other primary beam energies an estimate of the relative variation in the positron yield can be obtained from:
| (46) |
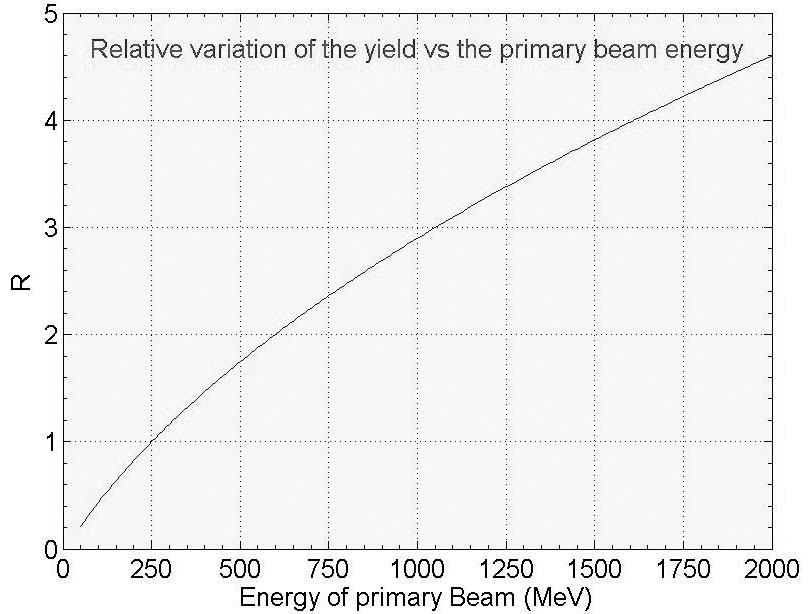
The variation in this relative yield is shown in Fig. 120 for beam energies up to 2. In recent years there has been intense effort directed towards developing high intensity positron sources [137, 138, 139]. These studies show that, with crystalline targets, it is possible to achieve additional enhancement factors of 2–3 in the normalized positron yield over the corresponding amorphous material. Starting from the yields of the DANE positron injection system (Section 2) of about a injection pulse, and assuming a primary electron beam and a crystalline target, we estimate that an eightfold enhancement factor could, in principle, be obtained providing a injection rate at . Other gains could be realized through a higher value for the magnetic field in the adiabatic matching system downstream of the target, and through a more fully optimized design of the transport line optics [140]. In any case, the overall improvement must be carefully evaluated with proper particle tracking codes. A schematic drawing of a possible injection scheme is shown in Fig. 121.

3 Alternative Solution for the Injection System
An alternative design for the injection system requires a polarized electron gun, a 6 linac operating at 2856, a positron converter at the 5 location, two damping rings operating at 1, two beam transport lines (BTL) to the Super LER and HER rings, and finally spin manipulation solenoids. Many components of the SLAC electron and positron sources could be reused in this scenario. The SLAC polarized gun produces two longitudinally polarized bunches of about particles at 120; we assume the linac will operate at 100. There are several possible injection schemes for the Super accelerator using this system, but we describe a solution where the 100 repitition rate for the linac is divided into 25 for electrons and 75 for positrons. The length for the linac tunnel, assuming the same average gradient as the SLAC linac (17/m), is . Such an injection linac, even allowing extra length for injection lines, would easily fit into the tunnel planned for the Italian SPARX FEL project, which has length of about 1.
Electron injection
The electron gun produces two longitundinally polarized bunches with at a rate of 25. These bunches are accelerated to 1 and injected into an electron damping ring. In the injection line for the damping ring, the bunches pass through a spin rotator to rotate the spin into the vertical direction in the damping ring. The transverse emittance of the electron bunches is damped over a time of 0.04 (1/25). The two bunches are extracted, injected into the linac, and then accelerated the full 6 to a final energy of 7, before beam transport to the Super HER. Spin manipulation solenoids are inserted into the damping ring-to-linac transport line to provide vertically polarized electrons for injection into the electron storage ring. There will be some losses from injection and extraction from the damping rings, and from injection into the Super ring, which we estimate to be about 15%. The number of electrons available for injection with this scheme is (eff) (Hz) (bunches) (per bunch) per second.
Positron injection
The electron gun produces two bunches with at a rate of 75. The two bunches are accelerated to 5 before impinging on a positron converter target. The resulting positron bunches are subsequently captured by an accelerating section. We assume that polarization is not required for the positrons. The SLAC SLC positron converter source produced two usable positrons for each incident electron at 30. For the Super injector, with a 5 beam, the same system will yield about six times fewer positrons, since the yield is proportional to the incident energy. After the positron target, the positrons are captured and accelerated to 1 in the remaining section of the linac. The positrons are then transported back to the beginning of the linac and injected into the positron damping ring at 1. The positrons remain in the damping ring four injection cycles (three and one ) or 0.04 (1/25) in order to achieve low emittance. The positron damping ring will have six bunches stored at any one time. After four storage cycles the oldest two positron bunches are extracted from the damping ring and accelerated to 3, before beam transport to the Super LER. The positrons, with very large emittance from the target, will likely have a smaller injection efficiency into the damping ring than the electrons; we assume an efficiency of 67%. A pulsed magnet chicane near the target will be needed to allow the bunch pair to miss the target and one bunch pair to strike the target on the same linac pulse. The number of positrons available for injection with this scheme is (eff) (conversion) (Hz) (bunches) (per bunch) positrons per sec.
4 A Polarized Source as an Upgrade
Polarized electron-positron pairs can be produced by converting circular polarized-high energy gammas in a solid/liquid target. The most efficient process for energy amplification in the production of high energy photons is Compton scattering, where the collision between a high energy electron and a photon boosts the energy of the recoiling photon. In this way, it is possible to produce gammas in the 10–100 energy range by colliding electron beams of 1–2 with a pulse from a solid state laser [141]. Higher electron energy is required if a laser () is used, but in this case, the advantage is the linear increase of the photon number per pulse energy. In all cases, the final photon polarization depends only on the laser polarization, and not on that of the electron beam. It is therefore possible to select the polarization of the gamma, and consequently of the positron, by switching the laser polarization.
Compton production is very attractive from an energy conversion efficiency point of view, but has the disadvantage of a very small elastic cross section (, where the classical electron radius). In order to increase the rate, in the case of a solid state laser, the number of photons per pulse can be amplified by stacking laser pulses into a Fabry-Perot optical resonator [141]. Typical gains of order for a pulsed laser have already been achieved [142], but development aimed at attaining gains of or [141] are underway.
After production, the polarized gammas can be converted into linearly polarized pairs in a solid target. To maximize the production rate, 0.4–0.5 radiation length thick tunsgten or titanium targets have been studied [143]. To maximize the collection efficiency for the produced positrons, the target is placed in a “capture section” composed of strong solenoidal fields and accelerating cavities [144]. For polarized positron beams, an conversion efficiency parameter is observed [145]. To optimize the efficiency for injection and capture in the main ring, it is possible to stack different bunches in an intermediate accumulator ring [146]. After a few milliseconds of stacking and cooling the beam can be transferred to the main ring.
A schematic summary of the full scheme for a polarized positron source based on Compton scattering is shown in Fig. 122, where the process is divided into three parts: gamma production, pair production and positron capture.
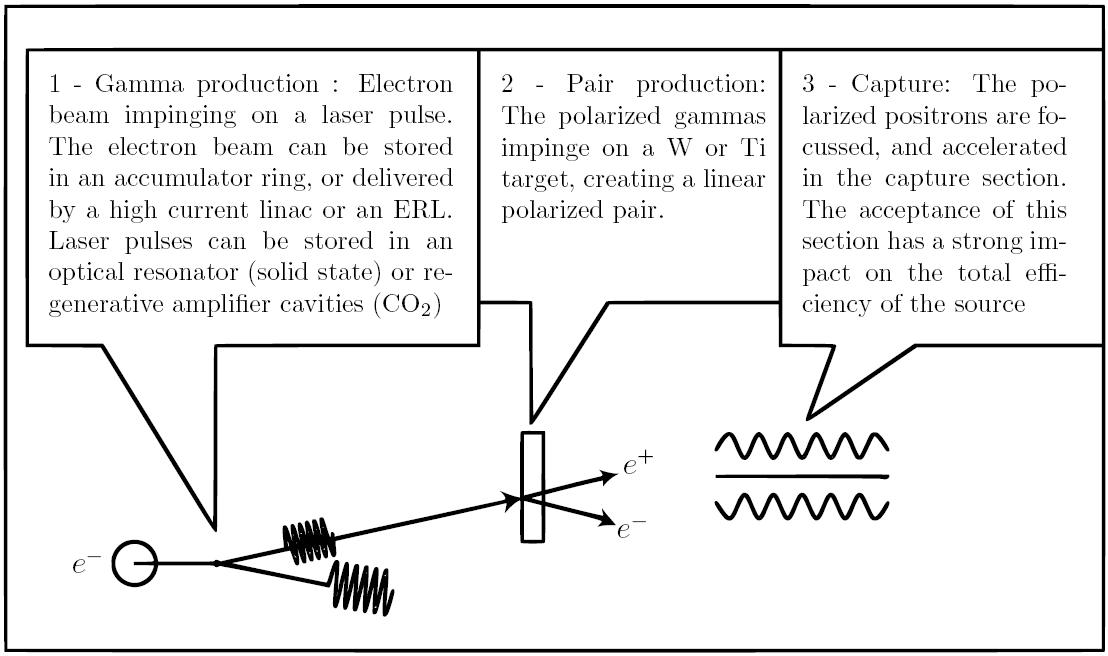
Estimate of the positron rate and application to Super
Super requires polarized positrons per second (60–70% beam polarisation). The optimized time structure for injection must still be defined, depending on the injection scheme; we will therefore evaluate here only the beam characteristics and the number of Compton collisions needed to meet the Super requirement.
The total rate of polarized positrons that can be delivered to the main ring is defined by:
where is the number of backscattered gammas per collision, is the number of collisions per second and is the efficiency for production and capture of the polarized positrons. If we assume , the result is:
To determine the necessary number of collisions needed to attain the required flux we must estimate the number of backscattered gammas per collision.
ILC simulations and scaling to Super parameters
A number of simulations have already been carried out in connection with the ILC. scales linearly as a function of the laser pulse and electron bunch intensity up to the threshold of the non-linear Compton regime. Given the small backscattered gamma/electron ratio we are assuming, this should not be a factor for Super. Table 54 summarizes simulation results obtained with the Monte Carlo code CAIN for a number of relevant configurations. Two different solutions are illustrated for the electron machine used for gamma generation to emphasize the range and flexibility of solutions envisaged for the Super case. These two solutions are under consideration for the ILC: an accumulation ring in which the Compton cavities are inserted in the collision region, and an energy recovery linac with the interaction region inserted in the recirculation line. In the Compton ring, because of the crossing angle and the long electron bunch, the flux is reduced. The “OPO” (optimized path for overlap) crab angle scheme strongly reduces this effect [147], but has not yet been proven experimentally.
| Compton ring + laser + optical resonator. One interaction point. (ILC parameters) | |||
| Electron beam | Laser pulse | Angle collision | |
| Energy = | Wavelength = | ||
| Charge = | Pulse energy = | No Crab | |
| Waist = | |||
| Pulse length = | No Crab | ||
| OPO Crab | |||
| ERL + laser + optical resonator. One interaction point. (ILC parameters) | |||
| Electron beam | Laser pulse | Angle collision | |
| Energy = | Wavelength = | ||
| Charge = | Pulse energy = | No Crab | scaled to |
| laser: | |||
| Waist = | |||
| Pulse length = | |||
| (bunch compression) | |||
Based on the Super parameters, and assuming only one interaction point, we must accumulate pulses in one second to satisfy the injection requirements ( gammas/sec to provide positrons/sec). Continuous injection at would be enough to satisfy this requirement. Nevertheless, it should be emphasized that the simulations summarized above were performed assuming very high performance parameters, for which R&D is still ongoing in connection with the ILC. The Super polarized positron source design will be the subject of dedicated studies in collaboration with LAL-Orsay.
12 Polarization
1 Introduction
The study of and violation in the lepton sector, in particular, the search for or violation in the production and decay of lepton pairs, is an important objective of the Super program. Thus, the provision of polarized electrons and/or positrons [148] is an important design consideration. The requirements for a polarization facility include:
-
•
A stable longitudinal direction for spin at the IP;
-
•
A depolarization time longer than one beam lifetime;
-
•
Fast switching of the sign of the polarization, within or less one beam lifetime;
-
•
The ability to provide arbitrary filling patterns, e.g., it would be very useful to have opposite polarizations in neighboring RF buckets;
-
•
Polarization of the electron beam in the initial design, with the possibility of positron polarization as an upgrade; and
-
•
High degree of polarization.
Existing laser gun technology can provide electrons with up to polarization at the required intensity and repetition rate [149, 150]. Direct acceleration of electrons in a linac up to the full LER/HER energy completely eliminates all problems related to crossing integer or intrinsic resonances during acceleration in a booster ring. Such an injection scheme for polarized electrons will be described in more detail below.
The effective polarization asymmetry for a collision:
where and are the linear polarizations of the electron and positron beams, approaches unity if both beams are polarized in the same direction with high individual polarizations, as shown in Fig 123. For example, if , while , if . In addition, the effective luminosity enhancement for one-photon annihilation processes due to polarization is:
This becomes a factor of two in the limit as illustrated in Fig. 124.
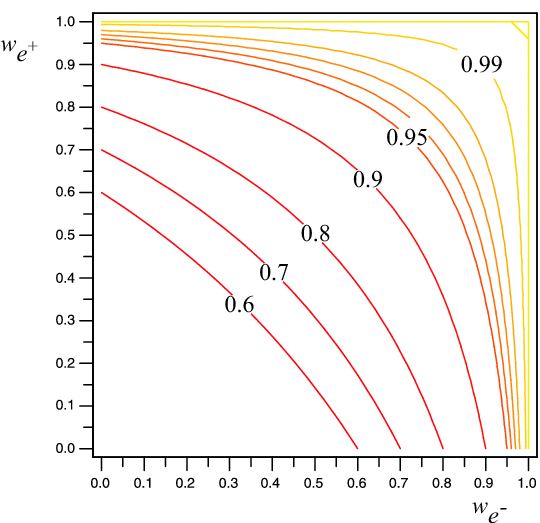
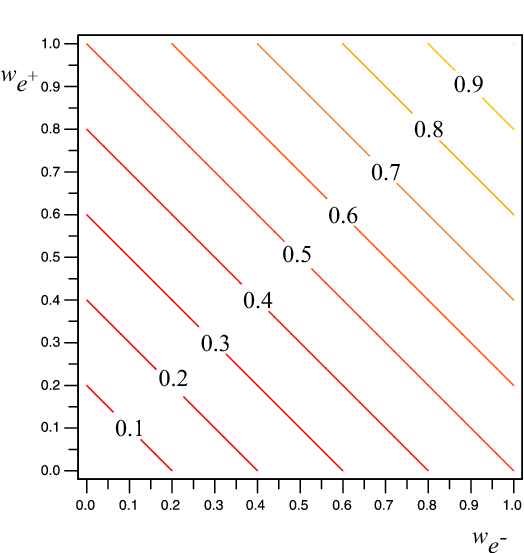
Despite these advantages, the difficulty in obtaining polarized positrons seem sufficiently large that we defer this the installation to a possible upgrade of Super.
Spin direction manipulations are most easily done at energies; this is the approach taken, for example, at NIKHEF’s AmPS facility [151], where a so-called -manipulator is used. This device employs a combination of two electrostatic bends to rotate spin by around the vertical axis while solenoids between these bends provide spin rotation around the longitudinal direction. The spin direction of electrons injected into the HER can be changed very quickly with this arrangement, perhaps with every source laser pulse as the ultimate limit, simply by changing the sign of circular polarization for the laser light.
2 Siberian Snake Solution
There are many ways to create a stable closed orbit with a longitudinal direction for spin at the collision point. However, a Siberian Snake is perhaps the simplest method [152]. The spin trajectory in a ring with one Siberian Snake installed a half-turn from the IP is shown in the Fig. 125. Two solenoids, with intervening normal quads to provide decoupling of the betatron oscillations, rotate spin by around the longitudinal axis. This arrangement results in the formation of a closed spin orbit with a purely longitudinal equilibrium spin direction at the IP. Everywhere along the arcs, the spin lies in the horizontal plane, rotating around the vertical axis, which is directed along the bending magnetic field of the ring. Perpendicular to , spins make a half turn around each turn, and thus the total spin tune equals .
The coupling induced by the two solenoids of a full Siberian Snake must somehow be compensated in the ring optics. The simplest, and at the same time very convenient way to do this, was suggested by Litvinenko and Zholents in 1980 [153]. If matrices of the FODO lattice inserted between solenoids satisfies the requirement:
then the horizontal and vertical betatron oscillations became fully decoupled, as shown in Fig. 126. An additional requirement comes from the spin transparency condition [154]:
In the case of the partial Siberian Snake, which rotates spin by the total angle , this expression becomes:
3 Equilibrium Polarization and Depolarization Time
The degree of polarization at equilibrium and the spin relaxation time are described by the formulae of Derbenev and Kondratenko [155]:
where is the modulus of the radius of curvature, is a unit vector directed along the bending field , is the velocity vector (assuming ), and is the so called spin-orbit coupling vector.
In a sense, vector describes the chromaticity of the equilibrium spin direction . Its value is proportional to the energy:
In a normal ring with one spin-transparent Siberian Snake, , averaged over the circumference, can be evaluated exactly:
A general formula for the vector is:
where it is assumed that a spin perturbation is adiabatically switched from zero to its final value over the azimuthal interval . The three components of the spin perturbation are given by:
The complex vector , where , , and are three real unit vectors representing the three orthogonal solutions of the spin motion equation for the equilibrium particle, provides a convenient description of a rotation of spin around the direction by the angle . Writing , , the periodicity conditions are:
Thus, is periodic, while receives a phase advance after one turn. As already noted, in the case of a ring with a Siberian Snake the spin tune is .
The equilibrium degree of self-polarization becomes nearly zero in the case of a Siberian Snake and the spin depolarization time at and is approximately: ( for ).
Mixing fresh polarized beam through continuous injection with an old partly depolarized circulating beam, one finds an equilibrium polarization:
Here is the initial polarization of the injected particles, is the beam life time, , are the asymptotic radiative self-polarization degree and the radiative polarization time, respectively. From thisrelation we conclude that if . The beam lifetime is determined mainly by the luminosity and by Touschek losses, and is estimated to be approximately . Taking , ,and one obtains an average degree of polarization:
4 Polarization Schemes for 4 and 7
The simplest scheme with one Siberian Snake in a ring works very well below . At higher energies, the depolarization time becomes too short. Therefore, much more complicated schemes with restoration of the vertical spin direction in the arcs must be considered for the Super implementation at and .
A possible layout is shown in Fig. 127. The first spin rotator (red box) rotates spin by around the longitudinal axis, then a rotation around the vertical axis brings the spin to a purely longitudinal orientation at the IP. The second half of the full insertion is just symmetric or anti-symmetric relative to the IP. To be spin-transparent for the betatron oscillations, each spin rotator is comprised of two solenoids, with the FODO lattice between.them. However, in this case, the matrices of one spin rotator should satisfy the condition [154]:
The field integral required for one solenoid at is equal to:
A symmetric layout does not work, in fact, because the -direction is still chromatic in the arcs, in other words and, as a result, the beam will quickly depolarize. The anti-symmetric option meets this condition, but cannot be used because of of the final focus design crierion that specifies only positive bends. Two symmetric insertions could, in principle, compensate each others’ spin-chromaticity, but such a solution appears much too complicated.
We therefore believe that a HERA-like solution is the only way to obtain longitudinal polarization at high energies [156]. The proposed scheme is shown in Fig. 128. A sequence of vertical and horizontal bends, each rotating the spin by , transforms an initial vertical direction for into the longitudinal direction at the IP. Vertical bends are anti-symmetric relative to IP, while in contrast all horizontal bends are positive and symmetric. Every vertical bend is made achromatic by being divided in two half-bends and placing some optics in between. The two horizontal bends closest to the IP belong to the FF-insertion.
Every spin rotation translates into of a velocity bend at . After the two first bends, the -plane is inclined by . This could be rolled back by a weak solenoid with . The vertical orbit excursion will not exceed .
The scheme discussed here could be made spin-achromatic for the off-momentum particles, and simultaneously spin-transparent for particles with non-zero betatron amplitudes. The estimated depolarization time at is: . Taking a beam lifetime of and a polarization for the injected beam: .

Some of the advantages of using transverse bend spin rotators include:
-
•
Provision for a spin-achromatic and a spin-transparent solution;
-
•
Bending magnets are cheaper than solenoids; and
-
•
Positive horizontal bends match the final focus lattice.
Disadvantages include
-
•
An orbit bump of several meters is needed in the vertical direction at ; and
-
•
The implementation is a fixed energy solution, applicable only for .
5 Super Polarization Scenario
There is no universal solution that can be applied at all intended operating energies. We therefore continue to develop two essentially different approaches.
The first, namely the Siberian Snake concept, works very well below . The Siberian Snake insertion is located in the straight section opposite to the IP. A longitudinal polarization direction at the IP is provided by two solenoids with a field integral: . Non-skewed quadrupole lenses between the solenoids compensate the betatron coupling. The solenoids could be switched off if experiment is to be operated at higher energies, where the Siberian Snake could not be used. Depolarization time with the snake exceeds one hour at .
The second solution, based on HERA-like spin rotators with the use of transverse fields, is applicable at . At lower energies the required vertical orbit bumps became too large. A bypass could be used to switch off the spin perturbations generated by vertical orbit bumps of these spin rotators in case of operation at low energies, where the Siberian Snake option could be applied. In both scenarios, the average polarization of the circulated beam can reach .
13 Site and Utilities
1 Tunnel
The 2.3-circumference tunnel for the Super Factory must have a diameter of 4 to 6 meters to accommodate the two accelerator rings, trays for the power and control cables, cooling water pipes, an access path for equipment, and space for safety egress. The two accelerator rings will be placed side-by-side in one tunnel to keep both rings in the same plane. This reduces or eliminates vertical bends that tend to increase the vertical emittance. Since the rings as designed have six straight sections, there will be six support buildings, one for each straight. One of the straight sections will have the interaction region housing the Super detector, and will therefore be substantially larger () than the others. The magnet power supplies and controls, cooling water conditioners, RF power supplies and controls, and diagnostic controls will be housed in these straight section buildings. Other than these buildings, the ring tunnel will be fully underground. The tunnel for the Super Factory could be constructed using several methods, as appropriate: cut and cover, boring, blasting, etc.. In order to provide radiation containment, the earth surrounding the tunnels must have a thickness of about 3 to 6 meters, depending on detailed calculations. A floor drainage system with sump pumps will be provided in the tunnel to contain, collect and treat any free-running water in the tunnel.
2 AC Power
The accelerator requires power for electromagnets, RF systems, diagnostics and controls, and air handling systems. The largest power contribution is from the RF system used to replace the energy lost by the beams due to synchrotron radiation in the bending magnets and wigglers.
The power requirements for Super are shown in Table 55. The table includes RF power including inefficiencies of the klystrons and power supplies, magnet power for the two rings, power for water distribution and cooling, control power, injector power and the total estimated requirement.
The power required depends on the beam energies, since the beam current, synchrotron radiation and injector energy change with the energy of each ring. The needed power for three possible combinations of HER and LER beam energies are shown. Within this range of configurations, the minimum site power is about 34 MW and the maximum is 43 MW. The minimum wall power requirement is achieved with the design asymmetry of 4 on 7.
| Beam Energy (HER/LER) (GeV) | 7.0/4.0 | 8.0/3.5 | 9.0/3.1 |
|---|---|---|---|
| Beam current (HER/LER) (A) | 1.3/2.3 | 1.1/2.6 | 1.0/2.9 |
| HER RF power (MW) | 8.6 | 12.8 | 18.2 |
| LER RF power (MW) | 8.6 | 5.8 | 4.1 |
| HER magnet power (MW) | 4.0 | 5.2 | 6.6 |
| LER magnet power (MW) | 3.0 | 2.3 | 1.8 |
| Cooling system power (MW) | 2.4 | 2.6 | 3.1 |
| Control power (MW) | 0.5 | 0.5 | 0.5 |
| Injection system power (MW) | 4.0 | 4.6 | 5.1 |
| Lights and HVAC (MW) | 3.0 | 3.0 | 3.0 |
| Total Site Power (MW) | 34.1 | 36.8 | 42.4 |
3 Cooling System
The electromagnets and RF systems require cooling water to operate at a constant temperature. The cooling water must be pumped around the ring with a supply line and a return line. Each subsystem will tap into these lines. The cooling water will be chilled with cooling towers, pumps, and heat exchangers outside the tunnel. Approximately 80% of the power listed in Section 2 must be removed using a cooling tower. The remainder will be dissipated external to the tunnel, mostly by the high-power high-voltage power supplies for the RF system.
4 Air Conditioning
The water cooling system is needed to provide a steady temperature environment for the six straight section buildings. All effort will be made to remove excess heat from these building using the cooling water system, but the remaining heat will removed using an air conditioning system, which will need a capacity of about 2.5 to remove the power unavoidably transferred to the building air via current-carrying cables etc..
References
- [1] “KEKB Status report,” PAC 2005 Knoxville, TN.
- [2] “PEP-II Status report,” PAC2005 Knoxville, TN.
- [3] “The SLC Design Handbook,” SLAC November 1984.
- [4] “International Linear Collider Technical Review Committee,” Second Report 2003, ICFA, SLAC-R-606.
- [5] P.Raimondi, “Status of the Super Effort,” presentation at the 2nd Workshop on Super Factory, LNF-INFN, Frascati, March 2006, http://www.lnf.infn.it/conference/superb06/talks/raimondi1.ppt.
- [6] P. Raimondi and M. Zobov, “DAFNE Technical Note G-58,” April 2003; D. Shatilov and M. Zobov, ICFA Beam Dyn. Newslett. 37, 99 (2005).
- [7] K. Hirata, “Analysis of Beam-Beam Interactions with a Large Crossing Angle,” Phys. Rev. Lett. 74, 2228 (1995).
- [8] F. Ruggiero and F. Zimmermann, “Luminosity Optimization near the Beam-Beam Limit by Increasing Bunch Length or Crossing Angle,” Phys. Rev. ST Accel. Beams 5, 061001 (2002).
- [9] D.V.Pestrikov, “Vertical Synchrobetatron Resonances due to Beam-Beam Interaction with Horizontal Crossing,” Nucl. Instr. Methods Phys. Res., Sect. A 336, 427 (1993).
- [10] J. Seeman et al., “Parameters of a Super Factory Design,” Proc. of 2005 Particle Accelerator Conference, 2333 (2005).
- [11] H. Koiso, “Super Factories,” Proc. of 2005 Particle Accelerator Conference, 64 (2005).
- [12] “DANAE Letter of Intent,” http://www.lnf.infn.it/lnfadmin/direzione/roadmap/ DANAE_LOI.pdf.
- [13] K. Ohmi et al., “Luminosity Limit due to the Beam-Beam Interactions with or without Crossing Angle,” Phys. Rev. ST Accel. Beams 7, 104401 (2004).
- [14] P. Raimondi, D. Shatilov and M Zobov, “Beam-Beam Issues for Colliding Schemes with Large Piwinski’s Angle and CW,” in preparation.
- [15] Y. Honda et al., “Achievement of ultralow emittance beam in the ATF damping ring,” Phys. Rev. Lett. 92, 054802 (2004).
- [16] “ILC Baseline Configuration Document”: http://www.linearcollider.org/wiki/ doku.php?id=bcd:bcd_home.
- [17] S.Araki etal, physics/0509016 and KEK 2005-60, CLIC Note 639, LAL05-94, CARE/ELAN Document 2005 013.
- [18] “PEP-II: An Asymmetric Factory,” Conceptual Design Report, CALT-68-1869, LBL-PUB-5379, SLAC-418, UCRL-ID-114055, UC-IIRPA-93-01, June 1993.
- [19] K. Halbach, “Physical and Optical Properties of Rare Earth Cobalt Magnets,” Nucl. Instr. Methods Phys. Res.187, 109 (1981).
- [20] M. Sullivan, et al., “Results from a Prototype Permanent Magnet Dipole-quadrupole Hybrid for the PEP-II Factory,” Proc. of 1997 Particle Accelerator Conference, 3330 (1997).
- [21] W.R. Nelson, H. Hirayama, and D.W.O. Rogers, “The Egs4 Code System,” SLAC-R-0265, Dec 1985.
- [22] “SPEAR 3 Design Report,” SLAC-R-609, Nov 2002.
- [23] W.R. Nelson, S. Ecklund, and R.C. Field, “EGS4 Calculations for a PEP-II Luminosity Monitor,” SLAC-PUB-1721, Aug. 1997.
- [24] ILC Baseline Configuration Document: http://www.linearcollider.org/wiki/ doku.php?id=bcd:bcd_home.
-
[25]
K. Oide, Nucl. Instr. Methods Phys. Res., Sect. A 276, 427 (1989).
http://acc-physics.kek.jp/SAD/sad.html. - [26] P. Raimondi amd A. Seryi, “A Novel Final Focus Design for Future Linear Colliders,” Phys. Rev. Lett. 86, 3779 (2001).
- [27] M. Zobov et al., “Luminosity performances at DANE ,” Proc. of EPAC 2002, Paris, France, 443 (2002).
- [28] M. Bassetti, M.E. Biagini, and C. Biscari, “Solenoidal Field Compensation,” 14th Advanced ICFA Beam Dynamics Workshop, Frascati, 209 (1007).
- [29] Y. Cai, M. Donald, J. Irwin, and Y. Yan, “LEGO: A Modular Accelerator Design Code,” SLAC-PUB Report No. 7642, 1997.
- [30] “PEP-II: An Asymmetric Factory,” Conceptual Design Report, SLAC-418, pages 79-81, June, 1993.
- [31] E. Forest, M. Berz, and J. Irwin, “Normal Form Methods for Complicated Periodic Systems: A Complete Solution using Differential Algebra and Lie Operators” Particle Accelerators, Vol. 24, 91 (1989).
- [32] See for example ILC-TRC/Second Report 2003 SLAC-R-606, page 357.
- [33] Y. Honda et al., “Achievement of Ultralow Emittance Beam in the Accelerator Test Facility Damping Ring,” Phys. Rev. Lett. 92, 054802 (2004).
- [34] See for example A. Wolski, J. Gao and S. Guiducci, ”Configuration Studies and Recommendations for the ILC Damping Rings,” pages 70-90, LBNL-59449 (2005).
- [35] K. Kubo, “Simulation Study of Low Emittance Tuning of the Accelerator Test Facility Damping Ring at KEK,” Phys. Rev. ST Accel. Beams 6, 092801 (2003).
- [36] J.K. Jones, “Tuning Algorithms for the ILC Damping Rings,” Proc. of EPAC 2006, Edinburgh, Scotland (2006).
- [37] Y. Nosochkov, “Design and Simulation of Tuning Knobs for the Final Focus,” Presented at the ATF2 Project Meeting, SLAC, February 3-5, 2006.
- [38] H. Grote, F.C. Iselin, “The MAD Program,” CERN/SL/90-13(AP).
- [39] K. Hirata, “BBC User’s Guide: A Computer Code for Beam-Beam Interactions with a Crossing Angle, Version 3.4,” CERN SL-Note-97-57-AP, Aug. 1997.
- [40] D. N. Shatilov, “Beam-Beam Simulations at Large Amplitude and Lifetime Determination,” Part.Accel.52: 65-93, 1996.
- [41] “KEKB Factory Design Report,” KEK Report 95-7, Aug. 1995.
- [42] K. Hirata, D. Shatilov and M. Zobov, “Beam-Beam Interaction Study for DANE ,” Frascati Phys.Ser.10: 303-308, 1998.
- [43] G. Altarelli and F. Buccella, Nuovo Cimento 34,6385
- [44] R. Kleiss and H. Burkhardt, “BBBREM: Monte Carlo Simulation of Radiative Bhabha Scattering in the Very Forward Direction,” Comput. Phys. Commun. 81, 372 (1994).
- [45] H. Burkhardt, “Proceedings of the third Workshop on LEP Performance,” J. Poole, ed., CERN SL/93-19 (DI).
- [46] U. Wienands et al., Proc. of ICFA Workshop on Colliders, Cornell, October 2001.
- [47] H. Bruck, “Circular Particle Accelerators,” English translation LA-TR-72-10, Los Alamos, NM, page 323.
- [48] J. LeDuff, in Proc. CERN Accelerator School, 2nd Advanced Accel. Physics Course, Berlin, F.R. Germany, 114 (1987).
- [49] C. Bernardini et al., Phys. Rev. Lett. 10, 407 (1963).
- [50] M. Boscolo, M. Antonelli, and S. Guiducci, “Simulations and measurements of the Touschek background at DANE ,” EPAC02, Paris, France, 2002.
- [51] M. Boscolo and S. Guiducci, “A Comparison between Data and Simulations of the DANE Beam Induced Backgrounds in KLOE ,” DANE Techn. Note IR-10, 2001.
- [52] A. Piwinski, Proc. of the 9th International Conference on High Energy Accelerators, Stanford, California, 405 (1974).
- [53] J.D. Bjorken and S.K. Mtingwa, “Intrabeam Scattering,” Part. Accel. 13, 115 (1983).
- [54] C. Steier, D. Robin, A. Wolski, G. Portmann, and J. Safranek, “Coupling Correction and Beam Dynamics at Ultralow Vertical Emittance in the ALS,” Proc. of PAC 2003, Portland, Oregon (2003).
- [55] Y. Honda et al., “Achievement of Ultralow Emittance Beam in the Accelerator Test Facility Damping Ring,” Phys. Rev. Lett. 92, 054802 (2004).
- [56] A. Wolski, J. Gao, and S. Guiducci, “Configuration Studies and Recommendations for the ILC Damping Rings,” pages 105-110, LBNL-59449 (2005).
- [57] K. Kubo, S.K. Mtingwa and A. Wolski, “Intrabeam Scattering Formulas for High Energy Beams,” Phys. Rev. ST Accel. Beams 8, 081001 (2005).
- [58] M. Venturini, K. Oide, and A. Wolski, “Space-Charge and Equilibrium Emittances in Damping Rings,” LBNL Report no. LBNL-59509, (2006) Berkeley, (also in EPAC-06 Proceedings).
- [59] M. Venturini and K. Oide, “Direct Space-Charge Effects on the ILC Damping Rings: Task Force Report,” LBNL Report no. LBNL-59511 (2006).
- [60] J. Gao, S. Guiducci, and A. Wolski, Editors, Recommendations for the ILC Damping Rings Baseline Configuration, LBNL Report LBNL-59449, Berkeley (2006).
- [61] A. Dragt, et al., MARYLIE Manual, University of Maryland, College Park, MD (2004).
- [62] R.A.Rimmer, J.M.Byrd, and D.Li, “Comparison of Calculated, Measured, and Beam Sampled Impedances of a HOM Damped RF Cavity,” Phys. Rev. ST Accel. Beams 3, 102001 (2000).
- [63] M.Sands, “Loss to Parasitic Modes of the Accelerating Cavities,” SLAC-PEP-90
- [64] J. Corlett, “Higher Order Mode and Parasitic Losses to the Factory RF Cavities,” ESG Tech Note-200,ABC-70, May 1, 1992.
- [65] A. Novokhatski, “The Computer Code NOVO for the Calculations of Wake Potentials of the Very Short Ultra-Relativistic Bunches,” SLAC-PUB-11556, November 2005.
- [66] A. Novokhatski,“HOM Calculations for a New RF Cavity for a Super Factory,” SLAC-PUB-10792, October 2004.
- [67] M. Sands and K.Bane, “The Short-Range Resistive Wall Wakefields,” SLAC-PUB-95-7074, December 1995.
- [68] A. Novokhatski, “HOM Effects in Vacuum Chamber with Short Bunches,” in Proc. of 2005 Particle Accelerator Conference, Knoxville, Tennessee, 289 (2005).
- [69] M. Sands, “Energy Loss from Small Holes in the Vacuum Chamber,” SLAC PEP-253, September 1977.
- [70] A.Burov and A.Novokhatski, “Wake Potential of Dielectric Canal,” in Proc. of HEACC’92, Hamburg, Germany, page 537 (1992).
- [71] S. Novokhatski, to be published.
- [72] M. Biagini, “Super Lattice Studies,” Super-IV Workshop, Villa Mondragone, Nov. 13-15, 2006.
- [73] A.W. Chao, “Physics of Collective Beam Instabilities in High Energy Accelerators,” John Wiley and Sons, Inc. (1993).
- [74] A. Wolski, J. Gao, S. Guiducci, editors, “Configuration Studies and Recommendations for the ILC Damping Rings,” LBNL-59449, Cockroft 06-04, Chap.3.4.
- [75] T. Ieiri, K. Ohmi, M. Tobiyama, H. Fukuma, K. Bane, “Impedance mesurements in the KEKB,” Proc. of EPAC2000, 1423 (2000).
- [76] A. Wolski, Y. Cai, “Super: Update on Estimation of Dynamic Aperture and Collective Effects,” Super-IV Workshop, Villa Mondragone, Nov. 13-15, 2006.
- [77] Y. Funakoshi editor, ICFA Beam Dynamics Newsletter No.31, p.157, Appendix B, M. Biagini, “Lepton Collider Database” (2003).
- [78] D.Cheng et al., “Status of the PEP-II Low-Energy Ring Vacuum System,” Porc. of the 1997 Particle Accelerator Conference, Vancouver, Canada, p.3619.
- [79] K. Ohmi, F. Zimmermann, and E. Perevedentsev, Phys. Rev. E 65, 16502 (2002).
- [80] K. Ohmi and F. Zimmermann, Phys. Rev. Lett. 85, 3821 (2000).
- [81] G. Rumolo et al., Proc. of PAC2001, 1889 (2001).
- [82] K.Ohmi, Proc. of PAC2001, 1895 (2001).
- [83] K. Ohmi, Phys. Rev. E 65, 7550 (1997).
- [84] J. Flanagan et al., Phys. Rev. Lett. 94, 054801 (2005).
- [85] K. Ohmi, Proc. of Snowmass 2005.
- [86] M. Bassetti and G.A. Erskine, “Closed Expression for the Electrical Field of a Two-Dimensional Gaussian Charge,” CERN-ISR-TH/80-06, March 1980.
- [87] For updates on electron cloud studies, see Proc. of ICFA ECLOUD04 Workshop, 2004. http://icfa-ecloud04.web.cern.ch/icfa-ecloud04/.
- [88] A. Wolski, J. Gao, and S. Guiducci, LBNL-59449 (2006).
- [89] L. Wang, H. Fukuma, S. Kurokawa, M. Pivi, and G. Xia, Proc. of EPAC06 Conference, Edinburgh, Scotland, (2006).
- [90] N. Diaczenko, A. Jaisle, P. McIntyre, and N. Pogue, report http://ab-abp-rlc.web.cern.ch/ab%2Dabp%2Drlc%2Decloud.
- [91] H. Fukuma, “Electron Cloud Effects in KEKB,” Proc. of ECLOUD’04, Napa, California (2004) and CERN-2005-001.
- [92] A. Kulikov, A. Novokhatski and J. Seeman, “Suppression of the Beam Instability Related to Electron Cloud at PEP-II Factory,” Proc. of ECLOUD’04, Napa, California (2004). CERN-2005-001.
- [93] M. Jimenez et al., “Electron Clouds–Results From SPS and Experiments For 2003,” Proc. of Chamonix XII Workshop, France, (2003) http://ab-div.web.cern.ch/ab-div/Conferences/Chamonix/chamx2003/PAPERS/ 10_1_JJM.pdf.
- [94] ECL2 Workshop on Electron Cloud Clearing, CERN Switzerland, February, (2007). http://care-hhh.web.cern.ch/care-hhh/ECL2/default.html.
- [95] ECLOUD07 Workshop, Kyungpook University, Daegu, South Korea, April, (2007). http://chep.knu.ac.kr/ecloud07/.
-
[96]
SLAC Metrology Dept., Magnetic Measurement Group Archive Server,
http://www-group.slac.stanford.edu/met/MagMeas/MagHome.html. - [97] P. Bellomo, private communication.
- [98] B. Parker et al., “Superconducting Magnets for use inside the HERA ep Interaction Regions,” Proc. of PAC 1999, New York, 308 (1999).
- [99] H. Schwarz and R. Rimmer, Proc. of EPAC 94, London, UK, 1882 (1994), and references therein.
- [100] P. Corredoura and R. Tighe, Proc. of EPAC 94, London, UK, 1960 (1994).
- [101] D. Teytelman, private communication.
- [102] D. Teytelman et al., Proc. of EPAC 06, Edinburgh, UK, 3038 (2006).
- [103] R.A. Rimmer et al., Proc of EPAC 96, Sitges, Barcelona, 2037 (1996).
- [104] R.A. Rimmer et al., Phys. Rev. ST Accel. Beams 3, 102001 (2000).
- [105] M.G. Minty et al., Proc. of Int. Workshop on Performance of Electron-Positron Collider Particle Factories, 9/21/99-9/24/99, Tsukuba, Japan.
- [106] U. Wienands, Proc. of Part. Accel. Conf., Chicago, Ill, 596 (2001).
- [107] O.B. Malyshev, EUROTeV Report 2006-094, 2006, in press.
- [108] S. Weathersby et al., Proc. of Part. Accel. Conf., Knoxville, TN, 2173 (2005).
- [109] C. Benvenuti, Proc. of Europ. Part. Accel. Conf., Stockholm, SW, 201 (1998).
- [110] N. Reeck, private communication.
- [111] (PEP Design Review or MAC talk).
- [112] A. Kulikov et al., Proc. of Part. Accel. Conf., Chicago, Ill, 1903 (2001).
- [113] M.T.F. Pivi et al., “Secondary Electron Yield and Rectangular Groove Chamber Tests in PEP-II,” submitted to Part. Accel. Conf., Albuquerque, NM 2007.
- [114] http://www.i-tech.si/products-libera.html.
- [115] A.G. Michette, “Optical Systems for Soft X-Rays” (Plenum, London, 1986).
- [116] G.R. Morrison, “Diffractive X-Ray Optics,” Ch. 8 in A.G. Michette and C.J. Buckley, Eds., X-Ray Science and Technology (Inst. Phys., London, 1993).
- [117] D.T. Attwood, Soft X-Rays and Extreme Ultraviolet Radiation: Principles and Applications (Cambridge Univ. Press, Cambridge, 1999).
- [118] K. Iida et al., “Measurement of an Electron Beam Size with a Beam Profile Monitor Using Fresnel Zone Plates,” Nucl. Instr. Methods Phys. Res., Sect. A 506, 41 (2003).
- [119] C. David, V. Schlott, and A. Jaggi, “A Zone-Plate-Based Beam Monitor for the Swiss Light Source,” Proc. of DIPAC 2001, Grenoble, (2001), http://www.esrf.fr/conferences/DIPAC/Proceedings/stampedpdfs/PS-13.pdf.
- [120] http://xradia.com/Products/zoneplates.html.
- [121] A. Thompson et al., X-Ray Data Booklet (Lawrence Berkeley National Lab., Berkeley, 2001).
- [122] http://www-cxro.lbl.gov/optical_constants.
- [123] http://www.rigaku.com/optics/synchrotron.html.
- [124] A.S. Fisher et al., “Design of an X-ray Imaging System for the Low-Energy Ring of PEP-II,” Proc of 9th European Particle Accelerator Conf., 5-9 July 2004, Lucerne, Switzerland, SLAC-PUB-10528.
- [125] OFHC copper strengthened by grains of aluminum oxide.
- [126] P.J. Simpson et al., “Superfast Timing Performance from ZnO Scintillators,” Nucl. Instr. Methods Phys. Res., Sect. A 505, 82 (2003).
- [127] S. Kulinski, R. Boni, B. Spataro, and M. Vescovi: “The Linear Accelerator for the DANE Injection System,” LC-1, 11/2/1991.
- [128] F. Sannibale and M. Vescovi: “Linac to Accumulator Area Transferline (LAAT) & DANE -Linac Spectrometer (DLS),” LC-3, 1/2/1992.
- [129] S. Kulinski, F. Sannibale, and M. Vescovi: “Some Remarks on DANE Positron Linac Focusing,” LC-4, 13/3/1992.
- [130] M. Preger: “A Positron and Electron Accumulator for DANE ,” I-1, 8/11/1990.
- [131] M. R. Masullo, C. Milardi, and M.A. Preger: “DANE Accumulator Update-3,” I-9, 13/5/1992.
- [132] F. Sannibale et al., “DANE Linac Commissioning Results,” BM-2, 4/4/1997.
- [133] A.V. Kulikov, S.D. Ecklund, and E.M. Reuter, SLAC-PUB-5473 June 1991.
- [134] M. Preger: “Injection into DAFNE and Timing Requirements for the Linac-Accumulator-Main Rings Complex,” I-6, 20/12/1991.
- [135] S. Guiducci: “Injection Configuration in DANE ,” I-12, 7/3/1994.
- [136] Review of Particle Physics Physical Review D, Volume 54, Third Series, I Part, 1 July 1996, pg. 136.
- [137] R. Chebab et al., “Experimental Study of a Crystal Positron Source,” Phys. Lett. B 525, 41 (2002).
- [138] T. Suwada et al., “Experimental Study of Positron Production from Monocrystalline Targets at the KEKB Injector Linac” KEK Preprint 2006-30, August 2006.
- [139] X. Artru et al., “Summary of Experimental Study at CERN, on a Positron Source using Crystal Effects,” Preprint submitted to Elsevier Science, 21 December 2006.
- [140] T. Kamitani and L. Rinolfi, “Positron Production for CLIC,” CLIC Note 465.
- [141] S.Araki et al., physics/0509016 and KEK 2005-60, CLIC Note 639, LAL05-94, CARE/ELAN Document 2005 013.
- [142] R.J Jones et al., Phys. Rev. A 69, 051803 (2004).
- [143] K.Flottmann, PhD Thesis, DESY 93-161, November 1993.
- [144] R.Chehab, LAL RT 92-17, December 1992.
- [145] T.Omori, Nucl. Instr. Methods Phys. Res., Sect. A 500, 232 (2003).
- [146] M.E. Biagini et al., Proc. of EPAC98, Stockholm (Sweden), 415 (1998); LNF-98/023(P), 27/07/1998.
- [147] A.Variola, Presentation at the Posipol Workshop, CERN Geneva 26-28 April 2006, http://indico.cern.ch/getFile.py/access?contribId=32&sessionId=64 &resId=0&materialId=paper&confId=845
- [148] D.Hitlin, “The Super tau/Charm Task Force,” A progress report at the Super-III Workshop, SLAC, June 16, 2006.
- [149] A.Brachmann et al., “Performance of GaAsP/GaAs Superlattice Photocathodes in High Energy Experiments using Polarized Electrons,” SLAC-PUB-11711, Feb.2006.
- [150] Yu.A.Mamaev et al., “Improved Superlattices for Spin-Polarized Electron Sources,” SLAC-PUB-12249, Dec.2006.
- [151] B.L.Militsyn et al., “Beam Optical System of the Polarized Electron Source of the Amsterdam Pulse Stretcher AmPS,” Nucl. Instr. Methods Phys. Res., Sect. A 427, 46 (1999).
- [152] Ya.S.Derbenev et al., “Radiative Polarization: Obtaining, Control, Using,” Part.Acc. 8, 115, 1978.
- [153] A.A.Zholents and V.N.Litvinenko, “On the Compensation of Solenoid Field Effects by Quadrupole Lenses,” DESY-L-TRANS-289, Mar 1984. Translation of Novosibirsk preprint IYF-81-80 (translation).
- [154] I.A.Koop, A.V.Otboyev, P.Yu.Shatunov, and Yu.M.Shatunov., “Orbit and Spin Transparent Siberian Snake and Spin Rotator with Solenoids,” SPIN2006, Nagoya, Japan, 2006.
- [155] Ya.S.Derbenev and A.M.Kondratenko, “Polarization Kinematics of Particles in Storage Rings,” Sov.Phys.JETP 37:968-973,1973, Zh. Eksp. Teor. Fiz. 64, 1918 (1973).
- [156] J.Buon and K.Steffen, “HERA Variable-Energy mini Spin Rotator and Head-On ep Collision Scheme with a Choice of Electron Helicity,” Nucl. Instr. Methods Phys. Res., Sect. A 245, 248 (1986).
Chapter 3 The Detector
1 Overview and overall design considerations
The Super detector concept, is based on the current BABAR detector, with those modifications required to operate at a luminosity of and with a reduced center-of mass boost. optional configurations needed to cope with higher beam-related backgrounds, as well as to improved detector hermiticity are also discussed. The necessary R&D is to implement this upgrade is also discussed. Cost estimates and the schedule are described in Section 4.
The current BABAR detector is shown in Fig. 1. BABAR consists of a tracking system with a 5 layer double-sided silicon strip vertex tracker (SVT) and a 40 layer drift chamber (DCH) inside a 1.5T magnetic field, a Cherenkov detector with quartz bar radiators (DIRC), an electromagnetic calorimeter (EMC) consisting of 6580 CsI(Tl) crystals and an instrumented flux-return (IFR) comprised of both limited streamer tube (LST) and resistive plate chamber (RPC) detectors for detection and identification.

The Super detector concept reuses a number of components from BABAR: the flux-return steel, the superconducting coil, the barrel of the EMC and the quartz bars of the DIRC. The flux-return will be augmented with additional absorber to increase the number of interactions lengths for muons to roughly . The DIRC readout will be replaced with either faster PMTs in the current water tank or multi-channel plate (MCP) photon detectors in a focussing configuration to reduce the impact of beam related backgrounds and improve performance. The forward EMC will feature cerium-doped LSO (lutetium orthosilicate) or LYSO (lutetium yttrium orthosilicate) crystals, hereafter referred to as L(Y)SO crystals, which have a much shorter scintillation time constant, and lower Moliére radius and better radiation hardness than the current CsI(Tl) crystals, again for reduced sensitivity to beam backgrounds and better position resolution.
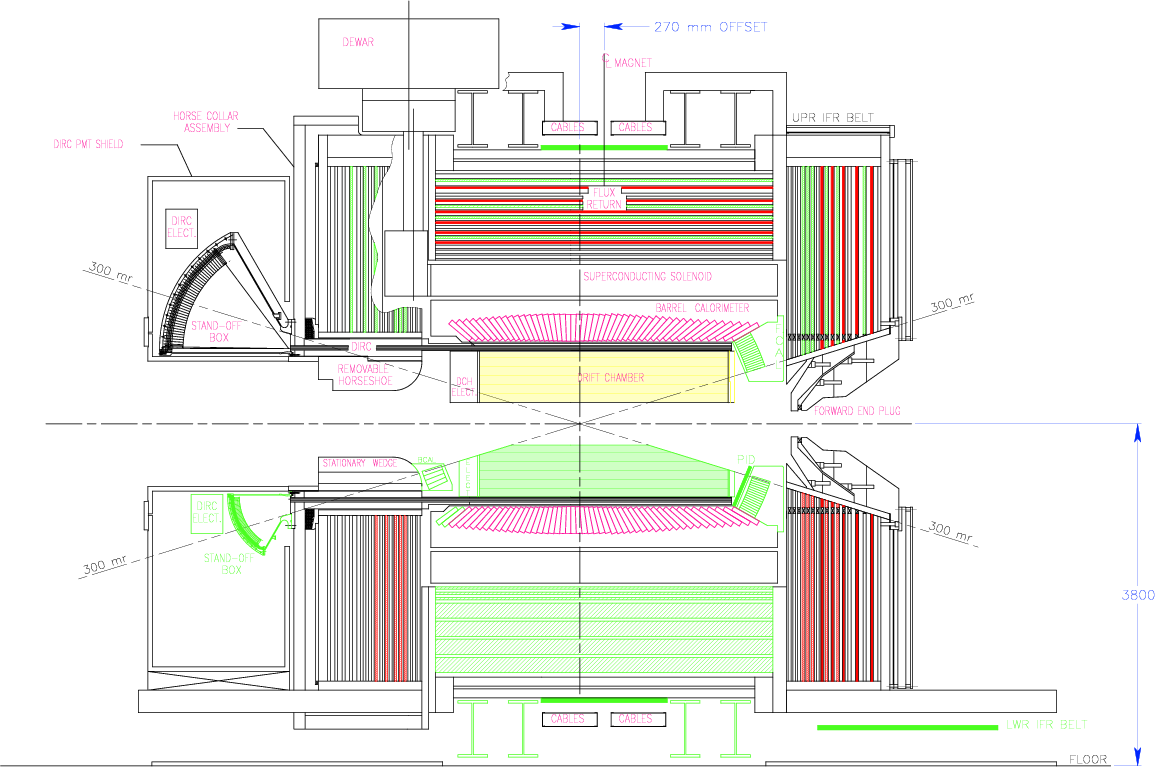
The tracking detectors for Super will be new. The current SVT cannot operate at , and the DCH has reached the end of its design lifetime and must be replaced at the end of BABAR operation. To maintain sufficient resolution for time-dependent violation measurements with the Super boost of , the vertex resolution will be improved by reducing the radius of the beam pipe, placing the inner-most layer of the SVT at a radius of roughly . This innermost layer of the SVT will be constructed of either silicon striplets or MAPS sensors, depending on the estimated occupancy from beam-related backgrounds. Likewise the cell size and geometry of the DCH will be driven by occupancy considerations. To improve the hermeticity of the detector Super may also include a backwards EMC detector also consisting of L(Y)SO crystals and forward and backward particle identification systems using either a time-of-flight (TOF) or an Aerogel RICH (ARich) detector.
The Super detector concept is shown in Fig. 2. The top portion of this elevation view shows the minimal set of new detector components, with the most reuse of current BABAR detector components; the bottom half shows the configuration of new components required to cope with higher beam backgrounds and to achieve greater hermiticity.
2 Interaction Region
The interaction region design must satisfy the requirements imposed by the accelerator design and the constraints determined by the detector geometry and sensitivity to backgrounds. The accelerator design based on small size of the beams at the interaction point requires the vertical focusing magnets (QD0/QD0H) as close as possible to the IP (cfr. 1). This requirement constraints severely the detector acceptance and stay clear; moreover the off-energy particles over-bent by the final doublet are a major source of backgrounds in the detectors. Figure 3 shows the layout of the Super interaction region, which is described in detail in Section 1. The first quadrupole magnet (QD0) starts away from the IP and its radial dimension and offset limits the detector acceptance to about 300 in the forward and backward direction, which we assume as the baseline design acceptance.
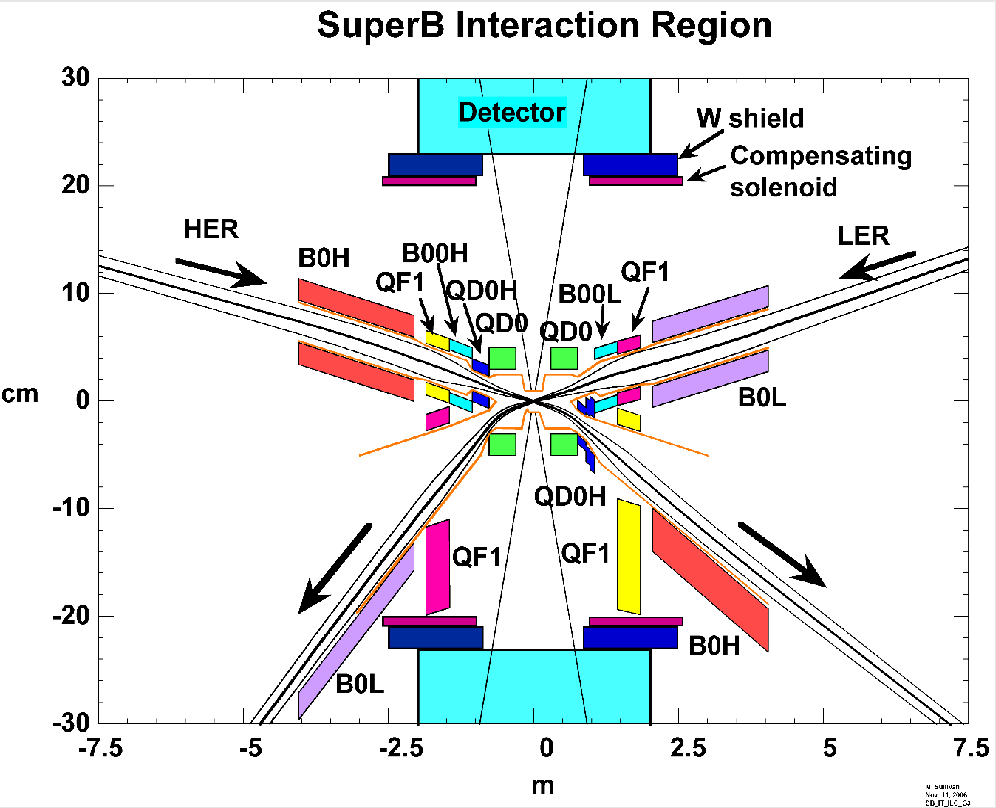
The synchrotron radiation “fans” produced by the beam bending in the dipoles and off-axis quadrupoles near the IP are kept away from the detector beam pipe by a careful design of radiation masks and magnet mechanical apertures and position (cfr. 3).
The off-energy particles produced by Touschek and inelastic Bhabha scattering are prevented from hitting the detector by a tungsten shielding enclosing the beam lines up to meters from the IP.
The whole beam line and interaction region has been simulated with Geant4 and the shielding design has been optimized to reduce as much as possible the background in the detector satisfying the acceptance and stay clear constraints.
3 Backgrounds
Coping with machine-related backgrounds is one of the leading challenges in designing the Super detector. Background considerations influence several aspects of the design: readout segmentation, electronics shaping time, data transmission rate, triggering and radiation hardness. With the proposed collider design, the primary sources of background are the beam-beam interaction, radiative Bhabha production and Touschek scattering; photons from synchrotron radiation and lost beam particles give smaller, though far from negligible, contributions. These sources give rise to primary particles that can either hit the detector directly, or generate secondary debris that enters the apparatus. In addition, the heat load due to syncrotron radiation photons striking masks must be carefully evaluated. We have simulated the different sources of background and modeled them with detailed Geant4 detector and beamline description to estimate their impact on the experiment. The relevant magnetic and physical elements used in the configuration are the two QD0 quadrupoles surrounding the beampipe, the QD0H on the outgoing HER line, the two QF1s and the two B0s elements on the downstream lines (see Sec. 3). Tungsten masks placed around the beamline protect the detector on both sides of the interaction region. A view of the entire interaction region and the detector generated with Geant4 is shown in Fig. 4.
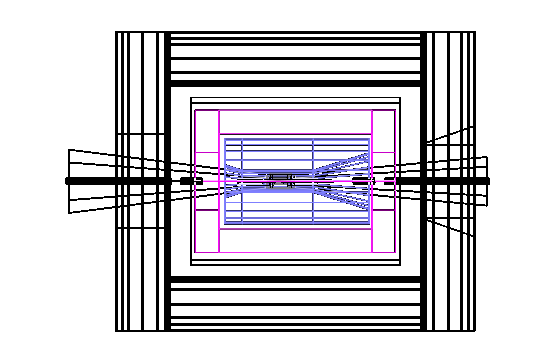
1 Beam-beam interaction
The Super design produces its high luminosity by employing a reduced beam size having a high bunch charge density, as discussed in 1. There is thus a strong beam-beam interaction and significant intrabeam scattering, which in the Super environment, are the dominant background sources, larger than single-beam bremsstrahlung or Coulomb scattering. The beam-beam interaction is studied by using the Guinea Pig package [1]. Photon emission is parameterized as an interaction between and the collective beam-beam field, plus a component due to the regime of photon emission in the collision of individual particles [2]. The pair creation is determined not only by low-energy electrons and positrons co-moving with the beams and strongly deflected by the beam-beam field, but also through the second-order QED process of pair creation during the collision. This effect, at the Super energy, is essentially a mixture of an incoherent amplitude given by the interaction of individual particles [3] and a coherent process in which the emitted photon interacts with the collective field of the oncoming bunch[4]. These processes are generated in Gunea Pig and the photons and charged particles produced in the interaction are then passed to a Geant4 simulation to model the detector response. The expected hit rates from this source are expected to be small in all subdetectors except the silicon tracker.
2 Radiative Bhabhas
The effect of particles scattered in radiative Bhabha processes is studied with the BBBREM generator [5], a Monte Carlo program which simulates single bremsstrahlung in Bhabha scattering, i.e. , in the very forward direction. An experimental cut is imposed on the energy loss of the primary lepton, the secondaries are propagated through the Geant4 detector simulation, and the hit rates are studied. Due to the dynamics of the process, the impact of this source of background extends to detector systems other than the tracker. As shown in Fig. 5, a large fraction of off-energy electrons and positrons hit the downstream beamline elements, producing electromagnetic showers. Low energy particles from these showers enter in all detector subsystems.
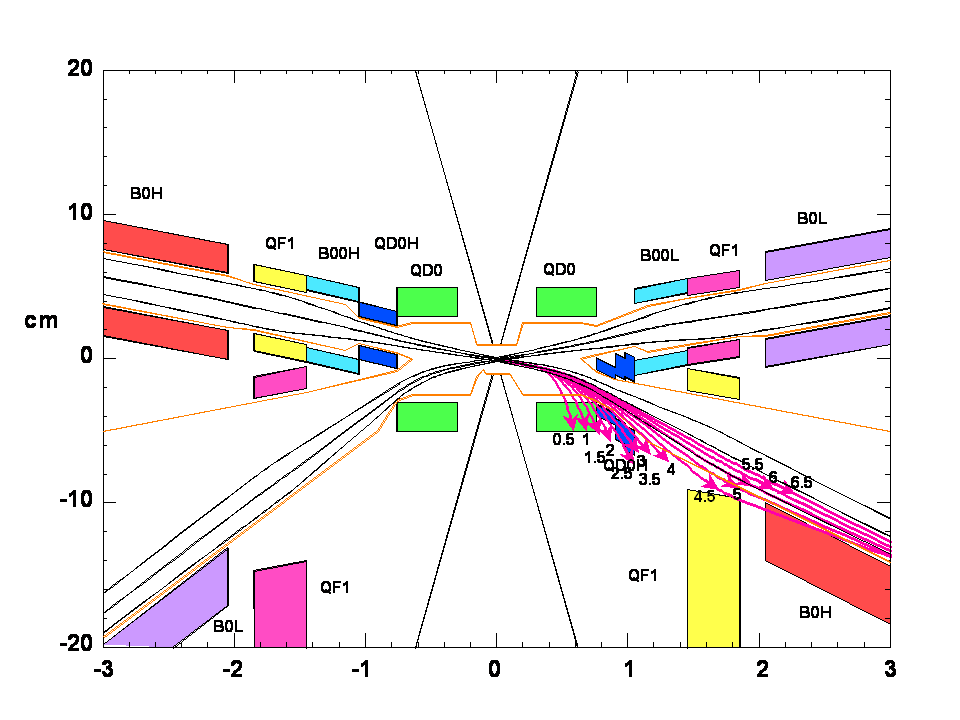
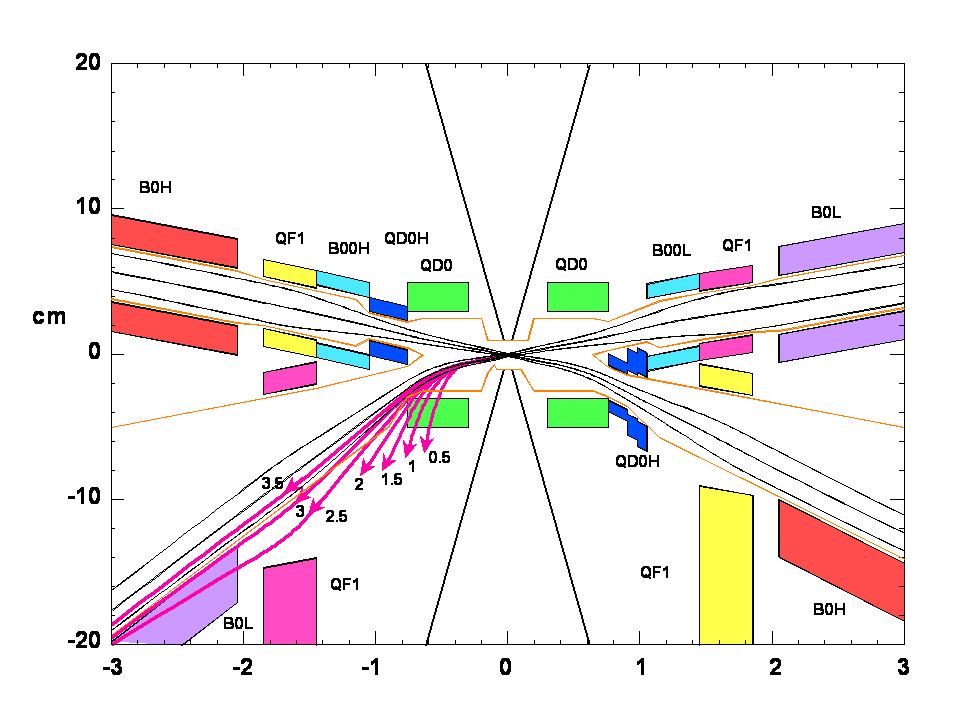
3 Touschek Scattering
The Touschek scattering rate scales with the bunch charge density (Sec. 2) hence is expected to be way higher than in present B factories.
Simulation studies for background due to Touschek scattering have been performed for the LER (Sec. 2). The expected loss rate without collimators nor any other adjustment of the ring mechanical apertures is within 4 from the IP for a single LER bunch (.)
Touschek losses inside the detector are reduced by a factor 25 inserting three horizontal collimators far away from the detector at , , and .
The remaining Touschek loss rate inside the detector is per single LER bunch ( for 1733 LER bunches). These particles are mainly scattered at eventually hitting the beam pipe near the IP and producing high multiplicity electromagnetic showers.
The reduction of this dangerous source of background will be achieved after further studies and optimizations of several final focus parameters: the phase advance between positions where Touschek scattering occurs and the IP, the mechanical aperture of the vacuum chambers upstream the IP, the insertion of additional collimators and masks near the final doublet.
4 Other sources of background
Lost beam particles are a source of background proportional to single beam currents. Electrons or positrons circulating in the beam pipe lose momentum through Coulomb or bremsstrahlung interactions with residual gas molecules. These interactions are more serious in regions of the ring far from the interaction point, where the pressure is higher; these particles can reach the interaction region, where they can be overbent by the final focus elements hit the detector. An estimate of these lost particles backgrounds has been extrapolated from studies made at BABAR [6], where this is one of the dominant sources of background. For PEP-II, the rate of lost beam particles hitting the detector was estimated to be less than 1/ 2 for currents of 1.2 on 2.8 A. Scaling this value to the Super currents (see Sec.1), leads to an expected rate of particle hits of the order of 1-2 MHz, increasing to 2-5 MHz in the high luminosity regime. The extrapolation from PEP-II is likely to be a pessimistic estimate, since the permanent dipoles in the final focus of PEP-II are eliminated in the Super design. Nevertheless, the rate found for Super is negligible with respect to the other sources of background. Synchrotron radiation is another source of background proportional to single beam currents. Despite the fact that the interaction region has been designed to reduce as much as possible the bending of beam trajectories in the incoming beamline, some photons can still hit the beampipe. This would result in additional background in the detector and can give rise to outgassing due to heating, thereby degrading the local vacuum. The rate of photons above 10 keV range hitting the pipe in the proximity of the beryllium beam pipe section is expected to be about 1500 per bunch crossing. This is the same order of magnitude as in PEP-II and the impact on the Super detector is expected to be negligible; a preliminary design of an adequate system of masks already exists.
4 Vertex Detector
Introduction
The vertex detector provides precise information on both the position and direction of charged particle trajectories as close as possible to the interaction point. For very low momentum particles, the track parameters must be completely determined within the vertex detector. Precise vertex separation is fundamental to all time-dependent analyses, which form the basis of the Super scientific program, as is does for the existing asymmetric Factories.
Analytical calculation and Monte Carlo simulations have shown that the reduction in the precision measurement on the asymmetries is less than 10% as long as the distance between the two vertices is reconstructed with a resolution equal to half of the mean separation [7]. For the boost value of PEP-II Factory (), the average separation along the coordinate between the vertices of is , which implies a required precision on distance of the order of , where and is the proper time difference between the two decays. This requirement has been met in the present BABAR silicon vertex tracker (SVT) with a five layer double-sided silicon detector [8]. The precision of the vertex measurement also determines the ability to distinguish between signal and background.
For the proposed value for the center-of-mass boost of Super, (a 7 HER beam colliding with a 4 LER beam), the average vertex separation in the direction, , is reduced by nearly a factor of two with respect to the BABAR experiment. Vertexing performance must therefore be able to achieve a resolution on of order for optimal time-dependent measurements. The conceptual design of a Super vertex detector, based on the BABAR SVT layout, with an additional innermost Layer 0, will be discussed herein. For a vertex detector with a Layer 0 of radius, fast simulation studies have shown that it is possible to achieve resolution suitable for time-dependent analyses, as long as the total radial material before the first hit measurement is at the level of , as discussed in section 2. In the following, we will demonstrate that the performance requirements can be met with a design based on a six layer silicon tracker detector, with a Layer 0 based on striplet or thin pixel technology and Layer 1 to Layer 5 made of double-sided silicon microstrip sensors. Layer 0 will be very close to, or even mounted on, the beampipe support. The impact of machine background on the design for Layer 0 for the striplet and the pixel option will be discussed in Sections 4 and 5, along with mechanical issues and electronic readout requirements.
1 Detector concept
The Super interaction region configuration is based on a small beampipe radius ()and new vertex detector layer (Layer 0) at a radius between . This allows measurement of the first hit of the tracks as close as possible to the production vertex. There are five additional tracking layers, in a layout similar to the BABAR SVT system, at radii between 3 and 14 cm. A longitudinal section of the BABAR SVT detector, with Layer 0 added, is shown in Fig. 6.

The angular acceptance, constrained by the interaction region design, will be 300 mrad in both the forward and backward directions, corresponding to a solid angle coverage of 95% in the center-of-mass frame. This six-layer vertex detector solution will significantly improve track parameter determination, matching the more demanding requirements on vertex resolution, and will improve the standalone tracking capabilities for low momentum particles as well.
Two options are viable for the Layer 0 sensors: striplets [9] and CMOS monolithic active pixel sensors (MAPS) [10]-[12]. The choice must take into account the physics requirements on the vertex resolution, which depends on the pitch and the amount of material of the sensors. The intrinsic detector spatial resolution should not limit the track parameter determination, even for the highest momentum tracks, for which multiple scattering effects are at a minimum. For the highest momentum tracks, multiple scattering contributions to the uncertainty on the position and are of the order of and 0.001, respectively. In addition, to assure optimal performance for track reconstruction, occupancy must be maintained under a few percent, imposing further requirements on the sensor segmentation and on the frontend electronics. Radiation hardness is also an important consideration, although it is not expected to be a particularly demanding requirement compared to LHC detector specifications. Background studies have been made to determine the hit rate in the detector region, and particularly in Layer 0, as discussed in Section 3.
Two technology solutions have considered for Layer 0 detectors. These are described in more detail in section 4 and 5.
A viable solution, which we take as the baseline, is high resistivity silicon sensors with short strips (striplet detectors) [9].Small standard double-sided high resistivity silicon detectors with short strip length () having a pitch of , reduce the occupancy by geometrically reducing the area of a single channel. This solution offers a reasonably low sensor material budget ( silicon thickness, ) and a hit resolution of about . Detector occupancy is an important issue, as will be discussed in sections 4 and 3, but this solution does not require significant R&D.
A second option for Layer 0 sensors is CMOS MAPS detectors, as discussed in section 5, with full in-pixel signal processing implemented at the pixel level. In this case, the high segmentation of the detector ( pixel area) and the small amount of sensor material ( thick silicon sensor, ), provide optimal performance, both in terms of occupancy and multiple scattering. A hit resolution of the order of is expected with MAPS detectors. This solution, however, requires additional R&D, as discussed in section 6; important progress has already been made [10]-[12].
2 Physics Performance
Precise determination of the position of decay vertices is fundamental for the physics program of Super. Benchmark analyses sensitive to New Physics, such as , , require time-dependent measurements. Improved vertexing performances will also increase our ability to separate signal events from background. It may also be possible to consider the adoption of new tagging algorithm based on topological variables related to the separation between the and vertices.
The approximation , where is the proper-time difference between the decay vertices, still holds at the reduced boost In order to account for the small flight length in the transverse plane (), we will, using fast simulation studies, evaluate the proper-time difference resolution by reconstructing the full 3-dimensional vertex separation. The benchmark is to reach a resolution , equivalent to that of BABAR.
In order to simulate the resolution on the decay vertices and on , we have used the TRACKERR simulation progra [13], which employs analytic parametrizations to simulate the detector response. We have reconstructed the exclusive decay mode, evaluating the other decay vertex using the charged tracks of the rest of the event, after rejecting long-lived particles and tracks not compatible with the candidate vertex.
Figure 7 shows the resolution on for different Layer 0 radii, as a function of the value of the center-of-mass boost. The dashed line represents the BABAR reference value (). We consider three Layer 0 radii: (), () and (). The amount of material of the sensor is consistent with the MAPS solution (), while the beam-pipe radiation length is varied in the range for the three different configurations to account for the potential variation of the required beam-pipe thickness with radius. Figure 8 shows the resolution on as a function of the amount of material before the first hit measurement in Layer 0.
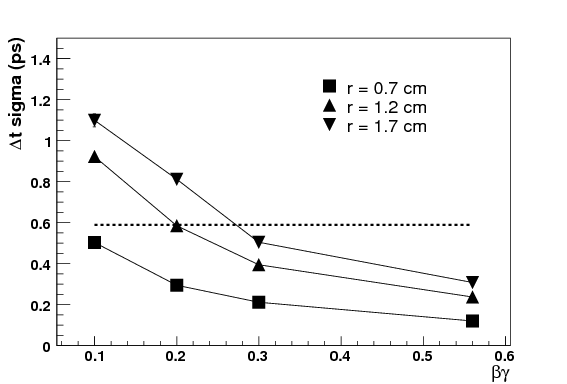
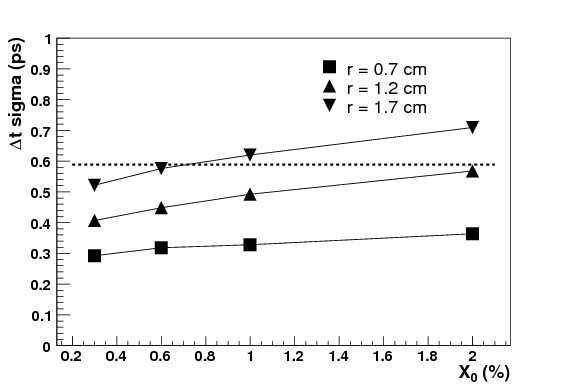
These studies allow us to evaluate the feasibility of different solutions for Layer 0, in terms of radial distance and the amount of material before the first hit measurement of the tracks. For the proposed boost , and for a Layer 0 radius of , the total radial material before the first hit measurement has to be kept below . This constraint can be met with both MAPS and striplet detectors, as discussed in section 4.
For the version usings a striplet Layer 0 detector at radius, we obtain a resolution for of . In this case we considered a radius beampipe ( radial material), silicon wafer thickness, with equivalent silicon thickness for the three fanout and equivalent silicon thickness for the support structure ( radial material), for a total amount of radial material, including Layer 0.
The good precision of the decay vertex determination benefits several aspects of meson reconstruction. Reducing the energy asymmetry without affecting the proper time resolution enlarges the acceptance of the detector to 95% in the center-of-mass system, improving the reconstruction of decay modes with neutrinos (, , decays, etc.). The ability to separate the from the decay vertex will help reject events ( quarks) and allow the adoption of analysis techniques for flavour tagging based on topological algorithms [14]. The resolution on the vertex separation in exclusively reconstructed modes, with a Layer 0 radius of , is . This has to be compared with the average separation of the decay vertices, which depends on the specific reconstructed decay mode. As an example, for the decay , this separation is about , corresponding approximately to 10 times the resolution on the flight length distance. An analogous study has been made using an inclusive reconstruction technique, employing all possible vertex combinations with tracks not associated with the exclusively reconstructed candidate (the rest of the event). The and the decay vertex candidates are selected according to the most probable two-vertex combination, based on a geometrical algorithm. In this case, the resolution on the flight length distance is . The information on the flight length could be used together with event shape variables in a general Fisher discriminant function to distinguish events from ( quarks) background events. In addition a topological algorithm based on the flight length information, and on a function of the charge of the daughters could be used to tag the flavour of the mesons.
3 The Impact of Background on Performance
Background considerations influence several aspects of the Silicon Vertex Tracker design: readout segmentation, electronics shaping time, data transmission rate and radiation hardness. The main luminosity backgrounds considered in the simulations, as described in Sect.3, are the beam-beam interaction and the secondary particles from radiative Bhabha processes. Single-beam effects are mainly related to bremsstrahlung in the quadrupole fields of the final focus elements, and do not contribute substantially to the tracker backgrounds. The beam-beam interaction, studied with the Guinea Pig generator [1], turns out to be the most important source of background for the Silicon Vertex Tracker. The expected hit rates in the tracker layers have been studied, together with the azimuthal and polar dependence. The average rate dependence as a function of the radius is shown in Fig. 9, while the dependence on for different radii is shown in Fig. 10.
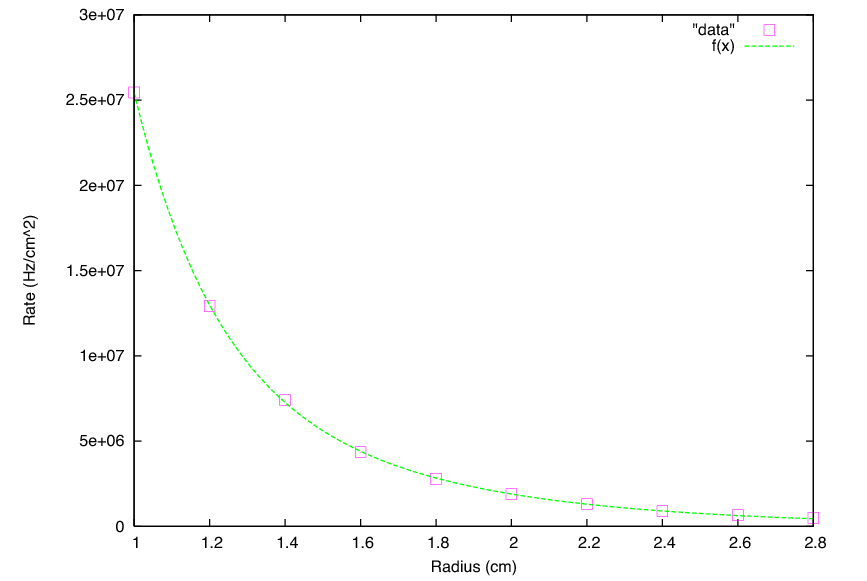
A typical hit rate of the order of 15MHz/ is found at a 1.2 radius, decreasing to about 5MHz/ at a 1.5 radius.
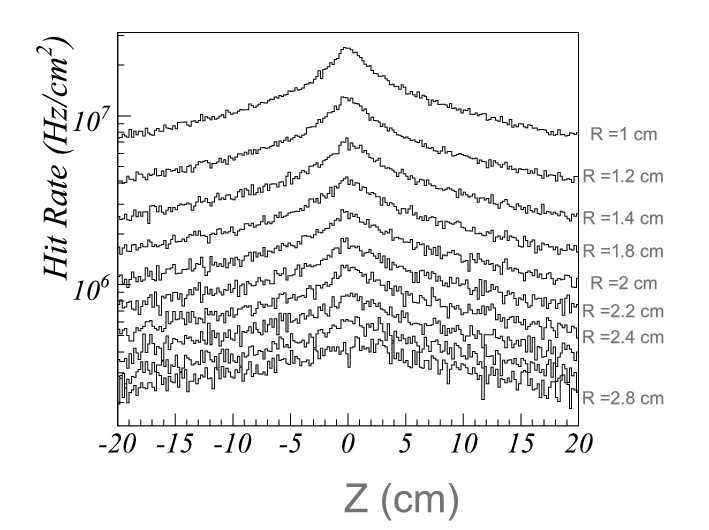
Particles scattered in radiative Bhabha processes also contribute to the background in the Silicon Vertex Tracker. The process, as described in Sect.3, is simulated with the BBBREM generator [5].
This background is mainly caused by particles hitting the magnetic elements of the final focus in downstream regions of the beampipe and being backscattered towards the detector. The tungsten masks in the IP region are of crucial importance for shielding this background source. The geometry used in our studies meets the collider stayclear requirements, and provides adequate protection for the Silicon Vertex Tracker. In the initial version of the shielding geometry, the SVT layer which was actually least protected was the Layer 3, which is at a radial position close to the inner radius of the tungsten cones, see Fig. 11. For this reason, we have provided additional tungsten discs at the sides of the SVT for increased protection, as can be seen in the fiure.
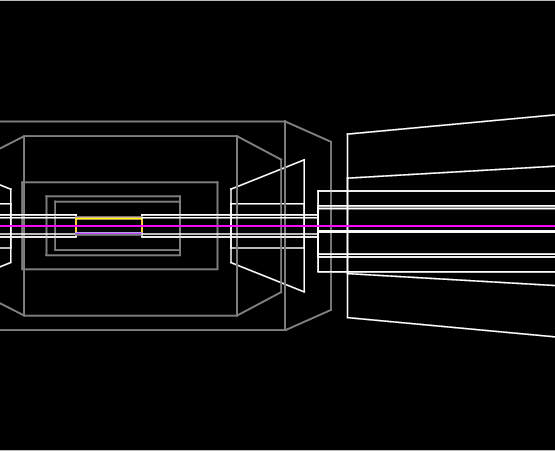
The azimuthal and polar dependence of the hits in Layer 0 and Layer 3 are shown in Fig. 12.
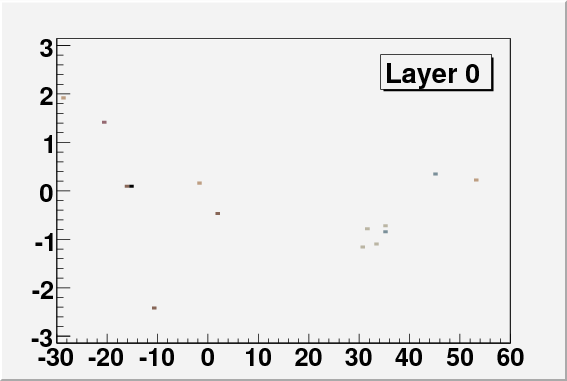
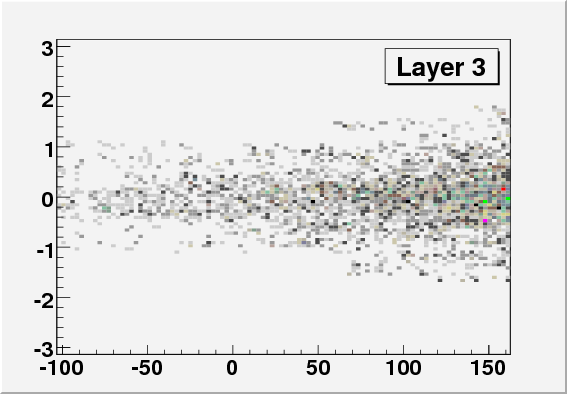
A typical hit rate is of the order of 0.1 MHz/ at 1.2 cm radius and of 0.16 MHz/ at 1.5 cm radius.
With these background rates, the electromagnetic component of the expected integrated radiation dose produces peaks of the order of 6 Mrad/year, for a total peak dose of about 30 Mrad over the experiment lifetime.
The decrease in the tracking performance with increased occupancy is heavily dependent on the reconstruction algorithms employed. Studies done for BABAR [25],provide figures of merit for the expected changes in the tracking properties for benchmark decay modes. Data taken during bad machine vacuum condition show a significant deterioration of the tracking efficiency when channel occupancy exceeds 10 to 15%. With the occupancy expected in Super, even after the inclusion of the safety factor of five, the reduction in performance due to the background occupancy is not expected to be a serious issue.
4 Layer 0 baseline design: Striplets
The physics requirements imposed on the SVT Layer 0 design (radius 1.5 cm, hit resolution of , reduced material budget ) could, in principle, easily be met using double-sided silicon strips detectors (DSSD), thick, with readout pitch and the provision of pulse height information to improve the spatial resolution.
Machine background at this small radius does, however, impose a severe limit on area of each strip, if we are to maintain the occupancy below a few percent to preserve the efficiency of track reconstruction. The design objective can be met by using short strips, striplets, placed at an angle of 45 degrees with respect to the detector edges. This is shown schematically in Fig. 13; the strips on the two sides of the sensor are orthogonal and are the same length.
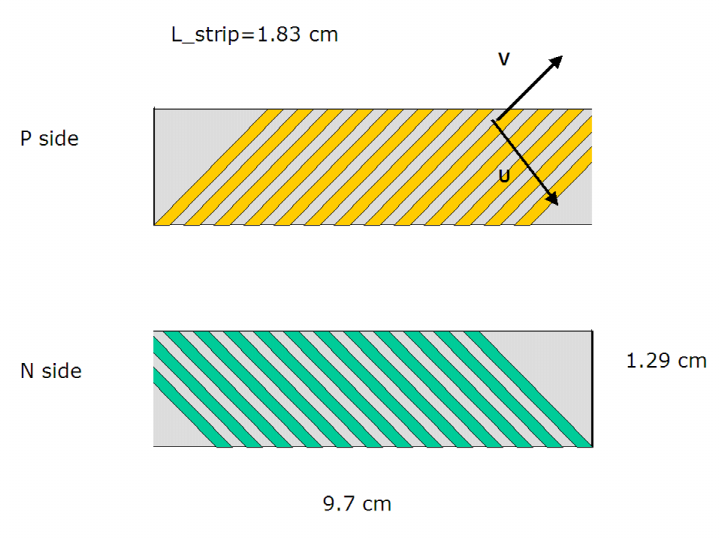
Very high strip segmentation can, in principle, be achieved by reducing the dimension of the short side of the sensor. This, however, would increase the number of readout channels, as well as the complexity of the module assembly and the amount of material in the active area. A flexible printed circuit, glued on top of each silicon detector, is required to bring the strip signals outside the active region to the frontend electronics. Given the poor aspect ratio in the Layer 0 SVT modules and the large number of channels, and the minimum achievable pitch for flex circuits (assumed conservatively to be around ), the design must contend with the potentially large number of layers of flex circuit required for each detector.
The proposed Layer 0 design meets all these criteria, as well as the constraints of adequate radiation hardness. The baseline design is octagonal, with the eight modules organized into a barrel-type structure, placed at from the interaction point. The detector consists of double-sided silicon strip sensors, thick, with readout pitch. The readout electrodes are striplets placed at 45 degrees with respect to the detector edges, and are orthogonal on the two sides of the sensor (junction and ohmic side).
Each module consists of:
-
•
one silicon sensor,
-
•
a multilayer printed flex circuit, used to bring the signals to the readout electronics located outside the fiducial region,
-
•
two double-sided hybrid circuits, containing the frontend chips, independently reading the two halves (forward/backward) of the silicon sensor.
A Layer 0 module is shown schematically in Fig. 14.
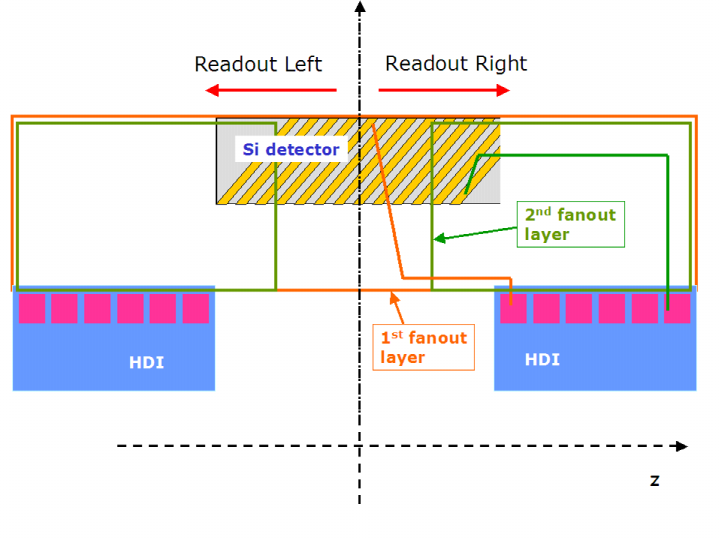
Silicon Sensor
The silicon detector fabrication technology will be similar to that used for the present BABAR SVT sensors, which have proved to be sufficiently radiation hard [15] for the dose expected in the Super environment. The strips are biased from a ring surrounding the active region with poly-silicon resistors, and are AC-coupled to the readout electronics by means of capacitors integrated on the sensor. The silicon sensor active area will be , providing an overlap region ( 4% of the sensor area) between adjacent modules, which is useful for alignment of the sensors with reconstructed tracks.
Connection of silicon sensors to readout electronics
In the 45 degree striplet design with the chosen readout pitch, each DSSD will have 3050 readout channels. Each of the two double-sided hybrid circuits (Fig. 14) will mount six frontend chips per side, having 128 channels each. To connect the silicon strips to the readout chips, a multilayer flexible circuit will be glued to the sensor and microbonded to the detector strips. To increase the aspect ratio on the flex circuit and reduce the number of flex layers/module needed, the printed circuit short side is about two times larger than the short side of the silicon sensor (Fig. 14). This configuration can be realized using a pinwheel assembly of the modules on the support structure, as explained below. With this lateral extension available for the trace routing (the flex circuit is about 2.6 cm wide), with about 770 redout channels/side, and a trace pitch on the flex of about , only 1.5 flex layers/module/side are required. The flex circuit contribution to the total material budget(3 layers/module) will be about , assuming the use of the technology adopted for the present SVT, based on a Upilex substrate with copper traces. A different technology (which has been adopted for the ALICE silicon strip detectors) is aslo being explored. It would reduce the material budget and simplify the module assembly. Kapton/aluminum microcables and Tape Automated Bonding soldering techniques (ref) have been used in the ALICE design for the connection between the silicon sensor and the readout electronics. If this technology is available at a readout pitch, the material budget for the connections to the frontend could be reduced by more than a factor 4 ( to ). This technology also simplifies the design of the multilayer connections, thereby simplifying module assembly, since there are no fragile wirebonds present on the surface of the module.
Readout chip
The choice of the frontend chip for the Layer 0 striplet detector is driven by the expected machine background hit rate. Simulation results presented in section 3 indicate that at the Layer 0 location at a radius of 1.5, one can expect a peak hit rate of about . The design of Layer 0 and the choice of the frontend chip have been optimized to safely handle a background rate of (which will be used in the following discussion), considering on average 2 strips/hit and increasing the expected background hit rate by a factor five as a safety margin. With this background figure, and a strip area of , the expected hit rate per strip will be about 450 kHz.
The present SVT frontend, the Atom chip, cannot sustain this rate: with a readout window of , presently adopted the BABAR SVT, the Layer 0 strip occupancy would be about 45% . Even assuming a reduction of a factor two in the readout window, that is, operating the chip with 100 ns shaping time instead of the current 200 ns, this would ot provide acceptable occupancy. Studies performed on SVT data during noisy machine conditions has confirmed that there is a significant deterioration of reconstruction efficiency above 15% occupancy.
A different approach in the frontend is thus required to handle this level of background. We propose to adopt the FSSR2 readout chip, designed and optimized for the Forward Silicon Tracker of the BTeV experiment. This chip implements a fast data driven readout architecture, with no local pipeline, but enough bandwidth to ensure that no data are lost due to readout deadtime.
The FSSR2 chip, described in detail in [18] is a good match to the Layer 0 striplet design. It has 128 analog channels, with a sparsified digital output, and with address, timestamp and pulse height information for all hits. It has a selectable shaper peaking time (65 ns is possible). The chip has been realized in a CMOS technology for high radiation tolerance. The readout architecture has been designed to operate with 132 ns machine bunch crossing, using a BCO clock with the same frequency, that will define the timestamp granularity and the readout window. A faster readout clock (70 MHz) is used in the chip, with a token pass logic, to scan for the presence of hits in the digital section, and to transmit them off-chip, using a selectable number of output data lines. With six output lines, the chip can achieve an output data rate of 840 Mb/s.
During the design of the FSSR2 the efficiency of the architecture was investigated with detailed Verilog simulation [17]. In BTeV, with nominal machine operation (132 ns bunch crossing and 2 interaction/bunch), an FSSR2 chip occupancy at the level of 2% was expected, with a 132 ns readout window. Operated with a nominal BCO clock of 132 ns, the FSSR2 chip could handle the nominal 2% occupancy with an efficiency . Even with higher occupancy (6 % has been investigated), the FSSR2 could read data with an efficiency above 98.5 % , by operating the chip with a BCO clock of four times the nominal bunch crossing frequency.
In Super the FSSR2 chip for Layer 0 striplets, would have an occupancy of 6%, including the five times safety factor, using the nominal 132 ns readout window. The minimum efficiency figure () indicates the performance of the FSSR2 chip is adequate for our target application.
Signal-to-noise performance with FSSR2 chip
Noise performance of the FSSR2 has been carefully measured [18] using the second release of the chip. Those results have been used to calculate the signal-to-noise ratio for the baseline design of Layer 0.
The total capacitance load to the preamplifier input has been evaluated, including the interstrip capacitance and the capacitance to the back plane. The first term scales approximately with the ratio of the width of the strip over the pitch, while the second term depends on the ratio of the pitch over the thickness of the sensor. Parameters for the calculation have been extracted from the design of those existing SVT sensors that have the same pitch (). The total detector capacitance for the short Layer 0 striplets is 4 pF. A similar contribution to the preamplifier load capacitance, about 5 pF, comes from the traces on the flex circuit (both interstrip and back plane contributions have been included).
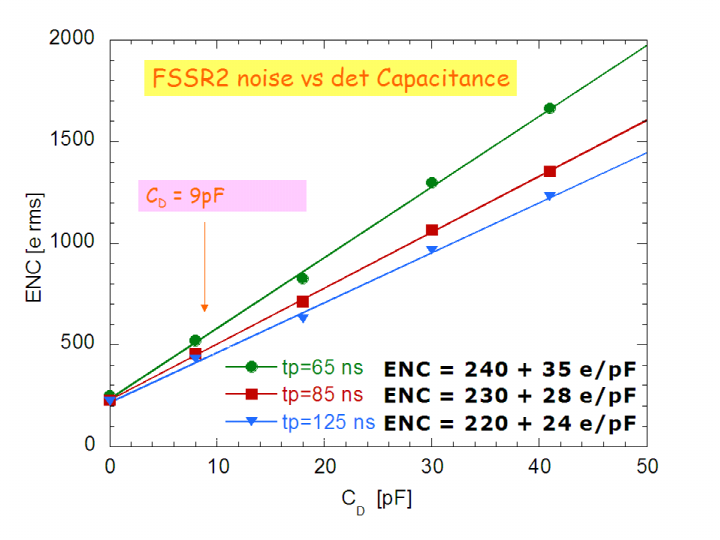
With a total load of about 9 pF the Equivalent Noise Charge (ENC) measured in the FSSR2 chip is about 500 , as shown in Fig. 15. adding in the noise contribution from the series resistance of the strip, which includes the sensor and the flex circuit strips, a total ENC of about 600 is expected. For a silicon thickness, the signal-to-noise ratio for MIPs will be about 26. Even taking into account the threshold dispersion measured for FSSR2 (about 300 ), this S/N figure will provide good performance.
Radiation damage
The background particle fluence at the 1.5 cm radius of the Layer 0 silicon sensor will be about particle/cm2/yr includig the safety factor, mainly due to electrons and positrons in the MeV energy range, corresponding to a dose of about 6.5 Mrad/yr.
Considering that the non-ionizing energy loss (NIEL) for electrons in the MeV range is 40 times less than for 1 MeV neutrons [19], the Super silicon sensors will receive an equivalent fluence of about /cm2/yr, well below the limits explored for high resistivity silicon sensor in the LHC experiments. The expected radiation damage will cause an increase in the depletion voltage, as well as S/N deterioration due to increased leakage current and a reduction in charge collection efficiency.
The overall radiation damage has been evaluated with the NIEL scaling hypothesis [19], which is likely to be a conservative assumption for electrons in the MeV energy range, considering a total equivalent fluence of /cm2 over the a five year experiment lifetime.
The expected change in the sensor depletion voltage would be marginal. The increase in strip leakage current () would be about 600 nA, calculated assuming conservatively the current-related damage rate , valid for 1 MeV neutrons. Recent experimental results [20] measured of the same order of magnitude, for high energy electrons (900 MeV), while older data for electrons of 1.8 MeV indicate much lower values for . With this increase in the leakage current the corresponding noise, after five years of operation, will increase up to about 960 (65 ns peaking time). A charge collection efficiency drop of about 10% would then be expected [15]. The overall Layer 0 performance, after five years of operation, would be still an acceptable S/N of about 15.
Support structure
The mechanical details related to the Layer 0 modules, together with the procedures for the module assembling, up to the final mounting on the flanges on the beam pipe have been worked out in some detail. A 3D drawing of a module is shown in Fig. 16. Each Layer 0 module, having a lateral width of 54.5 and a length of 28.4, is first assembled and microbonded while flat, using a planar chuck. Both hybrids are then rotated around the border of the fanout extensions using a bending mask. This rotation is necessary to allow the entire module to be positioned inside the radius of Layer 1 of the SVT (see Fig. 18). Laminated carbon-kevlar ribs with carbon fiber end-pieces are glued to fix the relative position of the hybrids and the sensor and to provide the needed rigidity. The Layer 0 cooling circuit is placed inside the annular region of the Layer 0 flanges and the hybrids are then mechanically and thermally coupled to the wings of the flanges by two buttons. Four modules are first mounted on each semi-circular flange (see Fig. 17), and the two halves are coupled to wrap the Layer 0 structure over the beampipe cylinder. Figure 19 reports the cross section of the whole SVT, with the Layer 0 positioned inside the current BABAR SVT.
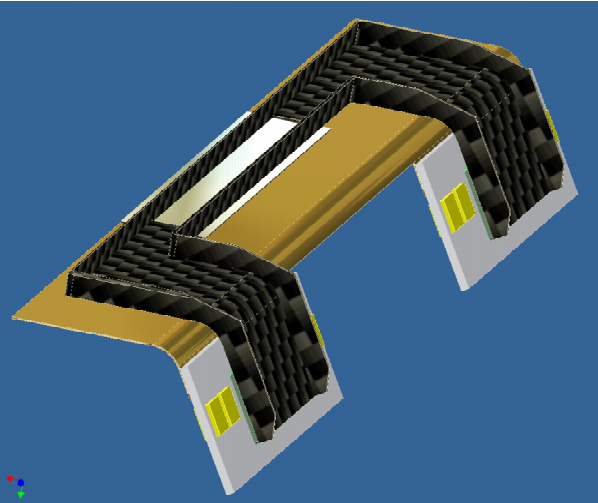
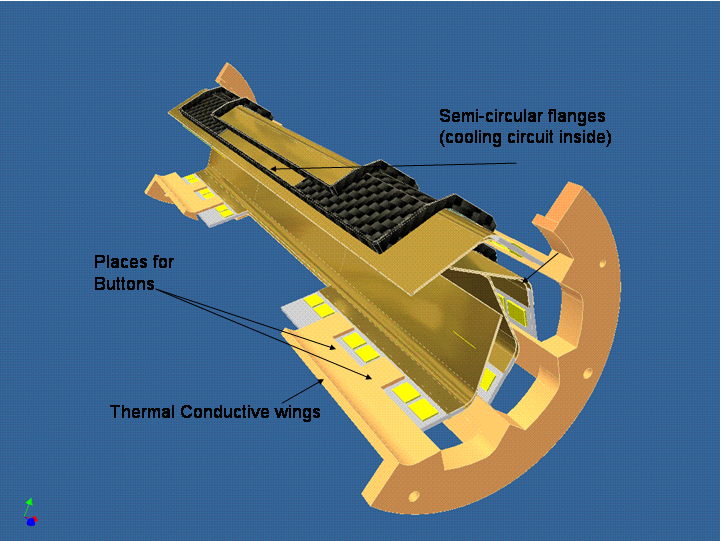


Material budget
For the baseline design with striplets, the Layer 0 material budget will be about for perpendicular tracks, assuming a silicon sensor thickness of , a light module support structure ( Silicon equivalent), similar to the one used for the BABAR SVT modules, and the multilayer flex contribution (3 flex layers/module, Silicon equivalent/layer). A reduction in the material budget to about is possible if kapton/aluminum microcable technology can be employed with a trace pitch of about .
5 Layer 0 CMOS MAPS Option
The optimal technical choice for Layer 0 would be the a pixel sensor. With a pixel area, the segmentation needed to reach the target vertex resolution, the occupancy from machine background is no longer an issue. The expected Layer 0 pixel occupancy is about 0.1% per pixel in time window with the five times safety factor included.
Pixel technologies adopted in previous experiment are not adequate for this application: hybrid pixels are too thick, while charge coupled devices are too slow and are not sufficiently radiation hard.
New CMOS Monolithic Active Pixel Sensors (MAPS) are a promising candidate for Layer 0: they incorporate the readout electronics and a very thin sensor on the same substrate, thereby reducing the detector material budget to assuming a thick silicon chip. The MAPS device uses an n-well/p-epitaxial diode to collect, through thermal diffusion, the charge generated by a particle passing through the thin epitaxial layer underneath the readout electronics.
CMOS MAPS matrices have been developed by several groups over the last few years. These designs follow the very simple readout scheme already adopted for imaging applications, based on the use of three transistors on the pixel cell (3T), with a sequential readout. Although these prototypes have shown excellent tracking performance, their readout speed, limited by the sequential processing, is a major limitation for applications in environments having high data throughput: a large area detector (1 Mpixel) might reach a frame readout rate of about 1kHz, much smaller than required in our application.
A different approach to the design of high readout speed MAPS has recently been proposed [10]. By exploiting the triple well option available in the CMOS commercial process, a full signal processing chain (charge preamplifier, shaper, discriminator and some elementary logic functionality) has been implemented at the pixel level, creating a monolithic pixel with a readout scheme easily compatible with data sparsification.
Several prototype chips (APSEL series) have been realized in the STMicroelectronics 0.13 m triple well technology, including single pixel cells and a small pixel matrix with a simple sequential readout. The results of the tests performed that proved the new approach proposed works as expected, and gave very encouraging results. A single pixel signal of about 1250 has been measured for MIPs from a radiative source. With further optimization of the frontend, a single pixel noise of about 50 has been achieved, giving a signal-to-noise ratio of about 25 for MIPs.
Based on this new MAPS design, a dedicated readout architecture to perform on-chip data sparsification is currently under development, to incorporate in the same detector the advantages of the thin CMOS sensors and functionalities similar to those in hybrid pixels. In particular, a first prototype chip with a small pixel matrix and the first block of a data driven architecture was submitted in November 2006. The readout of the final MAPS chip will be similar to that developed for the FSSR2 chip that will be used for the SVT outer layers, to ensure homogeneity in the peripheral electronics.
MAPS module design
A Layer 0 design based on MAPS sensor has been realized using, as in the baseline striplet option, an octagonal module structure. Each module will be composed of several MAPS chips glued onto a support structure, providing the required the mechanical stability and hosting the metal traces that connect the power, command and data lines to the two hybrid circuits mounted at each end of the module, outside the fiducial region. For each MAPS chip some of the readout electronics will be located at the chip periphery, outside the active part of the sensor: to fill in the cracks between the chips (in and ) a double layer of MAPS is used. The two MAPS layers will be placed on the same mechanical support, forming a module. Each side of the module consist of 8 chips, each comprising pixels, pitch.
Power dissipation is one of the main issues for the MAPS module design: since the sensor and electronics are integrated on the same chip, a considerable amount of heat must be dissipated in the active area, while keeping the material of the cooling system to a minimum. In the present version of the APSEL chip, the power consumption (W/pixel) is dominated by the analog part of the frontend, although W/pixel is easily achievable with minor modifications. A new design of the analog part of the frontend has been explored, tests aimed at reducing the power consumption to about W/pixel are under way. Different designs for the mechanical support of the Layer 0 modules with MAPS are under study, depending on the minimum power consumption achievable.
With a power budget below about W/pixel, operation without cooling in the active region would be possible, using the module itself as thermal bridge to conduct the heat from the active area to the ends of the module. Each module will be mechanically and thermally coupled to the water-cooled end flanges located outside the fiducial region. For this option, with a Layer 0 material budget of about , including two MAPS layers (50 Si each) and the module support structure made of BeO (600 thick), a FEA simulation indicates a maximum operating temperature of about 30 C.
Above W/pixel, water cooling in the active region is necessary. In this case one solution investigated is to include in the module support structure a water-filled microchannel. Results from FEA simulation indicate a maximum operation temperature of a few degrees celsius above the water temperature. For this option the total material budget for Layer 0 would be about , including 2 MAPS layers (50 Si each) and the the support structure made of AlN (680 thick, incorporating the water microchannel).
In the high power dissipation scenario, an alternative solution, currently under study, is to use the external cylinder of the beam pipe both as a mechanical support and as cooling source to evacuate the Layer 0 heat. The beam pipe design already foresees a cooling system capable of dissipating about 1 kW. This approach could further reduce the total material budget for the Layer 0 design with MAPS.
MAPS radiation tolerance
The radiation hardness of the MAPS sensors is an important issue that requires further investigation, though preliminary tests [21] indicate that this technology can be applied, with modest performance deterioration, in the Super environment. The triple well MAPS sensor (APSEL) is expected to be even more radiation-tolerant than the standard MAPS design [10], though the APSEL MAPS radiation resistance still remains to be investigated.
The readout electronics for CMOS MAPS, realized with modern deep submicron technology, and special layout rules, can withstand the expected radiation levels. The signal-to-noise performance of the device could deteriorate in two ways due to radiation damage to the active sensor: a reduction in charge collection efficiency due to trapping (bulk damage, from non ionizing radiation effects), and an increase in the leakage current of the collecting diode (surface damage, due to ionizing radiation), causing a higher shot noise contribution.
Both effects have been partially investigated with irradiation tests on several standard MAPS prototypes (3T readout). First results from irradiation with neutrons and protons [22, 23] , indicates that fluences of neq/ 2 can be tolerated, with only a modest (about 5%) reduction in the collected signal, Higher fluences might be allowable, by operating the detector at low temperature to compensate the signal reduction with a lower shot noise contribution.
Preliminary studies on ionizing radiation effects [24] indicate that the noise increase for a standard pixel design could be kept under control up to a dose of 20 Mrad from a60Co source. The key requirements are to operate the detector with a short integration time ( 100 s), or at low temperature (0C), noting the integration time dependence of the shot noise: .
An alternative approach to reduce the ionizing radiation effects is to modify the pixel design to avoid placing a thick oxide layer close to the n-well/ p-epi junction. The leakage current contribution for irradiated sensors is dominated by surface defects present at the interface between the poor quality thick oxide and the silicon. The first structure realized with a hardened pixel design has shown encouraging results [21].
6 R&D issues
The technology for the Layer 0 baseline striplet design is well-established. The multilayer flexible circuit, to connect the sensor to the frontend, may benefit from some R&D to reduce the material budget: either reduce the minimum pitch on the Upilex circuit, or adopt kapton/aluminum microcables and Tape Automated Bonding soldering techniques with a pitch.
The FSSR2 chip, proposed for the readout of the striplets and the outer layer strip sensors, would haveto be produced with some minor modifications.
The CMOS MAPS technology is very promising for an alternative design of the Layer 0, but extensive R&D is still needed to meet all the requirements. Key aspects to be addressed are: the readout speed, power consumption, radiation tolerance and the development of a thin mechanical support structure to allow us to realize the benefits of the very thin MAPS sensor. A detailed R&D program will be pursued within the SLIM collaboration (Silicon detectors with Low Interaction with Material), funded by the Istituto Nazionale di Fisica Nucleare and the Italian Ministry for Education, University and Research. Among the final goals of this R&D project is the development of a MAPS matrix device, with sparsified readout and timestamp information, suitable for use in a trigger system based on associative memories (ref SLIM5 project). A test beam run is foreseen for 2008 with a small prototype tracker demonstrator consisting of a few planes of thin striplet sensors read out by FSSR2 chips, and two planes of MAPS matrices.
5 Drift Chamber
1 Introduction
The drift chamber (DCH) is the main tracking and momentum-measuring system. It provides precision momentum measurements, as well as good particle identification for low momentum tracks (those below DIRC threshold) and for tracks in the forward direction, outside the DIRC acceptance. The DCH design is based on the BABAR drift chamber, described in detail in the original BABAR detector publication[8], which is summarized below.
2 BABAR DCH
The drift chamber is a conventional cylindrical design, 2.8 m long, with flat aluminum endplates to hold plastic and metal feedthroughs for the wires (see Fig. 20). The inner cylinder is composed of three parts: a central beryllium section, 1.5 m long and 1 mm thick, surrounding the interaction point and the covering the full acceptance for decays; and forward and backward aluminum sections, 5 mm think, with flanges for attaching the endplates. The outer cylinder is a 5 mm think composite of Nomex honeycomb wrapped in carbon fiber.
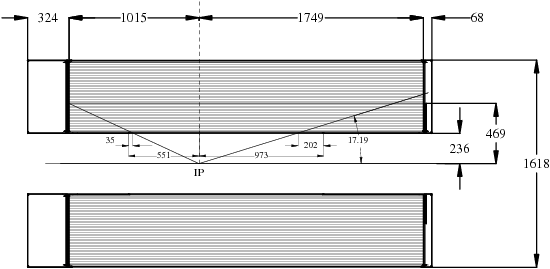
The forward () endplate is machined with a step: for mm, the plate is 25 mm thick; outside that radius it is 12 mm thick. This provides sufficient strength to support the load of the wire tension while minimizing material for tracks in the forward direction.
The drift system of the chamber consists of 40 layers of close-packed hexagonal cells, each with a single sense wire surrounded by field-shaping wires. Each hexagonal cell is approximately 1 cm in radius. The individual layers are arranged in ten “superlayers,” as shown in Fig. 21. To provide three-dimensional track reconstruction, the superlayers alternate between axial (wires parallel to the axis), and small-angle stereo (wire endpoints offset by 7 to 12 cells, in alternate directions).
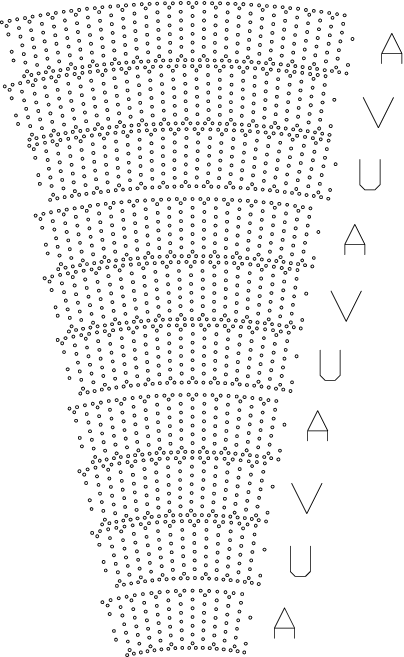
Three types of wires, at different voltages, define the cell electric field distribution. The sense wires, at the center of each hexagonal cell, are 20 diameter gold plated tungsten-rhenium alloy operated at 1930 V. Each sense wire is surrounded by six grounded 120 gold-plated aluminum field-shaping wires. Along the boundary of each superlayer, the ground wires are replaced by a pair of 80 gold-plated aluminum wires at 335 V. Adjacent to the inner and outer cylinders of the chamber, a set of three wires are used with each cell, the middle wire grounded, and the other two at 850 V. These intermediate voltage wires serve two purposes: they provide more uniform and symmetric electric field configurations within the superlayer-edge cells, and they assist in clearing residual ionization from the gaps between superlayers, and between the wire field and the cylindrical boundaries.
The drift chamber is operated with a gas mixture of 80% helium and 20% isobutane, passed through a bubbler to introduce 3500 ppm of water vapor. The bubbler also introduces approximately 100 ppm of oxygen into the gas mixture, which has a small effect on the avalanche gain. The chamber is maintained at 4 mbar over atmospheric pressure with a recirculating pump; freshly mixed gas in introduced as necessary to account for losses.
The performance of the BABAR drift chamber in six years of operation has been excellent. The momentum resolution is determined by reconstructing through-going cosmic ray events as two separate “tracks,” and taking the difference in the fitted transverse momentum (inverse curvature in the plane) at the center of the chamber as the resolution. The result is
The single-hit position resolution is determined for all tracks by comparing the fitted trajectory excluding each measured hit with the position of the hit determined from the readout timing and the calibration time-to-distance relation for that cell. The result (Fig. 22) is a weighted-average resolution of 125 over all cells; in the region of each cell with the most uniform electric field, the resolution is 100 .
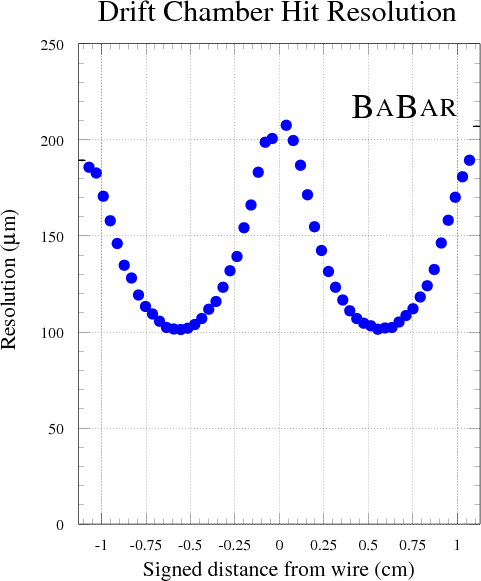
The drift chamber readout system includes both timing, with 1 ns precision, and integrated charge information. The detector is calibrated for the electronics gain of each channel, normalized for the charge deposition and avalanche gain as a function of track trajectory in each layer of the chamber. With these calibrations, the integrated charge from each hit may be used to compute a relative energy loss; the for each track is computed from an 80% truncated mean of the hits assigned to a track, as shown in Fig. 23. For electrons from radiative Bhabha events, we obtain .
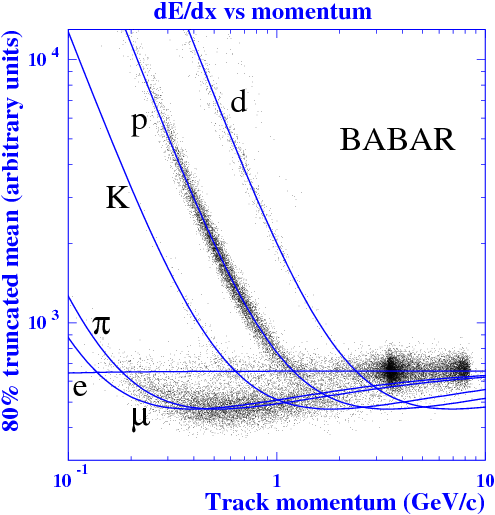
3 DCH Gas
The occupancy rate in the drift chamber at Super is a potential limiting factor. It would be beneficial to find a gas with a shorter collection time for the ions in a cell, so there is less chance of having overlap hits from unrelated events. We have defined a figure-of-merit for the collection times that can be used to compare various gas mixtures with the BABAR DCH cell geometry and compared several gas mixtures to the mixture used in BABAR- Helium:Isobutane (80:20).
The drift chamber simulation program GARFIELD was used for this study. A single hex cell was defined having one sense wire and 6 field wires surrounded by another 6 bias wires at an appropriate voltage to provide the same fields on the sense and field wire surfaces as in a BABAR cell, namely 250 kV/cm on the sense wire and 20 kV/cm on the field wires. The same magnetic field (1.5 T) was also used in the simulation.
Tracks were generated by GARFIELD, randomly positioned in the region from 0 to 1 cm from the sense wire with a vertical orientation in the cell (emulating a radial straight track in a BABAR cell). For each track, ions were populated along the track, and GARFIELD made a histogram of the arrival times of all ions that reached the sense wire. The histograms generally have a broad maximum for a collection time less than 200 ns, with a falling count rate at larger collection times due to shortened track-segments near the boundary of the cell.
A figure-of-merit is established by noting the time () at which 50% of the charge is collected, and a time () at which 90% of the charge is collected. These values of and were calculated for a variety of gas mixtures to find the fastest gases.
Table 1 shows the results of the study. The table lists the properties of the individual gases, such as density and radiation length. The columns marked ns and ns give the collection times for each mixture. The BABAR gas, He(80)Isobutane(20) has reference values of 400, 560 ns for , respectively.
| Gas Mixture (%) | Drift Time | |||||||
| He | Ne | Ar | CH4 | C4H10 | CO2 | O2 | ||
| 80 | 20 | 400 | 560 | |||||
| 100 | 560 | 700 | ||||||
| 50 | 50 | 370 | 500 | |||||
| 50 | 45 | 5 | 365 | 495 | ||||
| 40 | 54 | 6 | 350 | 480 | ||||
| 40 | 57 | 3 | 320 | 480 | ||||
| 40 | 57 | 3 | 321 | 496 | ||||
| 97 | 3 | 400 | 580 | |||||
| 95 | 5 | 360 | 530 | |||||
| 90 | 10 | 360 | 540 | |||||
| 95 | 5 | 480 | 660 | |||||
| 99.9 | 0.1 | 560 | 695 | |||||
| 40 | 55 | 5 | 355 | 520 | ||||
| 89 | 1 | 10 | 360 | 520 | ||||
Methane () is known to have a high drift velocity, but this does not mean it has a shorter collection time, because the large Lorentz angle for this gas makes the electrons spiral around the sense wire. In fact 100% has a longer collection time (560 and 700 ns) than the BABAR gas. Various mixtures of with Isobutane () or are shown. The Helium:Methane: (40:57:3) mixture has the shortest collection times of 320, 480 ns, approximately 20% less than the BABAR gas. Replacing helium with neon or argon does not improve the figure-of-merit and greatly increases the number of radiation lengths.
In summary, a gas mixture with methane could reduce the collection time, but only by 20%, compared to BABAR gas.
4 Cell Geometry
With the increased luminosity and beam-related backgrounds at Super, drift chamber cell size and occupancy become important factors in determining the cell configuration. An increase in the number of cells, while decreasing the per cell occupancy, increases the amount of material in the drift chamber, and could have an effect on resolution.
We have studied the effect of cell size on tracking resolution in simulation using the BABAR detector as a starting point, and varying size of the drift chamber cells. The BABAR drift chamber has hexagonal cells of 2 diameter in each dimension. For comparison, we simulated drift chambers with individual cell diameters of 1.5 and 1.0, keeping consistent the chamber inner and outer radius, the amount of material in the inner part of the detector, and the gas mixture. We used a center-of-mass boost of . We also included a level zero silicon vertex detector, but omitted the BABAR-style support tube.
| Resolution (MeV) | |||
| 2 | 1.5 | 1 | |
| 11.4 | 11.8 | 12.3 | |
| 1.64 | 1.67 | 1.74 | |
| 15.9 | 16.6 | 17.3 | |
| 1.73 | 1.78 | 1.84 | |
| E | 11.5 | 12.1 | 13.1 |
| 20.1 | 20.6 | 21.3 | |
| 20.5 | 20.9 | 21.6 | |
| 4.90 | 5.28 | 5.77 | |
| 11.8 | 12.4 | 13.4 | |
Because the cells are in a regular hexagonal configuration, the number of cells in each layer for the drift chambers with 1.5 and 1.0 diameter cells increased from 40 layers to 53 and 80, respectively. The maximum and minimum stereo angles are kept the same as in the BABAR drift chamber. The per cell resolutions for the 2, 1.5, and the 1 are taken to be 140, 157, and 178 , respectively. The first is typical of BABAR, while the last two are obtained by assuming the increase in resolution in a smaller cell caused by near-wire effects are the same for all cell sizes.
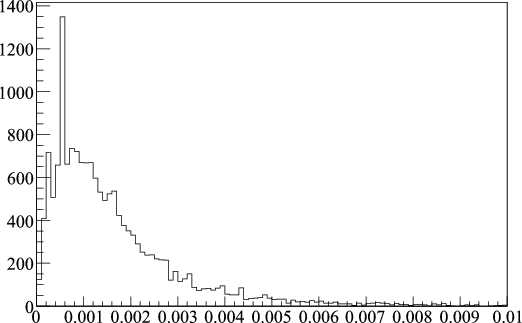
For each of these drift chamber configurations, we simulated 50,000 events of each of the following meson decay modes using the PRAVDA and TRACKERR simulation programs: , , , and . Table 2 shows the resolution from gaussian fits to composite particle mass and distributions. While in every case, the resolution of these quantities increases as the drift chamber cells get smaller, the increase in per cell resolution is largely offset by the addition of extra layers.
5 Backgrounds
The dominant source of background in the Super DCH is expected to be radiative Bhabhas, as discussed in section 2. Off-energy electrons and positrons shower in the beamline elements, and the tails of those showers may penetrate the passive shielding and reach the DCH. Most of the particles reaching the DCH are photons; their energy spectrum is shown in Fig 24. There is also a small component of electrons. At these energies, the photon cross-section is dominated by Compton scattering. To model the DCH material, we take the mix of gas and wires from the BABAR DCH, corresponding to a density of , to estimate the probabilty of a photon interaction in the DCH. At the Compton cross-section is , corresponding to a path length of . Thus most photons do not interact in the gas volume, but those that do produce Compton electrons that spiral along field lines in the magnetic field. To estimate the occupancy from radiative Bhabhas we assume that each electron produces a signal in three DCH cells.
Since the radiative Bhabhas originate along the beam-line roughly m from the IP, the number of background hits will be highly dependent on the amount of passive shielding inside the DCH. Two different shielding schemes have been simulated, to bracket the range of possible IP designs. The entry point for photons, along with the trajectory of a few entering electrons, is shown in Fig. 25. In this case, the DCH would have an occupancy of roughly 7%; with additional shielding the occupancy can be reduced to 1.5%.
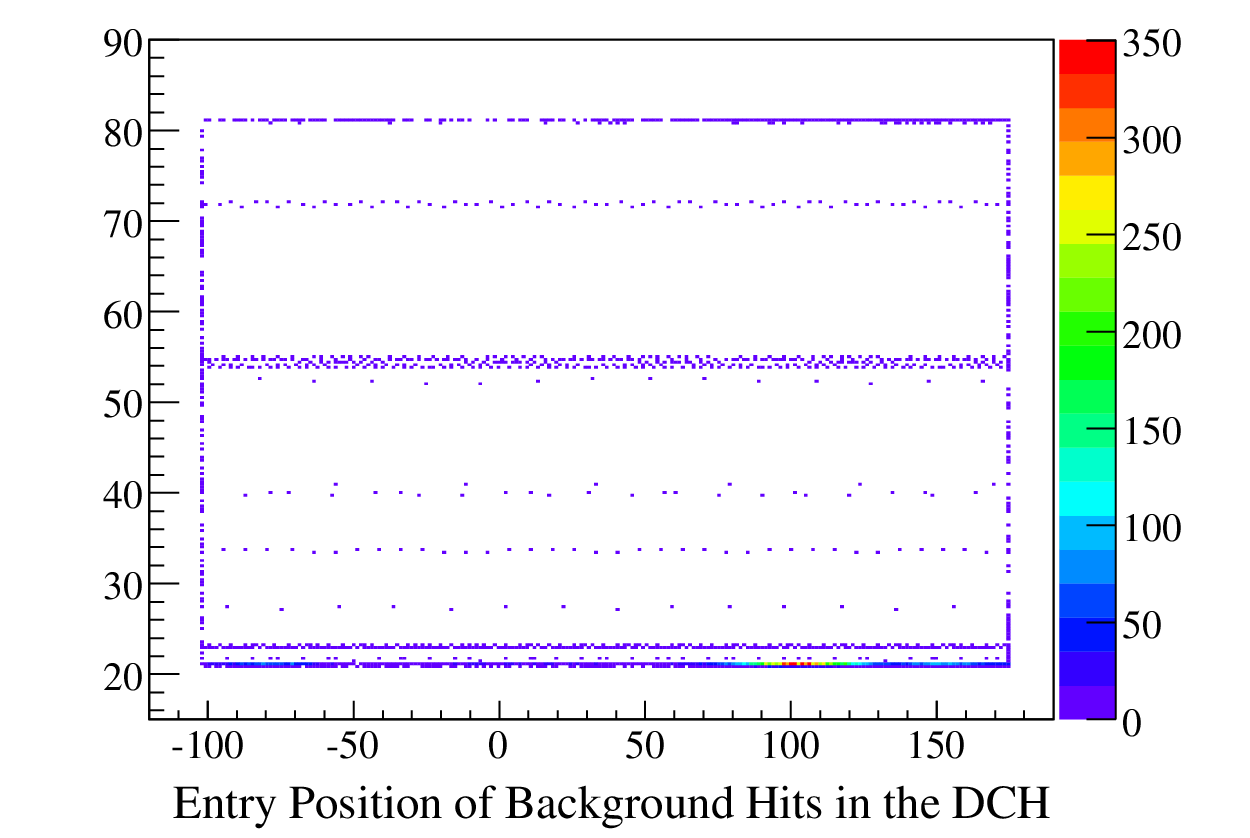
6 Particle Identification
1 Introduction
Excellent particle identification (PID) for hadrons and leptons over the full momentum range for particles coming from decays is essential to achieving the physics objectives of the Super experiment. In particular, precision measurements of violation require full particle identification to reconstruct exclusive final states, to discriminate against backgrounds, and tag the quark flavour of the other in the event. In addition, studies of inclusive and exclusive decays of charm and physics benefit directly from high-momentum hadron identification. In general, these channels require the separation of pions and kaons at considerably higher momenta than does physics – indeed if the full acceptance is to be used for these channels, particle separation up to about 6 is needed in the forward direction.
Leptonic identification at Super is provided by the EMC and IFR detectors, while charge deposition () in the central trackers can be used to identify low-momentum hadrons. However, these techniques are insufficient to distinguish pions and kaons with momenta greater than approximately 0.7 or protons above 1.3 , as is required to obtain efficient tagging and event reconstruction. To cover this momentum range, a dedicated hadronic PID system is needed. The existing BABAR DIRC ring imaging Cherenkov system, described below, provides excellent performance over the entire momentum range for physics, but geometrically covers only the barrel portion of the detector. A modest upgrade of this device would provide adequate performance at Super. Further enhancements to the technology can improve the performance but require significant R&D and will be significantly more expensive.
The baseline detector described below contains a PID upgrade for the forward end cap to improve the PID hermiticity. However, as there are potential losses in performance as well from including such a system, especially for photon detection, a cost/benefit analysis is currently underway to ascertain the tradeoffs associated with such a PID system in the end cap region.
2 Baseline barrel PID for Super – BABAR DIRC
Purpose and Design Requirements
The particle identification system should be thin and uniform in terms of radiation lengths (to minimize degradation of the calorimeter energy resolution) and thin in the radial dimension to reduce the volume, and hence, the cost of the calorimeter. For operation at high luminosity, the PID system needs fast signal response, and must be able to tolerate high backgrounds.
The PID system used in BABAR is a new kind of ring-imaging Cherenkov detector called the DIRC (the acronym DIRC stands for Detection of Internally Reflected Cherenkov light). It has be proven to provide pion/kaon separation of more than 2.5 , for all tracks from meson decay from the pion Cherenkov threshold up to 4.2 . Particle identification below 700 relies primarily on measurements in the DCH and SVT.
DIRC Concept
The DIRC is based on the principle that the magnitude of the Cherenkov angles are maintained upon reflection from a flat surface. Figure 26 shows a schematic of the DIRC geometry that illustrates the principles of light production, transport, and imaging. The DIRC radiator is synthetic fused silica in the form of long, thin bars with rectangular cross section. These bars are also light pipes for that portion of the Cherenkov light trapped in the radiator by total internal reflection. The Cherenkov photons are detected by an array of densely packed photomultiplier tubes (PMTs), each surrounded by reflecting light-catcher cones to capture light which would otherwise miss the active area of the PMT. The PMTs are placed at a distance of about 1.2 m from the bar end. The expected Cherenkov light pattern at this surface is essentially a conic section, where the cone opening-angle is the Cherenkov production angle modified by refraction at the exit from the fused silica window. The DIRC is intrinsically a three-dimensional imaging device, using the position and arrival time of the PMT signals. Photons generated in a bar are focused onto the phototube detection surface via a “pinhole” defined by the exit aperture of the bar. In order to associate the photon signals with a track traversing a bar, the vector pointing from the center of the bar end to the center of each PMT is taken as a measure of the photon propagation angles. Since the track position and angles are known from the tracking system, the three angles can be used to determine the two components of the Cherenkov angles.
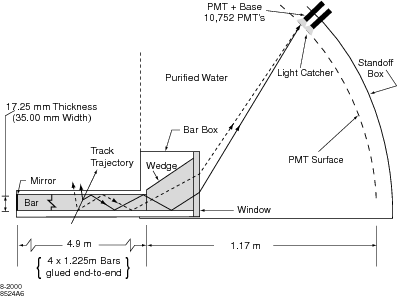
The arrival time of the signal provides an independent measurement of the propagation time of the photon, and can be related to the propagation angles. This over-constraint on the angles and the knowledge of the timing of the signal are particularly useful in dealing with ambiguities in the signal association, especially in high background situations.
BABAR DIRC Design
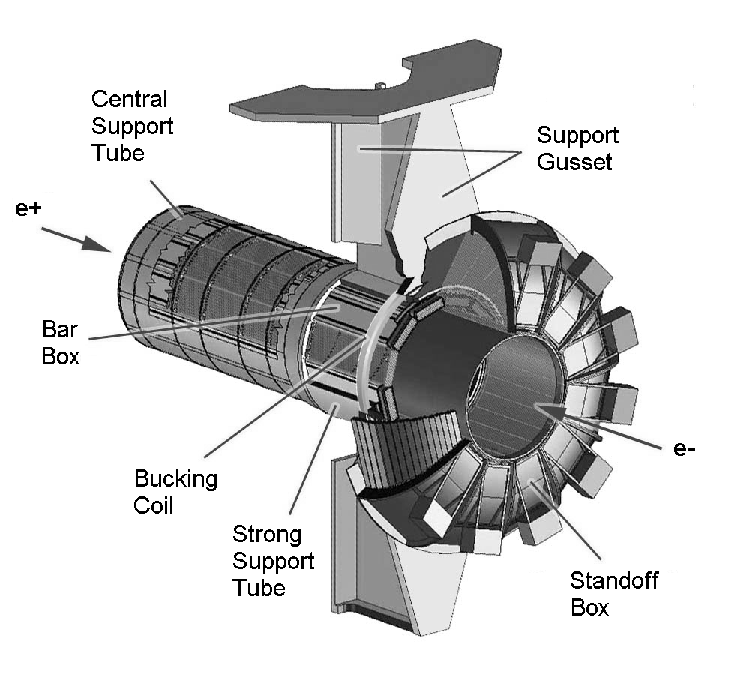
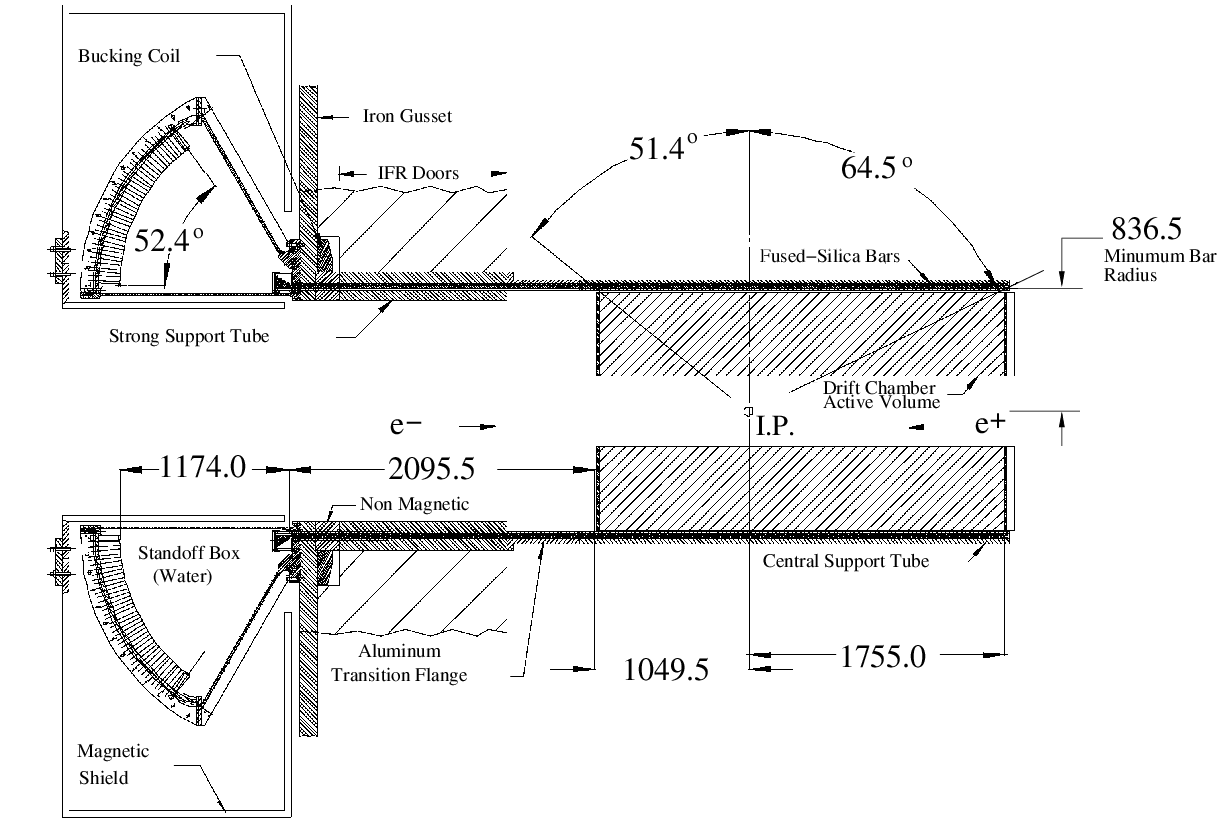
The DIRC design and construction are described in detail in ref. [26]. The principal components of the DIRC are shown schematically in Fig. 27. The radiator bars are grouped into 12 hermetically sealed containers, called bar boxes, made of very thin aluminum-Hexcell panels. Each bar box contains 12 bars, for a total of 144 bars. Within a bar box the 12 bars are optically isolated by an 150 m air gap between neighboring bars, enforced by custom shims made from aluminum foil. The bars have nominal dimensions of 17.25 mm thick (in the radial direction), 35 mm wide (azimuthally), and 4.9 m long. Each bar is assembled from four 1.225 m pieces glued end-to-end (a 1.225 m length bar was the longest obtainable with high quality [27]). The standoff box (SOB), made of stainless steel, consists of a cone, a cylinder, and 12 sectors of PMTs. It contains about 6,000 liters of purified water. Water is used to fill this region because it is inexpensive and has an average index of refraction () reasonably close to that of fused silica, thus minimizing total internal reflection at the silica-water interface. Furthermore, its chromaticity index is a close match to that of fused silica, effectively eliminating dispersion at the silica-water interface. Iron gussets support the standoff box. An iron shield, supplemented by a bucking coil, surrounds the standoff box to reduce the magnetic field in the PMT region to below 1 Gauss. The PMTs at the rear of the standoff box lie on a surface that is approximately toroidal. Each of the 12 PMT sectors contains 896 PMTs (ETL model 9125B) with 29 mm-diameter, in a closely packed array inside the water volume. A double O-ring water seal is made between the PMTs and the vessel wall. The PMTs are installed from the inside of the standoff box and connected via a feed-through to a base mounted outside. A hexagonal light catcher cone is mounted in front of the photocathode of each PMT, improving the effective active surface area light collection fraction to about 90%. The DIRC occupies 80 mm of radial space in the central detector volume, including supports and construction tolerances, with a total thickness of about 19% at normal incidence. The radiator bars subtend a solid angle corresponding to about 94% of the azimuth and 83% of the center-of-mass polar angle.
The DIRC frontend electronics (FEE) is designed to measure the arrival time of each Cherenkov photon detected by the PMT array to an accuracy that is limited by the intrinsic 1.5 ns transit time spread of the PMTs. The design contains a pipeline to deal with the Level 1 trigger latency of 12 , and can handle random background rates of up to 2.5 MHz/PMT with less than 1 % dead time. The DIRC FEE are mounted on the outside of the SOB; the FEE are highly integrated in order to minimize cable lengths and to retain the required single photoelectron sensitivity. The photon arrival time is measured by the time-to-digital-converter (TDC) chip, a self-calibrating 16-channel microchip which performs three major functions: digitization of the input signal time with 520 ps binning (250 ps resolution rms); and pulse pair separation of 33.6 ns; and simultaneous handling of input and output data.
The DIRC uses two independent approaches for calibration of the unknown PMT time response, and the delays introduced by the FEE and the fast control system. The first is a conventional pulser calibration using a light pulser system to generate precisely timed 1 ns duration light pulses from a blue LED. The second uses reconstructed tracks from collision data. The data stream and online pulser calibrations yield fully consistent results. The time delay values per channel are typically stable to an of less than 0.1 ns over more than one year of daily calibrations.
BABAR DIRC Performance
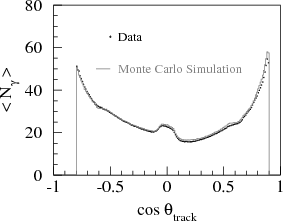
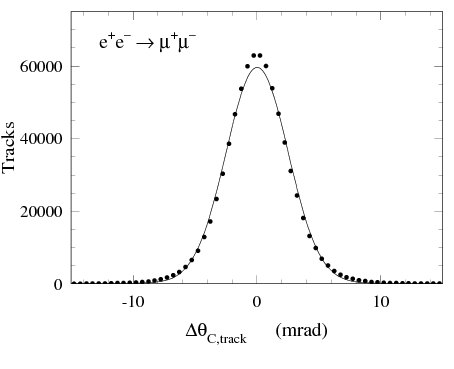
During seven years of running the DIRC has performed efficiently and reliably. The DIRC plays a significant role in most BABAR physics analyses. Details of the DIRC operational experience and the use of DIRC in BABAR physics analyses can be found in ref. [26].
Some deterioration of the PMT front glass windows (made of B53 Borosilicate glass) that are immersed in the ultra-pure water of the standoff box has been observed since 2000. With water in the standoff box, these features are not very noticeable, as water provides good optical coupling even to corroded glass. For most of the tubes, the observable effect is typically a slight cloudiness, but for about 50 tubes, it is a much more pronounced crazing. Extensive studies have shown that this effect is associated with a loss of sodium and boron from the surface of the glass. Chemical analysis of the water has shown that the leaching rate is a few microns per year, and is expected to be acceptable for the full projected ten year lifetime of the experiment. Loss of photon detection efficiency can arise from the corrosion of the PMT front glass windows, as well as from photocathode aging, dynode aging, and possible deterioration of the water transparency or pollution of bar or window surfaces. Direct measurements of the number of Cherenkov photons observed in dimuon events as a function of time can be used to determine any degradation of the photon yield. An analysis using dimuon events from October 1999 through June 2006 shows a stable photon loss rate of 1-2%/year. There is no significant dependence of the loss rate on the radiator bar number, the position of track long the bar length, or the location of the Cherenkov ring in the PMT plane. If the photon loss rate continues at this rate, the impact on the particle identification power of the DIRC is negligible over the lifetime of the experiment.
The background in the DIRC is dominated by low energy photons from PEP-II hitting the water-filled standoff box. Our experience has been that attention to shielding in the DIRC standoff box region is required to reduce the sensitivity to beam-induced backgrounds and keep the background rate under a limit of 300 kHz/tube.
The single photon Cherenkov angle resolution has been measured to be about 9.6 mrad, dominated by a geometric term that is due to the sizes of bars, PMTs and the expansion region, and a chromatic term from the photon production. The measured time resolution is 1.7 ns, close to the intrinsic 1.5 ns transit time spread of the PMT’s.
The average value of the number of detected photoelectrons, , shown in Fig. 28, varies between about 17 for tracks with nearly perpendicular incidence to nearly 60 for polar angles towards the forward and backward regions. The increase in the number of photons for tracks in the forward direction compensates for the reduced average separation in the Cherenkov angle for different particle hypotheses due to the increased track momenta in this region.
The Cherenkov angle resolution, , for tracks from dimuon events, , is shown in, in Fig. 28. The width parameterized by a single Gaussian distribution, is 2.5 . The resolution is larger than the design goal of 2.2 , which was estimated from the extensive study of a variety of prototypes, including a beam test.
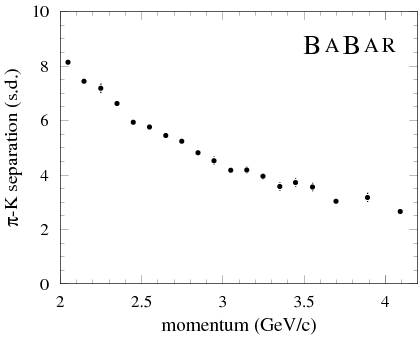
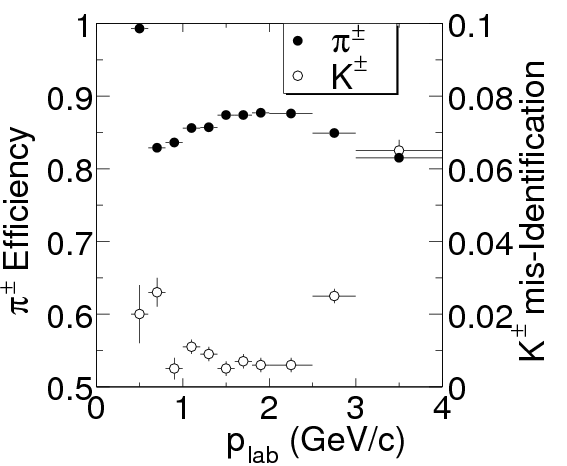
The decay chain111Unless explicitly stated, charge conjugate decay modes are assumed throughout this section. is well suited to probe the pion and kaon identification capabilities of the DIRC. It is kinematically well-constrained and the momentum spectrum of the charged pions and kaons covers the range accessible by meson decay products in BABAR.
The pion-kaon separation power is defined as the difference of the mean Cherenkov angles for pions and kaons assuming a gaussian distribution, divided by the measured track Cherenkov angle resolution. As shown in Fig. 29, the separation between kaons and pions is about at 3 declining to about 2.5 at 4.2 .
The efficiency for correctly identifying a charged kaon that traverses a radiator bar and the probability to wrongly identify a pion as a kaon, determined from the inclusive sample are shown as a function of the track momentum in Fig. 29 for a particular choice of particle selection criteria. The kaon selection efficiency and pion misidentification, integrated over the and momentum spectra of the control sample, are % (stat. only) and % (stat. only), respectively.
Summary of the barrel PID system
The barrel DIRC is a novel ring-imaging Cherenkov detector well-matched to the hadronic PID requirements of BABAR. The detector performance achieved is excellent and close to that predicted by the Monte Carlo simulations. The DIRC has been robust and stable, and, indeed, serves also as a background detector for PEP-II tuning. In combination with measurements in the DCH and SVT this system will provide pion/kaon separation of more than 2.5 , for all tracks from meson decays from the pion Cherenkov threshold up to 4.2 , as shown in Fig. 30
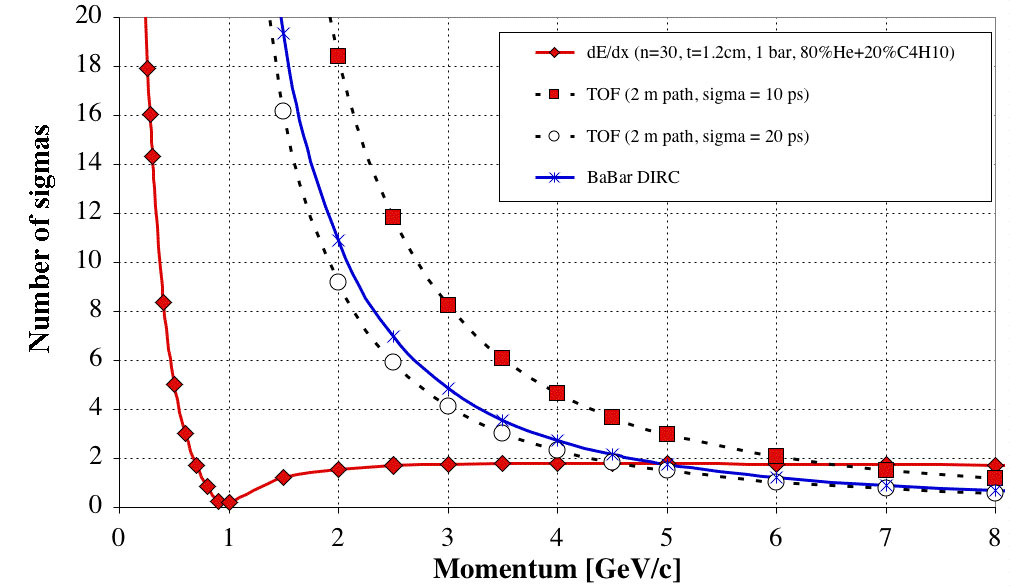
3 PID Options
Baseline Barrel Solution
Since the existing BABAR DIRC photon detectors are aging, at a minimum they need to be replaced with modern conventional phototubes. To gain headroom with respect to background, these PMTs should be faster than the present devices, such as the Hamamatsu R6427 with 0.5 ns (FWHM) transit time spread. This will increase the background rejection capability by a factor 8 to 10. A small extrapolation of the present “non-focusing” design is costed that replaces the large conventional PMTs with modern pixelated PMTs, such as the Hamamatsu H-8500 MaPMT ( mm2 pixels and spread with a transit time spread of less than 0.15 ns). This allows a much smaller SOB to be used with fused silica coupling and is expected to improve the background rejection capability by another factor of 5-10. With these modifications, the PID performance of the barrel should be essentially identical to that of the present BABAR DIRC system described above, with good performance within the expected background environment.
Further upgrades of the barrel detector system are possible that could provide still further significant headroom in a high background environment, and improve the PID performance, as described below.
Barrel focusing DIRC option
A new photon detection region will be placed within the SOB (magnetic field shielded) volume. This will consist of 12 modular focusing blocks, attached to each bar box. The light emitted from each bar will be focused onto a plane of fast pixelated photodetectors, such as 64-channel Burle/Photonis microchannel plate PMTs or 64/256-channel Hamamatsu multi-anode PMTs. The time resolution of the PMTs is sufficient to provide significant performance gain for measuring the Cherenkov angle, through correction of the chromatic effects [28]. The shorter time resolution improves the background suppression by more than an order of magnitude compared to the present DIRC, and, in addition, the mass of standoff material (i.e. water) is reduced by more than an order of magnitude, thus reducing the probability of secondary interactions in the material, which is the major current source of background in the BABAR DIRC.
Endcap upgrade
It is understood that there are a number of cases where BABAR physics would have benefited if the PID system had covered the forward endcap as well as the barrel. Even though the endcap covers only a modest portion of the geometrical acceptance, a more hermetic detector than BABAR would allow higher efficiency for exclusive physics channels, and could be especially valuable for some of the types of studies expected to be important at Super. For example, recoil physics studies benefit significantly (much faster than linearly) from the highest possible acceptance. Monte Carlo studies of the physics gains expected in multi-body decays are underway to quantify the physics gains.
Thus, the base detector presented here includes a forward TOF PID system. However, as there are potential losses in performance as well from including such a system, especially for photon detection, a cost/benefit analysis, which is currently underway, is needed to ascertain the tradeoffs associated with such a PID system in the end cap region.
Two candidate endcap detector designs are being considered - one utilizing an aerogel radiator RICH to provide separation to the highest momenta seen in the forward direction, and another using a fused silica radiator to obtain very good time-of-flight (TOF) performance covering the region up to about 4 . Space considerations, PID performance needs, and the amount of total material in front of the electromagnetic calorimeter, which degrades its performance, led us to pursue further studies of the TOF system only.
Status of time-of-flight system R&D
There has been progress in TOF capability recently, making it worthwhile to consider such a system for Super. The progress derives from the introduction of new, very fast vacuum-based photon detectors with a transit time distribution of 30-50 ps, and the use of Cherenkov light rather than the scintillation light for the TOF measurement.
Figure 30 shows thata time resolution of about 10 ps is required to make the TOF method competitive with, for example, a Forward Aerogel RICH. A resolution of 15-20 ps is likely to prove a more realistic goal in practice. The main advantage of the TOF system is its cost and simplicity compared to RICH techniques.
The proposed endcap TOF system consists of a sheet of fused silica radiator, 10 mm thick, coupled to a matrix of Burle/Photonis MCP-PMTs, each 5x5cm2 in size and each with 3mm thick MCP windows. The large radiator sheet is glued together from smaller segments and it is slightly tilted to minimize the time spread of the Cherenkov photons arriving at the photocathode. The continuous radiator plate reduces the effect of gaps between the MCP-PMT detectors. It might, however, be useful to segment the radiator into smaller units to facilitate maintenance; each segment would then carry several MCP-PMTs and be removable as a unit. An open question is whether we should allow photon reflections from the front surface of the radiator. If further analysis shows that thus is not desirable, we may choose to provide a photon trap on the front surface, for example, by pressing a soft rubber sheet onto it.) The Burle/Photonis MCP-PMT can have either a bialkali or an S20 multialkali photocathode; the expected number of photoelectrons is at least 30 photoelectrons per track. Each MCP-PMT detector has two microchannel plates with 10 m diameter holes in the chevron, and a hole diameter-to-thickness ratio of 1:60. In its nominal basic configuration, the MCP-PMT anode plane is segmented to into 256 micro-pixels, each 3mm2 in size. The individual pixels are connected to a single timing point via equal-time traces on a PC board. This arrangement ensures that the time spread across the anode is limited to (10/) 3 ps. To maximize the signal risetime, the MCP anode structure must be properly bypassed to ground. The operating parameters, such as the MCP internal voltages and its geometry remain to be optimized.
What has been achieved until this point? The Nagoya group test beam results [29] indicate 6.2 ps with a small (11mm diameter) Hamamatsu MCP-PMT R3809U-50-11X with 3 mm thick MCP window, multialkali photocathode and 6 m diameter MCP holes. The tube was coupled to a 10 mm thick quartz radiator, yielding 40 photoelectrons. They used SPC-134 CFD/TAC/ADC electronics, with 4 ps. We have done timing tests with laser diodes. Our overall best result [30] so far, was obtained with a 64-pad MCP-PMT with 10 m diameter holes, operating without an amplifier, and with no CFD, i.e., the MCP-PMT pulses were directly viewed on an oscilloscope. The laser-induced spot size of less than 1 mm2 diameter produced a point-response timing resolution of 8-9 ps. This result was obtained using the “histogram option” on Tektronix TDS-5104 digital oscilloscope after subtracting trigger jitter contributions, determined in a separate run with a precision pulser. Results with a 25 ps/count TDC and with an amplifier and CFD, shown in Fig. 31, yielded slightly worse results.
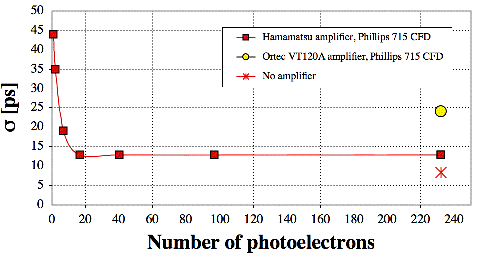
The detailed timing strategy must be simulated to find an optimum scheme. We are leaning towards an option either no amplifier at all, or amplification by a factor of only 5 to 10. In all tests thus far, the use of amplifier signals yielded worse results compared to MCP direct signals. However, realizing that there will be a variation in the leading edge slope as a function of the number of photoelectrons and due to gain fluctuations, we are considering either a double-threshold, or a time-over-threshold timing strategy, located at each detector. To achieve our timing resolution goal, we require a TDC resolution of at least 12 ps/count. This requires a new development. We may consider, for example, some simplified version of a new ASIC-based TAC being developed at the University of Chicago, which aims for a 1 ps resolution [31]. It is important to have a second event-processing capability within 100ns of the recovery of the MCP-PMT from saturation, Tas well as a digital pipline.
Many possible degradation factors influence a high-resolution TOF counter in a typical collider environment: (a) detector design, (b) start time resolution, (c) detector signal timing strategy, (d) cross-talk and charge sharing between anode pixels, (e) TDC resolution, (f) tracking errors, (g) magnetic field effects on the gain of the detector, (h) thermal drifts, (i) hermeticity of the radiator and detectors, (j) variation of the number of photoelectrons near edges, etc. For example, the start time is a crucial issue in the proposed TOF system. We propose to use the accelerator RF pulse, which will be distributed to the start TAC located on each MCP-PMT. This start time is then corrected by tracking and vertexing information. The calibration of the TOF system is crucial to its performance. It must be performed often to keep track of thermal drifts. We plan to use two methods, one based on Bhabha events and the other on an ultra-precision light pulser. At full luminosity, we expect a Bhabha rate of 1kHz. This will allow a calibration precision to a few ps every 10-20 minutes. In addition, we plan to use a low jitter pulser, producing a start pulse and a sequence of randomly sequenced stop pulses with precise time difference intervals of 5ns. These stop pulses will drive a laser diode, with light directed through a fiber to selected MCP-PMTs. We have one such pulser, and we have verified that it is capable of measuring a time interval between start and stop to 7.5 ps. With about 1000 successive calibration pulses covering 10 sequential delays, we can track changes in the mean to the few picosecond level. To do that, however, pulsers have to be in thermal equilibrium, i.e., they must run into a dummy load for at least 30 minutes prior to calibration.
The magnetic field causes a loss of MCP gain, that depends on the firld sgtrength and the angle between the normal to the MCP face and the field axis [30]. The loss of gain must be compensated by adjusting the high voltage. Our tests indicate that the present Burle tube with 10 m diameter holes cannot be rotated by more than 10-15 .
MCP-PMT aging is an important issue. The main effect of aging is damage of the photocathode by the ion backflow; gain loss is thought to be much less significant. The ions are created from residual hydrogen gas contamination left in the MCP glass by the reduction process. There are three methods presently considered to reduce photocathode damage: (a) a thin film placed on top of the MCP surface, which blocks ions but allows the electron transfer, (b) adding three MCP plates instead of the usual two, or (c) better vacuum scrubbing of the residual hydrogen. Recent tests by Burle/Photonis indicate that the vacuum scrubbing technology has improved enough that only a 5% degradation of the photocathode QE has been observed even after a total charge dose limit of 16 C/tube with a simple double MCP structure without the protecting film. This represents a total single photoelectron dose of 1013 per cm2 (assuming a total gain of 3x10⁵), which is 5-10 years of the Super expected total dose. If the Burle tests can be reproduced in our lab, we may decide to use the simple double MCP structure, which would reduce the cost and improve the MCP efficiency, compared to the thin film technology.
4 Summary of Requirements
Experience with existing Factories at CESR; PEP-II, and KEKB have demonstrated the value of high quality PID. High efficiencies for “wanted” particles and low misidentification rates for “unwanted” particles are both crucial. However, the capability to reach low misidentification rates is especially important when low rate “rare processes” are under study, as will be the case at Super. A positive signal for all particles (such as provided by imaging Cherenkov counters, coupled with over the entire range of momentum) is crucial for reaching the required efficiencies and levels of misidentification. Modest upgrades to the barrel BABAR DIRC and systems, to cope with the higher data taking rates, and to provide more headroom against backgrounds, appear to meet the minimal requirements for the barrel region. Further upgrades to the DIRC improve performance at higher cost. A forward endcap is included in the proposed detector to improve PID hermiticity, which should be especially beneficial for recoil physics.
7 Electromagnetic Calorimeter
1 Introduction
The Super electromagnetic calorimeter (EMC) is a cylindrically symmetric array of scintillating crystals that measure the energy and direction of electrons and photons, the direction of neutral hadrons such as , and discriminate between electrons and charged hadrons. The Super EMC uses the barrel portion of the BABAR EMC, consisting of 5760 CsI(Tl) crystals, shown in Fig. 32. The forward endcap will be rebuilt using a faster and more radiation resistant scintillating crystal, such as L(Y)SO. An optional backwards endcap calorimeter is also discussed.
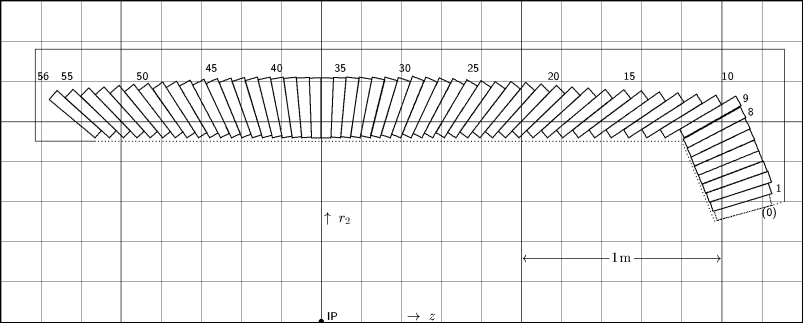
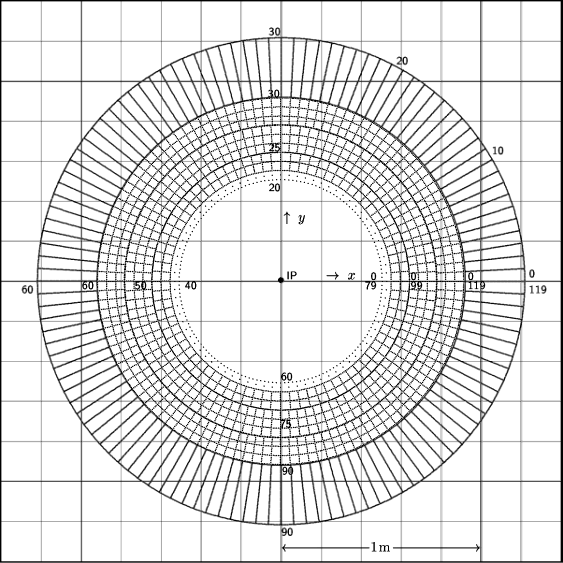
Many general purpose detectors have over the last three decade incorporated high quality crystal calorimeters. Table 3 compares the parameters of a selection of these calorimeters. Several different types of crystals, having different light output, radiation length,scintillation decay time and radiation hardness, have been used in these detectors. Table 4 compares some of the salient characteristics of the most widely used crystals.
| Experiment | L3 | CLEO II | BABAR | Belle | KTeV | CMS |
|---|---|---|---|---|---|---|
| Crystal Type | BGO | CsI(Tl) | CsI(Tl) | CsI(Tl) | Pure CsI | PbWO4 |
| Inner Radius (m) | 0.55 | 1.0 | 1.0 | 1.25 | N/A | 1.29 |
| # of Crystals | 11400 | 7800 | 6580 | 8800 | 3300 | 76000 |
| Crystal Length () | 22 | 16 | 16-17.5 | 16.2 | 27 | 25 |
| Photosensor | Si PD | Si PD | Si PD | Si PD | PMT | APD |
| Energy Resolution (1GeV) | 2-3% | 2-3% | 2.7% | 2.5% | 2% | 12% |
| Noise (MeV) | 0.8 | 0.5 | 0.15 | 0.2 | 1 | 40 |
| Dynamic Range |
| Crystal Type | NaI | BGO | CsI(Tl) | Pure CsI | PbWO4 | LSO |
|---|---|---|---|---|---|---|
| Density (g/cm3) | 3.67 | 7.13 | 4.51 | 4.51 | 8.3 | 7.40 |
| Radiation Length (cm) | 2.59 | 1.12 | 1.86 | 1.86 | 0.89 | 1.14 |
| Moliere Radius (cm) | 4.13 | 2.23 | 3.57 | 3.57 | 2.00 | 2.07 |
| Interaction Length (cm) | 42.9 | 22.8 | 39.3 | 39.3 | 20.7 | 20.9 |
| Hygroscopic | Yes | No | Slight | Slight | No | No |
| Peak Luminescence (nm) | 410 | 480 | 550 | 420/310 | 425/420 | 402 |
| Decay Time (ns) | 230 | 300 | 1250 | 35/6 | 30/10 | 40 |
| Light Yield (%) | 100 | 21 | 165 | 3.6/1.1 | 0.3/0.08 | 83 |
| d(LY)/dT (%/degC) | 0 | -1.6 | 0.3 | -0.6 | -1.9 | 0 |
| Radiation Damage | Yes | 20%/krad | 10%/krad | 2%/krad | Small | Small |
| Thermal annealing | Yes | Yes | Slow | Slow | Yes | Yes? |
2 Performance
A summary of the performance of the BABAR calorimeter can be found in reference [32]. The energy and position resolution for photons is shown in Fig. 33, and they are parametrised by:
The mass resolution is 6.5 MeV for energies above 300 MeV. The mass peaks for and mesons are shown in Fig. 34. The resolution functions for the mass and energy have tails on the low side which are well-described by a Crystal Ball function [33].
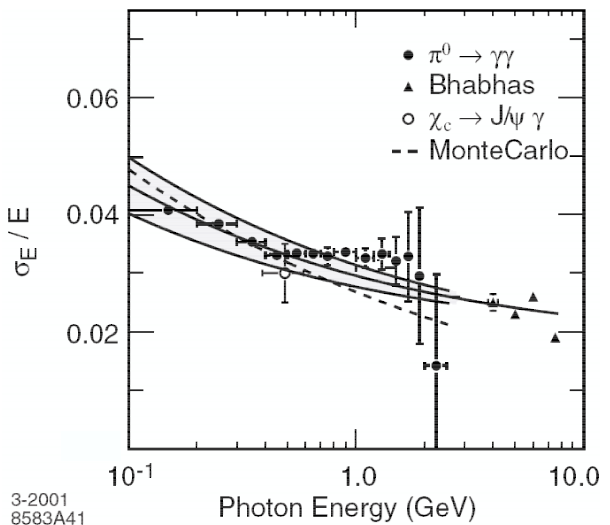
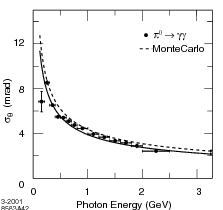
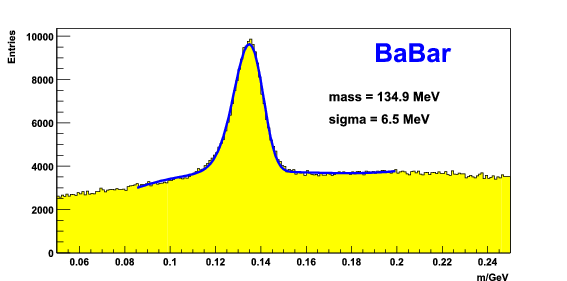
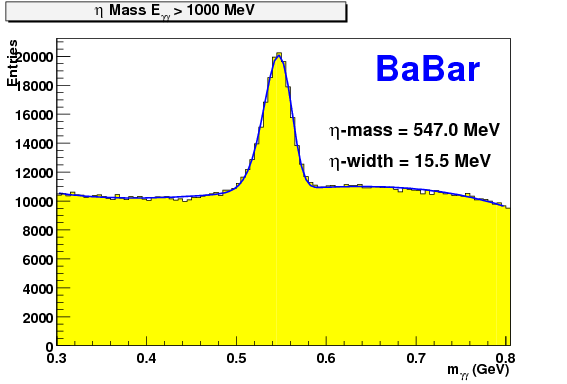
The Belle calorimeter has a marginally better performance than BABAR, with a mass resolution of 5-6 MeV in the energy range 100MeV-1GeV [34]. The main differences between the two calorimeters are that the Belle CsI(Tl) crystals are further from the interaction point, that they have a longer shaping time, and do not use waveform digitization for the readout electronics.
The electromagnetic calorimeter, the key detector for electron identification, uses a combination of , track-shower matching, and shower shape information to achieve an identification efficiency of 94% for electrons above 700 MeV, with misidentification rates of order 0.1%. There is also useful information for muon identification from the minimum ionizing energy deposit and the shower shape. About half of all interact in the CsI(Tl) crystals yielding a position measurement, but little energy information.
Combinatorial backgrounds are large for low energy s; many analyses therefore limit themselves to energies above 300MeV. In BABAR, this background arises mostly from the rest of the event, with only a small component from beam backgrounds. It is difficult to see how to improve this background at Super, but it is important not to make it significantly worse.
The angular coverage for reconstructing good photons in BABAR is 82%, with most of the loss in the forward direction. After applying shower quality cuts and defining a mass window, the reconstruction efficiency for s is about 60%. Reconstruction of decays with one is quite efficient, but the efficiency falls off rapidly as more s are added. The efficiency for reconstruction, which is critical for -tagged analyses, can be improved by increasing the solid angle coverage for photons detection. Part of this improvement will come from the reduction in the boost of the ; further improvement is possible if good photon identification can be added in the backward endcap region.
Improvements in EMC solid angle coverage benefit other analyses as well. In particular, better hermeticity improves the quality of neutrino reconstruction, and the ability to veto background events on the the through the detection of excess neutral energy is crucial to studies of .
3 Effect of dead material
The BABAR barrel crystals are separated from each other by 350 of wrapping material (Tyvek, Al foil and mylar), and by up to 750 of carbon-fiber mechanical support structure. This dead material between the crystals consumes 1% of the solid angle in . It has less effect in , because the crystal boundaries do not point towards the interaction region. The dead material leads to a tail in the shower energy response which has been studied with events. For 500 MeV photons an energy loss of 2% is observed near the edges of the crystals, consistent with the expectation from Monte Carlo simulation. When this effect is calibrated out the photon energy resolution improves by 10%.
Since the solid angle loss is small, and the edge effects can be calibrated out, there does not seem to be a strong argument for reducing the dead material between the crystals. This would require the disassembly and reassembly of the barrel modules down to individual crystals, which would be a significant amount of work.
The DIRC bar thickness is 19% of a radiation length at normal incidence, and 30% of a radiation length at the forward and backward ends of the barrel. The effect of photon conversions in the DIRC has been studied by identifying Cherenkov photons in the DIRC associated with neutral energy deposits in the calorimeter. For 10% of all 500 MeV photons more than 15 Cherenkov photons are found, with a smooth distribution extending up to a maximum of 100 Cherenkov photons. Below 15 photons it becomes difficult to identify the conversions. For the identified conversions, an energy loss of 0.5 MeV/Cherenkov photon is observed; this is the leading factor in the tails of the photon energy response function. No satisfactory method has been devised to correct for this tail, but it is possible to veto identified conversions, reducing the tail of the response function significantly, at the expense of a 10% loss in efficiency.
In the forward region, the 12 mm aluminium endplate of the current BABAR drift chamber places an average of 15% of a radiation length in front of the forward endcap. In the backward region this increases to 30%, and the effect of the drift chamber readout electronics and cables should also be included. If a backward endcap calorimeter were to be added, it would be necessary to redistribute the dead material more equally between the ends of the drift chamber, and to reduce the thickness in radiation lengths of the readout electronics as far as possible.
An option to add particle identification in the forward and backward regions is being considered. This will add dead material on top of that from the drift chamber; the amount depends on the choice of technology and the position of the photodetectors. In some cases it may be possible to use these PID devices as active preshower detectors in the same way as the DIRC. The balance between improving PID coverage and reducing the performance of the endcap calorimetry requires further detailed physics studies.
4 Backgrounds
Calorimeter backgrounds arising from accelerator beam- and luminosity-related effects impact calorimeter performance in several ways. The most direct impact is the deposition of energy in calorimeter crystals which exceeds the effective threshold for reconstruction of a cluster, or for inclusion of the crystal energy into an adjacent cluster arising from physics sources. In the first case, the result is the production of spurious neutral clusters, which degrade the resolution of “inclusive” energy reconstruction (such as for /missing energy measurements) and increase the combinatorial background in reconstruction. In the second case, the resulting increased crystal occupancy degrades cluster energy resolution and can negatively impact cluster reconstruction performance. Less direct, but no less important, impacts are performance degradation due to cumulative radiation damage, and data acquisition issues due to high calorimeter occupancy.
In the BABAR and Belle experiments, the main contributions to calorimeter backgrounds arise from single-beam lost-particle sources and from small angle radiative Bhabha events. In both cases, a high-energy primary or strikes a beamline element within a few meters of the IP and shower secondaries with energies ranging from sub-MeV to several tens of MeV reach the calorimeter. Calorimeter backgrounds resulting from MeV-energy neutron production via the giant dipole resonance has also been seen in BABAR, in both simulation and data. Neutron production appears to be mainly associated with luminosity or single-beam sources in which the primary electron or positron strikes the upstream or downstream septum chambers in the vicinity of the Q2 magnets (about 2.5m from the IP). Sub-MeV neutrons then propagate into the detector and produce a delayed response with a rate that scales as where is the distance from the production source. Touschek scattering backgrounds have also been demonstrated by Belle, but not BABAR, and are expected to be potentially significant in at Super, due to the short Touschek lifetime of the beams. These backgrounds have not as yet been simulated, since they depend on the details of the accelerator lattice design. They are, however, expected to behave in a manner similar to lost-particle bremsstrahlung events. The impact of all of these sources can be minimized by appropriate design of the accelerator final-focus region and IR apertures.
The primary concern for the calorimeter is the rate of small angle radiative Bhabha events, which already dominates at BABAR, and since it obviously scales with luminosity, is potentially much worse at Super. The absence of dipole magnets near the IP in Super is expected to dramatically improve the situation compared with naive scaling of BABAR background rates. The initial lattice design has not, however, yet been optimized to reduce this background source. Simulations using both simple ray-tracing (Magbends) and full GEANT4 simulation of magnetic fields and particle interactions indicate that the current IR layout results in a larger fraction of radiative Bhabha events depositing energy near the IP than the present BABAR/PEP-II layout. Full GEANT4 simulation of radiative Bhabha events indicates that, in the absence of shielding, the calorimeter background would be dominated by MeV EM shower debris with an energy flux rate peaking at approximately 20 MeV/s per (CsI(Tl)) crystal in the forward barrel region of the calorimeter. A relatively weak dependence of the background rates is observed, with the highest flux rate observed in the horizontal plane in the positive direction. Lower energy fluxes of at most - MeV/s per crystal are predicted in the forward and backward endcap regions. The resulting occupancy rates and radiation doses are not anticipated to be problematic for L(Y)SO or pure CsI crystals, which have considerably faster response time, are more radiation hard and, in the case of L(Y)SO, permit finer segmentation than CsI(Tl). Background rates in the forward barrel are, however, potentially problematic. With a decay time (for the slow component) of ns, CsI(Tl) crystal performance would be significantly degraded in the presence of a flux rate of much more than MeV/s. With additional shielding added to the simulation, energy flux rates are significantly reduced, with rates peaking at MeV/s per crystal. It should be noted that, since optimization of the IR magnets, apertures and shielding to minimize backgrounds has not yet been completed, these estimates are believed to be quite conservative. It will, however, be imperative to perform additional simulation studies as part of the ongoing design effort, using an optimized IR and detector layout (including luminosity, Touschek and single-beam lost-particle sources), in order to verify that calorimeter background rates are acceptable.
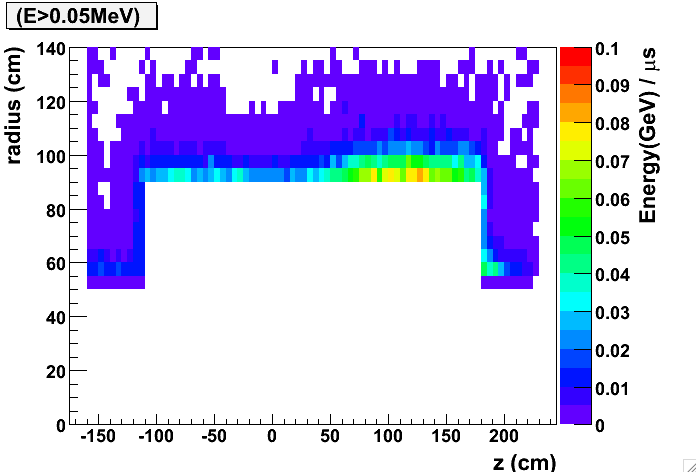
5 Radiation damage
Radiation damage impacts CsI(Tl) through the creation of color centers in the crystals, resulting in a degradation of response uniformity and light yield. The nominal dose budget for the BABAR CsI(Tl) calorimeter is 10krad over the lifetime of the detector. Pure CsI and L(Y)SO are considerably more radiation hard (see Table 4). The dominant contribution to the dose arises from luminosity and single-beam background sources, and hence is due to MeV-level photons and (presumably) neutrons; the integrated dose scales approximately linearly with integrated luminosity. The measured reduction of light yield due to radiation damage is shown as a function of integrated luminosity in Fig. 36. To date, a total dose of about 1.2krad has been received in the most heavily irradiated regions, resulting in a loss of about of the total light yield, but with no measurable impact on physics performance. It is notable that most of the observed light loss occurred relatively early in BABAR running, although radiation dose has been accummulating relatively steadily, and that crystals from different manufacturers have responded somewhat differently to irradiation. It is anticipated that the CsI(Tl) barrel will have accumulated approximately 1.5krad in the most irradiated regions by the end of nominal BABAR running in 2008. In order for the barrel calorimeter to function in the Super environment, beam background rates must be maintained at a level of approximately 1 MeVs or less per CsI(Tl) crystal. If this condition is achieved, then radiation dose rates are anticipated to be roughly comparable to current BABAR levels. A dose budget of well under 1 krad/year is expected to be achievable. At this a level, the CsI(Tl) barrel would survive for the duration of Super operations. This assumption will, however, need to be verified by detailed simulation.
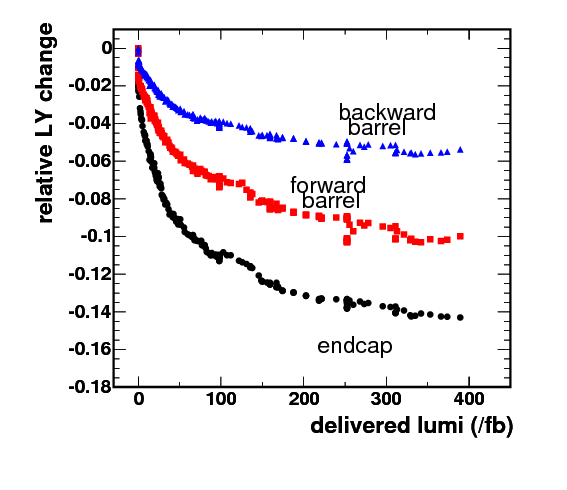
6 Barrel calorimeter
The CsI(Tl) crystals used in the barrel calorimeters of both BABAR and Belle are the most expensive elements of the two detectors. Based on the performance that has been achieved, and the radiation damage that has been observed so far, both collaborations have concluded that the re-use of the barrel crystals is possible at a Super Factory.
The baseline assumption is that the geometry of the crystals is unchanged from that of the current BABAR detector. The one change that should be made is to move the position of the interaction point from -5cm to +5cm relative to the position of the crystal gap normal to the beam axis. This adjustment retains the current non-pointing geometry, but moves the barrel to a slightly more symmetric position, in view of the reduced energy asymmetry. The effect of the change in boost from to 0.28 and the shift of the IP is to increase the angular coverage of the barrel from 79.5% ( to ) to 84.1% ( to ).
If the crystal geometry is unchanged, it is possible to transport the entire barrel calorimeter as one cylinder. Alternatively it could be disassembled into its 280 individual modules, which would be transported separately and reassembled on arrival. It would only be necessary to disassemble the modules themselves if changes were being made to the material between the crystals, or to the photodiode readout. The costs of these alternatives are discussed in the chapter on the re-use of existing BABAR detector elements.
A possible change to improve the coverage in the backward region would be to add one or two additional rings of crystals to the last module ring in , which currently only contains 6 rings of crystals. However, this would lead to major changes in the mechanical support structure and a redesign of the electronics readout, so it will not be undertaken unless there is a significant gain from the extra ring(s). Changes to the rear sectionof the barrel also clearly interact strongly with the possible addition of a backward endcap calorimeter (see below).
7 Forward endcap calorimeter
In contrast to the barrel EMC, it is desirable to replace the EMC forward endcap, and possible to do so at a comparatively modest cost. In BABAR, the innermost rings of the forward endcap are subject to high radiation doses from both luminosity and single-beam background sources, due to the proximity to the Q2 septum region which acts as a background source. As such, it is expected to have accumulated substantial radiation damage by the end of the nominal BABAR program. Redesign of the forward endcap region also permits the solid angle coverage to be optimized for the SuperB machine and potentially permits space to be freed up, through the use of compact L(Y)SO crystals, for a forward PID device.
The use of cerium-doped silicate crystals (GSO, LSO, LYSO) has been developed for medical imaging. Large crystals of lutetium (yttrium) oxyorthosilicate (L(Y)SO), have been obtained from several vendors and tested for properties important in their use for high energy calorimetry by R.Y. Zhu at Caltech. [35]. The combination of fast decay time (40ns), high light output (50% of CsI(Tl)), and negligible radiation damage, make them an attractive option. These crystals are also non-hygroscopic and mechanically strong, simplifying the design of mounting structures. In recent tests, readout of L(Y)SO crystals with APDs has been demonstrated with a signal of 1500/MeV and readout noise 40keV.
The forward coverage is limited to 300 mrad by accelerator components in the IR. The effect of the change in boost from to 0.28 and the shift of the IP by +10cm is to decrease the angular coverage of the forward endcap from 9.4% ( to ) to 6.2% ( to ), but also to decrease the loss of solid angle coverage below 300 mrad by a factor of two.
Table 5 shows a possible layout for a forward endcap containing a total of 2520 L(Y)SO crystals with dimensions of approximately 25mm 25mm 200mm. The total volume of this design is 0.36m3, giving a total crystal cost of $5.4M based on existing quotes for large LSO crystals of $15/cc, or $3.6M if we assume a reduction to $10/cc for a bulk order of a large number of crystals. Note that the cost of the L(Y)SO crystals increases by 13% if they are moved back from the front corner of the barrel calorimeter by the maximum available space (125mm), in order to make way for a forward particle identification system.
| Ring in | Radius | Crystal Face | Crystal Volume | # Crystals |
|---|---|---|---|---|
| (mm) | (mm) | (cc) | ||
| 1 | 597-620 | 24.4 31.9 | 171 | 120 |
| 2 | 620-643 | 24.4 33.1 | 178 | 120 |
| 3 | 643-666 | 24.4 29.4 | 158 | 140 |
| 4 | 666-689 | 24.4 30.5 | 164 | 140 |
| 5 | 689-712 | 24.4 27.5 | 148 | 160 |
| 6 | 712-735 | 24.4 28.4 | 152 | 160 |
| 7 | 735-758 | 24.4 26.1 | 140 | 180 |
| 8 | 758-781 | 24.4 26.9 | 144 | 180 |
| 9 | 781-804 | 24.4 24.9 | 134 | 200 |
| 10 | 804-827 | 24.4 25.6 | 137 | 200 |
| 11 | 827-850 | 24.4 23.9 | 128 | 220 |
| 12 | 850-873 | 24.4 24.6 | 132 | 220 |
| 13 | 873-896 | 24.4 23.2 | 125 | 240 |
| 14 | 896-919 | 24.4 23.8 | 128 | 240 |
An alternative choice for the forward endcap is pure CsI. This option has been studied by the Belle collaboration. In this case the geometry of the forward endcap can be kept the same as the existing BABAR endcap, with 820 crystals occupying a volume of 0.71m3 in 8 rings. With an estimated cost of $4/cc for pure CsI, the total crystal cost is $2.7M, which is less than the cost of L(Y)SO, but not by a large factor.
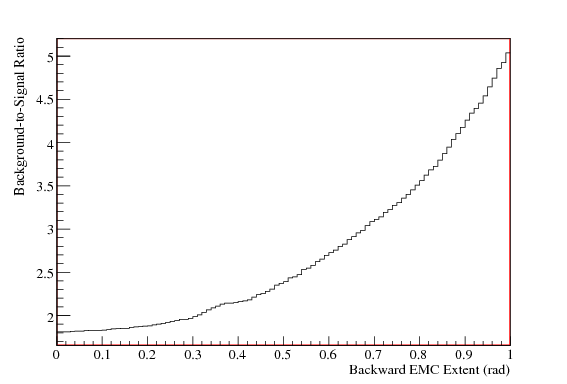
8 Backward region calorimetry
The effect of the change in boost from to 0.28 and the shift of the IP by +10cm is to increase solid angle not covered by the backward barrel from 3.5% to 5.9%, which makes it slightly larger than the region below the forward endcap. Taking account of the 300 mrad stay clear line, a maximum of 4.5% of the total coverage could be recovered by installing a backward endcap calorimeter. However, the presence of the DIRC bars, and the material associated with the DCH endplate and readout, make it very difficult to design an appropriate calorimeter, and the actual gain in coverage is likely to be significantly less than this.
One of the strengths of the Super physics program is the ability to study fully inclusive decays and decay modes containing missing energy (e.g. neutrinos) or single photons (e.g. radiative decays). Hermeticity impacts these channels in two ways: First, reduced hermeticity potentially degrades the resolution of inclusive measurements, such as the hadronic mass spectra in . Second, it degrades the background rejection power in analyses that rely on missing energy or or vetos. It is therefore important to maintain the most hermetic calorimetry possible. The impact of a backward endcap calorimeter on such analyses was studied in the context of Super, using as a benchmark. This analysis relies heavily on the detection of soft neutrals to distinguish the low-multiplicity signal mode from higher-multiplicity backgrounds. “Irreducible” backgrounds arise when one or more particles pass outside of the detector acceptance. Figure 37 shows the background-to-signal ratio in a simulated analysis of as a function of the acceptance in the backward direction. It is seen that the background can be significantly reduced by extending the calorimeter in the backward direction. Since just the presence of any significant energy in this region would indicate that an event is not signal, the energy resolution of the calorimeter is less critical than the angular coverage. Consequently, the backward endcap option is being considered primarily as a “veto” device. The baseline option for this device is a series of L(Y)SO rings of design similar to the forward endcap which would be fitted behind the DCH endplate and electronics and inside the radius of the DIRC bars. It would be desirable to avoid a gap in coverage between the back of the barrel and the backward endcap, but at this time it is not clear whether this can be achieved. Space constraints dictate the use of L(Y)SO rather than pure CsI, due to the smaller radiation length and Molière radius. Dead material associated with the DCH in front of the endcap is expected to degrade the energy resolution of the endcap calorimeter, but not to significantly impact its operation as a veto device. The total amount of material in front, as well as the details of the layout and effective geometrical coverage will depend on the amount of space that can be gained by a redesign of the DCH readout.
8 Instrumented Flux return
The Instrumented Flux Return (IFR) is designed primarily to identify muons, and, in conjunction with the electromagnetic calorimeter, to identify neutral hadrons, such as and neutrons. This section describes the performance requirements and a baseline design for the IFR. The iron yoke of the detector magnet provides the large amount of material needed to absorb hadrons. The yoke is segmented in depth, with large area particle detectors inserted in the gaps between segments, allowing the depth of penetration to be measured. In Fig. 38 we show a schematic view of the BaBar IFR.
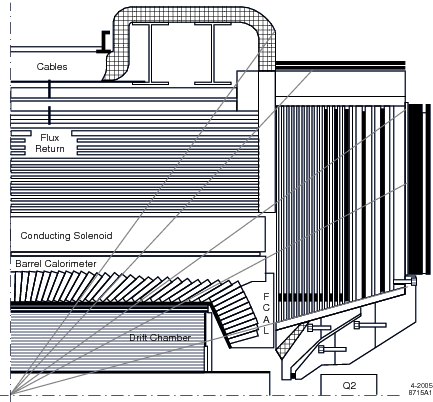
1 Physics Goals
A muon identification system must have reasonably high efficiency for selecting penetrating particles such as muons, while at the same time rejecting charged hadrons (mostly pions and kaons). Such a system is critical in separating signal events in and processes from background events originating from random combinations of the much more copious hadrons. Positive identification of muons with high efficiency is also important in rare decays as , and and in the search for lepton flavour-violating processes such as .
Momentum and polar angle distributions in the laboratory system for several of these channels are shown in Fig. 39. The nominal boost of is assumed. Despite the boost, a muon detector system that is symmetric around the interaction region is a suitable match to the physics goals.
Background suppression in reconstruction of final states with missing energy carried by neutrinos (as in ) can profit from vetoing the presence of energy carried by neutral hadrons. About 45% of relatively high momentum ’s interact only in the BABAR muon system. Some identification capability is therefore required. On the other hand, having a muon system that is hermetic as possible down to small polar angles is problematic. since most of the background is concentrated in the region close to the beamline, thereby limiting the ultimate veto performance.
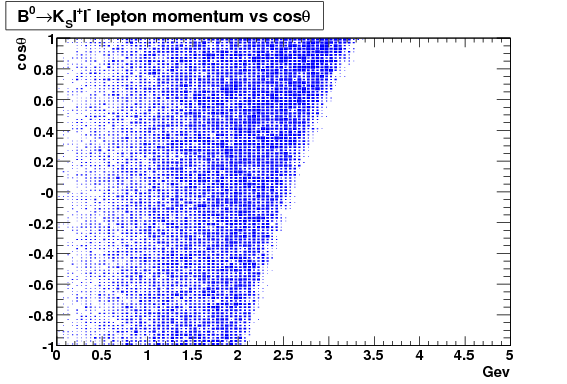
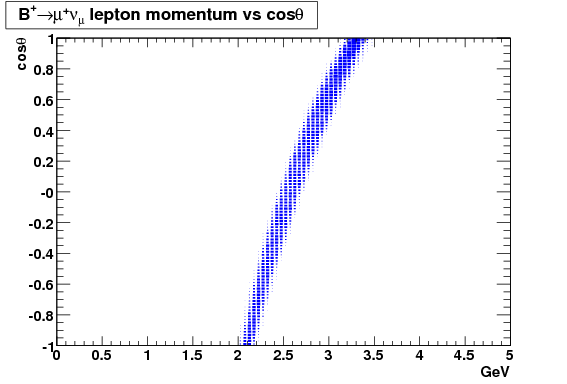
2 Identification Technique
Muons are identified by measuring their penetration depth in an absorber consisting of the iron of the return yoke of the solenoid magnet. Hadrons shower in the iron, which has a hadronic interaction length [36]. The survival probability to a depth scales as ). Fluctuations in shower development and decay in flight of hadrons with muons in the final state are the main source of hadron misidentification as muons. The penetration technique has a reduced efficiency for muons with momentum below 1 , due to ranging out of the charged track in the absorber. Moreover, only muons with a sufficiently high transverse momentum can penetrate the IFR to sufficient depth to be efficiently identified.
Neutral hadrons interact in the electromagnetic calorimeter as well as in the flux return. A tends to interact in the inner section of the absorber. Using the BABAR IFR simulation, we show the distribution of the first layer having signal due to a interaction in Fig.40 for ’s impinging on the barrel sector with a momentum in the range from 0.5 to 4 GeV. A -initiated shower develops, on average, over about 4 layers (events with a single layer hit are not considered). See Fig. 40.
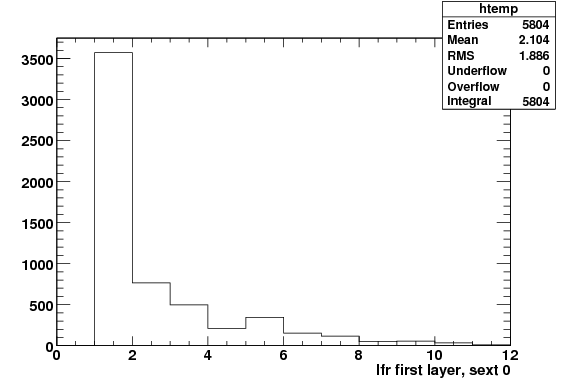
identification capability is therefore mainly dependent on energy deposited in the inner part of the absorber. Best performance can be obtained by combining the initial part of a shower in the electromagnetic calorimeter and with the rear part in the inner portion of the IFR. An active layer between the two subsystems, external to the solenoid, is therefore highly desirable.
3 Baseline Segmentation Design
The total amount of material in the BABAR detector flux return (about 5 interaction length at normal incidence in the barrel region) is suboptimal for identification [37]. Adding iron to the BABAR flux return for the upgrade to the Super detector can produce an increase in the pion rejection rate at a given muon identification efficiency. A possible longitudinal segmentation of the iron is showed in Fig. 41. The three inner detectors are most useful for identification; the coarser segmentation in the following layers preserves the efficiency for low momentum muons. The current BABAR readout segmentation (strip with 3.7 cm pitch) will be retained.
Figure 42, shows the resulting number of interaction lengths as a function of the polar angle traversed by a muon of 5 / momentum in the baseline Super detector. Given the smaller boost, we adopt a nearly symmetric geometry around the interaction point; we thus show only the barrel and the region, ).
The efficiency and misidentification probability for muons and charged pions, respectively, are shown in Table6 for several momenta.
| Loose selection | Very Tight selection | |||
|---|---|---|---|---|
| momentum | eff. | misid. | eff. | misid. |
| 0.8 | 48 | 2.3 | 42 | 1.8 |
| 1 | 66 | 5.4 | 54 | 3.0 |
| 2 | 82 | 2.0 | 74 | 1.3 |
| 5 | 84 | 1.9 | 79 | 1.2 |
4 Technology Choice
The BABAR Technologies: RPC and LST
The BABAR detector uses two technologies in the IFR.
The forward and backward endcaps use Resistive Plate Chambers (RPC’s) with planar bakelite electrodes coated with linseed oil, and a mixture of freon, argon and isobutane gases. The ionization produced along the path of the charged track is internally amplified and the electric signal induced on external copper strips is used to measure the position of the track impact point. The BABAR RPC’s are operated partly in streamer mode and partly in avalanche mode. Avalanche mode is preferred for the forward region around the beamline, where most of the background hits accumulate. To detect the avalanche signal, a preamplification stage is required.
The barrel sector is instrumented with Limited Streamer Tubes (LST), made of several square PVC cells coated with graphite and a center wire at high voltage. The amplified ionization signal generated on the wires and induced on external readout strips is used to measure the position of the crossing track in a given layer.
The BABAR RPC operational experience was initially problematic [38], but the forward endcap RPC’s are still as efficient as they were when originally installed (single detector efficiency is, on average, in excess of 90 % [39]). These chambers were manufactured to a higher standard than the initial chambers. A detailed quality assurance process, along with production improvements such as curing of the linseed oil, were similar to those adopted for the LHC and Opera detectors [38]. These chambers have proven to be quite solid, and if operated in avalanche mode can sustain a rate up to several kHz/cm2 [40]. The BABAR LST operational experience, on the other hand, has never been problematical, but these chambers cannot withstand rates higher than 100 Hz/cm222LST cells are about 1 cm wide, which translates into less than 100 Hz/cm2 and are therefore usable only in regions in which relatively low background rates are expected.
To reestablish the electric field after an avalanche has developed, dark current must flow through the RPC electrodes. Dark currents are therefore a linear function of the rate of avalanches in the gas, each avalanche corresponding to charge of few tens of a pC. This current depletes the charge carriers in the bakelite plates, which lowers the efficiency of the chambers [41]. Adding water to the gas mixture ameliorated this problem. Nevertheless, it has been shown ([42]) that the graphite layer used as an electrical contact to the cathode is damaged after an integrated charge of some hundreds of mC/cm2 is accumulated. This sets the limit of the lifetime of such detectors, which is clearly dependent on the rate to which the chambers are exposed. LST ageing is characterized by the onset of a continuous discharge, caused by the Malter effect, which prevents further operation of the detectors.
The Super Environment
The operation of the RPC’s in BABAR in streamer mode was limited by the maximum rate the chambers can sustain. The LST’s in the barrel have limited rate capability as well. High rates generate high dark currents, lowering the effective electric field across the gap and taking the counters out of their efficient operating regime. Avalanche mode operation for RPC is preferred for the forward region at small polar angles where the background is highest. This background, due to particles from QED processes (i.e., radiative Bhabhas) showering in beamline components, scales with luminosity, is only problematical in the endcap region.
Other sources, such as scattering of beam particles on collimators far from the interaction region, were, in BABAR, reduced to an acceptable level by external shielding of the outer layers of endcap RPC’s. We have estimated these backgrounds in the Super environment with the simulation described in Section 3. In Fig. 43 the () distribution of Geant4 hits in IFR active layers is shown. Active layers are simulated as a 0.2 cm thick layer of RPC gas mixture (freon R134a 73.1%, Ar 22%, isobutane 4.4 % and 0.5 %). Any deposit of energy in these gas layers is considered as a single hit. As expected, the critical regions are the small polar angles sections of the endcaps and the edges of the barrel internal layers, where we estimate that in the hottest regions the rate is a few 100 Hz/cm2.
These rates are too high for gaseous detectors. We have therefore chosen scintillator technology for the Super baseline. If more detailed background studies were to provide convincing evidence that the highest anticipated background rates were in the range of some 100 Hz/cm2, RPC’s in avalanche mode could be considered as an alternative. LST’s cannot sustain even these rates, and therefore the current BABAR LST system cannot be reused.
The effect of spurious hits on muon identification can be dealt with using offline pattern recognition techniques. The precise timing information from RPC’s and plastic scintillator detectors can be used to eliminate background hits, given suitable readout electronics.
MINOS-type Scintillator Design
While the BABAR experience with both RPC’s [39] and LST’s has been, in the end, positive, detectors with high rate characteristics are required in the high background regions of Super. since a scintillator-based system provides much higher rate capability than the gaseous detectors; it can sustain machine backgrounds much higher than what is foreseen by the current simulation. For this reason, the baseline technology choice for the Super detector is extruded plastic scintillator using WLS fiber read out with a pixelated APD. The basic scintillator bar design is similar to the active detector of the MINOS experiment [43]).
These detectors are straightforward to operate, as no high voltage or flammable gases are employed, do not have substantial ageing problems, and can sustain high rates. Production techniques, including characterization of scintillator bar and WLS fiber quality ,are well-established. Further optimization of the pixelated APD system and the associated data acquisition system is required.
When the upgrade of the barrel IFR was under consideration in 2002, both LST and MINOS-type scintillator designs were developed. The LST option was chosen for the upgrade; the scintillator design, however, is a close match to the requirements of the Super environment. We will briefly describe this scintillator system [44].
The basic detector building block is a bar of inexpensive polystyrene scintillator, with PPO and POPOP doping, coextruded with a TiO2 diffuse reflective coating, shown in Fig. 44. The bars, up to 4 meters in length, are read out by 1.2 mm diameter multiclad wavelength-shifting fibers (Kuraray Y11-175), viewed at both ends by a device such as a 64 channel RMD A6403 silicon avalanche photodiode (APD) [45]. Figure 44 shows the MINOS bar dimensions and a single fiber readout. Designs with different bar dimensions and shapes, as well as multi-fiber readout, were explored in the context of the BABAR upgrade; it is likely that a more conservative two fiber readout design would be the choice. The coordinate along the bar is provided by the time difference in the signals from both ends of the fibers, with a resolution of better than 15 cm, which is adequate.
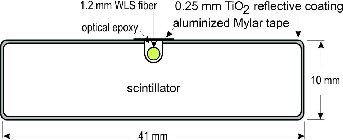
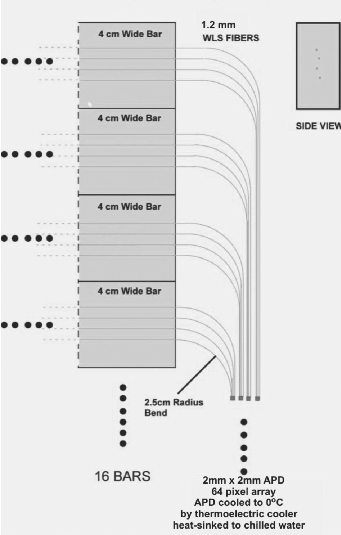
The bars will be assembled in groups of 16 by gluing into aluminum support structures, each read out by a single pixelated 64 channel APD device (see Fig. 45). These box structures are of uniform length in the barrel section; for the endcap region, a variety of different length bars and boxes must be produced. The noise performance of the APD’s improves when they are cooled to temperatures around C, which can be done with a Peltier effect cooler, heat-sinked to a cooling water loop. Dry nitrogen will be circulated within the support boxes to prevent condensation.
The readout electronics must provide time and pulse height for each APD channel, which can be done in a straightforward way using electronics similar to that used in the DIRC system.
9 Electronics
The conceptual design of the read-out electronics for the Superdetector is based on the design used for BABAR. However, almost all of the electronics will be new for the Superdetector, to accomodate the greatly increased event rate. The conceptual layout is as follows. Frontend analog-digital boards shape, amplify and digitize the detector signals. Some digital signals are ultimately sent to the trigger system, described in Section 10. All digital information is pipelined to allow for the trigger decision latency of roughly . Upon receipt of a level one trigger, data is written to a multi-event buffer to reduce dead-time.
Next data is transmitted serially to read-out interface boards, which further sparsify the data. These boards will contain FPGAs with integrated processors, allowing flexibility in the algorithms used. Serial data is then sent to input/output boards for transmission over fiber links to the DAQ’s cluster box, also described in Section 10.
1 SVT Electronics
The design of the SVT readout electronics is intimately connected with that of the silicon sensors, and is therefore discussed in Section 4.
2 DCH Electronics
A block diagram of the electronics system for the DCH is shown in Fig. 46. For the DCH, the analog-digital board (ADB) consists of an amplifier ASIC and a combined TDC/ADC ASIC (a replacement for the ELEPHANT chip in BABAR). If designed now, the ASICs would use a micron TSMC process. Individual ADB boards could serve up to 64 channels per board, depending on the DCH super-layer. The output of the ADB board is sent to a read-out interface board (RI), which uses an FPGA with integrated processor to sparsify the data, and to sum the signals from the ADC for the ionization from each DCH sense wire. Data for the trigger is through dedicated trigger input/output cards, while the full readout data is sent via input/output cards. The input/output cards contain the fiber links to the DAQ and Trigger systems.

3 DIRC Electronics Upgrade
The BABAR DIRC frontend electronics (FEE) design is briefly discussed in the PID portion of the detector section, and is shown schematically in Fig. 47.
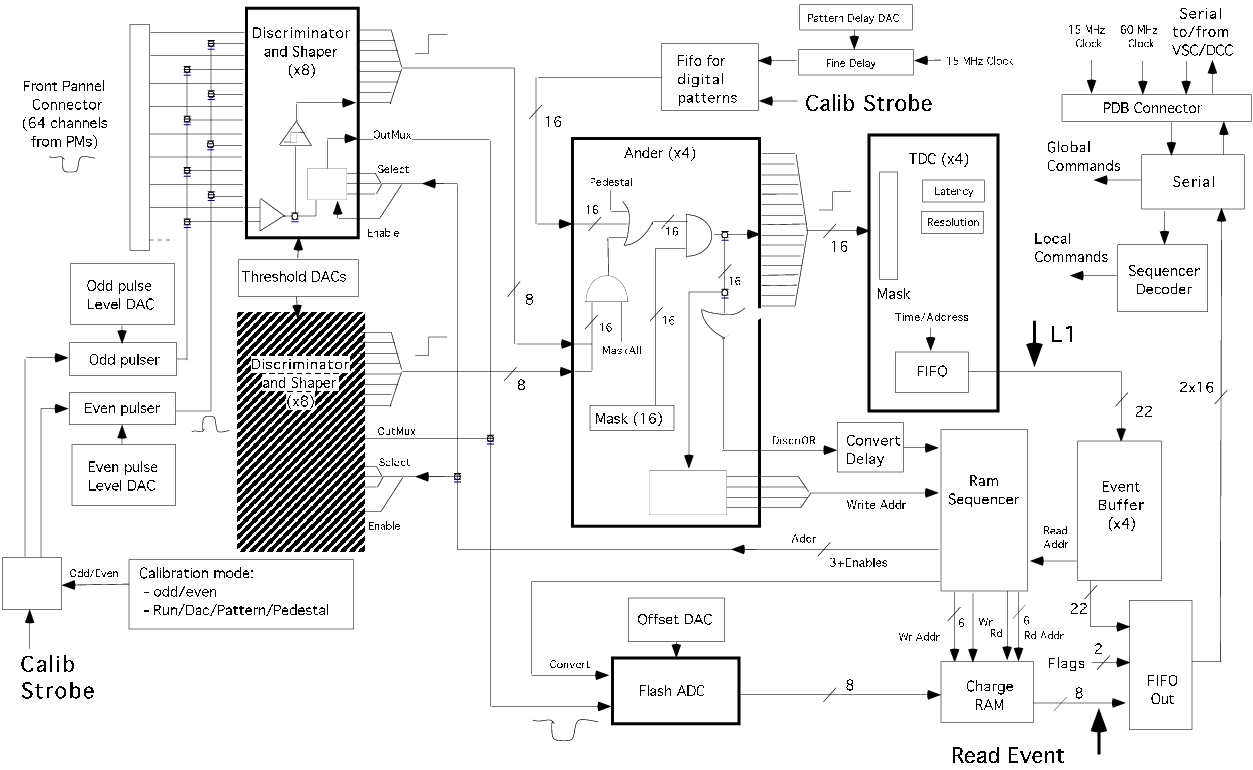
The electronics upgrade assumed here will use similar design principles, but is enhanced to cope with random background rates of up to 10/PMT with less than 1% dead time, while utilizing the timing resolution capabilities of much faster PMTs (with = 0.25-0.5) that will be employed. The design will keep the same pipelined L1 trigger latency of 12s. The frontend board’s ICs and the PCB layout will have to be modified to accommodate the higher throughput rates, however, without major functional changes in the architecture. The DAQ maximum event rate will be upgraded from the present 10 to 100, which means that the 1.2 G-link will need to be upgraded.
Presently, we assume that we will be able to keep the same VME crates, the CAEN high voltage power supplies and cables, as well as the calibration system. However a careful inspection of all components taken from BABAR will be required to verify that this is warranted.
4 EMC Electronics
Next a block diagram of the electronics system for the EMC is shown in Fig. 48. Here preamplifier cards, located at each crystal, shape and amplify the signals. Analog signals are sent to an analog-digital board (ADB) located on the detector. The ADB board contains an ASIC to auto-range the signal (a replacement for the CARE chip in BABAR) and an integrated 4 MHz ADC. Again, if designed now the ASICs would use micron TSMC process. The ADB boards will contain the level one trigger latency pipeline, and a triggered data buffer. To reduce the data volume, the ADB boards will also use an FPGA with integrated processor to determine the energy and time for each crystal. Thus only sparsified data will be sent to input/output boards. From the input/output boards, serial data will be sent over fiber links to the DAQ.

5 IFR Electronics
The MINOS-type scintillator system chosen as the Super baseline for the IFR has no counterpart in the BABAR detector. The APD readout is likely to be a 64 channel device, such as the RMD A6403 [45]. Operated at a gain of 1000, this device would provide a signal of electrons with two fibers per bar, each read out at both ends. After a simple preamplifier stage, the data acquisition system, which must provide amplitude and time information, can be very similar to the upgraded DIRC system discussed above, except that the trigger functionality is not required.
10 Trigger and DAQ
1 Introduction
The BABAR and Belle experiments both chose to use “open triggers”, attempting to preserve nearly 100% of events of all topologies, and a very large fraction of and events. This choice has facilitated the very broad physics program of these experiments. A cost of this approach is that it is quite difficult to separate these events reliably from the () continuum and from higher-mass two-photon physics, resulting in a large cross-section of events logged and reconstructed.
The physics program envisioned for the Super experiment depends on continuing this strategy, despite the resulting two order of magnitude increase in data rate. Very high efficiency for a wide variety of events is of great importance in carrying out recoil-based analyses and in looking for the charmless decays that are central to the understanding of transitions and the angle . Few classes of decays important to the physics program can provide the kinds of clear signatures that would allow the construction of a specific trigger for them.
The trigger and online designs presented here, therefore, focus on the ability to deliver near-100% efficiency and minimal deadtime.
The accelerator design, in which beam currents are comparable to those in the current -factories while the luminosity is 100 times higher, results in an event rate dominated by luminosity-driven processes. A detector of the design envisioned here will have a cross section for Bhabha events that produce detectable signals of approximately 50 nb. This guarantees a minimum event rate in the detector of 50 kHz, due solely to this process. -channel physics processes, including , will contribute approximately 5 kHz more.
It has not yet been possible to do a detailed background simulation for the present design. In addition, no satisfactory generic two-photon simulation for these energies is presently available (even for BABAR itself). This makes bottom-up estimates of interaction rates quite difficult. In lieu of this, our rate estimates are based on simple scaling arguments from the current BABAR Level 1 trigger behavior.
Event Size Estimation
In recent BABAR running, average event sizes are in the vicinity of 35kB, a number which has grown only slightly since the beginning of of the experiment.
Compared to BABAR, the Super detector described herein will likely have similar channel counts and similar amounts of data per hit in the barrel PID, EMC, and muon detection system. The use of smaller cells in the drift chamber could lead to an increase in the number of wires. The design of the innermost layer(s) of the silicon tracking system is not yet final. The use of either striplets or, a fortiori, MAPS pixel detectors could greatly increase the number of channels.
In any event, a significant change in the portion of the event size due to physics tracks is not foreseen. The bulk of the BABAR and Super event sizes are, of course, due to background occupancy, and no detailed analysis of this has yet been possible. As a result, we rely on naive estimates of these backgrounds.
For the purposes of this chapter, we assume an increase in the event size to 75kB. Should this turn out to be an underestimate, we believe that the design presented below would scale linearly with an additional factor of two in event size; beyond that might require the use of a hierarchical event building network, and would significantly increase the cost.
2 Trigger Algorithms and Implementation
Trigger Levels and Functional Requirements
The trigger system consists of the following components:
-
•
A “Level 1” trigger that receives a continuous data stream from the detector independently of the event readout, is fully pipelined to minimize dead time, and that can deliver readout decisions with the latency required by the finite depth of the frontend buffers. We expect this trigger to be a “hardware-like” system using FPGAs as specialized processors, operating with a reduced version of the data from the tracking and calorimeter systems.
-
•
A software “Level 3” trigger that runs on a commodity computer farm and can base its decision on a specialized fast reconstruction of complete events.
-
•
An offline “Level 4” trigger stage that is out of the “deadtime loop” may also be used to reduce the volume of permanently recorded data. This is not part of the existing BABAR architecture. (In BABAR an offline filter is used to reduce the number of events fully reconstructed and skimmed for physics analysis.)
Note: While we do not explicitly foresee a “Level 2” trigger that acts on partial event information in the data path, the data acquisition system architecture would allow the addition of such a trigger stage at a later time, hence the nomenclature.
Level 1 Trigger architecture
The BABAR Level 1 trigger relies on data from the drift chamber and calorimeter. The trigger receives data at 4 MHz from the detector systems, and evaluates “trigger primitives” – essentially, tracks and clusters meeting various sets of criteria – independently in each time slice. Interpolation in time allows the drift chamber primitives to be computed at 8 MHz.
The primitives are transmitted to the global trigger logic, which is able to combine them and form trigger decisions based on specified predicates, including spatial correlations between the drift chamber and calorimeter primitives. Up to 24 parallel trigger decision candidates are evaluated in each time slice, and an overall trigger decision is then generated by taking into account the time resolution of each of the decision predicates and their “priority”, a measure of their reliability and importance to achieving the desired trigger performance.
The current drift chamber trigger uses information from both axial and stereo layers of the chamber, and performs a simple helix fit, using coarse-grained timing to improve the fit over the use of hit-cell information alone.
The drift trigger primitives represent observations of tracks with a variety of constraints on their position and momentum. The three-dimensional track fit thus provides a powerful means of identifying, and ignoring in the trigger, those tracks which arise from interactions away from the luminous region, such as beam particles striking elements of the accelerator or detector structure.
The calorimeter trigger divides the barrel into 280 towers (7 40 in ), and the forward endcap into 40 slices in . Trigger primitives are formed by applying several levels of minimum energy requirements to the tower energies, ranging from one which represents the energy deposition expected from a minimum-ionizing particle, to primitives sensitive only to high-energy photons or electrons from Bhabha scattering. Calorimeter trigger primitives are computed from overlapping pairs of towers in to avoid splitting clusters.
Level 1 Concept for Super
We believe that the existing conceptual architecture of the BABAR trigger will remain suitable for use in Super, with minor variations.
An increase in the sampling rate for the drift chamber signals would provide an improvement in the position and momentum resolution of the helix fit, and allow a narrower definition of the luminous region, reducing the effects of detector background.
If the drift chamber cell size were to be reduced, it might be necessary to increase the number of cells included in the logic for each superlayer segment, in order to preserve the track-finding efficiency at low transverse momenta. (In BABAR, eight cells, centered around a single pivot, are used to construct each segment).
It would also be desirable to increase the segmentation of the calorimeter in the direction, reducing the impact of overlapping energy deposits, allowing more sophisticated topological triggers to be constructed, and improving the ability of the trigger to associate tracks and clusters. This will require logic that avoids cluster-splitting in to be added to the design, in addition to the present overlapping logic in .
Should the forward endcap calorimeter be constructed from LSO crystals with shorter decay times, it will be necessary to increase the sampling rate of the calorimeter trigger accordingly.
The use of 2.5GBit/s fiber links to bring subsystem data to the trigger (a technology foreseen for the DAQ system as well) and the increased complexity of logic supported by current-generation FPGAs, should allow the Level 1 trigger to be considerably more compact than it was in BABAR. The ability to bring a larger fraction of the subsystem data into a single device will also allow more complex algorithms to be applied to the data without bandwidth limits from inter-device connections.
Level 1 Rates
The existing BABAR Level 1 physics configuration produces a trigger rate of approximately 3 kHz at a luminosity of . Changes in background conditions can produce large variations in this rate. The present DAQ system performs well, with little deadtime, up to rates of approximately 4.5 kHz, and continues to be upgraded. This headroom is very useful in maintaining stable operation. It may be possible to reach 7 kHz with improvements currently in progress.
Since no detailed background simulation for Super is yet available, we are limited to fairly crude estimation of the capabilities of a hardware trigger in this environment.
The present BABAR offline physics filter’s output corresponds to a cross-section of approximately 20 . This filter includes a highly efficient Bhabha veto. We take this as an irreducible baseline for any open hardware trigger design; in fact this is fairly optimistic since the offline filter uses results from full event reconstruction.
The present BABAR Level 1 trigger rate of 3 kHz, then, includes 200 Hz from this source and a further 500 Hz of Bhabhas. The remaining 2300 Hz of Level 1 rate arise primarily from beam backgrounds, together with a small amount of low-mass two-photon physics.
At the Super luminosity, the combination of the 20 “irreducible” cross-section and the 50 of Bhabha would result in an event rate of 70 kHz. What is not known is how to scale the remaining portion of the BABAR Level 1 rate. Since the beam currents in the envisioned accelerator design are comparable to the present PEP-II currents, and the IP design is expected to produce lower backgrounds as a result of the removal of the B1 dipoles, we cannot expect that this portion of the Level 1 rate will scale with luminosity.
Review of a variety of background scaling models used in BABAR, and the opinions of a number of BABAR trigger experts, suggest that scaling by 10% of luminosity is a plausible goal. This implies a contribution to the Level 1 rate from this source of 25 kHz, or a total rate from all sources of 100 kHz. In order to maintain 50% headroom, then, this suggests designing the DAQ system to be capable of handling Level 1 Accept rates of 150 kHz.
This is a challenging goal (the LHC experiments are planning for rates around 100 kHz) but would likely be achievable. As presented below, we are confident that the event build and downstream portions of the DAQ system could handle a 150 kHz rate. Detailed analysis of this for the frontend systems has not been done; this would be particularly important since there is no existing HEP system that is designed for more than 100 kHz.
Bhabha Veto
The trigger rate requirements could be reduced if a portion of the Bhabha rate could be vetoed at Level 1. The BABAR Level 3 trigger is currently capable of vetoing 90% of Bhabhas; this, however, requires a fairly high-precision reconstruction of tracks and clusters, so that they can be matched reliably, especially in the edges of the detector acceptance. A less-challenging 50% veto at Level 1 is very likely achievable, and would reduce the rate estimates to 70 kHz, or 105 kHz including headroom.
The design of the trigger primitives would have to be done with the needs of a Bhabha veto taken into account. This is a further reason why it may be desirable to run the tracking trigger at higher rates, to improve tracking resolution, and to use a finer-grained segmentation of the calorimeter in the trigger. The global trigger would have to be capable of performing track-cluster matching.
Since it appears that the viability of an open trigger depends on these conclusions, we recognize the need for additional R&D on the following topics:
-
•
carrying out an analysis to confirm that the estimated 10% scaling of backgrounds is realistic;
-
•
evaluating the technical requirements and cost of frontend systems capable of running at 150 kHz; and
-
•
defining the trigger primitive requirements of a Level 1 Bhabha veto, and confirming that a 50% or better veto is achievable.
Either one of 150 kHz operation or 100 kHz operation with a Bhabha veto appears to be an essential requirement.
In the discussion below we assume a 100 kHz requirement, and identify the scaling issues associated with supporting 150 kHz instead.
Level 3 Trigger architecture
The BABAR Level 3 trigger runs on a farm of Linux systems, fed by the event builder with complete raw events. It analyzes data from the Level 1 trigger, drift chamber, and calorimeter, searching for charged tracks and calorimeter energy clusters. The primitive track segments from the Level 1 data are used to seed the track-finding algorithm in the drift chamber, and the actual drift chamber hits are then used to perform track fits. The trigger selects charged particles coming from a limited three-dimensional region around the interaction point (“IP tracks”), to avoid contributions from machine backgrounds.
The physics triggers are based on a small number of straightforward requirements on the detected tracks and clusters, e.g., a single IP track of momentum greater than 600 MeV/c, or two IP tracks of any momentum, or simple requirements on the total energy in the calorimeter or its distribution. These trigger selections are highly efficient for virtually all processes of interest in BABAR. However, they do accept a substantial portion of the Bhabha cross-section, and at the luminosity of PEP-II, it has been necessary to introduce a Bhabha veto. The task of the veto is complicated by the fact that a large part of the accepted cross-section consists of Bhabhas with only one track detected and/or at least one incompletely contained electron (positron) shower in the calorimeter. The veto algorithms must therefore recognize these degraded Bhabha signatures. The current trigger’s veto algorithms still pass approximately 5 of Bhabhas, roughly one-tenth of the initial total. A small additional rate of well-identified Bhabhas are deliberately accepted to provide calibration samples for various detector subsystems.
The current Level 3 configuration in BABAR achieves a total cross section of approximately 30 at a luminosity of . This includes about 5 of events that are deliberately accepted as calibration and injection monitoring samples, and whose rate has been held constant as the PEP-II luminosity has increased, through the raising of prescale factors.
Level 3 Concept for Super
It is highly likely that the BABAR Level 3 cross-section could be further reduced, either by tightening the trigger requirements in such a way that very high efficiency for physics would be maintained, but with some loss of efficiency for low-multiplicity physics such as , or by the investment of additional CPU time to refine the reconstruction and allow finer discrimination.
For the present purpose, however, we conservatively assume only that the core 25 cross-section of the present trigger can be maintained at the Super facility, and that no significant increase in the calibration and monitoring event rates will be needed, compared to BABAR. With this assumption, then, the computational requirements of the Level 3 trigger should be similar per event as those for BABAR, except for possible increases arising from the increased wire density of the drift chamber. In the worst case, a doubling in the number of layers in the chamber, we believe that the overall Level 3 processing time increase would be less than 50%.
In this conservative analysis, we estimate 25 kHz as the average event rate to be expected after Level 3 in the Super experiment.
Level 4 Option
In this document we imagine a “trigger” as a system that irrevocably discards events not selected. In BABAR the final level of triggering in this sense is Level 3. The raw data output of Level 3 (“XTC files”) is permanently recorded to tape and archived at two sites. Offline data processing (and reprocessing) in BABAR begins with these files.
Two further levels of filtering are used in BABAR, however. The reconstruction process for XTC files begins with a stage that selects events for reconstruction, based on the event analysis by Level 3. The second stage of the process performs a basic reconstruction of the event, only somewhat more detailed than that done by Level 3, and uses this data to make a further selection before the event is subjected to full reconstruction and written out in the BABAR offline format.
At present PEP-II luminosities, this “physics filter” selects approximately 15 from the event stream. This is a very loose selection that is shared by all BABAR analyses and would clearly be applicable to the Super experiment. This raises the question of whether a similar selection could be performed as a Level 4 trigger in Super–that is, as an irrevocable selection preceding archival storage.
Experience in BABAR has shown that this physics filter has occasionally been modified as part of a reprocessing pass, specifically in order to accept events from certain low-rate low-multiplicity processes. If this selection were applied as a Level 4, this flexibility would be lost, and extensions to the filter could only be applied to new luminosity.
The data volume and associated offline computing costs anticipated for Super are such, however, that this tradeoff may be found to be worthwhile.
The BABAR physics filter is evaluated after execution of a subset of the full offline reconstruction. It is unknown whether a similar selection with acceptable efficiency for physics and a substantial rate of background rejection could be constructed from the Level 3 quantities. We recommend that this be studied, perhaps initially with an attempt to implement the existing BABAR physics filter selection “as-is” on Level 3 quantities.
3 Online
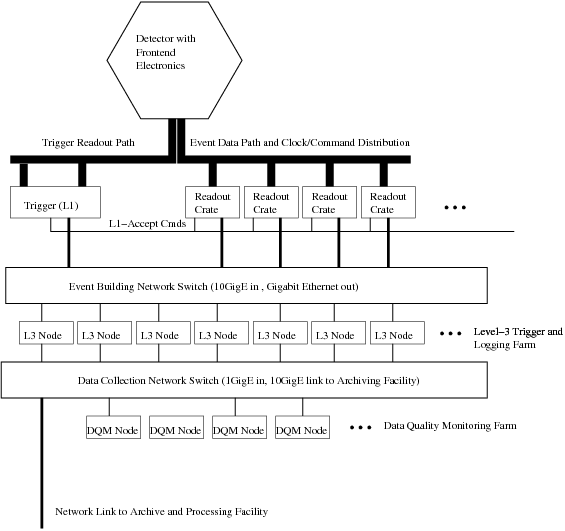
Data Acquisition
In this section, we discuss the design of the data acquisition (DAQ) system for the Super detector, as well as the event data path and the fast control and timing system. The Super DAQ system design will be similar to the current BABAR data acquisition system, but with faster fiber links to the frontend electronics (2.5GBit/s) and much higher integration within the readout modules. It could be built from components of a modular data acquisition system that is currently being developed at SLAC.
Cluster Element Modules (CEM) provide an FPGA incorporating a general-purpose (PowerPC) processor, channels of generic high-speed serial I/O, and 10GBit and 100MBit Ethernet commodity network connectivity (a ”System-On-A-Chip”). Up to 32 CEMs can be housed in a crate (CE-box), interconnected by Fast/Slow Cluster Interconnect Modules (fCIM/sCIM), providing managed 10GBit and 100MBit switched Ethernet connections within the crate, as well as up to 8 10GBit-Ethernet external network connections per crate.

Each CEM can have two bidirectional 2.5GBit/s fiberoptic links to detector frontends. These links are used to transmit a global clock and configuration and readout commands to the frontend electronics and to receive event data from the frontend electronics. In addition to the usual FPGA-style processing capabilities, including DSPs, each CEM has two PowerPC processors capable of running a real-time operating system.
As a baseline design, we foresee providing at least one crate per subdetector.
We anticipate that all detector systems will use a triggered readout scheme, eliminating the untriggered readout used in the BABAR EMC.
Because of the very high event rates anticipated, it will be important to push as much of the task of “feature extraction” as possible into intelligence in the frontend electronics. The recent BABAR drift chamber upgrade provides a useful model, in which the new frontend electronics include FPGAs that execute the feature extraction algorithm previously hosted in the downstream general-purpose CPU, and are still reprogrammable through the DAQ system, should a change to the algorithm be needed.
In particular, we expect that the EMC feature extraction will have to be migrated upstream in this way to handle the 20–30 times higher Level-1 Accept rates foreseen.
BABAR experience suggests the possibility of single-event upsets (SEUs) or other radiation damage affecting the operation of the frontends. The design must take this into account, and provide features that mitigate disruption to data acquisition or frontend configuration from these sources. That may require the incorporation of redundant processing and/or frequent validation of configurations.
With the envisioned luminosity, one concern is the possibility of overlap between physics events within the integration time of one of the detector systems, notably the EMC barrel. The probability of a Bhabha event having occurred just before any given Level-1 Accept is substantial, and it would be desirable to be able to disentangle its energy deposition from that of the succeeding event. In order to preserve event independence, and to allow for Bhabha vetoes at Level 1, addressing this problem requires adding additional information to each event. This may require the feature extraction algorithms in the frontends to record in each event a history of recent detector activity sufficient to perform this analysis downstream.
A Fast Control and Timing System (FCTS) is responsible for providing a common time base and clock synchronization for all components of the data acquisition system and for the control of the frontend readout electronics through configuration and readout commands. The frontend readout electronics respond to a readout command by extracting the data that correspond to the requested time window from the sampling buffers and sending them up the event data path.
In contrast to the BABAR design, it will be important to ensure that there is no mandatory deadtime per Level-1 Accept. This can be accomplished either in a deterministic design in which the Level-1 Accept command can be transmitted and the resulting data received in less time than the minimum interval between possible triggers, or with a design in which Level-1 Accepts can be queued in transit, with time tags that permit retrieving data by address from frontend buffers.
The BABAR design choice of synchronizing the event timebase to the PEP-II revolution period proved to have unanticipated benefits, as it permitted the straightforward implementation of the fast event filtering required by trickle injection. Because the present Super accelerator concept requires trickle injection, this capability must be preserved. In order to avoid downstream requirements of preserving event time ordering, the time relationship of events to the most recently injected pulses should be determined and recorded in-band in the event data stream at the CEM level.
In addition, experience from the integration of event and ambient data in BABAR indicates the desirability of placing the recording of slow control data on the same timebase.
Event Builder
After the feature extraction algorithms have been applied to the event contributions, whether in the frontends or the CEMs, they are combined into complete events in a multi-stage event builder. While not strictly necessary, a crate-wide event build where all event contributions from a crate are combined into a small number of CEMs may be desirable, in order to have additional buffering and better control over the downstream network traffic.
The final stage of event building is done in a network event builder that combines the event contributions from multiple data acquisition crates into complete events while fanning them out to the Level 3 trigger farm. The BABAR approach of a deterministic event distribution will be used, avoiding the need for round-trips of “worker available” messages.
The event builder has to be able to handle the full Level 1 trigger accept rate and the corresponding data volume. At 100 and 75 event size, the data throughput would be 7.5/s or 60/s. The physical network medium is 10 Ethernet on the upstream side, matching the interfaces provided on the CE-boxes, and 1 Ethernet on the Level 3 farm side in order to take advantage of cheap on-board 1-Gigabit electrical Ethernet interfaces of the farm machines, and preserve the wiring flexibility of the longer cable runs thus allowed.
Network switches that have the required internal bandwidth and can accommodate the necessary port counts are commercially available today. Since most (if not all) currently available network switches cannot propagate flow control information across the backplane, the per-port average output rate should be limited to no more than 50% of the port speed, in order to take advantage of the per-port output buffers.
The event builder should be connectionless, ideally using the UDP/IP protocol with a simple flow control and retransmit mechanism. This places much less stringent requirements on the network stack processing time on the CEMs than would the use of TCP/IP. The addition of retransmit, which was not used in BABAR, reduces the need for highly device-specific network tuning.
Software Trigger Farm(s)
The Level 3 trigger farm needs to provide sufficient aggregate network bandwidth and CPU resources to handle the full Level 1 trigger rate on its input side. At 60/s total rate, and a maximum allowed average rate of 0.5/s per output port, this requires a minimum of 120 1-GBit connections to the event building switch. While other configurations are possible, we assume a baseline configuration of 120 Level 3 farm nodes. At 100 Level-1 Accept rate this translates into one event per 1.2 per node. Extrapolating from current technology, we expect the farm nodes to have 8–16 CPU cores with clock speeds that are not significantly higher than at present, requiring the parallel processing of multiple events on a single node. With typical SMP overheads and the CPU power needed to do the event building and event data I/O, an 8-core node would allow 5–6 CPU-ms of Level 3 trigger processing time. If more CPU is required for the Level 3 trigger, the number of Level 3 trigger nodes can be increased.
The Level 3 trigger algorithms should be able to operate and log data entirely free of event time-ordering constraints. This greatly simplifies the use of multiple CPU cores, and facilitates the provision of an efficient packet retransmission protocol in the event builder. With the exception of the highly BABAR-specific retrofit of trickle injection filtering, this was the already the case for the BABAR system and event independence is a requirement for all downstream physics processing anyway.
Data Logging
As in the BABAR data acquisition system, the output of the Level 3 trigger is logged to disk storage local to the farm nodes. We assume 2–4 of usable space per node, constructed from low-cost disk in a mirrored (RAID-1) configuration.
At the estimated Level 3 trigger output rate of 210/node, and an event size of 75, a single farm node needs to be able to write 16/s of Level 3 trigger output and to read at least twice that rate for transfer to tape storage (about 16/s for keeping up with data taking + 16/s contingency to drain buffered data). Current-generation disks are capable of handling these rates.
A switched Gigabit Ethernet network separate from the event build is used to transfer the data asynchronously from the farm machine disks to archival storage and/or near-online farms for further processing.
In contrast to the BABAR system, we do not foresee an additional run-building stage that combines the individual files from the farm nodes into per-run files that contain all events from a run. Instead, individual files corresponding to parts of a run will be maintained in the downstream system. The bookkeeping system and data handling procedures need to be designed to handle non-monotonic runs and missing run contribution files.
At a total Level 3 trigger output rate of 25 (1.9/s at 75 event size), the aggregate farm capacity of 240-480 corresponds to approximately 1.5–3 days of data taking. The size of this buffer is set by the number of nodes and the availability of suitable internal disks. We have assumed 1 devices, which are just now coming to market; somewhat larger ones will certainly be available on the Super project time scale.
We assume that the site will provide the facilities for permanent archival storage of the raw data, and network connectivity to the experimental area with sufficient capacity for moving the Level 3 output. It would be prudent to provide for double the normal output rate of Level 3, in order to allow for timely recovery from temporary outages. This corresponds to a bandwidth requirement of about 4/s. This could be provided as several 10/s fibers, or by using (costly) higher-rate optical links; 40/s optical links are currently available but are not commodity items.
Providing significantly more buffering as part of the online computing system incurs large additional costs, most likely in the form of a server farm of nodes, and quite possibly exceeding the cost of the Level 3 farm itself. This is probably not cost-effective to provide merely in order to mitigate low-probability loss of connectivity accidents.
Dead Time and Buffer Queue Depths
As noted above, the goal of this design is to avoid mandatory deadtime for each Level-1 Accept. In BABAR, there is a 2.6 minimum interval between commands transmitted on the FCTS network. This means that triggers which arrive within that interval after a Level-1 Accept cannot be serviced and are lost. The resulting deadtime at the current peak BABAR rates of 5 is 1.3%. At 100 this would be 26% and obviously unacceptable.
There is a minimum interval between possible triggers set by the response time constants of the detector systems, such as the DCH drift time and the EMC integration time. It is possible to avoid mandatory deadtime if the system is designed to be able to transmit Level-1 Accepts and read out the corresponding data in less than this time, which is likely to be of order 1.
Alternatively, if the FCTS is capable of queueing triggers in transit, and if the frontend buffer memories are time-addressable, this requirement can be relaxed, as long as there is sufficient buffering. Model studies are required in order to assess the number of buffers needed; it is likely that the answer will be 10–20.
Because of the high luminosity, overlapping events will be a reality for this experiment, particularly Bhabhas overlapping with events of all types. This raises questions both of extending readout intervals to allow disentangling final-state particles from closely-spaced interactions, and of handling overlapping triggers. The buffer queue design must take this into account, e.g., by allowing consecutive Level-1 Accepts to cause the repeated readout of time slices shared between them.
Event Data Quality Monitoring and Display
Event data quality monitoring is based on quantities calculated by the Level 3 trigger, as well as quantities calculated by a fast reconstruction pass. Depending on the CPU availability on the Level 3 nodes and the requirements of the data quality monitoring, the fast reconstruction pass can either run on the Level 3 farm (low-overhead machine virtualization can be used to isolate the Level 3 trigger from the data quality monitoring CPU load), or on a separate data quality monitoring farm. We will henceforth assume that a separate data quality monitoring farm of 40 nodes is required. In both scenarios, the fast reconstruction obtains event samples from the Level 3 processes. A distributed histogramming system (similar to the BABAR DHP system) collects the monitoring output histograms from all sources and makes them available to automatic monitoring processes and operator GUIs.
Other Components
Experiment Control and Operator Console
The Experiment Control system provides the operator interface for the data acquisition system, configuring and controlling all trigger and data acquisition components. It provides global sequencing of setup, teardown, calibration, and error recovery, and interacts with the Slow Control system to automate the data-taking operation as much as possible. Most basic components of the BABAR Run Control system could be re-used with the overall control logic revised for the operational needs of the facility. The operator and expert user interfaces should be fully integrated with the Slow Control user interfaces.
Slow Control
The Slow Control system is responsible for controlling the detector and detector support systems and for monitoring and recording detector and environment conditions. It will require a toolkit that provides the interface to whatever industrial buses, sensors, and actuators may be used to monitor and control the detector. It must provide a graphical user interface for the operator, have facilities to generate alerts automatically, and have an archiving system to record the relevant detector information. It must also provide software interfaces for programmatic control of the detector. To allow easy correlation of Slow Control information with event data, a common timebase between the data acquisition system and the slow control system is needed.
Electronic Logbook
A web-based electronic logbook allows operators to keep an ongoing log of the experiment status, activities, and changes and should be considered an integral part of the experiment’s configuration control and management. In order to allow reliable bookkeeping, the electronic logbook should be integrated with the Experiment and Slow Control system and automate the recording of relevant information as much as possible, and be readily extensible as directed by experience.
Configuration Management
For the data acquisition and trigger systems, a strict configuration management system is required. All hardware and software configuration parameters must be defined in a configuration database. In addition a strict software release management and tracking system needs to be in place, so that it can always be determined what software version, including any patches, was running at any given time, in any part of the data acquisition system. FPGA firmware is considered software in this respect and must be included in the configuration management scheme.
Online Computing Infrastructure
The online computing infrastructure consists of network components file and applications servers. It must be designed to provide high availability (where affordable) and be self-contained and sufficiently isolated and firewalled to minimize the online system downtime and dependencies on external resources (even the downstream computing on the site). This assumes similar attention to self-sufficiency in the essential operational computing of the accelerator. A controlled computing environment must be provided to facilitate subdetector-specific computing tasks.
4 Reuse of BABAR Components
The useful lifetimes of commodity computing components are such that it is unlikely that, on the time scales envisioned for this project, any benefits could be obtained from attempting to reuse components of the existing BABAR online system. The sole plausible exception might be the reuse of some of the VME crates.
The existing BABAR online system has been remarkably successful. BABAR records data with a net efficiency among the highest ever attained in the field in the long term. Much of this achievement was due to the great attention paid to optimization and control system automation with regard to highly BABAR- and PEP-II-specific details that cannot be expected to reappear in the Super experiment. In addition, much of the data acquisition software is either tightly tied to the hardware and cannot easily be reused, or was designed according to computing and networking constraints of the late 1990s.
The benefits of reusing existing BABAR online system software are therefore rather limited. Some of the software frameworks and much of the basic design may be applicable, but one must be careful, because their reuse might prevent the clean incorporation of “lessons learned” and limit the scope for performance optimizations over the lifetime of the Super experiment.
We recommend a clean redesign of the details of the online software systems, taking advantage of existing knowledge, toolkits and individual software packages only where appropriate. As a result, only very modest savings in software engineering effort are likely to be realized as a result of this reuse.
5 Conclusions, Next Steps and Estimation Considerations
On the whole, it appears that the trigger and online computing systems for the Super experiment can be constructed using established techniques and commercial components, with a design quite similar to that used in BABAR.
The high Level-1 Accept rate in itself appears tractable, but some questions remain and should be the subject of further R&D. Remaining uncertainties in the detector design also must be resolved before a final design and costing of the trigger and online systems can be completed.
Questions for further research
The following additional studies should be undertaken:
-
•
A thorough evaluation of the channel counts and per-channel data acquisition requirements, including the bit depth and sampling rate requirements of each detector subsystem;
-
•
Estimates of the detector occupancy and the consequent contribution to event size arising from backgrounds (note that the event size for several BABAR subsystems is dominated by background occupancy);
-
•
Evaluation of the improvements in Level 1 trigger charged particle tracking attainable by increasing the sampling rate of the data supplied to the trigger, and the consequences for the types of algorithm that could be implemented at Level 1;
-
•
A detailed estimate of the attainable performance of a Bhabha veto at Level 1, and an evaluation of whether its use would materially change the requirements and the design of the data acquisition system, the overall system cost, or the ultimate accelerator upgrade luminosity that could be handled;
-
•
Assessment of the cost and design implications of extending Level-1 Accept capacity from 100 to 150, to provide headroom at the start, in case of the absence of a Bhabha veto, or to deal with a later luminosity upgrade;
-
•
A more detailed investigation of the consequences of overlapping events and/or overlapping triggers, and the implications for the FCTS and other elements of the design; and
-
•
Queue modeling for the various components of the system, including both its end-to-end behavior and a specific focus on the behavior of the frontends and feature extraction, to determine the buffering requirements in the frontends and other design parameters.
-
•
Investigation of the adaptation of the existing BABAR physics filter to the use of Level 3 quantities.
Each of these studies can be carried out with a few FTE-weeks of effort.
Cost Estimation Considerations
Online Farms and Network
BABAR experience with two major online system upgrades indicates that the per-box cost for rack-mountable farm machines and network switches stays roughly constant over time, while the per-unit performance increases.
We assume that performance will continue to increase according to Moore’s Law, with the gain in CPU power coming primarily from the provision of additional cores.
Networking hardware is assumed to improve somewhat more slowly, but as noted above even the 2009 generation of equipment should be entirely adequate for this proposal.
For the farm nodes we assume typical SLAC prices after a combination of volume and educational discounts. Similar discounts should be achievable by other institutions if farm machines are bought in sufficiently large quantities. Since the quantities of network gear required for Super online will most likely not be sufficient to qualify for volume discounts, we base our estimate for the network cost on BaBar equipment list prices without applying any discounts.
The cost for application servers, file servers and general network infrastructure includes the infrastructure components needed by other online subsystems, like run control or the slow control system.
Slow Control System
Labor for Design and Implementation of online system. The table contains only items that cannot directly be attributed to specific electronics engineering
Labor requirements
We base our estimate of labor required to design, implement and commission the online system on the effort that was needed for BABAR. The overall complexity of the Super online system is comparable to the BABAR system, with the new challenges of higher data rates and processing requirements being offset by the availability of knowledge and “lessons learned” from the BABAR experiment.
We anticipate that the overall labor investment in the Super online system could end up comparable to that for BABAR, but with several caveats.
Most importantly, the subsystem-specific portions of the front-end data acquisition (e.g., feature extraction) will likely require more specialized expertise than was available for the original BABAR system development. The design capacity of the BABAR front-end DAQ was only approached recently, after considerable revision of the original subsystem-specific code by members of the core group with great expertise in optimization of embedded systems. The 100 kHz (or more) Level 1 Accept requirement for Super would require this level of engineering ab initio, particularly if feature extraction in the front-end FPGAs is needed, as we expect.
We believe that these tasks, as well as the provision of subsystem-specific detector control software, would be best served by being provided by a core development group rather than by contributions from the detector subsystem groups.
For the purposes of labor estimates, we include all aspects of the core, detector-system-independent portion of the online, as well as detector-system-specific software and firmware running at any level of the data acquisition system or in the detector control system. We do not include front-end electronic engineering or any computing system development downstream of the logging subsystem described above. We include in the labor estimate some work that was deferred or descoped from the original BABAR online system as part of the “triage” required to deliver an initial system with the personnel available, and which proved later to be essential to providing the highly reliable system we now have.
Within this scope, we estimate, from BABAR experience, that approximately 80-90 FTE-years of effort would be required, with the ramp-up of the group capable of being spread out between 4 and 2.5 years in advance of the first physics running. The total requirement could be slightly reduced if key developers from BABAR could be found to work on the Super project, simply because of the easier application of “lessons learned”. The number would likely be higher, or the initial system less successful, if a new group started completely from scratch.
11 Computing
Introduction
A luminosity of cm-2s-1 is nearly a two orders of magnitude increase over current Factory experience, requiring substantial growth in computing requirements. Compared with other detector systems, the computing system has the additional feature that “construction” is never complete – as more data is accumulated, the computing resources must continue to grow. Mitigating these aspects is the “Moore’s Law” scaling of the computing industry: The cost per unit of computing decreases rapidly with time, whether it be CPU, storage, or networking.
In this section, we describe the computing requirements for Super. The model is based on the existing Factories. We discuss here the “offline” computing; the computing requirements associated with data acquisition are discussed in the Trigger and Data Acquisition section. Offline computing includes event reconstruction, data handling, simulation, physics analysis, and auxiliary tasks, such as high-level calibration and validation.
Event Rates
The physics rates for a collider at the resonance are high, with a rate from production alone of approximately 1100 Hz. It should be noted that a large fraction of the total cross section, other than QED and two-photon processes, is useful in the physics program. We list various relevant rates in Table 7.
| Process | Rate at |
|---|---|
| (kHz) | |
| 1.1 | |
| continuum | 3.4 |
| 0.94 | |
| 1.16 | |
| for | 30 |
It is neither necessary nor desirable to record the entire QED (e.g., Bhabha) rate. Bhabha scattering is useful for detector calibrations, but the statistics available is far greater than required. BABAR records (with pre-scaling) only a few hertz of Bhabha scattering; this absolute rate will also be sufficient, with perhaps a small increase, for Super as well. It is also worth noting that Bhabha and background events are both considerably smaller in size, and take less time to process, than the events; to be conservative in our estimates, we take no credit for the slower than linear scaling requirements for these categories.
Requirements
The considerable experience with the BABAR [46] and BELLE [47] experiments can be used to reliably estimate the computing requirements for the Super detector. This experience is in the regime; scaling by about two orders of magnitude is required. Fortunately, much of this scaling exercise is quite straightforward. We use here the BABAR computing experience as our basis for estimating the Super computing requirements.
The computing model may be summarized as follows: The “raw data” from the detector is permanently stored, and also run through a “prompt calibration” pass to determine various calibration constants. Once the constants are derived, a full “event reconstruction” pass is performed, and reconstructed data is then also permanently stored. Data quality is monitored at all steps in the process.
Once constants are known, and random trigger background “frames” are readied, Monte Carlo simulated data, incorporating the constants and background on a run-by-run basis, is prepared.
Data is made available to physics analysis in a convenient form through the process of “skimming”. This involves the production of selected subsets of the data designed for different areas of analysis.
From time to time, as improvements in constants, reconstruction code, or simulation are implemented, the data may be “reprocessed” or new simulated data generated. This is the reason, for example, why the CPU requirements for data processing increase even when the luminosity is constant.
As a baseline, we simply scale all rates linearly with luminosity. In Table 8 we list the assumptions used in computing the disk and tape storage requirements, and in Table 9 we list the assumptions behind the CPU requirements. We define some of the terms used in the tables as follows:
-
•
Mini: refers to an event data storage format containing detector information as well as reconstructed tracks, etc., but is relatively compact, through noise suppression and efficient packing of data.
-
•
Micro: refers to data collections that contain only information essential for physics analysis.
-
•
Skim: a subset of the collection of all events. There may be many skims, designed to be used for different analysis topics.
-
•
Skim expansion factor: the total storage occupied by the skims, divided by the storage required for one copy of the micro dataset.
| Raw data size (TB/ab-1) | 875 |
| Micro data size (TB/ab-1) | 42 |
| Mini data size (TB/ab-1) | 80 |
| Mini Monte Carlo data size (TB/ab-1) | 78 |
| Copies of raw data | 1 |
| Copies of micro | 2 |
| Copies of mini | 1 |
| Skim expansion factor | 2 |
| Copies of skims | 1 |
| Fraction of micro data on disk | 1 |
| Fraction of mini data on disk | 0.1 |
| Fraction of micro Monte Carlo on disk | 1 |
| Fraction of mini Monte Carlo on disk | 0.1 |
| Fraction of skims on disk | 0.5 |
| Physics analysis of data (MSpecInt2000/ab-1) | 1.2 |
| Physics analysis of Monte Carlo (MSpecInt2000/ab-1) | 1.3 |
| Data reconstruction (MSpecInt2000/10cm2s-1) | 22.1 |
| Monte Carlo production (MSpecInt2000/10cm2s-1) | 70 |
| Skimming of data (MSpecInt2000/10cm2s-1) | 10.2 |
| Skimming of Monte Carlo (MSpecInt2000/10cm2s-1) | 10 |
| Duration of reprocessing (mo/yr) | 9 |
| Duration of reskimming (mo/yr) | 6 |
| Effective number of running days/month | 19.3 |
| Number of running months/year | 9 |
The resulting CPU and storage requirements are shown in Table 10. The numbers are year-over-year incremental requirements, with year 1 showing the total initial computing complement.
| Parameter | Year 1 | Year 2 | Year 3 | Year 4 | Year 5 |
| Luminosity (ab-1) | 2 | 6 | 12 | 12 | 12 |
| Storage (PB) | |||||
| Tape | 3.1 | 10.2 | 22.0 | 26.2 | 27.8 |
| Disk | 0.83 | 3.35 | 7.55 | 10.2 | 10.2 |
| CPU (MSpecInt2000) | |||||
| Data reconstruction | 3.0 | 8.8 | 14.7 | 8.8 | 0.0 |
| Skimming | 2.7 | 9.4 | 16.1 | 12.1 | 0.0 |
| Monte Carlo | 9.5 | 28.0 | 46.6 | 28.0 | 0.0 |
| Physics analysis | 5.1 | 15.0 | 30.0 | 30.0 | 30.0 |
| Total | 20 | 61 | 107 | 79 | 30 |
Comparison with Requirements of LHC Experiments
As shown in the previous section, the large increase in luminosity of Super over PEP-II reuqires a substantial increase in computing requirements.
We may put these requirements in perspective by comparing them with projections for the LHC. Table 11 shows the projected requirements for the CMS experiment and Atlas experiments in 2010, summed over the different types of tiered computing centers. It is clear that the computing requirements of the LHC experiments are significantly higher, even in 2010, than the projections for the first year of Super.
| CMS | Atlas | |
|---|---|---|
| Tape (PB) | 59.6 | 50 |
| Disk (PB) | 34.7 | 69 |
| CPU (MSpecInt2000) | 115.7 | 139 |
The comparison with LHC provides a reality check. Nonetheless, the requirements are non-trivial. Several considerations govern the feasibility of acquiring the needed resources, as discussed in the following sections.
Industry Progress
The first helpful fact is simply progress in the computing industry. There is considerable uncertainty in projecting the factors to be gained from this progress, but there is reason to believe that many current trends will continue for some time to come.
There is much discussion of how far into the future the current “Moore’s Law” rate for CPU performance will continue. However, there is confidence that the current rate of a factor of ten in transistor count every five years will continue for another decade [50]. CPU computing costs are thus expected to continue to decline by approximately a factor of ten every five years.
Industry projections show tape densities doubling every two years at least through 2010 [51].
Hard disk storage density has been following a similar trend as Moore’s Law for CPU’s, with a factor of ten in drive density every five years [52]. In contrast with tape and CPU performance, it is not clear how this will extrapolate into the future. There is thus some uncertainty in the relative size of the disk and tape components of the computing model.
Historically, the improvement in wide-area network cost/performance has been 60% per year [53]. This remains an active area of industrial development and the trend may be expected to continue for some time.
Software
Another helpful factor is the expectation that we will be able to build upon much of the BABAR computing model, as well as on Grid technology that has been developed by others. When BABAR was constructed, we had a different situation, in which there was no existing comprehensive software structure suitable for the data-handling requirements. Nearly the entire software structure had to be built from scratch.
Fortunately, the present situation is rather different: the BABAR code base, with the anticipated hardware advances, provides a useful starting point for Super. The Unix environment and C++ language are reasonably stable; we don’t anticipate the need for major development due to operating system or language changes. Grid development is well-advanced, and can be expected to form the basis for our distributed computing model, as detailed below.
Despite the major reduction in the required software effort expected due to the stability of the model and the existing code base, substantial software engineering effort will be required during both construction and operation. To provide some perspective, after several years of operation, the service personnel requirement for BABAR is currently approximately 120 FTEs. About half of this is for computing production and continuing physics software tools development. Much of this is supplied by physicists, and is therefore not accounted in construction or operational costs. It also excludes the substantial number of computing center personnel required to maintain the computing facilities themselves.
Distributed Computing
When BABAR computing was developed, the tools for applying distributed computing, still in a very early stage, tended to be purpose-built for the immediate task at hand. Much has changed since then, including the deveoplment of Grid technology. Coupled with the other advances, this implies that we will be able to spread the computing work over a much larger resource base than before.
The computing model for the Super experiment assumes that computing operations will be distributed over many sites on several continents. This approach has the advantage that the disparate computing capabilities at the participating institutes and in their countries can be employed in an optimal way. The seamless integration of remote computing centers will also ensure that participating groups of scientists will have optimal access to Super data, together with sufficient means to perform data analysis at their home institutions.
Technology and Resources
Though the precise state of development of computing technology at the startup of the Super facility cannot be predicted reliably, several assumptions are relatively safe. The BABAR experiment has already used distributed computing to a large degree and obtained very good experience with it. We are now in the ramp-up phase of a standardized Grid infrastructure that will provide the backbone of the computing operations of the LHC experiments. By the time of Super startup, this style of computing will have become routine, and an extended and well-commissioned infrastructure will be in place. For this reason, the Super computing model will be based on a Grid infrastructure, and it is envisioned that a Super facility will rely on a widely deployed multi-purpose computing infrastructure. Whether these centers will operate in a hierarchical tier-like structure, as in the present LHC computing models, cannot safely be predicted; it is possible that in the not to distant future, computing functionalities will have been virtualized to such an extent that individual centers can assume varying roles as needed, without a strict hierarchy. As long as tapes play a role, however, there will be a distinction between sites that have powerful tertiary storage facilities in place (“Level-1”), and sites that operate exclusively with disk storage (“Level-2”).
Distributed Production
Conservatism demands that we assume that the raw data produced by the high level trigger will, at least initially, be stored at the experiment site or in its vicinity. Since fast turnaround of calibration and alignment processes is crucial, data streams specialized to the corresponding information will be split off at the reconstruction level and processed at a site with excellent network and computing bandwidth to ensure fast updating of calibration constants. In order to ensure small latency and fast data quality monitoring, the core site may also be the location at which a significant part of the initial prompt reconstruction of the fresh data is performed. Part of this initial reconstruction, however, may also be performed at external sites, as is already done routinely by BABAR.
Since network technology will continue to develop at an even faster pace than other computing resources, it is safe to assume that data processing can be much more globalized than at present. Thus data skimming, as well as reprocessing of data, can be performed at either local or remote sites, depending on resources availability. As long as tapes are involved, however, certain data-intensive tasks will be easiest to perform at Level-1 sites. Event simulation, on the other hand, is far less demanding of local storage, and many sites will be capable of participating in simulation work, as it is already done for many current experiments.
Data storage
In the past, analysis models of experiments have been strongly shaped by the limited bandwidth for access to data. In the interest of smooth analysis in a distributed model, substantial amounts of data replication were necessary, which had a significant impact on storage requirements. The ongoing advances in networking bandwidth, however, are likely to change this paradigm; for Super we will likely store events for analysis only once within the collaborative network, except for backup datasets. With this approach, certain classes of reconstructed and skim data can be uniquely assigned to individual Grid centers. Event-indexed data access patterns that collect individual events from numerous sites for a specific analysis can be expected to play a stronger role than at present; this allows reduction of the skim storage overhead, since some portion of the skims can be virtualized. This approach is similar to BABAR’s concept of “Pointer skims”.
End-User Analysis
Existing Factory projects such as BABAR have already managed to concentrate end user analysis to a high degree on a micro-DST event format, whose contents are highly abstracted from the detector level and consist mainlu of physics analysis objects. Such condensed event formats are crucial with the large event samples of the Super experiment. One of the challenges will be to keep the latencies for end-user analysis, arising from the large number of events that many studies will have to examine, at a manageable level. It will therefore be very attractive to introduce parallelism into the end-user analysis itself. New approaches such as the PROOF (Parallel ROOT Facility) project seem to be promising in this rspect. It is even conceivable that, with abundantly available network bandwidth, such inherent parallelism will not be restricted to one site, but can be run across the collaboration grid. This would further reduce the need to replicate data due to access performance considerations.
Conclusions
Scaling BABAR’s computing requirements by almost two orders of magnitude naïvely presents a daunting picture for Super computing. However, with anticipated industry advances and the foundation of the existing technology base, scaling by this amount is feasible. Costs are somewhat uncertain at this point, due to the rapidly advancing computing industry. The substantial progress that has been made, and can be anticipated to continue, in distributed computing does, however, provide flexibility in the design of the system, and the ability to optimize the contribution of individual computing installations.
12 Reusability of existing hardware
1 Introduction
The high energy physics community has made a substantial investment over the past couple of decades in the design and construction of three detectors, BABAR, Belle and CLEO-II, specialized for physics measurement in the system. BABAR and Belle have been optimized for asymmetric colliders. Experience gained with these detectors has been fed into the design of the Super detector. As the programs for this current generation of detectors wind down, components from these detectors may become available. Use of these components could to reduce the cost and construction time for the Super detector. All three detectors have superconducting coils placed within a steel flux return instrumented with a muon identification system. All also have very costly CsI(Tl) calorimeters which remain largely undamaged by the radiation exposure to which they have thus far been subjected. Both these types of systems typically require long lead times for procurement and assembly.
2 Component Suitability
We will focus on the reuse of components of BABAR, the detector with which the majority of the community preparing this report is familiar. Each of the detector systems will be considered in turn, proceeding outward from the interaction point, with an eye toward those elements with significant reuse value.
The BABAR silicon vertex detector provides a template for design of the outer layers of the Super vertex detector. However, it does not provide a viable source for detector components. Some of the Si sensor modules will have radiation damage at the end of the BABAR program. Many of the on-detector readout chips, designed and fabricated before the advances in radiation-hard design and fabrication realized in the LHC effort, have already received significant radiation damage. The electronics bridging between newly designed on-detector circuits and readout modules is not likely to be useful.
The drift chamber will be adequate for the lifetime of the BABAR program. However, the chamber already shows ageing effects from the total charge integrated on the wires. The frontend electronics would require re-work for higher rates. The DCH and its ancillary electronics are, consequently, not candidates for reuse.
Many of the components of the DIRC (the BABAR Cherenkov particle ID system) are candidates for reuse, including the quartz bars, the bar boxes in which the quartz radiators are mounted, the “strong support tube” and the “horse collar” steel structure, which bolts onto the barrel flux return steel, cantilevering these elements into the BABAR detector. The production of the existing quartz bars was a serious challenge to the manufacturers, who found it difficult to produce well-finished bars in a timely way; replacement, because of the dispersal of the industrial team, would present a potential schedule risk. The mechanical structure for the support of the photomultiplier tubes, the standoff box, can also be reused if the faster conventional phototube option for the DIRC is chosen. The DIRC magnetic shield structure would be retained, since it also acts as the counterweight for the backward end doors. The conventional compensating solenoid coil that mounts to the horse collar could also be reused.
The electromagnetic calorimeter represents a large investment in materials and effort (approx. $25M). The system contains 6680 CsI(Tl) crystals, each weighing approximately 4 kg. The majority of these (5760), located in the barrel portion of the calorimeter, have minimal radiation damage and are good candidates for reuse, with the caveat that detailed background simulation, yet to be completed, must indicate acceptably low background rates. The endcap crystals have been exposed, especially in the regions closer to the beamline, to higher radiation doses, and are consequently more severely damaged. This damage manifests itself in reduced light yield, which leads to worsened energy resolution. The high rates of luminosity-related background expected at Super also make the use of the endcap crystals problematic, since the scintillation light decay time is slow: the principal fast component has a lifetime of about 800 ns which will lead to unacceptable pulse pile-up. The barrel portion of the calorimeter is a single environmentally sealed container, since CsI(Tl) crystals are mildly hygroscopic. It consists of two large support cylinders joined longitudinally close to the center. This support structure contains 280 carbon fiber honeycomb modules suspended inside from the rear. Each module typically contains 21 crystals that are held into these honeycombs with glue.
The superconducting coil, its cryostat and cryo-interface box and the helium compressor plant, are prime candidates for reuse, providing substantial schedule and financial benefits.
The flux return steel is segmented into layers, with detectors sandwiched between the layers. In the barrel, the detectors are limited streamer tubes (LST’s), recently fabricated. They are candidates for reuse. Resistive plate chambers, operated in streamer mode (except for less than 10% that have been operated in avalanche mode starting this year), are used in the endcaps. The RPC’s located in the backward doors date from the initial construction of the detector. A large fraction of these have failed; the performance of the rest is decreasing with time. The RPC’s in the forward doors date from an upgrade performed in 2002. These chambers were produced with improved quality assurance measures. Experience gained with the first generation of RPC’s has allowed the upgraded chambers to continue functioning with high efficiency. There are, however, lregions the chambers that show increased sensitivity to charge, which is a harbinger of chamber failure. This is likely to limit the reusability of these components.
Instrumented Flux Return
The flux return steel is organized into five structures: the barrel portion, and two sets of split end doors. Each of these is in turn composed of multiple structures. Components were sized to match the 50 ton load limit of the IR2 crane.
Each of the end doors is composed of eighteen steel plates organized into two modules, joined together on a thick counterweighted steel platform (Fig. 1), which rests on four columns with jacks and Hilman rollers. There are 9 steel layers of 20mm thickness, 4 of 30mm thickness, 4 of 50mm thickness, and 1 of 100mm thickness. During 2002, five layers of brass absorber were installed in forward end door slots in order to increase the number of interaction lengths traversed by muon candidates. These doors are retained in the Super baseline, along with the five 25mm layers of brass installed in 2002, and the outer steel modules which house two double layers of RPC detectors. Additional layers of brass (or steel) will be added, following the specification of the baseline design in the instrumented flux return section. Use of steel, though cheaper, would require re-measurement of the magnetic field. A cost-benefit analysis will be performed to choose between brass and steel.
The barrel structure consists of six cradles, each composed of 18 layers of steel. The inner 16 layers have the same thicknesses of the corresponding end door plates. The two outermost layers are 100mm each. The 18 layers are organized into two parts, the inner 16 layers, which are welded into a single unit along with the two side plates, and the outer two layers, which are welded together and then bolted into the cradle. The six cradles are, in turn, suspended from the double I-beam “belt” that supports the detector. During the 2004/2006 barrel LST upgrade, layers of 22mm brass were installed, replacing 6 layers of detectors in the cradles. In the Super baseline, all these components will be retained, as well as all the additional flux return steel attached to the barrel in the gap between the end doors and barrel. As in the end doors, four additional layers of absorber will be placed in gaps occupied in BABAR by LSTs.
A modest upgrade to the baseline would improve the muon identification capability. The end door structures and existing brass absorbers would be retained, as well as the gap filling steel now located between the end doors and barrel. The support belt and cradles would be redesigned with eight gaps to accommodate the detectors. The outer two barrel layers, which form a single module (steel layers 17 and 18), along with the flux bar that covers the end of this module, would be retained to reduce cost. Some of the thin plates can be cut out and reused to provide the structure for the inner identification gaps. The balance of the steel will be 4 thick slabs for 4 layers of detector. In this way, tolerance gaps are replaced with absorber. Redesign of the cradles also allows for wider gaps between select steel plates, permitting detector redundancy in select layers. As a cost-cutting measure, the barrel brass would be retained for use as the additional endcap absorber. Remeasurement of the magnetic field would be reuqired. The BABAR support belt structure is asymmetric: the I-beams under the bottom sextant are shorter than those of the other sextants. This was driven by the existing beam line height at IR2. In the redesign there would be a larger gap between the floor and base plate of the end doors, allowing space for installation of belt chambers under the end doors to complete the system of belt chambers and absorber installed in the 2002 BABAR upgrade.
3 Component Extraction
Extraction of components for reuse will require the disassembly of the BABAR detector. This begins with opening the end doors and removing the DIRC plug. The support tube, which contains the accelerator final beamline elements as well as the SVT, are then removed. The brass absorber installed in the barrel and end doors is removed next because the jacks which lift the detector do not have adequate capacity to handle the full load. At the same time the barrel LSTs are removed. The doors are then closed and the bolted up detector moved off the beamline, freeing the detector of the space restrictions imposed by the pedestals that hold the rafts that cantilever accelerator components into the detector. The doors are opened and moved aside for disassembly. The steel that is contained in the gap between the doors and barrel is removed. The electronics hut and services that connect it to the detector are removed. The EMC forward endcap is removed. The SOB is removed. The DIRC is then removed from the barrel. The DCH is removed from the DIRC. The barrel EMC is then removed from the barrel steel. The solenoid is removed from the barrel steel. A temporary structure is assembled inside the barrel hexagon to support the upper cradles during disassembly. The upper half of the support belt is removed. Because of the load limitations of the IR2 crane, the six cradles must be disassembled in situ. The outer sections of the top cradles are removed, followed by the inner part of each of the three cradles. The temporary support structure is removed. The inner part of the lower cradles is removed, followed by the outer portions. The balance of the structural belt is disassembled.
4 Component Transport
The magnet steel components will be crated for transport in order to limit damage to mating surfaces and edges. Most, if not all, of these components can be shipped by sea. Some optimization of shipment involving air transport may be required, depending on the details of the overall construction schedule. Detector components of the IFR that are reused can be crated and shipped by air.
The BABAR solenoid was shipped via special air transport from Italy to SLAC. It is expected that this component can be returned to Italy in the same fashion.
The DIRC and barrel calorimeter present transportation challenges. In both cases transport without disassembly is preferred.
In the case of the DIRC, this would include the strong support tube and bar boxes. Detailed engineering studies, which model accelerations and vibrations during a flight, are needed to determine if the DIRC can be safely transported. Special structures would have to be designed to handle this object. If it proves impossible to ship the detector as a unit, it is possible to disassemble the detector and air-ship each bar box individually. The cost is time to disassemble and reassemble the detector, with increased risk to damage these larger components. A dry environment is required in all cases to avoid condensation on the quartz bars. Disassembly of the bar boxes exposes the valuable bars to damage; it is not considered a viable option.
In the case of the EMC, there are two environmental constraints on shipment of the device or its components. The glue joint that attached the photodiode readout package to the back face of the crystal has been tested, in mock-up, to be stable against temperature swings of C. During the assembly of the endcap calorimeter, due to a failure of an air conditioning unit, the joints on one module were exposed to double this temperature swing. Several glue joints parted. The introduction of an air gap caused a light yield drop of about 25%. In order to avoid this reduction in performance, temperature swings during transport must be kept small. Since the crystals are mildly hygroscopic, it is best that they be transported in a dry environment to avoid changes in the surface reflectivity, and consequent modification in the longitudinal response of the crystal. Individual endcap modules constructed in the UK were successfully shipped to the US in specially constructed containers that kept the temperature swings and humidity acceptably small.
Disassembly of the barrel calorimeter for shipment presents a substantial challenge. Both the disassembly and assembly sites need to be temperature and humidity controlled. The disassembly process requires removal of the outer and inner cylindrical covers, removal of cables that connect the crystals with the electronics crates at the ends of the cylinder, splitting of the cylinder into its two component parts and removal of the 280 modules for shipment. Though much of the tooling exists, the environmentally conditioned buildings used in calorimeter construction at SLAC no longer exist, though alternative facilities could be fit out. The cooling and drying units used in the module storage/calorimeter assembly building continue to be available.
The clear preference is to ship the calorimeter as a single unit by air. Including the tooling support stand and environmental conditioning equipment, the load is likely to exceed 30 tons. It is anticipated that such a load could be transported in the same way as the superconducting coil and its cryostat, but verification is needed. Detailed engineering studies, which model accelerations and vibrations involved with flight that might cause the crystal-containing carbon fiber modules to strike one another, are needed to determine if the calorimeter can be safely transported. Engineering studies of overall stability of the EMC structure against the flight accelerations are also required.
5 Detector Assembly
Assembly of the Super detector is the inverse of the disassembly of the BABAR detector. Ease of assembly will be influenced by available facilities. In the case of BABAR, the space limitations of the IR2 hall led to engineering compromises in the design of the detector. Assembly was made more complicated by the weight restrictions posed by the 50 ton crane. Upgrades were made more difficult because of limitations in movement imposed by the size of the hall. A newly designed interaction region hall could ameliorate many of these problems.
References
- [1] D.Schulte, Ph.D. thesis, University of Hamburg 1996; TESLA-97-08.
- [2] “K.Yokoya, P.Chen, Beam-beam phenomena in linear colliders,” Frontiers of Particle Beams: Intensity Limitations: Proceedings of a Topical Course held at the Joint US-CERN School on Particle Accelerators, Hilton Head Island, South Carolina, US, 7-14 Nov. 1990.
- [3] M.S.Zolotarev, E.A.Kuraev and V.G.Serbo, INP-Preprint 81-63(1981), Novosibirsk; SLAC TRANS-227(1987)
- [4] P.Chen, Intl.Workshop on the Next Generation Linear Colliders, SLAC Report 335, 1989; SLAC-PUB-4822 (1988) appeared in Proc. DPF Summer Study SNOWMASS’88, World Scientific (1989)
- [5] R.Kleiss and H.Burkhardt, Comput. Phys. Commun. 81, 372 (1994).
- [6] G.Calderini et al. “Report of the Physics Impact of Beam Backgrounds Task Force,” BaBar Analysis Document BABAR-BAD-707, August 2001.
- [7] The BABAR Collaboration, Letter of Intent for the Study of Violation and Heavy Flavor Physics at PEP-II, SLAC-443 (1994). (2000) 59. 16. C. Hast et al., Report of the High-Luminosity
- [8] B. Aubert et al. [BABAR Collaboration], “The BaBar detector,” Nucl. Instr. Methods Phys. Res., Sect. A 479, 1 (2002).
- [9] T. Kawasaki et al., “Vertex detector for super Belle experiment,” Nucl. Instr. Methods Phys. Res., Sect. A 560, 53 (2006).
- [10] G. Rizzo et al., “A Novel Monolithic Active Pixel Detector in 0.13 m Triple Well CMOS Technology with Pixel Level Analog Processing,” Nucl. Instr. Methods Phys. Res., Sect. A 565, 195 (2006).
- [11] L. Ratti et al., “Monolithic pixel detectors in a CMOS technology with sensor level continuous time charge amplification and shaping,” Nucl. Instr. Methods Phys. Res., Sect. A 568, 159 (2006).
- [12] S. Bettarini et al., “Development of Deep N-Well Monolithic Active Pixels Sensors in a 0.13 CMOS Technology,” Nucl. Instr. Methods Phys. Res., Sect. A .
- [13] W. Innes, “Trackerr, a Program for Calculating Tracking Errors,” BABAR Note #121, Nov. 1993
- [14] K. Abe et al., [SLD Collaboration], “Preliminary measurements of the time dependence of B(d)0 - anti-B(d)0 mixing with kaon and charge dipole tags,” SLAC-PUB-7230 (1996).
- [15] S. Bettarini et al., “Measurement of the Charge Collection Efficiency After Heavy Non-Uniform Irradiation in BABAR Silicon Detectors” IEEE Trans. Nucl. Sci. 52, 1054 (2005).
- [16] V. Re et al., “The rad-hard readout system of the BaBar silicon vertex tracker,” Nucl. Instr. Methods Phys. Res., Sect. A 409, 354 (1998).
- [17] J. Hoff et al., “FSSR Status Report: Completion of the Functional Design Phase,” BTeV-doc-1718-v4.
- [18] V. Re et al., IEEE Trans. Nucl. Sci. 53, 2470 (2006).
- [19] G. Lindstrom et al., “Radiation hard silicon detectors-developments by the RD48 (ROSE) collaboration” Nucl. Instr. Methods Phys. Res., Sect. A 466, 308 (2001).
- [20] L. Bosisio et al., “Observation of Substrate-Type Inversion in High-Resistivity Silicon Structures Irradiated With High-Energy Electrons” IEEE Trans. Nucl. Sci. 50, 219 (2003).
- [21] M. Winter et al., Contributed paper to VIth International Meeting on Front End Electronics for High Energy, Nuclear, Medical and Space Applications, May 17-20, 2006 Perugia, Italy
- [22] M. Deveaux et al., Nucl. Instr. Methods Phys. Res., Sect. A 512, 71 (2003).
- [23] J. J. Velthuis et al., IEEE Trans. Nucl. Sci. 52, 1887 (2005).
- [24] M. Barbero et al., IEEE Trans. Nucl. Sci. 52, 1187 (2005).
- [25] Report of the SVT Long Term Task Force, BaBar Analysis Document BABAR-BAD-707, February 2004.
- [26] I. Adam et al., “The DIRC Particle Identification System for the BaBar Experiment,” Nucl. Instr. Methods Phys. Res., Sect. A 538, 281 (2005).
- [27] J. Cohen-Tanugi, M. C. Convery, B. N. Ratcliff, X. Sarazin, J. Schwiening, J. Va’vra, “Optical Properties of the DIRC Fused Silica Cherenkov Radiator,” Nucl. Instr. Methods Phys. Res., Sect. A 515, 680 (2003).
- [28] J. Benitez et al., “Develepment of a Focusing DIRC,” SLAC-PUB-12236 (Dec 2006), IEEE Nuclear Science Symposium Conference Record (2007).
- [29] M. Akatsu et al., “MCP-PMT timing property for single photons,” Nucl. Instr. Methods Phys. Res., Sect. A 528, 763 (2004).
- [30] J. Va’vra et al., “A 30 ps timing resolution for single photons with multi-pixel Burle MCP-PMT,” Nucl. Instr. Methods Phys. Res., Sect. A 572, 459 (2007).
- [31] T. Credo et al., “Picosecond TOF measurement for Colliders using Cherenkov Light,” IEEE Nuclear Science Symposium Conference Record, Vol. 1 (2004).
- [32] M. Kocian, “Performance and Calibration of the Crystal Calorimeter of the BABAR Detector,” 10th International Conference on Calorimetry in High Energy Physics (CALOR 2002), Pasadena, CA, (2002), SLAC-PUB-10170
- [33] M.J.Oreglia, Ph.D Thesis, SLAC-236(1980), Appendix D; J.E.Gaiser, Ph.D Thesis, SLAC-255(1982), Appendix F
- [34] B.A. Schwartz, “Performance and upgrade plans of the BELLE calorimeter,” 10th International Conference on Calorimetry in High Energy Physics (CALOR 2002), Pasadena, CA, (2002)
- [35] R.Y. Zhu, “Large size LYSO crystals for future high energy physics experiments,” IEEE Trans. Nucl. Sci. 52, 3133 (2005); R.Y. Zhu, “Precision crystal calorimeters in high energy physics,” International Symposium on Detector Development, SLAC (2006)
- [36] W.-M. Yao et al., J. Phys. G 33, 1 (2006)
- [37] B. Aubert et al. [BABAR Collaboration], Nucl. Instr. Methods Phys. Res., Sect. A 479, 1 (2002) [arXiv:hep-ex/0105044].
- [38] F. Anulli et al., Nucl. Instr. Methods Phys. Res., Sect. A 539, 155 (2005).
- [39] F. Anulli et al., Nucl. Instr. Methods Phys. Res., Sect. A 552, 276 (2005).
- [40] G. Aielli et al., Nucl. Instr. Methods Phys. Res., Sect. A 533, 98 (2004).
- [41] J.Va’vra, IEEE Trans. Nucl. Sci. 51, 2145 (2004).
- [42] G. Aielli et al., Nucl. Instr. Methods Phys. Res., Sect. A 478, 271 (2002).
-
[43]
MINOS collaboration, TDR on scintillator, ch.5
http://www-numi.fnal.gov/minwork/info/tdr/mintdr_5.pdf - [44] http://www.phys.hawaii.edu/superb04/talks/Kim.pdf
- [45] http://www.rmdinc.com/products/p006.html
-
[46]
http://www-conf.slac.stanford.edu/programreview/2006/Talks/
Dubois-Felsmann.ppt. -
[47]
I. Adachi et al., “Belle Computing System,”
Nucl. Instr. Methods Phys. Res., Sect. A 534, 53 (2004); http://arxiv.org/PS_cache/cs/pdf/0403015.pdf;
http://www.phys.hawaii.edu/superb/2005/slides/daq-computing/adachi/
Belle_comp.ppt. - [48] http://www.gridpp.ac.uk/gridpp13/gridpp13_CMS.pdf.
-
[49]
Atlas Computing Technical Design Report, CERN-LHCC-2005-022:
http://atlas-proj-computing-tdr.web.cern.ch/atlas-proj-computing-tdr
/PDF/Computing-TDR-final-July04.pdf. - [50] For example: http://www.intel.com/technology/mooreslaw/.
- [51] For example: http://www.exabyte.com/products/ltodriveroadmap.pdf. See also: http://www.lto.org, http://www.storagesearch.com/sonyart1.html, http://www.ibm.com, http://www.storagetek.com.
- [52] For example: http://www.storagereview.com/guide2000/ref/hdd/hist.html.
- [53] For example: http://www.net.informatik.tu-muenchen.de/wired/position/tom/html.
Chapter 4 Cost and Schedule
The Super project presented in this document relies heavily on the experience of PEP-II and BABAR, with cost and schedule estimates deriving directly from the PEP-II and BABAR budget and schedule. Although the estimates are deemed to be correct and are based on a bottoms-up evaluation using a detailed work breakdown schedule, it should be emphasized that this is a conceptual design report, and that therefore cost and schedule have not received the level of close scrutiny and detailed evaluation expected in a technical design report.
As is customary, cost estimates are presented in separate EDIA (Engineering, Design, Inspection, Acceptance), Labor, and M&S (Materials and Services) categories. Manpower is always indicated in man-months, since a monetary conversion is only possible after institutional responsibilities are identified. M&S is estimated in 2007 Euros; no future escalation is applied, since the project starting time cannot be defined at this time. The total project cost can be calculated, once the responsibilities are identified, by summing the monetary value of these three categories.
The reuse and refurbishing of existing components has been assumed whenever technically possible and financially advantageous. The replacement value of the reused components, i.e., how much would be required to build them from scratch, has been obtained by escalating the corresponding cost (including manpower) from the PEP-II and BABAR project from 1995 to 2007 using the NASA technical inflation index [1] and then converted from US Dollars to Euros using the average conversion rate over the 1999–2006 period [2]. The overall escalation factor from 1995 dollars to 2007 Euro is thus . The same escalation procedure has also been applied whenever the cost of new components could be directly extrapolated from the original 1995 budget.
The replacement value (”Rep.Val.”) of the reused components and the cost estimates to build Super are presented in separate columns of the cost tables. One could be tempted to sum the two numbers to obtain an estimate of the cost of the project if built from scratch. This procedure does not yield a completely accurate result because of the different treatment of the manpower (rolled up in the replacement value; separated for the new cost estimate) and because the refurbishing costs would then be added to the initial value, yielding incorrect results.
Contingency is not included in the tables. Given the level of detail of the cost estimates, a contingency of about 35% would be appropriate.
1 Accelerator
The cost estimate for the Super accelerator is shown in Table LABEL:tab:cost_accelerator, broken down by major subsystem. The costs are based on extrapolation from similar activities on other recent accelerator projects, rather than a bottoms-up estimate produced by engineers. It is anticipated that many PEP-II components will be recycled, refurbished, and moved to the new site. The last cost column contains the present replacement value (2007 KEuro) of the accelerator components, as they exist in PEP-II, that are to be reused in Super. The refurbishment, moving, and coordination costs for the component transportation are included in the other columns. The “EDIA” column lists the effort in man-months that will be needed for engineering, design and inspection (EDIA). The associated costs for this effort will reflect local labor rates and practices at the laboratories and institutions worldwide that participate in the construction of the Super accelerator. The “Labor” column contains an estimate of the man-months of technical labor for each subsystem, again a laboratory-dependent cost. Technical labor includes local effort needed for R&D support, office service support, and assembly area support. The “M&S” column lists the costs of purchased parts and services from outside companies and vendors.
| Number | EDIA | Labor | M&S | Rep.Val. | ||
|---|---|---|---|---|---|---|
| WBS | Item | Units | mm | mm | kEuro | kEuro |
| 1 | Accelerator | 5429 | 3497 | 191166 | 126330 | |
| 1.1 | Project management | 2112 | 96 | 1800 | 0 | |
| 1.1.01 | Technical management | 15 people | 720 | 12 | 300 | 0 |
| 1.1.02 | Project physicists | 10 people | 480 | 12 | 300 | 0 |
| 1.1.03 | Accelerator physics | 10 people | 480 | 12 | 300 | 0 |
| 1.1.04 | Cost accounting and tracking | 5 people | 240 | 24 | 200 | 0 |
| 1.1.05 | Database and documentation | 3 people | 144 | 24 | 100 | 0 |
| 1.1.06 | Project travel | 100 trips/yr | 48 | 12 | 600 | 0 |
| 1.2 | Magnet and support system | 666 | 1199 | 28965 | 25380 | |
| 1.2.01 | Engineering, design, and prototypes | 10 people | 360 | 120 | 500 | 0 |
| 1.2.02 | Dipole (0.5 m) removal and refurbish | 144 | 5 | 50 | 144 | 1440 |
| 1.2.03 | Dipole (0.5 m) shipping | 144 | 5 | 5 | 144 | 0 |
| 1.2.04 | Dipole (0.5 m) installation | 144 | 5 | 20 | 144 | 0 |
| 1.2.05 | Dipole (0.5 m) power supplies+cables | 144 | 2 | 4 | 450 | 432 |
| 1.2.06 | Dipole (0.5 m) water cooling connection | 144 | 2 | 12 | 144 | 0 |
| 1.2.07 | Dipole (0.5 m) supports/ship | 144 | 2 | 4 | 300 | 576 |
| 1.2.08 | Dipole (0.5 m) alignment | 144 | 3 | 6 | 72 | 0 |
| 1.2.09 | Dipole (0.75 m) construction | 144 | 3 | 3 | 1440 | 0 |
| 1.2.10 | Dipole (0.75 m) installation | 144 | 5 | 20 | 144 | 0 |
| 1.2.11 | Dipole (0.75 m) power supplies+cables | 144 | 2 | 4 | 600 | 0 |
| 1.2.12 | Dipole (0.75 m) water cooling connection | 144 | 2 | 12 | 144 | 0 |
| 1.2.13 | Dipole (0.75 m) supports | 144 | 2 | 4 | 450 | 0 |
| 1.2.14 | Dipole (0.75 m) alignment | 144 | 3 | 4 | 72 | 0 |
| 1.2.15 | Dipole (5.4 m) removal and refurbish | 176 | 6 | 60 | 176 | 2640 |
| 1.2.16 | Dipole (5.4 m) shipping | 176 | 5 | 5 | 352 | 0 |
| 1.2.17 | Dipole (5.4 m) installation | 176 | 5 | 20 | 352 | 0 |
| 1.2.18 | Dipole (5.4 m) power supplies+cables | 176 | 4 | 8 | 800 | 528 |
| 1.2.19 | Dipole (5.4 m) water cooling connection | 176 | 2 | 12 | 176 | 0 |
| 1.2.20 | Dipole (5.4 m) supports/ship | 176 | 3 | 6 | 500 | 352 |
| 1.2.21 | Dipole (5.4 m) alignment | 176 | 3 | 6 | 88 | 0 |
| 1.2.22 | Dipole (2 m) removal and refurbish | 4 | 1 | 1 | 4 | 40 |
| 1.2.23 | Dipole (2 m) shipping | 4 | 1 | 1 | 8 | 0 |
| 1.2.24 | Dipole (2 m) installation | 4 | 1 | 1 | 8 | 0 |
| 1.2.25 | Dipole (2 m) power supplies+cables | 4 | 1 | 2 | 100 | 25 |
| 1.2.26 | Dipole (2 m) water cooling connection | 4 | 1 | 1 | 4 | 0 |
| 1.2.27 | Dipole (2 m) supports/ship | 4 | 1 | 1 | 20 | 8 |
| 1.2.28 | Dipole (2 m) alignment | 4 | 1 | 1 | 2 | 0 |
| 1.2.29 | Quadrupole (0.43 m) removal & refurbish | 341 | 5 | 50 | 341 | 3410 |
| 1.2.30 | Quadrupole (0.43 m) shipping | 341 | 5 | 10 | 500 | 0 |
| 1.2.31 | Quadrupole (0.43 m) installation | 341 | 5 | 20 | 682 | 0 |
| 1.2.32 | Quadrupole (0.43 m) PS+cables | 341 | 5 | 10 | 1000 | 1023 |
| 1.2.33 | Quadrupole (0.43 m) water cooling conn | 341 | 2 | 12 | 341 | 0 |
| 1.2.34 | Quadrupole (0.43 m) supports/ship | 341 | 4 | 8 | 700 | 288 |
| 1.2.35 | Quadrupole (0.43 m) alignment | 341 | 3 | 6 | 172 | 0 |
| 1.2.36 | Quadrupole (0.5 m) removal & refurbish | 70 | 5 | 50 | 70 | 700 |
| 1.2.37 | Quadrupole (0.5 m) shipping | 70 | 2 | 4 | 70 | 0 |
| 1.2.38 | Quadrupole (0.5 m) installation | 70 | 6 | 40 | 140 | 0 |
| 1.2.39 | Quadrupole (0.5 m) PS+cables | 70 | 5 | 10 | 210 | 280 |
| 1.2.40 | Quadrupole (0.5 m) water cooling conn | 70 | 2 | 6 | 70 | 0 |
| 1.2.41 | Quadrupole (0.5 m) supports/ship | 70 | 4 | 8 | 150 | 70 |
| 1.2.42 | Quadrupole (0.5 m) alignment | 70 | 2 | 5 | 70 | 0 |
| 1.2.43 | Quadrupole (0.56 m) removal & refurbish | 287 | 5 | 50 | 600 | 2870 |
| 1.2.44 | Quadrupole (0.56 m) shipping | 287 | 4 | 8 | 400 | 0 |
| 1.2.45 | Quadrupole (0.56 m) installation | 287 | 8 | 60 | 287 | 0 |
| 1.2.46 | Quadrupole (0.56 m) PS+cables | 287 | 5 | 10 | 800 | 861 |
| 1.2.47 | Quadrupole (0.56 m) water cooling conn | 287 | 4 | 8 | 287 | 0 |
| 1.2.48 | Quadrupole (0.56 m) supports/ship | 287 | 4 | 8 | 400 | 287 |
| 1.2.49 | Quadrupole (0.56 m) alignment | 287 | 4 | 8 | 150 | 0 |
| 1.2.50 | Quadrupole (0.73 m) removal & refurbish | 138 | 5 | 40 | 200 | 1380 |
| 1.2.51 | Quadrupole (0.73 m) shipping | 138 | 3 | 6 | 250 | 0 |
| 1.2.52 | Quadrupole (0.73 m) installation | 138 | 6 | 40 | 138 | 0 |
| 1.2.53 | Quadrupole (0.73 m) PS+cables | 138 | 4 | 9 | 400 | 414 |
| 1.2.54 | Quadrupole (0.73 m) water cooling conn | 138 | 4 | 8 | 138 | 0 |
| 1.2.55 | Quadrupole (0.73 m) supports/ship | 138 | 4 | 8 | 300 | 81 |
| 1.2.56 | Quadrupole (0.73 m) alignment | 138 | 4 | 8 | 138 | 0 |
| 1.2.57 | Sextupole (0.25 m) removal & refurbish | 452 | 5 | 40 | 376 | 3400 |
| 1.2.58 | Sextupole (0.25 m) shipping | 452 | 3 | 6 | 452 | 0 |
| 1.2.59 | Sextupole (0.25 m) installation | 452 | 6 | 40 | 452 | 0 |
| 1.2.60 | Sextupole (0.25 m) PS+cables | 452 | 8 | 16 | 1000 | 900 |
| 1.2.61 | Sextupole (0.25 m) water cooling conn | 452 | 4 | 7 | 350 | 0 |
| 1.2.62 | Sextupole (0.25 m) supports/ship | 452 | 4 | 7 | 500 | 188 |
| 1.2.63 | Sextupole (0.25 m) alignment | 452 | 4 | 7 | 226 | 0 |
| 1.2.64 | Sextupole (0.6 m) removal & refurbish | 8 | 2 | 8 | 75 | 32 |
| 1.2.65 | Sextupole (0.6 m) shipping | 8 | 0 | 0 | 0 | 0 |
| 1.2.66 | Sextupole (0.6 m) installation | 8 | 2 | 3 | 16 | 0 |
| 1.2.67 | Sextupole (0.6 m) PS+cables | 8 | 2 | 4 | 50 | 35 |
| 1.2.68 | Sextupole (0.6 m) water cooling conn | 8 | 1 | 2 | 8 | 0 |
| 1.2.69 | Sextupole (0.6 m) supports/ship | 8 | 1 | 2 | 20 | 0 |
| 1.2.70 | Sextupole (0.6 m) alignment | 8 | 1 | 2 | 4 | 0 |
| 1.2.71 | Corrector (0.6 m) removal & refurbish | 600 | 5 | 10 | 400 | 900 |
| 1.2.72 | Corrector (0.3m) construction | 236 | 4 | 8 | 100 | 0 |
| 1.2.73 | Corrector (0.6 m) shipping | 836 | 0 | 0 | 100 | 0 |
| 1.2.74 | Corrector (0.6 m) installation | 836 | 2 | 6 | 418 | 0 |
| 1.2.75 | Corrector (0.6 m) power supplies+cables | 836 | 2 | 6 | 700 | 500 |
| 1.2.76 | Corrector (0.6 m) water cooling conn | 836 | 2 | 6 | 10 | 0 |
| 1.2.77 | Corrector (0.6 m) supports/ship | 836 | 2 | 6 | 836 | 100 |
| 1.2.78 | Corrector (0.6 m) alignment | 836 | 2 | 6 | 200 | 0 |
| 1.2.79 | Corrector (0.3m) construction | 236 | 4 | 8 | 236 | 0 |
| 1.2.80 | Wiggler (1 m) construction | 200 | 6 | 12 | 3000 | 0 |
| 1.2.81 | Wiggler (1 m) installation | 200 | 2 | 6 | 200 | 0 |
| 1.2.82 | Wiggler (1 m) power supplies+cables | 200 | 3 | 6 | 600 | 0 |
| 1.2.83 | Wiggler (1 m) water cooling conn | 200 | 1 | 2 | 400 | 0 |
| 1.2.84 | Wiggler (1 m) supports/ship | 200 | 2 | 6 | 400 | 0 |
| 1.2.85 | Wiggler (1 m) alignment | 200 | 2 | 6 | 200 | 0 |
| 1.2.86 | Pol dipole (2 m) construction | 8 | 4 | 8 | 300 | 0 |
| 1.2.87 | Pol dipole (2 m) installation | 8 | 2 | 4 | 50 | 0 |
| 1.2.88 | Pol dipole (2 m) power supplies+cables | 8 | 4 | 8 | 150 | 0 |
| 1.2.89 | Pol dipole (2 m) water cooling connection | 8 | 1 | 2 | 20 | 0 |
| 1.2.90 | Pol dipole (2 m) supports | 8 | 2 | 4 | 64 | 0 |
| 1.2.91 | Pol dipole (2 m) alignment | 8 | 1 | 2 | 10 | 0 |
| 1.2.92 | IR skew quad (0.5 m) refurb & ship | 24 | 2 | 4 | 30 | 120 |
| 1.2.93 | IR skew quad (0.5 m) installation | 24 | 1 | 2 | 15 | 0 |
| 1.2.94 | IR skew quad (0.5 m) power supply/cable | 24 | 2 | 4 | 76 | 0 |
| 1.2.95 | IR skew quad (0.5 m) water cooling conn | 24 | 1 | 2 | 24 | 0 |
| 1.2.96 | IR skew quad (0.5 m) supports | 24 | 2 | 4 | 50 | 0 |
| 1.2.97 | IR skew quad (0.5 m) alignment | 24 | 1 | 2 | 5 | 0 |
| 1.2.98 | Injection kickers refurb & installation | 4 | 4 | 8 | 400 | 1000 |
| 1.2.99 | Abort kicker refurb &installation | 2 | 2 | 4 | 100 | 500 |
| 1.3 | Vacuum system | 620 | 520 | 27600 | 14200 | |
| 1.3.01 | Engineering, design, and prototypes | 15 people | 480 | 240 | 750 | 0 |
| 1.3.02 | Vacuum extrusion | 2600 m | 3 | 6 | 1300 | 0 |
| 1.3.03 | Vacuum chamber machining | 2600 m | 24 | 48 | 5200 | 0 |
| 1.3.04 | Vacuum chamber assembly | 2600 m | 24 | 48 | 5200 | 0 |
| 1.3.05 | Vacuum chamber distributed pumps | 2600 m | 12 | 24 | 4600 | 0 |
| 1.3.06 | Vacuum chamber lumped pumps | 700 units | 12 | 24 | 1400 | 2100 |
| 1.3.07 | Vacuum chamber controls | 2600 m | 12 | 24 | 1000 | 2600 |
| 1.3.08 | Vacuum chamber installation | 4600 m | 12 | 24 | 2300 | 0 |
| 1.3.09 | Vacuum chamber refurbish and remove | 2000 m | 5 | 10 | 1000 | 9500 |
| 1.3.10 | Vacuum chamber shipping | 2000 m | 5 | 10 | 600 | 0 |
| 1.3.11 | Polarization vacuum chambers | 100 m | 8 | 16 | 1000 | 0 |
| 1.3.12 | Beam abort chambers | 2 units | 5 | 10 | 750 | 0 |
| 1.3.13 | IR high power vacuum chambers misc | 8 units | 8 | 16 | 1500 | 0 |
| 1.3.14 | ECI electrodes and controls | 500 units | 10 | 20 | 1000 | 0 |
| 1.4 | RF system | 272 | 304 | 22300 | 60000 | |
| 1.4.01 | Engineering, design, and prototypes | 10 people | 240 | 240 | 500 | 0 |
| 1.4.02 | RF stations refurbish & remove | 15 stations | 12 | 24 | 500 | 60000 |
| 1.4.03 | RF station shipping | 15 stations | 2 | 4 | 3000 | 0 |
| 1.4.04 | RF station install | 15 stations | 12 | 24 | 15000 | 0 |
| 1.4.05 | RF station new controls | 15 stations | 3 | 6 | 3000 | 0 |
| 1.4.06 | RF station HVPS pads | 15 stations | 3 | 6 | 300 | 0 |
| 1.5 | Interaction region | 370 | 478 | 10950 | 0 | |
| 1.5.01 | Engineering, design, and prototypes | 10 people | 240 | 240 | 500 | 0 |
| 1.5.02 | IP Be vacuum chamber | 2 units | 6 | 12 | 250 | 0 |
| 1.5.03 | IP Be vacuum bellows | 3 units | 2 | 4 | 200 | 0 |
| 1.5.04 | QD0H quadrupole (PM, 1.4 T, 0.46 m) | 2 units | 4 | 8 | 450 | 0 |
| 1.5.05 | QD0H quadrupole vacuum chamber | 2 units | 4 | 4 | 350 | 0 |
| 1.5.06 | QF1L quadrupole (SC, 0.4 m) | 2 units | 6 | 12 | 600 | 0 |
| 1.5.07 | QF1L quadrupole vacuum chamber | 2 units | 4 | 4 | 300 | 0 |
| 1.5.08 | Magic vacuum flange and remote act. | 2 units | 6 | 12 | 200 | 0 |
| 1.5.09 | Supports for QD0H and QF1 | 2 units | 3 | 6 | 250 | 0 |
| 1.5.10 | B00L magnet (0.4 m) | 2 units | 4 | 8 | 300 | 0 |
| 1.5.11 | QD0H (0.29 m) | 2 units | 3 | 6 | 400 | 0 |
| 1.5.12 | B00H (0.4 m) | 2 units | 3 | 6 | 250 | 0 |
| 1.5.13 | QF1H (0.4m) | 2 units | 3 | 6 | 400 | 0 |
| 1.5.14 | B0L (2 m) | 2 units | 3 | 6 | 300 | 0 |
| 1.5.15 | B0H (2 m) | 2 units | 3 | 6 | 300 | 0 |
| 1.5.16 | Forward support raft | 1 unit | 5 | 5 | 300 | 0 |
| 1.5.17 | Backward support raft | 1 unit | 5 | 5 | 300 | 0 |
| 1.5.18 | Cryogenic refrigerator | 1 unit | 3 | 6 | 700 | 0 |
| 1.5.19 | Croygenic distribution piping | 1 unit | 3 | 6 | 500 | 0 |
| 1.5.20 | Cryogenic controls | 1 unit | 3 | 4 | 300 | 0 |
| 1.5.21 | LN2 storage and distribution | 1 unit | 3 | 6 | 300 | 0 |
| 1.5.22 | H2O Cooling lines for IR components | 100 m | 3 | 6 | 250 | 0 |
| 1.5.23 | Water chillers for IR components | 4 units | 2 | 4 | 250 | 0 |
| 1.5.24 | Vacuum pump holding | 12 units | 2 | 3 | 200 | 0 |
| 1.5.25 | Vacuum holding controls and PS | 12 units | 2 | 3 | 100 | 0 |
| 1.5.26 | Vacuum pump TSPs | 20 units | 3 | 6 | 150 | 0 |
| 1.5.27 | Vacuum pump TSP controls and PS | 20 units | 3 | 6 | 150 | 0 |
| 1.5.28 | H2O temperature regulation | 10 units | 3 | 6 | 300 | 0 |
| 1.5.29 | Installation of IR components | +/- 10 m | 12 | 36 | 1500 | 0 |
| 1.5.30 | Alignment of IR components | +/- 10 m | 12 | 12 | 300 | 0 |
| 1.5.31 | Active vibration suppression for quads | 8 units | 12 | 24 | 300 | 0 |
| 1.6 | Controls, Diagnostics, Feedback | 963 | 648 | 12951 | 8750 | |
| 1.6.01 | Engineering, design, and prototypes | 15 people | 480 | 240 | 600 | 0 |
| 1.6.02 | Beam position monitor electronics | 1000 units | 24 | 48 | 2000 | 0 |
| 1.6.03 | Beam position monitor cables | 20000 m | 24 | 48 | 2000 | 0 |
| 1.6.04 | Master control computer | 2 each | 2 | 4 | 200 | 0 |
| 1.6.05 | Local computers | 14 each | 5 | 10 | 200 | 0 |
| 1.6.06 | Network and routers | 14 each | 5 | 10 | 400 | 0 |
| 1.6.07 | Control software | 6 people | 288 | 24 | 200 | 0 |
| 1.6.08 | Interface electronics | 500 units | 24 | 48 | 500 | 0 |
| 1.6.09 | Synchrotron light monitors (xray) | 2 units | 6 | 12 | 1500 | 1000 |
| 1.6.10 | Data storage | 1000 Gbit | 2 | 4 | 20 | 0 |
| 1.6.11 | Long fdbk kicker-electronics refurbish | 6 units | 12 | 24 | 500 | 2000 |
| 1.6.12 | Long fdbk shipping | 6 units | 1 | 1 | 100 | 0 |
| 1.6.13 | Trans fdbk kicker-electronic refurbish | 6 units | 12 | 24 | 500 | 2000 |
| 1.6.14 | Trans fdbk shipping | 6 units | 1 | 1 | 100 | 0 |
| 1.6.15 | Installation BxB feedback systems | 8 units | 6 | 12 | 150 | 0 |
| 1.6.16 | ECI monitors | 4 units | 6 | 12 | 50 | 0 |
| 1.6.17 | Bunch current monitors refurbish | 2 units | 2 | 4 | 20 | 300 |
| 1.6.18 | Bunch current monitors ship | 2 units | 1 | 1 | 20 | 0 |
| 1.6.19 | Bunch current monitors install | 2 units | 4 | 8 | 100 | 0 |
| 1.6.20 | Bunch length monitors refurbish | 2 units | 1 | 2 | 20 | 600 |
| 1.6.21 | Bunch length monitors ship | 2 units | 1 | 2 | 10 | 0 |
| 1.6.22 | Bunch length monitors install | 2 units | 3 | 6 | 80 | 0 |
| 1.6.23 | Luminosity monitor refurbish | 1 unit | 1 | 2 | 20 | 200 |
| 1.6.24 | Luminosity monitor ship | 1 unit | 1 | 2 | 10 | 0 |
| 1.6.25 | Luminosity monitor install | 1 unit | 3 | 6 | 100 | 0 |
| 1.6.26 | Polarization monitor | 1 unit | 12 | 24 | 1000 | 0 |
| 1.6.27 | RF master oscillator | 1 unit | 3 | 6 | 50 | 0 |
| 1.6.28 | Timing generator | 1 unit | 3 | 6 | 50 | 0 |
| 1.6.29 | Bunch injection controller | 1 unit | 3 | 6 | 50 | 0 |
| 1.6.30 | Loss monitors refurbish | 300 units | 1 | 2 | 100 | 900 |
| 1.6.31 | Loss monitors ship | 300 units | 1 | 1 | 150 | 0 |
| 1.6.32 | Loss monitors install | 300 units | 3 | 6 | 200 | 0 |
| 1.6.33 | IR background detectors refurbish | 30 units | 1 | 1 | 25 | 250 |
| 1.6.34 | IR background detectors ship | 30 units | 1 | 1 | 50 | 0 |
| 1.6.35 | IR background detectors install | 30 units | 3 | 6 | 80 | 0 |
| 1.6.36 | Fast IP position fdbk refurbish | 6 units | 1 | 2 | 10 | 200 |
| 1.6.37 | Fast IP position fdbk ship | 6 units | 1 | 2 | 20 | 0 |
| 1.6.38 | Fast IP position fdbk install | 6 units | 4 | 8 | 80 | 0 |
| 1.6.39 | Temp sensors for ring components | 2000 units | 5 | 10 | 666 | 1000 |
| 1.6.40 | Polarization controls | 1 unit | 5 | 10 | 1000 | 300 |
| 1.6.41 | IP HOM monitors | 1 unit | 1 | 2 | 20 | 0 |
| 1.7 | Injection and transport systems | 426 | 252 | 86600 | 18000 | |
| 1.7.01 | Engineering, design, and prototypes | 10 people | 360 | 120 | 600 | 0 |
| 1.7.02 | Injection e- gun | 12 | 24 | 2000 | 2000 | |
| 1.7.03 | Positron target and capture region | 12 | 24 | 2000 | 3000 | |
| 1.7.04 | 6 GeV Linac | 12 | 24 | 50000 | 5000 | |
| 1.7.05 | 2 x 1 GeV damping ring | 12 | 24 | 20000 | 3000 | |
| 1.7.06 | Two injection transport lines | 12 | 24 | 10000 | 3000 | |
| 1.7.07 | Polarization manipulation for injection | 6 | 12 | 2000 | 2000 |
Site and Utilities
The estimated cost of the site and utilities for the Super project is presented in Table LABEL:tab:cost_site. This cost depends significantly on the site choice.
| Number | EDIA | Labor | M&S | Rep.Val. | ||
|---|---|---|---|---|---|---|
| WBS | Item | Units | mm | mm | kEuro | kEuro |
| 2.0 | Site | 1424 | 1660 | 105700 | 0 | |
| 2.1 | Site Utilities | 820 | 1040 | 31700 | 0 | |
| 2.1.01 | Engineering, design, and prototypes | 10 people | 360 | 120 | 500 | 0 |
| 2.1.02 | Cooling towers | 3x10 MW ea | 30 | 60 | 6000 | 0 |
| 2.1.03 | Water pump pads | 3 each | 12 | 24 | 2000 | 0 |
| 2.1.04 | Water pumps | 20 pumps | 12 | 24 | 1000 | 0 |
| 2.1.05 | Water piping | 10000 m | 200 | 400 | 10000 | 0 |
| 2.1.06 | Power transformers | 3x10 MW ea | 50 | 100 | 3000 | 0 |
| 2.1.07 | Stepdown transformers | 12 at 500 KW ea | 50 | 100 | 1200 | 0 |
| 2.1.08 | Power AC wiring | 10 km | 100 | 200 | 5000 | 0 |
| 2.1.09 | Air conditioning for support halls | 6 buildings | 6 | 12 | 3000 | 0 |
| 2.2 | Tunnel and Support Buildings | 604 | 620 | 74000 | 0 | |
| 2.2.01 | Engineering, design, and prototypes | 10 people | 360 | 120 | 500 | 0 |
| 2.2.02 | Ring tunnel boring | 2300 m | 150 | 300 | 35000 | 0 |
| 2.2.03 | Ring tunnel equipment alcoves | 6 ea mid-arc | 12 | 25 | 3000 | 0 |
| 2.2.04 | Ring cable and RF shafts | 12 each | 12 | 25 | 3000 | 0 |
| 2.2.05 | Straight equipment halls | 3x350 sq-m | 15 | 40 | 15000 | 0 |
| 2.2.06 | Interaction region hall | 500 sq-m | 25 | 50 | 10000 | 0 |
| 2.2.07 | Linac tunnel and beam transport lines | 500 m | 30 | 60 | 7500 | 0 |
| 2.2.08 | Linac technical support gallery | 2000 sq-m | 30 | 60 | 7000 | 0 |
2 Detector
The Super detector uses for the most part the same technology used for BABAR. The cost, detailed in Table LABEL:tab:cost_detector broken down for detector subsystem, is therefore in general a direct extrapolation of BABAR costs. Where different or updated technology is used, the basis of estimate is detailed in the following paragraphs. As discussed in the Chapter 3, the Super detector is not completely defined: some components, such as the forward PID and the backward calorimeter, have overall integration and performance implications that need to be carefully studied before deciding to install them; for some other components, such the SVT layer 0 or the DIRC readout, new promising technologies exist that require additional R&D before they can be used in a full scale detector. The cost estimate lists the different technologies separately, but in the rolled-up value the technology that is considered most likely to be used is included. The ones that are not included in the rolled-up value are shown in italics in the table.
| EDIA | Labor | M&S | Rep.Val. | ||
|---|---|---|---|---|---|
| WBS | Item | mm | mm | kEuro | kEuro |
| 1 | SuperB detector | 3391 | 1873 | 40747 | 46471 |
| 1.0 | Interaction region | 10 | 4 | 210 | 0 |
| 1.0.1 | Be Beampipe | 10 | 4 | 210 | 0 |
| 1.0.1.1 | Vertex chamber design | 4 | 0 | 0 | 0 |
| 1.0.1.2 | Finalize Physics Req.mnts | 1 | 0 | 0 | 0 |
| 1.0.1.3 | Fab method | 1 | 0 | 0 | 0 |
| 1.0.1.4 | Design Review | 1 | 0 | 0 | 0 |
| 1.0.1.5 | Chamber detailing | 2 | 0 | 0 | 0 |
| 1.0.1.6 | Support procurement | 2 | 0 | 4 | 0 |
| 1.0.1.7 | Procure Beampipe Assembly | 0 | 0 | 197 | 0 |
| 1.0.1.8 | Procure Vx chamber Misc parts | 0 | 0 | 9 | 0 |
| 1.0.1.9 | Assemble Vx chamber, test, clean | 0 | 2 | 0 | 0 |
| 1.0.1.A | Assemble Vx chamber fixtures | 0 | 2 | 0 | 0 |
| 1.1 | Tracker (SVT + L0 MAPS) | 248 | 348 | 5615 | 0 |
| 1.1.1 | SVT | 142 | 317 | 4380 | 0 |
| 1.1.1.1 | Mechanical | 14 | 186 | 313 | 0 |
| 1.1.1.2 | Cooling | 4 | 5 | 72 | 0 |
| 1.1.1.3 | Silicon Wafers and Fanout | 37 | 107 | 3240 | 0 |
| 1.1.1.4 | On-detector electronics | 69 | 11 | 672 | 0 |
| 1.1.1.5 | Detector monitoring | 4 | 4 | 73 | 0 |
| 1.1.1.6 | Detector assembly | 2 | 4 | 0 | 0 |
| 1.1.1.7 | System Engineering | 36 | 0 | 20 | 0 |
| 1.1.2 | L0 Striplet option | 23 | 33 | 324 | 0 |
| 1.1.2.1 | Mechanical | 7 | 17 | 3 | 0 |
| 1.1.2.2 | Cooling | 2 | 1 | 6 | 0 |
| 1.1.2.3 | Silicon Wafers and Fanout | 10 | 15 | 257 | 0 |
| 1.1.2.4 | On-detector electronics | 5 | 1 | 58 | 0 |
| 1.1.3 | L0 MAPS option | 106 | 32 | 1235 | 0 |
| 1.1.3.1 | Mechanical | 12 | 18 | 75 | 0 |
| 1.1.3.2 | Cooling | 2 | 2 | 20 | 0 |
| 1.1.3.3 | MAPS Modules Components | 92 | 12 | 1140 | 0 |
| 1.2 | DCH | 113 | 104 | 2862 | 0 |
| 1.2.1 | System engineering | 24 | 0 | 50 | 0 |
| 1.2.2 | Endplates | 14 | 0 | 550 | 0 |
| 1.2.3 | Inner cylinder | 4 | 0 | 157 | 0 |
| 1.2.4 | Outer cylinder | 4 | 0 | 100 | 0 |
| 1.2.5 | Wire | 3 | 0 | 242 | 0 |
| 1.2.6 | Feedthroughs | 9 | 10 | 345 | 0 |
| 1.2.A | Gas System | 4 | 8 | 50 | 0 |
| 1.2.B | Test | 3 | 6 | 40 | 0 |
| 1.3 | PID (DIRC Pixelated PMTs + TOF) | 110 | 222 | 7953 | 6728 |
| 1.3.1 | DIRC barrel - Pixelated PMTs | 78 | 152 | 4527 | 6728 |
| 1.3.1.1 | Radiator Support Structure | 0 | 0 | 0 | 2372 |
| 1.3.1.2 | Radiator Bars and Assemblies | 3 | 5 | 2245 | 4256 |
| 1.3.1.3 | Standoff box | 4 | 8 | 655 | 0 |
| 1.3.1.4 | Detector | 18 | 32 | 1590 | 0 |
| 1.3.1.5 | Calibration System | 1 | 3 | 19 | 0 |
| 1.3.1.6 | Mechanical Utilities | 4 | 8 | 19 | 100 |
| 1.3.1.7 | System Integration | 48 | 96 | 0 | 0 |
| 1.3.1 | DIRC barrel - Focusing DIRC | 92 | 179 | 6959 | 6728 |
| 1.3.1.1 | Radiator Support Structure | 0 | 0 | 0 | 2372 |
| 1.3.1.2 | Radiator Bars and Assemblies | 5 | 8 | 2806 | 4256 |
| 1.3.1.3 | Standoff box | 4 | 8 | 655 | 0 |
| 1.3.1.4 | Detector | 18 | 32 | 3461 | 0 |
| 1.3.1.5 | Calibration System | 1 | 3 | 19 | 0 |
| 1.3.1.6 | Mechanical Utilities | 4 | 8 | 19 | 100 |
| 1.3.1.7 | System Integration | 60 | 120 | 0 | 0 |
| 1.3.2 | Forward TOF | 32 | 70 | 3426 | 0 |
| 1.3.2.1 | Support structure | 3 | 3 | 75 | 0 |
| 1.3.2.2 | Radiator/Detector box | 6 | 10 | 220 | 0 |
| 1.3.2.3 | Detector | 5 | 18 | 3010 | 0 |
| 1.3.2.4 | Calibration System | 0 | 3 | 21 | 0 |
| 1.4 | EMC | 136 | 222 | 10095 | 30120 |
| 1.4.1 | Barrel EMC | 20 | 5 | 171 | 30120 |
| 1.4.1.1 | Crystal Procurement | 0 | 0 | 0 | 20560 |
| 1.4.1.2 | Light Sensors & Readout | 0 | 0 | 0 | 2570 |
| 1.4.1.3 | Crystal Support Modules | 0 | 0 | 0 | 2824 |
| 1.4.1.4 | Barrel Structure | 0 | 0 | 0 | 3306 |
| 1.4.1.5 | Calibration Systems | 0 | 0 | 0 | 625 |
| 1.4.1.6 | Project Management | 0 | 0 | 0 | 233 |
| 1.4.1.7 | Barrel Transport | 20 | 5 | 171 | 0 |
| 1.4.2 | Forward EMC | 73 | 152 | 6828 | 0 |
| 1.4.2.1 | Crystal Procurement | 11 | 44 | 5542 | 0 |
| 1.4.2.2 | Light Sensors & Readout | 23 | 31 | 460 | 0 |
| 1.4.2.3 | Crystal Support Modules | 19 | 59 | 316 | 0 |
| 1.4.2.4 | Endcap Structure | 15 | 17 | 357 | 0 |
| 1.4.2.5 | Calibration Systems | 2 | 1 | 101 | 0 |
| 1.4.2.6 | Project Management | 4 | 0 | 53 | 0 |
| 1.4.3 | Backward EMC | 42 | 65 | 3096 | 0 |
| 1.4.3.1 | Crystal Procurement | 1 | 8 | 2446 | 0 |
| 1.4.3.2 | Light Sensors & Readout | 4 | 17 | 199 | 0 |
| 1.4.3.3 | Crystal Support Modules | 8 | 31 | 226 | 0 |
| 1.4.3.4 | Endcap Structure LSO | 9 | 8 | 149 | 0 |
| 1.4.3.5 | Extended Barrel Structure CsI | 17 | 11 | 106 | 0 |
| 1.4.3.6 | Calibration Systems | 1 | 1 | 48 | 0 |
| 1.5 | IFR (scintillator) | 56 | 54 | 1268 | 0 |
| 1.5.1 | System engineering | 24 | 0 | 0 | 0 |
| 1.5.2 | scintillator strips + WLS fiber | 0 | 0 | 320 | 0 |
| 1.5.3 | Module factory retooling | 0 | 3 | 15 | 0 |
| 1.5.4 | Module fabrication | 0 | 27 | 68 | 0 |
| 1.5.5 | module installation | 0 | 0 | 14 | 0 |
| 1.5.6 | APD/preamp + cooling system | 5 | 0 | 663 | 0 |
| 1.5.7 | Services | 3 | 6 | 14 | 0 |
| 1.5.8 | LED pulser system | 0 | 0 | 24 | 0 |
| 1.5.9 | Detector Assembly | 24 | 18 | 151 | 0 |
| 1.6 | Magnet | 87 | 47 | 1545 | 9623 |
| 1.6.0 | System Management | 36 | 0 | 0 | 577 |
| 1.6.1 | Superconducting solenoid | 0 | 0 | 0 | 2282 |
| 1.6.2 | Mag. Power/Protection | 0 | 0 | 0 | 171 |
| 1.6.3 | Cryogenics | 34 | 36 | 1377 | 0 |
| 1.6.4 | Cryo monitor/Control | 17 | 11 | 168 | 0 |
| 1.6.5 | Flux return | 0 | 0 | 0 | 6108 |
| 1.6.6 | Installation/test equipment | 0 | 0 | 0 | 485 |
| 1.7 | Electronics | 286 | 213 | 5565 | 0 |
| 1.7.1 | SVT | 11 | 21 | 343 | 0 |
| 1.7.2 | DCH | 53 | 47 | 1203 | 0 |
| 1.7.3 | DRC | 22 | 0 | 1491 | 0 |
| 1.7.4 | Forward PID | 43 | 0 | 702 | 0 |
| 1.7.5 | EMC | 44 | 69 | 907 | 0 |
| 1.7.6 | IFR | 0 | 64 | 141 | 0 |
| 1.7.7 | Infrastructure | 4 | 12 | 247 | 0 |
| 1.7.8 | Systems Engineering | 12 | 0 | 0 | 0 |
| 1.7.9 | Trigger | 97 | 0 | 532 | 0 |
| 1.8 | Online computing | 1272 | 34 | 1624 | 0 |
| 1.8.1 | DAQ | 420 | 22 | 163 | 0 |
| 1.8.2 | Event Flow | 258 | 0 | 1177 | 0 |
| 1.8.3 | Run Control / Slow Controls | 258 | 0 | 51 | 0 |
| 1.8.4 | Infrastructure | 48 | 12 | 234 | 0 |
| 1.8.5 | Software Triggers | 216 | 0 | 0 | 0 |
| 1.8.6 | Coordination and Commissioning | 72 | 0 | 0 | 0 |
| 1.9 | Installation and integration | 353 | 624 | 3830 | 0 |
| 1.9.1 | Disassembly | 95 | 161 | 510 | 0 |
| 1.9.2 | Assembly | 222 | 463 | 3320 | 0 |
| 1.9.3 | Structural analysis | 36 | 0 | 0 | 0 |
| 1.A | Project Management | 720 | 0 | 180 | 0 |
| 1.A.1 | Project engineering | 300 | 0 | 100 | 0 |
| 1.A.2 | Budget, Schedule and Procurement | 300 | 0 | 40 | 0 |
| 1.A.3 | ES & H | 120 | 0 | 40 | 0 |
Vertex Detector and Tracker
System cost is estimated based on the experience of the BABAR detector. A detailed estimate is provided for the cost of the main detector (layers-1 to 5), while the layer-0 is analyzed separately, with two different estimates provided, corresponding to the striplets and the monolithic pixel option. The total cost is obtained summing the main detector cost to the MAPS layer0 cost.
Drift Chamber
The DCH costing is based on an extrapolation of the costs for the existing BABAR chamber, assuming the Super design to be comparable. In particular, assuming the number of cells will be similar, many other requirements, such as the length of wire, number of feedthroughs, duration of wire stringing, etc., can be reliably estimated. Given the more challenging luminosity related backgrounds, we assume that the endplates will be conical in shape and fabricated from carbon fiber composites. This will add a significant period of R&D to develop the relevant fabrication techniques, include engineering support, but will probably not result in significantly larger production costs for the final endplates.
Particle Identification
Barrel PID costs and replacement values are derived from BABAR costs as extrapolated to 2007, except that photon detector costs are taken directly from tube manufacturers’ preliminary quotes. A number of different options for Barrel DIRC upgrades are discussed in the detector section. The base option costed uses new pixilated tubes to allow a small, robust detection box for the Barrel DIRC without water coupling, and a forward TOF PID system. A focusing DIRC option with better performance in the barrel is estimated separately, but not summed into the total. The forward TOF PID system cost is expected to be dominated by the cost of the MCP photon detectors, as estimated by the manufacturer (Burle/Photonis).
Electromagnetic Calorimeter
Electromagnetic calorimeter costs use as their basis expenditures made in construction of the BABAR barrel EMC. The reuse value of the barrel calorimeter is based on the actual cost of the barrel escalated for inflation from the time of construction to the current year. Manpower estimates for the barrel construction were obtained by using the costs for ED&I and Labor, knowledge of the mix of engineers and technicians who contributed to the design and fabrication of individual components, and knowledge of the their salaries. Manpower and costs for engineering and tooling required for the removal and transport of the barrel EMC from SLAC are engineering estimates. The costs and manpower for barrel construction, combined with knowledge of current prices for cost-driver materials, are used to estimate the costs of and manpower needs for forward and backward endcap construction. Cost drivers are crystal procurement, light sensors, and support structures. For the crystals, a strawman layout provides the volume of material needed. Current fabrication prices for full sized crystals are used to obtain materials costs based on this volume. Ancillary costs/manpower needs for vendor development, facility preparation, and crystal Q/C are obtained by scaling barrel costs for the same items, typically by crystal count. Light sensor costs are obtained by use of BABAR sensor costs escalated for inflation, as well as costs of more recent vendor cost estimates. Ancillary costs and manpower estimates are again obtained from scaling the BABAR barrel actuals by crystal count in the barrel and strawman endcap. Estimates for costs and manpower for structures are also obtained from barrel calorimeter experience: for the crystal support structure, barrel module actuals are scaled by crystal count to obtain endcap crystal module estimates; for the overall endcap support structure, scaling is more closely tied to relative solid angle. Backward endcap EMC cost and manpower estimates are, because of the sketchy nature of design concepts, less reliable than those for the forward endcap, though the methodology used for the backward endcap is similar to that of the forward endcap.
Instrumented Flux Return
The Instrumented Flux Return costs are based on the experience developed for the upgrade of the BABAR barrel IFR subdetector in 2002 when a scintillator option for BABAR was developed.
Electronics
The cost for the Electronics subsystems were estimated with a combination of scaling from the BABAR experience and from direct estimates. Infrastructure, high and low voltage, and other items expected to be similar to those used in BABAR were estimated by scaling the costs from BABAR. The readout systems for the DCH, EMC and DIRC, where the higher data rates require redesigned electronics, were estimated from the number of different ASICs and printed circuit boards, and the associated chip and board count. The block diagram design of the readout electronics for these detectors was based on the BABAR experience, and the cost estimates also reflects that basis. While any new design would aim to make the readout systems as uniform as possible across these systems, no associated cost savings was assumed.
Trigger and DAQ
The labor and EDIA costs for online computing and DAQ are largely based on extrapolation from the actual BABAR experience, with some modifications based on ”lessons learned” – in particular, shifting some work on feature extraction from detector subsystems to the core online computing group.
The hardware cost estimates for online computing are based on the current prices of hardware necessary to build the system, with the assumption that Moore’s Law will result in future systems with the same unit costs but higher performance (except in the case of networking equipment, where current performance is sufficient for the design).
The cost estimates for DAQ are based on estimates from the SLAC PPA electronics group of the current costs for the ”CE” electronics building blocks they are now building for other SLAC projects, which we have assumed as the core elements of the Super DAQ.
A more detailed discussion of considerations in the estimation of online computing costs can be found in Section 10
Computing
Costing the (offline) computing system is different from the other detector subsystems for two reasons:
-
1.
There is no precise “construction phase”. Instead computing is best regarded as a continuous operating expense, through the life of the experiment. As additional data is accumulated, additional computing resources are required. This is true as well for the engineering and support required as the system evolves in time.
-
2.
The cost per unit of computing is a strong function of time, due to the “Moore’s law” effect in computing performance. Assumptions on what year the experiment starts have a significant impact on cost estimates.
In addition, the computing model is distributed, and it may be assumed that many of the costs are also borne in a distributed fashion. Nevertheless, substantial computing resources are required, and it is important to give an indication of the overall costs. It should also be noted that data recording and monitoring infrastructure needs to be localized at the accelerator site and must be fully functional when data taking begins.
Table 4 shows estimated annual costs for two different assumptions for the year of first data. All numbers are given in 2007 kEuros. It is assumed that the first major computing investment occurs in the year prior to first data. Tape silos and drives are constant cost per unit items; the differences in cost for these lines in the two starting year models is due to the evolving tape density.
| Luminosity (ab-1) | 0 | 2 | 6 | 12 | 12 |
|---|---|---|---|---|---|
| Year | 2010 | 2011 | 2012 | 2013 | 2014 |
| Tapes | 19 | 171 | 314 | 677 | 323 |
| Tape drives | 24 | 213 | 393 | 846 | 404 |
| Tape silos | 270 | 270 | 270 | 539 | 270 |
| Disk | 58 | 345 | 1031 | 1569 | 1410 |
| CPU | 140 | 841 | 1888 | 2232 | 1095 |
| Replacements | 0 | 0 | 0 | 0 | 33 |
| Total | 510 | 1840 | 3895 | 5863 | 3533 |
| Year | 2011 | 2012 | 2013 | 2014 | 2015 |
| Tapes | 19 | 85 | 314 | 271 | 323 |
| Tape drives | 24 | 107 | 393 | 338 | 404 |
| Tape silos | 270 | 270 | 270 | 270 | 270 |
| Disk | 38 | 230 | 696 | 1046 | 940 |
| CPU | 93 | 561 | 1274 | 1488 | 730 |
| Replacements | 0 | 0 | 0 | 0 | 22 |
| Total | 444 | 1253 | 2947 | 3413 | 2687 |
Transportation, installation, and commissioning
Installation and commissioning estimates, including disassembling and reassembling BABAR are based on the BABAR experience, using a detail schedule of activities and corresponding manpower requirement.
Although transportation costs are expected to be significant, they are not included in this estimates, because of lack of detailed information at the time of writing.
3 Schedule
The accelerator and detector construction schedule is shown in Fig. 1. The present PEP-II accelerator (2.2 with two rings) was built in about four years, but the tunnel already existed. For the Super schedule, we have added an additional year for tunnel and support building construction. The construction starts with environmental, design finalization, and contract bidding. The accelerator infrastructure is constructed with a phased approach, moving around the ring. The accelerator components are installed, again with a phased approach around the ring followed by system checkout . Finally, beam commissioning starts, as well as first beam collisions. The detector schedule is dominated by the time required to disassemble the BABAR detector, transport it to the new site, and reassemble it. The total construction and commissioning time is estimated to be a little over 5 years.

References
-
[1]
NASA Inflation Calculator,
http://cost.jsc.nasa.gov/inflation/nasa/inflateNASA.html -
[2]
Federal Reserve Foreign Exchange Rates,
http://www.federalreserve.gov/releases/g5a/
Chapter 5 Appendix
Appendix 5.A Lattice QCD Calculations
The New Physics discovery potential of a Super Factory depends on our capability to control the theoretical determination of hadronic matrix elements at a level of accuracy comparable to that to be achieved by the experimental measurements. For most of the hadronic parameters relevant to flavour physics the precision necessary to fulfill such a requirement is at the level of few percent or better.
Lattice QCD is the theoretical tool of choice to compute hadronic quantities. Being based on first principles, it does not introduce additional free parameters besides the fundamental couplings of QCD, namely the strong coupling constant and the quark masses. In addition, all systematic uncertainties affecting the results of lattice calculations can be systematically reduced in time, with the continuously increasing availability of computing power. The development of new algorithms and of new theoretical techniques further speeds up the process of improving precision.
In spite of the appealing features of the lattice approach, the accuracy currently reached in the determination of the hadronic matrix elements is typically at the level of –, i.e. by far larger than the percent precision required to match the experimental accuracy at Super. For many years, the lack of sufficient computing power has prevented the possibility of performing “full QCD” simulations, and forced the introduction of the so-called quenched approximation. In this approximation an error is introduced which, besides being process dependent, is also difficult to reliably estimate. This is the main reason why, for most of the relevant observables, the accuracy of the lattice results has not improved significantly in the last ten years or so.
In order to assess the impact of Super on our understanding of quark flavour physics, in this section we attempt to estimate the precision that will be reached by lattice QCD calculations at the time when such a machine could be running and producing results. This estimate is unavoidably affected by some uncertainties. The dominant sources of errors in lattice QCD calculations have systematic origin, so that the accuracy of the results does not improve in time according to simple scaling laws. Predictions in this context are necessarily based on somehow educated guesses, and it should be taken into account that their reliability decreases the more we attempt to go further in time.
In the following analysis we are going to neglect the impact of algorithmic improvements and of the development of new theoretical techniques. Past experience indicates that this effect is actually far from being negligible. The role played by theoretical developments in improving the accuracy of lattice QCD calculations has been as important, to date, as the increase of computational power. In the last few years, for instance, the improvement of Monte Carlo algorithms for unquenched calculations has allowed to speed up the simulations by order of magnitudes, and to simulate light quarks with masses much closer to their physical values. At the same time, however, the impact of future theoretical improvements is difficult to predict. For this reason, we will neglect its effect in this study and we will conservatively only take into account the increase of precision in lattice QCD calculations which is expected by the increase of computational power.
1 Estimate of Computational Power
At variance with other ingredients in the present analysis, the increase with time of the computational power can be predicted with rather good reliability, since it is found to follow closely a simple scaling law. This is illustrated in Fig. 1, which shows the performances of the 500 most powerful computer systems in the world as a function of the year. From this plot it can be seen that, at present, the most powerful computer system in the world, an IBM BlueGene/L system installed at the Lawrence Livermore National Laboratory, has a sustained speed of 280.6 TFlops, while the 500th in the list has a speed of about 1.6 TFlops. The performances of typical computer systems available for lattice QCD calculation today are in the range between 1 and 10 TFlops, thus entering the lower part of the top-500 list. Fig. 1 then allows us to derive a prediction for the computer power available to a lattice QCD collaboration around year 2015. The typical sustained speed will be between 1 and 10 PFlops, i.e., three orders of magnitude faster than what we have today.
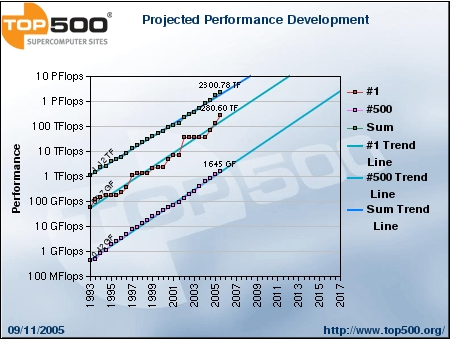
2 Sources of Errors in Lattice QCD Calculations
Uncertainties in lattice QCD calculations have both statistical and systematic origin. We now briefly discuss these errors with the aim of understanding their relevance in future simulations.
-
-
Statistical error: this error arises from the fact that the functional integral expressing any correlation function in quantum field theory is approximated, in numerical simulations, by a sum over a finite number of gauge field configurations, weighted with their proper Boltzmann factor. Typical results of lattice calculations are obtained at present by averaging over (or more) independent gauge configurations, and the resulting statistical errors are at the level of a few percent or better.
-
-
Discretization errors: numerical simulations are performed on lattices with finite lattice spacing , and an extrapolation to the continuum limit is required to get the physical result. In order to keep the uncertainty due to this extrapolation under control, it is important to work with lattices as fine as possible. However, for a given spatial or temporal extension of the lattice, the number of sites, , increases when approaching the continuum limit, thus increasing the overall cost of the simulation. Typical values of the lattice spacing used in current simulations are around fm or smaller.
-
-
Chiral extrapolation: the inversion of the Dirac operator, required to generate the gauge field configurations and to compute quark propagators, becomes critical when approaching the chiral limit. This is due to presence of exact zero modes in this limit, the pseudoscalar Goldstone bosons of QCD. For this reason, the cost of numerical simulation increases with decreasing values of the light quark masses. The values of light quark masses reached in current simulations are in the range , where is the physical strange quark mass and is the simulated average up-down quark mass. Eventually, a chiral extrapolation is thus required in order to bring the simulated light quark masses to agreement with their physical values, . The chiral extrapolation introduces a systematic uncertainty which is obviously smaller for lighter values of the simulated quark masses.
-
-
Heavy quark extrapolation: the mass of the quark, , is larger than the UV cutoff in current lattice simulations, since GeV. Thus discretization effects, which are controlled by powers of , prevent the possibility of simulating directly the quark on the lattice. Different approaches have been considered to circumvent this problem. A viable method passes through the introduction of effective field theories, either HQET or NRQCD, in which the heavy quark degrees of freedom are explicitly integrated out. Another possibility consists in considering specific discretizations of the heavy quark action on the lattice, constructed in such a way that discretization errors, of , have coefficients suppressed by additional powers of the lattice spacing [2, 3, 4]. Finally, one can simulate heavy quarks with masses around the charm quark mass, for which , and extrapolate the results to the quark mass. Each of these approaches has its advantages and drawbacks. A reliable estimate of the associated systematic uncertainties can only be achieved by comparing the results obtained using different approaches. The accuracy can be also increased by combining different approaches. For instance, the extrapolation of the results obtained in the charm quark mass region can be combined with the HQET determination of the same observable in the infinite quark mass limit to interpolate to the -quark mass.
-
-
Finite volume effects: numerical simulations are performed on the lattice with finite spatial and temporal extension. Therefore, they are affected by finite size effects that must be kept under control. For a fixed value of the lattice spacing, the number of lattice sites increases with the physical size of the lattice, and with this number also increases the computational cost of the simulation. Since finite volume effects are larger for smaller values of the hadron masses (because the Compton wavelength of a particle increases with the inverse of its mass), the cost limitations on the lattice size also reflect on the values of the lightest quark masses that can be considered in a simulation.
-
-
Renormalization procedure: the direct outcomes of a lattice calculation are bare values of correlation functions which require to be renormalized in order to be related to the physical observables. The asymptotic freedom of QCD allows the computation of the relevant renormalization constants, which are connected to the UV properties of the theory, using the perturbative expansion. However, also because of the technical difficulties of lattice perturbation theory, the perturbative series are truncated at a typically low order (first or second), thus introducing a systematic uncertainties which is often far from being negligible. This uncertainty can be however removed using various non-perturbative renormalization techniques, which have been developed in the last ten years and can be applied in most of the relevant cases. At present, the typical accuracy reached in the non-perturbative determination of lattice renormalization constants is already at the level of 1% or better. One expects that this accuracy will be further improved, so that it is unlikely that the renormalization procedure will represent one of the relevant limiting factors in improving the precision of lattice results in the next years.
3 Uncertainties in Future Lattice Calculations
Having discussed the various sources of systematic uncertainties in lattice QCD calculations, we now proceed to derive the constraints on the parameters of a numerical simulation (values of the lattice spacing, quark masses and lattice size) which have to be satisfied in order to keep the systematic errors at the level of accuracy required to match the experimental precision of a Super Factory. For definitiveness, we will require such a precision to be 1% for the simplest hadronic quantities (e.g. pseudoscalar decay constants and bag parameters).
Minimum Lattice Spacing
The result for a given observable , obtained on the lattice at a fixed value of the lattice spacing, is related to its continuum counterpart by an expansion of the form
| (1) |
where the parameters , , , for observables involving only light quarks, are of the order of the hadronic scale . In the presence of heavy quarks, instead, the dominant discretization effects are determined by the heavy quark mass, i.e. . In Eq. (1) we have assumed that the fermionic action chosen in the simulation belongs to the class of the so-called -improved actions, implying the absence in the expansion of the leading discretization effect of . As for the power of the subleading correction in Eq. (1), its value depends again on the choice of the action, and one has for -improved Wilson quarks and for maximally twisted, staggered and Ginsparg-Wilson fermions.
In order to estimate the size of discretization effects left over in a lattice calculation after the continuum extrapolation has been performed, we will consider an heuristic argument [5] which, besides being very simple, it is also expected to provide a conservative estimate. In other words, we expect that the error evaluated in this way can possibly be overestimated but it is unlikely to be underestimated.
The argument assumes that lattice simulations are performed at only two values of the lattice spacing, namely and , and that the results for are linearly extrapolated in to get a determination of the physical observable . Eq. (1) can be then used to evaluate the error introduced in the extrapolation due to the fact that the next-to-leading order term in the series, , has been neglected. A simple calculation gives:
| (2) |
Requiring the precision of the calculation to be at the level of 1%, i.e. imposing , provides the minimum value of the lattice spacing that has to be considered in the simulation. In the presence of light quarks only, by conservatively assuming GeV, one finds
| (3) |
For studies with heavy quarks with masses around the charm quark mass, GeV and one gets
| (4) |
For comparison, we recall that typical values of lattice spacing used in current lattice simulations are in the range fm.
Minimum Quark Mass
An argument similar to the one given above can be used to estimate the minimum value of the light quark masses to be considered in lattice simulations in order to keep the uncertainty associated with the chiral extrapolation at the required level of precision [5].
In QCD, the dependence of the physical quantities on the light quark masses is predicted by chiral perturbation theory. The chiral expansion involves both analytic (local) and non-analytic terms, the latter being generated by the contribution of pion loops. To keep the argument simple, we neglect in the following the presence of the non-analytic contributions and write the chiral expansion of a given quantity computed on the lattice in the form
| (5) |
where and represent the masses of the pseudoscalar and vector mesons as obtained with the values of the quark masses considered in the simulation ( and at the physical point). The squared mass is proportional to the light quark masses, while provides the typical scale entering the chiral expansion. In this way, the coefficients , , are expected to be of . We are not going to consider that, in most of the cases, these coefficients are actually predicted by chiral perturbation theory, so that one is not forced to estimate their value by fitting the results of the lattice calculation. In this approach, we are providing again an estimate of the error which is presumably conservative.
By performing the calculation at two values of the light quark masses, corresponding to and respectively, and by linearly extrapolating in to the physical point, one introduces an error in the determination of which is given, according to Eq. (5), by
| (6) |
The request of keeping this error at the percent level, i.e. , then provides for the condition . Expressed in terms of the light quark masses, this condition implies that the minimal value of the light quark mass to be considered in the simulation, in units of the physical strange quark mass, is given by
| (7) |
Note that this ratio is still about twice larger than its physical value, . The lightest values of quark masses that have been reached instead in present lattice calculations are about twice larger than that indicated by Eq. (7), namely .
Minimum Box Size
Finite volume effects are important to be kept into account in lattice QCD simulations when aiming at percent accuracy. Since the distortion introduced by a finite box is related to the infrared behaviour of the theory, its effect can be estimated in QCD by using chiral perturbation theory [6]. One finds that, for correlation functions which are free of physical singularities (thus, in particular, for all matrix elements which contain at most one stable particle in the initial and final states) finite size effects are exponentially suppressed. The dominant contribution comes from the propagation of virtual pions and can be expressed as
| (8) |
where is the one-dimensional size of the lattice and the function , which depends on the observable , is typically a quantity of that can be explicitly computed. Assuming and requiring , one gets the requirement
| (9) |
For values of the light quark masses as small as indicated by Eq. (7) the corresponding pion mass turns out to be of the order of 200 MeV. Therefore, the conditions of Eq. (7) and Eq. (9), combined together, imply that the minimum spatial extension of the lattice required to keep finite volume effects at the level of 1% is about
| (10) |
With a lattice spacing of the order of fm, as required by Eq. (4), one also finds that the number of lattice sites in the four space-time directions is about , to be compared with typical lattices of sites used in current simulations.
Treatment of Heavy Quarks
We will realize below that simulations on lattices so fine for the condition to be satisfied will be too expensive even with the PFlop machines that will be presumably available in 2015. Therefore, the treatment of the quark on the lattice will still require one of the dedicated approaches discussed in the previous section: use of effective theories, specific heavy-quark lattice actions or extrapolation of the results obtained in the charm quark mass region to the -quark mass.
In Fig. 2, taken from [7], we show as an example the lattice determination of three parameters relevant for meson mixing. In the plot, the results obtained in correspondence of meson masses around the meson mass are combined with the static (HQET) determination of the same quantities. In this way, the matrix elements of interest, corresponding to the mesons, are reached through an interpolation rather than an extrapolation of the lattice data.
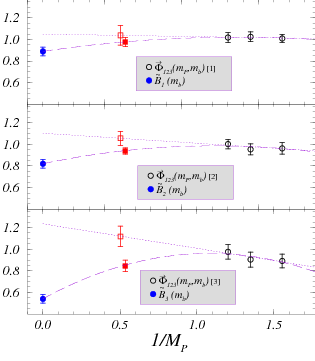
The message that can be learnt from this specific example is that, since the relativistic and static results have comparable precision, the interpolation to the meson mass does not increase significantly the uncertainty. One could also think of further improving the accuracy of the interpolation by computing within the HQET not only the result in the static limit but also the sub-leading contribution, i.e. the slope in the expansion [8].
4 Cost of the Target Simulations
The previous discussion allows to identify the constraints on the relevant parameters of a “target” lattice simulation aiming at the 1% level of precision in the determination of the hadronic matrix elements. These parameters are collected in Table 1, where we consider two different set-ups, the first one for a simulation dedicated to light quark physics only, the second one for a simulation also involving heavy quarks.
| Light quark physics | Heavy quark physics |
|---|---|
| fm | fm |
| fm | fm |
We now estimate the computational cost of the two target simulations indicated in Table 1. An empirical formula can be used, that approximately expresses the CPU cost of a numerical simulation as a function of the simulation parameters: number of independent gauge configurations (), space-time extension of the lattice (), value of the average up-down quark mass () and value of the lattice spacing (). With present algorithms, and for Wilson-like fermions with flavours of dynamical quarks, this formula reads [9] 111 Eq. (11) is based on the study of the DD-HMC (domain decomposition - Hybrid-Monte-Carlo) algorithm. Other recent algorithms, like the HMC with mass preconditioning and multiple time scale integration, provide similar performances.
| (11) |
where the cost, expressed in TFlops-years, represents the number of years of run required to perform the simulation on a 1-TFlop machine. The overall factor, which is 0.03 for standard Wilson fermions, becomes approximately 0.05 for the -improved theory. The cost of a simulation performed with Ginsparg-Wilson fermions (domain wall and overlap), which possess better chiral properties than Wilson fermions, is typically 10-30 times larger than that indicated by Eq. (11).
It is interesting to compare the present cost expressed by Eq. (11) to the analogous formula presented by A.Ukawa at the Lattice 2001 conference [10],
| (12) |
Besides the overall factor which is decreased by a factor 100, and the additional power gained in the dependence on the inverse lattice spacing, the crucial improvement of current algorithms concerns the scaling of the CPU cost with the light quark masses, which is reduced from a dependence to . The predictions of Eq. (12) are shown in Fig. 3 (left plot), where they are also compared with the cost of recent simulations (left and right plots) 222 Since the Lattice 2001 conference was held in Berlin, it has become common, within the lattice community, to refer to the steep increase of the cost with the quark mass as the “Berlin wall”. . This comparison provides an important example of how theoretical and algorithmic developments, which are not taken into account in our analysis aimed to predict the accuracy of lattice QCD calculations for the next years, may actually have a significant impact.
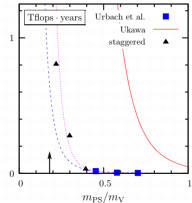
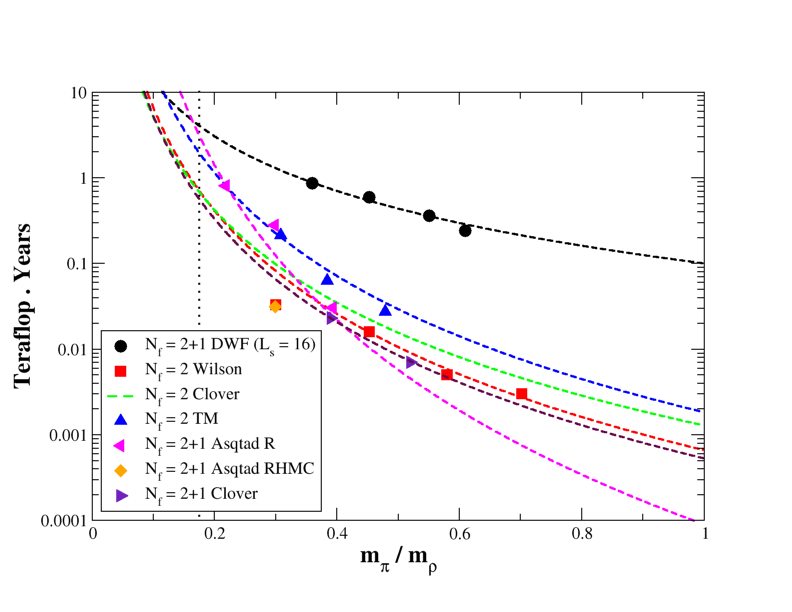
Applying Eq. (11) to the target simulations indicated in Table 1 one finds a cost of about 0.07 PFlop-years for the simulation with light quarks only (left column of table 1) and 0.9 PFlop-years for the simulation involving also heavy quarks. The overhead required to perform the calculation at larger values of quark masses and lattice spacing, necessary to perform the continuum and chiral extrapolations, or to perform simulations with (rather than ) dynamical fermions, can be estimated to be about a factor 3. In both cases, therefore, the expected costs turn out to be safely affordable with the PFlop machines that are expected to be available to lattice QCD collaborations around year 2015, when a Super Factory could be running and producing results. This suggests that the required level of precision on the determination of hadronic parameters can be presumably reached at that time. In the case of the cheaper simulation involving only light quarks, the use of the Ginsparg-Wilson fermionic actions, which would allow to achieve an improved theoretical control on several sources of systematic uncertainty, increases the computational cost of the simulation at the level of 1-2 PFlop-years, which is still within the reach of the PFlop computers.
5 Predicted Accuracy of Lattice QCD Calculations
We conclude the analysis of the estimated accuracy of future lattice QCD calculation by illustrating the differences that should be taken into account when considering, more specifically, the determination of different hadronic parameters.
| Measurement |
|
|
6 TFlops | 60 TFlops |
|
||||||
|---|---|---|---|---|---|---|---|---|---|---|---|
| 0.9 % | 0.7 % | 0.4 % | |||||||||
| 11 % | 5 % | 3 % | 1 % | ||||||||
| 14 % | 3.5-4.5 % | 2.5-4.0 % | 1.0-1.5 % | ||||||||
| 13 % | 4-5 % | 3-4 % | 1-1.5 % | ||||||||
| 5 % | 3 % | 1.5-2 % | 0.5-0.8 % | ||||||||
| 4 % | 2 % | 1.2 % | 0.5 % | ||||||||
| 11 % | 5.5-6.5 % | 4-5 % | 2-3 % | ||||||||
| 13 % | —— | —— | 3-4 % |
A list of observables relevant to studies of flavour physics is collected in the first column of Table 2, together with the corresponding hadronic parameters (second column). In the third column of the table we show the precision currently reached in the lattice QCD determination of these quantities. In the fourth and fifth columns we present the accuracy predicted for future lattice calculations assuming the availability of a computing power of about 6 and 60 TFlops respectively. These estimates have been presented by S. Sharpe [5], on the basis of an error analysis similar to that performed in the present study. Finally, we give in the last column of Table 2 the estimates of the accuracy that is expected to be reached by lattice QCD calculations around year 2015, when computers with performances of 1-10 PFlops should be available to lattice QCD collaborations. Some comments on the estimates given in the table are now in order.
The arguments of the previous sections support the conclusion that an accuracy at the level of 1% can be reached on the lattice in the determination of the simplest quantities. These include decay constants, that are obtained from simple 2-point correlation functions, and parameters, since the latter are extracted from more precise ratios of matrix elements. Thus, in the last column of Table 2 a 1% error is quoted on and somewhat larger uncertainties are predicted for and , which involve a treatment of the quark. The uncertainty on the semileptonic form factors is estimated to be larger by a factor of two with respect to the simplest quantities, both because they are obtained from noisier 3-point (rather than 2-point) correlation functions and because of the uncertainty associated with the study of their momentum dependence. For radiative decays, , an even larger error is estimated, because HQET is of no help in this case in the kinematical region of interest, i.e. close to . On the other hand, the errors on the hadronic parameter and on the form factors of and semileptonic decays will be most likely reduced below 1%, since in these cases one actually measures on the lattice their differences from 1, i.e. the value predicted for these parameters in the SU(3) (for and ) and the infinite heavy quark mass (for ) limits. For instance, the accuracy at the level of 0.1% quoted for corresponds to an uncertainty of about 2.4% on . A slightly larger uncertainty has been quoted for the determination of , because in this case the contribution of corrections is presumably larger than the second order SU(3)-breaking corrections entering the vector form factor of decays.
The entries in the last column of Table 2 are the main result of the present analysis, and can be used to assess the accuracy reachable at Super in the studies of quark flavour physics.
References
- [1] Source: http://www.top500.org/.
- [2] A. X. El-Khadra, A. S. Kronfeld and P. B. Mackenzie, Phys. Rev. D 66, 010001 (2002) [arXiv:hep-lat/9604004].
- [3] S. Aoki, Y. Kuramashi and S. i. Tominaga, Prog. Theor. Phys. 109, 383 (2003) [arXiv:hep-lat/0107009].
- [4] N. H. Christ, M. Li and H. W. Lin, [arXiv:hep-lat/0608006].
- [5] S. Sharpe, talk given at the workshop “Lattice QCD: Present and Future”, Orsay (France), April 14-16, 2004. http://events.lal.in2p3.fr/conferences/lqcd/.
- [6] J. Gasser and H. Leutwyler, Phys. Lett. B 184, 83 (1987).
- [7] D. Becirevic, V. Gimenez, G. Martinelli, M. Papinutto and J. Reyes, JHEP 0204, 025 (2002) [arXiv:hep-lat/0110091].
- [8] J. Heitger and R. Sommer [ALPHA Collaboration], JHEP 0402, 022 (2004) [arXiv:hep-lat/0310035].
- [9] L. Del Debbio, L. Giusti, M. Luscher, R. Petronzio and N. Tantalo, [arXiv:hep-lat/0610059].
- [10] A. Ukawa, CP-PACS and JLQCD, Nucl. Phys. Proc. Suppl. 106, 195 (2002).
- [11] M. A. Clark, [arXiv:hep-lat/0610048].
![[Uncaptioned image]](/html/0709.0451/assets/covers/SuperB_CDR_Back_Cover.png)